 Jiaxing Xin
 Jun Yang
 Ling-en Wang
 Cui Jin1*
 Xiangming Xiao
95% of researchers rate our articles as excellent or good
Learn more about the work of our research integrity team to safeguard the quality of each article we publish.
Find out more
ORIGINAL RESEARCH article
Front. Environ. Sci. , 09 September 2022
Sec. Environmental Informatics and Remote Sensing
Volume 10 - 2022 | https://doi.org/10.3389/fenvs.2022.974811
This article is part of the Research Topic Meta-Scenario Computation for Social-Geographical Sustainability View all 60 articles
Urbanization has been accelerating; hence the effect of urban heat island (UHI) has increased. There has been extensive research on spatiotemporal UHI changes and drivers, however, data on the dominant seasonal factors of UHIs and the differences along urban-rural gradients remain limited. Based on Luojia-1A, Landsat 8, and moderate resolution imaging spectroradiometer (MODIS) data, we assessed the seasonal differences in surface UHI (SUHI), normalized differences in vegetation index (NDVI), built-up index (NDBI), and water index (NDWI) and their relationships in the Dalian City, Northeast China. We found that in the urban built-up area, the mean SUHI intensity (SUHII) decreased from that in summer (2.74°C) > autumn (1.65°C) > winter (0.28°C) > spring (−0.79°C). SUHII was more strongly affected by NDWI and NDBI than NDVI, and NDBI and NDWI showed positive and negative correlations with SUHII in different seasons, while NDVI and SUHII were positively correlated in spring and negatively correlated in the other seasons. When analyzing the dominant factors of SUHII, the importance results showed that, in spring, NDBI > NDVI > NDWI, in autumn, NDVI > NDWI > NDBI, in summer and winter, NDWI > NDVI > NDBI. In addition, SUHII changed the most in summer along the urban-rural gradient, decreasing from 2.74°C to −2.74°C. Among these indicators, except for spring NDVI which increased from 0.09 to 0.59 with distance from built-up areas, there was minimal change in NDVI, NDBI, and NDWI along the urban-rural gradient in other seasons (i.e., all were within 0.2). In this study, the difference analysis of SUHI and remote sensing indices along the urban-rural gradient can help to facilitate the rational layout of cities.
Under rapid global urbanization, the population has shown a surging trend accompanied with the expansion of urban areas, thereby causing a series of ecological environment and climate problems such as urban heat islands (UHIs), extreme climate and heat waves (Manoli et al., 2019; Wang et al., 2021a; Ma et al., 2021b; Smith et al., 2021; Koç et al., 2022; Shi et al., 2022), severely threating human life, health, and safety (Chang et al., 2021; Yao et al., 2021; Yang et al., 2022). UHI refers to a phenomenon whereby the temperature in the suburbs is lower than that in the city center, and has been extensively studied (Wu et al., 2017; Yang et al., 2021b). UHI includes two categories: atmospheric UHI (AUHI) (Tran et al., 2006) and surface UHI (SUHI) (Imhoff et al., 2010; Peng et al., 2012). AUHI is obtained through observation of meteorological stations, whereas SUHI is mainly obtained through remote sensing images obtained via satellite sensors (Zhou et al., 2014a). Compared with the AUHI, SUHI is widely used due to its advantages of easy data acquisition and spatial continuity (Kim and Brown, 2021).
A key in SUHI research is the calculation of land surface temperature (LST). At present, the LST calculations are mainly obtained by inversion of the thermal infrared band of satellites; common data sources include Landsat (Yang et al., 2021c; Kamali Maskooni et al., 2021; Najafzadeh et al., 2021; Carrillo-Niquete et al., 2022) and moderate resolution imaging spectroradiometer (MODIS) (Li et al., 2020; Mohammad and Goswami, 2021a; Niu et al., 2021). The lower resolution of MODIS data is more suitable for mesoscale research, whereas the resolution of Landsat data is 30 m, more suitable for urban scale research. Therefore, this study calculated LST based on Landsat 8 data. SUHI intensity (SUHII) refers to the temperature difference between urban and rural areas, and the definition of urban-rural boundaries is the key to SUHI research. At present, there is no unified standard for the definition of the urban-rural boundary, hence new SUHII calculation methods are constantly being proposed of which the most commonly used are the urban-rural dichotomy, mean—standard deviation, positive planning, and normalization methods (Shastri et al., 2017; Liu et al., 2021b; Hsu et al., 2021; Morabito et al., 2021). When calculating SUHII using the urban-rural dichotomy, urban area mainly refers to the area covered by actual urban construction land. The built-up area extraction methods are roughly divided into three types: One is to extract built-up areas by classifying the spectral features of high-resolution satellite images; the second is to use night light data as the data source to obtain the best threshold through a series of methods and extract the built-up area by binarization according to the threshold; the third is to combine night light and high-resolution remote sensing data to extract built-up areas. The most widely used data source is night light data, from which the best threshold is obtained, following which the urban built-up area is then extracted. Night light data are mainly Defense Meteorological Satellite Program/Operational Linescan System DMSP/OLS and National Polar-orbiting Partnership/Visible Infrared Imaging Radiometer NPP-VIIRS (Zhou et al., 2014b; Yang et al., 2021a; Li et al., 2021); however, their spatial resolutions are low, i.e., 1,000 m and 500 m, respectively. The Luojia-1 satellite (Luojia-1A) launched by China in 2018 has efficiently addressed this problem (Jun et al., 2021), where its spatial resolution reaches 130 m; therefore, this study extracted built-up areas based on the Luojia-1A satellite. However, the definition of suburban backgrounds remains controversial. Most scholars have obtained suburbs by establishing buffer zones with built-up areas as boundaries. The buffer zone can be the same area or 150% of the urban area calculated according to the size of the city (Peng et al., 2012; Meng et al., 2018; Feng et al., 2021), and can be a buffer distance of approximately 0–25 km from the urban built-up area (Dewan et al., 2021; Yao et al., 2021; Li et al., 2022). In the selection of the suburban background, this study referred to the definition method based on the buffer zone of Yao et al. (2021), Yao et al. (2018), and Li et al. (2022), by establishing a buffer zone with the built-up area as the boundary to determine the suburban background. Due to the unique shape of the administrative boundary of the Dalian City, in this study, we selected the 10-km range as the suburb.
In SUHI research, in addition to the spatiotemporal evolution of SUHI, research on the influencing factors has been the primary focus of several studies (Wang et al., 2021b; Erdem et al., 2021; Niu et al., 2021; Zhang et al., 2021; Ren et al., 2022). Blue-green space, building roof materials, building density, building height, vegetation coverage, and urban ventilation are all driving factors of SUHI (Guo et al., 2020; Yang et al., 2020; Hu et al., 2021b; Deliry et al., 2021; Luo et al., 2021; Ma and Peng, 2022). The research angle is divided into several aspects, such as land-use type, surface biophysical conditions, landscape pattern, human activities, meteorological conditions and geographical location, and policy elements. In addition, there may be differences in the dominance of SUHI by different influencing factors in different seasons. For example, Mohammad and Goswami (2021a) quantified the daily, seasonal, and inter-annual SUHII of 150 major Indian cities located in different climate zones based on MODIS data. The study found differences in SUHI, in addition to the leading roles of different influencing factors in winter and summer. However, studies have been conducted on the dominant drivers of seasonal SUHI, which showed differences in different gradients between urban and rural areas (Ma et al., 2021a; Mohammad and Goswami, 2021b; Ma and Peng, 2022), but this has received little attention. Therefore, this study not only assessed the seasonal differences of SUHII and its dominant factors, but also analyzed the differences of the dominant factors of SUHII along the urban-rural gradient.
We considered the Dalian City, Northeast China, as a case study and extracted urban built-up areas based on Landsat 8, digital elevation model (DEM), Luojia-1A night light, and other data. We established a buffer zone within 10 km outside the built-up area (defined as suburbs), and calculated SUHII, normalized differences in vegetation index (NDVI), built-up index (NDBI), and water index (NDWI), and the difference in SUHI, NDVI, NDBI, and NDWI along ‒the urban-rural gradient. Meanwhile, we analyzed the differences in SUHII by the dominant factors in different seasons. This study investigated the seasonal differences in SUHI and various remote sensing indices and the dominant factors of SUHI. The differences in SUHI along the urban-rural gradient were also studied, which provides an important reference for SUHI mitigation strategies and rational urban layout.
The Dalian City is located in the southern area of the Liaodong Peninsula, Northeast China, between 38°43′–40°12′N and 120°58′–123°31′E, and has jurisdiction over seven municipal districts and one county and manages two county-level cities. The terrain is high and wide in the north, and low and narrow in the south (Figure 1). The total land area of the city is approximately 12,574 km2, of which the urban area is approximately 2,414.96 km2, and the counties (cities) under its jurisdiction cover an area of approximately 10,158.89 km2.
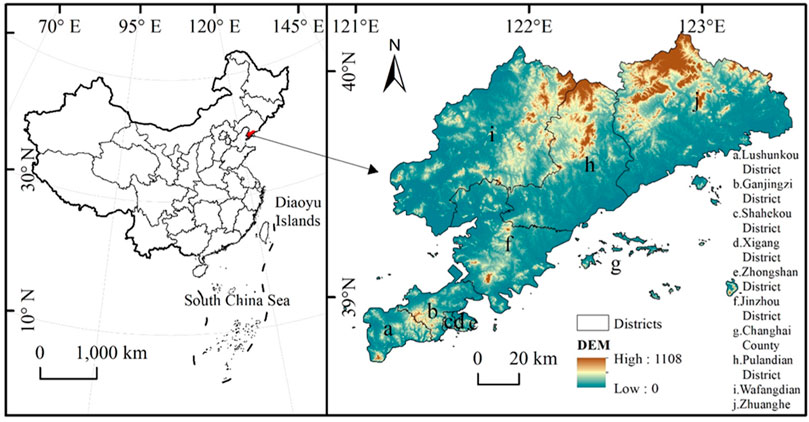
FIGURE 1. Study area location. DEM—digital elevation model.
The data used in this study included Landsat eight OLI/TIRS, Luojia-1A night light, statistical yearbook, MODIS, and administrative division data. Table 1 lists data sources, preprocessing process, and detailed descriptions.
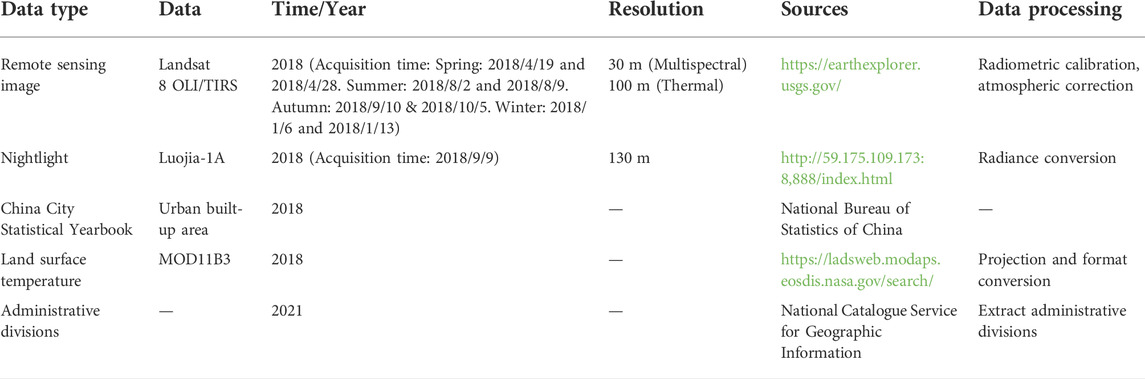
TABLE 1. Data sources and descriptions.
Development of urbanization leads to the conversion of a large amount of natural land to anthropogenic land, thereby changing urban surface cover, such as reductions in vegetation and increases in urban impervious surfaces, thus changes urban surface heat absorption, ultimately leadings to the UHI effect. To study the seasonal variation of SUHI and its relationship with vegetation cover, water body, bare soil, and impervious surfaces (Koko et al., 2021), we used NDVI, NDBI, and NDWI, the specific calculation formulas for which are as follows:
Where, NIR, Red, and SWIR represent the near-infrared band, the red band, and the mid-infrared band, respectively, corresponding to the fourth, fifth, and sixth bands of the Landsat eight OLI data, respectively.
The better the quality of remote sensing images, the higher the accuracy of LST inversion results. Therefore, in this study, images with minimal precipitation, sunny and minimal cloudy (<5% cloud cover) weather were selected in the corresponding time range. We then referred to the single-window algorithm proposed by Qin et al. (2001), and to Hu et al. (2015) to calculate LST using Landsat eight band10 data, the formulas are as follows:
Where,
The LST difference between the urban and rural is defined as the SUHII (Zhao et al., 2021), Urban areas were obtained based on night light data, while rural areas were obtained after buffer zones for urban areas have been established.
In researching the extraction of built-up areas, the determination of the optimal threshold for nighttime light data has been challenging. Various methods have been proposed such as mutation detection, empirical threshold, and higher-resolution data comparison methods (Jun et al., 2021; Zhang et al., 2022), each of which has its own limitations. The mutation detection method does not consider the regional differences in urban development; the empirical threshold and higher-resolution data comparison methods are highly subjective and the results obtained by different studies often differ. To this end, this study referred to the extraction method of Liu et al. (2021c), combined the brightness and texture information of night lights to perform object-oriented segmentation, and comprehensively extracted the built-up area.
First, we performed object-oriented multi-scale segmentation on the night light data after reprojection and resampling. On the premise of ensuring the minimum mean heterogeneity between objects and the maximum homogeneity between pixels within the object, image segmentation was performed based on the region merging technology using the brightness and texture features of the image. We then calculated the mean brightness value and area of each object following segmentation. Zhou et al. (2014b) comprehensively considered and verified the influence of the area and mean brightness of different areas on the extraction threshold of built-up areas during their study on the extraction of built-up areas from night light data. We used the area and mean brightness of different objects to construct the built-up area index X of night lights as a standard to measure the probability of each object being a built-up area. The formula for X is:
Where, Area is the area size of each object and
Where, the X value
We consulted relevant literature and found that the accuracy verification of built-up area extraction is mainly through the method of creating random points, based on the Google Earth high-definition map combined with visual interpretation to determine the proportion of valid points (correct division) (He et al., 2021). Therefore, we adopted ArcGIS Create Random Point Tool, created 200 random points, counted the number of valid points, and calculated the proportion of valid points as the overall accuracy.
We also considered 10 km outside the built-up area as the suburban boundary, combined with the unique geographical location of Dalian City and the LST results obtained from Landsat eight data inversion, and used the ArcGIS 10.4 raster calculator tool to determine the difference between the LST of the study area and the mean LST of the suburbs to obtain SUHII. The calculation formula is as follows:
Where,
In this study, a multi-level buffer zone was established with the urban area as the boundary (Implemented with Multiple Ring Buffers tool of ArcGIS), and a total of 10 multi-level buffer zones were established as the urban-rural gradient with an interval of 1 km, which was how we calculated the urban-rural gradient.
Bivariate correlation analysis involves two or more variables. Since the data here do not obey the normal distribution, we used SPSS 24.0 software to select the Spearman correlation coefficient to study the responses of SUHII to various remote sensing indices. The calculation formula is as follows:
Where,
To further analyze the importance of each influencing factor of SUHII, we used the Random Tree model in IBM SPSS Modeler 18.0 software for modeling (Joloudari et al., 2020; Nhu et al., 2020), using default parameters for modeling, taking SUHII as the target value, and obtained the importance of predictor variables of NDVI, NDBI, and NDWI.
We calculated the built-up area extracted from the night light data and compared it with the statistical yearbook. Since the total calculated area of the built-up area was infinite approximation to built-up area values recorded in statistical yearbook when the light threshold was set for the extraction of the built-up area, the mean deviation and the standard deviation were 0.0054 and 0.0076, respectively. In order to verify the accuracy of the spatial distribution, we adopted ArcGIS Create Random Point Tool, created 200 random points, using Google Earth historical image, we found that 186 random points were correctly classified, and the overall accuracy reached 0.93. The visualization of the extraction results of built-up areas through ArcGIS is shown in Figure 2. Built-up areas were mainly gathered in the Zhongshan, Xigang, Shahekou, Ganjingzi, and Jinzhou districts, and they were less distributed in the Lushunkou District, Pulandian District, Wafangdian City, and Zhuanghe City.

FIGURE 2. Extraction result of built-up area.
In this study, the LST inversion results were verified before calculation of SUHII. Due to the lack of public weather station data in Dalian City, we referred to Arabi Aliabad et al. (2021) and Jiang and Lin. (2021) using MODIS data for verification. Since this study investigated seasonal differences, we selected the monthly mean LST data (MOD11B3) and 1,000 random points through ArcGIS software (MOD11B3 was resampled to 30 m), tested the LST results of the Landsat thermal infrared inversion after the

TABLE 2. Comparison of LST accuracy with
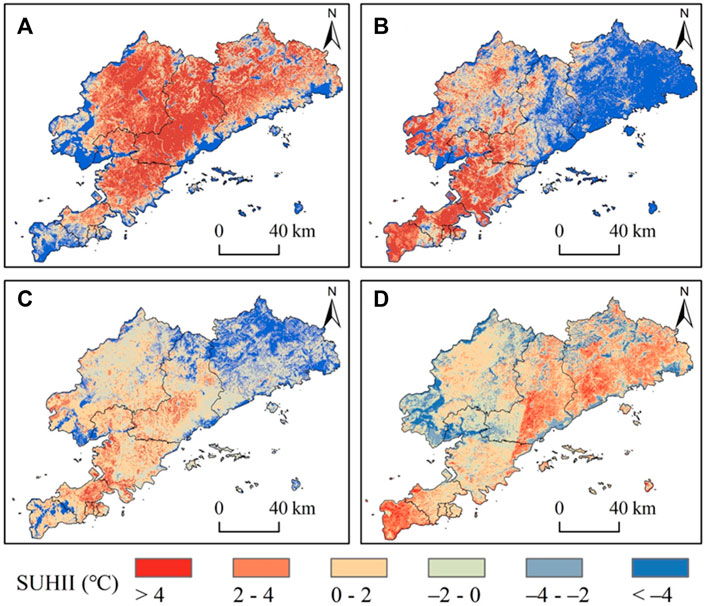
FIGURE 3. Surface urban heat island (SUHII) intensity spatial distribution map in: (A) spring, (B) summer, (C) autumn, and (D) winter.
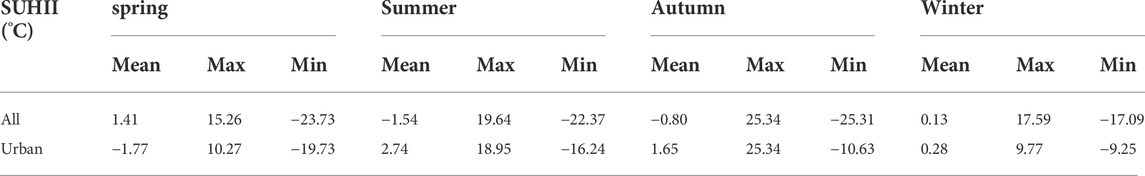
TABLE 3. SUHII varies in different seasons.
Table 4 shows that, overall, NDBI and SUHII positively correlated with NDWI, while SUHII showed negative correlations in all four seasons, whereas NDVI showed positive correlation in spring but negative correlations in summer, autumn and winter. Buildings enhanced UHI and water weakened UHI, whereas vegetation enhanced UHI in spring and weakened UHI in summer, autumn and winter. Specifically, in spring, the correlation coefficients of NDVI, NDBI, NDWI, and SUHII were 0.42, 0.43, and –0.60, respectively, indicating that in spring, SUHII was more affected by water, followed by buildings and vegetation. In summer, the correlation coefficients of NDVI, NDBI, NDWI, and SUHII were −0.18, 0.44, and −0.56, respectively, indicating that in summer, SUHII was also more affected by water, followed by buildings, and that vegetation had the smallest effect. In autumn, the correlation coefficients of NDVI, NDBI, NDWI, and SUHII were −0.25, 0.59, and −0.59, respectively, indicating that in autumn, SUHII was more affected by water and buildings, and less affected by vegetation. In winter, the correlation coefficients of NDVI, NDBI, NDWI, and SUHII were −0.02, 0.33, and −0.33, respectively, indicating that in winter, SUHII was also more affected by water and buildings, and less by vegetation.
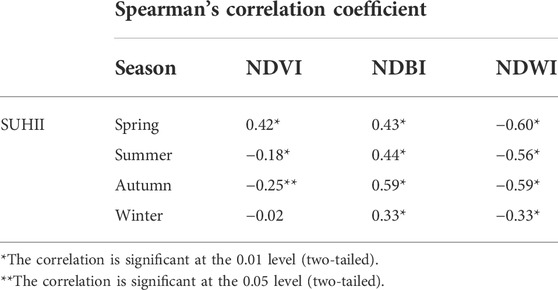
TABLE 4. Correlation between NDVI, NDBI, NDWI, and SUHII in different seasons.
The importance of each predictor variable is shown in Figure 4. In spring, the contribution of NDBI was the largest, followed by NDVI, and the smallest was NDWI; while in summer and winter, the contribution of NDWI was the largest, followed by NDVI; in autumn, NDVI contributed the most, followed by NDWI.
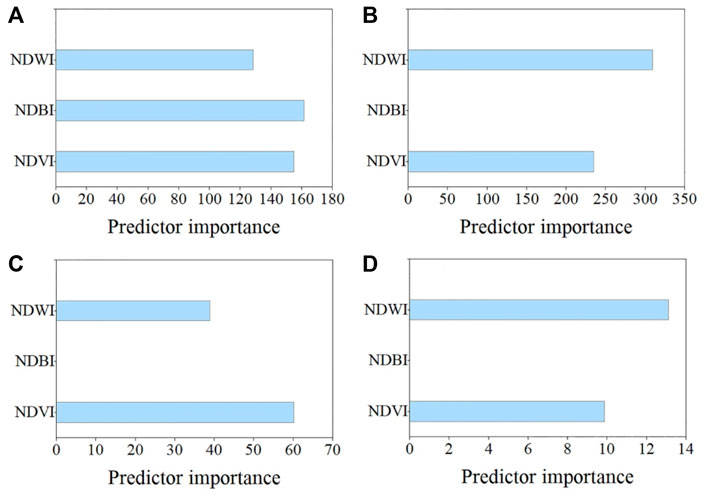
FIGURE 4. The importance of each predictor variable in: (A) spring, (B) summer, (C) autumn, and (D) winter. The predictor values refers to the importance and contribution of NDVI, NDBI, and NDWI.
Variation trends of SUHII, NDVI, NDBI, and NDWI along the urban-rural gradient in different seasons.
The mean SUHI, NDVI, NDBI, and NDWI outside the built-up area 0–10 km range (1 km interval, The distance map from the built-up area was shown in Figure 5) were calculated separately via ArcGIS; the results are shown in Figure 6. SUHII decreased along the urban-rural gradient in summer and autumn. The change was the largest in summer (2.74 to −2.74°C) and that in spring was relatively small (−1 to 1°C); whereas, in winter, along the urban-rural gradient, SUHII showed a trend of first decreasing and then increasing, with an overall increase of 0.50°C. When far from the built-up area, NDVI showed an increasing trend in spring, summer, and autumn (0.09–0.59, 0.32 to 0.59, and 0.29 to 0.44, respectively), and decreased in winter, with a small decrease from 0.24 to 0.20. When far from the built-up area, NDBI showed an increasing trend in winter, while NDBI in summer showed a decreasing trend along the urban-rural gradient, but the variation range was not large (around 0.1), and there was minimal change in NDBI along the urban-rural gradient in spring and autumn. For NDWI, there was little change in spring and autumn, a large change in summer (an increase from 0.12 to 0.26 along the urban-rural gradient), and the change in winter was relatively small and decreased when far from the built-up area (from 0.09 to −0.05).
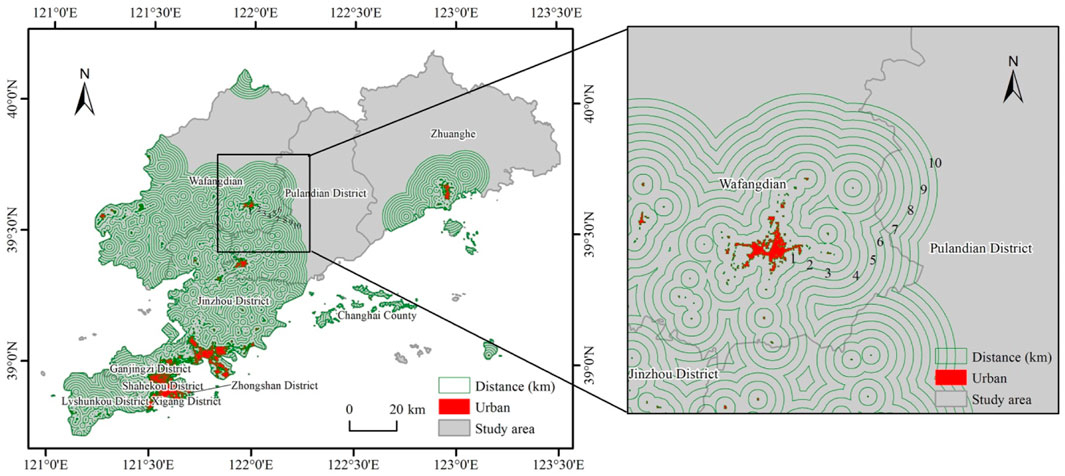
FIGURE 5. Buffer map of distance from built-up area. Distance represents that from the built-up area, in km.
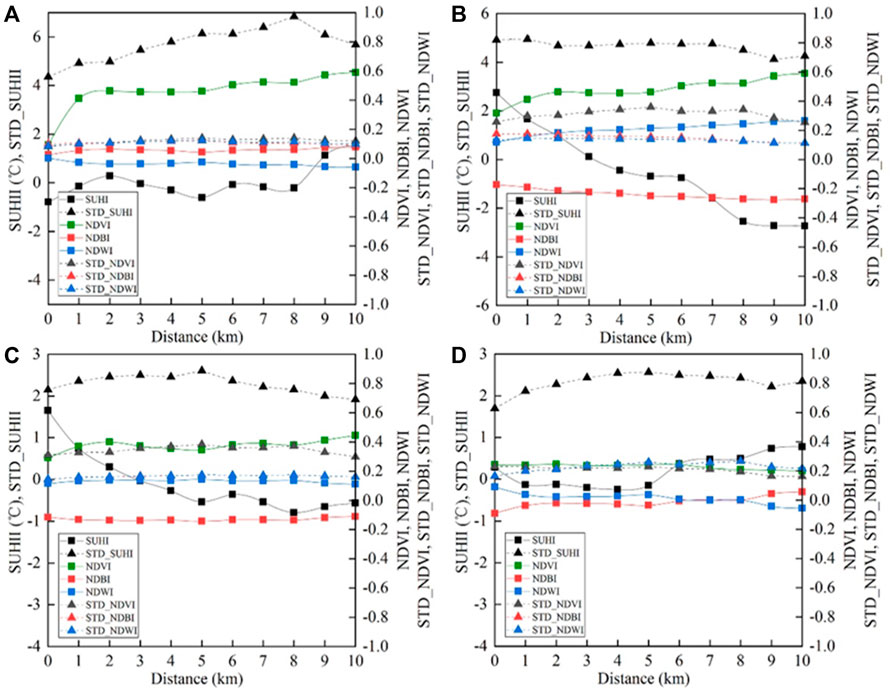
FIGURE 6. Variations of surface urban heat island (SUHII), normalized difference vegetation index (NDVI), normalized difference built-up index (NDBI), and normalized difference water index (NDWI) along the urban-rural gradient in: (A) spring, (B) summer, (C) autumn, and (D) winter. Distance represents that from the built-up area, in km.
To further study the changes of SUHII, NDVI, NDBI, and NDWI along the urban-rural gradient, we calculated ΔSUHII, ΔNDVI, ΔNDBI, and ΔNDWI (The mean SUHII, NDVI, NDBI, and NDWI in built-up area minus the mean SUHII, NDVI, NDBI, and NDWI values of different urban-rural gradient zones), the change values of SUHII, NDVI, NDBI, and NDWI, and the relationship between ΔSUHII, ΔNDVI, ΔNDBI, and ΔNDWI with the urban-rural gradient (Figure 7). The results showed that for ΔSUHII, in summer and autumn, ΔSUHII is positively correlated with the urban-rural gradient, with correlation coefficients of 0.498 and 0.139, respectively, indicating that the greater the distance from the built-up area, the greater the ΔSUHII, while in spring and winter, ΔSUHII was negatively correlated with the urban-rural gradient, with correlation coefficients of −0.128 and −0.124, respectively, indicating that the greater the distance from the built-up area, the smaller the ΔSUHII. For ΔNDVI, in spring, summer and autumn, ΔNDVI was negatively correlated with the urban-rural gradient, with correlation coefficients of−0.018, −0.080, and −0.006, respectively, indicating that the greater the distance from the built-up area, the smaller the ΔNDVI, but the change trend was not large, while in winter, there was a positive correlation between ΔNDVI and the urban-rural gradient, and the correlation coefficient was 0.005, which also showed that the variation trend of ΔNDVI along the urban-rural gradient was small. For ΔNDBI, in spring, autumn and winter, ΔNDBI had a negative correlation with the urban-rural gradient, and the correlation coefficients were all very small, which were −0.001, −0.002, and −0.009, respectively, while in winter, there was a positive correlation between ΔNDBI and the urban-rural gradient, with correlation coefficient of 0.023, indicating that the variation of ΔNDBI along the urban-rural gradient was still small. For ΔNDWI, in spring, autumn and winter, ΔNDWI had a positive correlation with the urban-rural gradient, and the correlation coefficient was very small, 0.003, 0.002, and 0.009, respectively, while in summer, ΔNDWI was negatively correlated with the urban-rural gradient, and the correlation coefficient was −0.038, indicating that ΔNDWI also changed little along the urban-rural gradient.
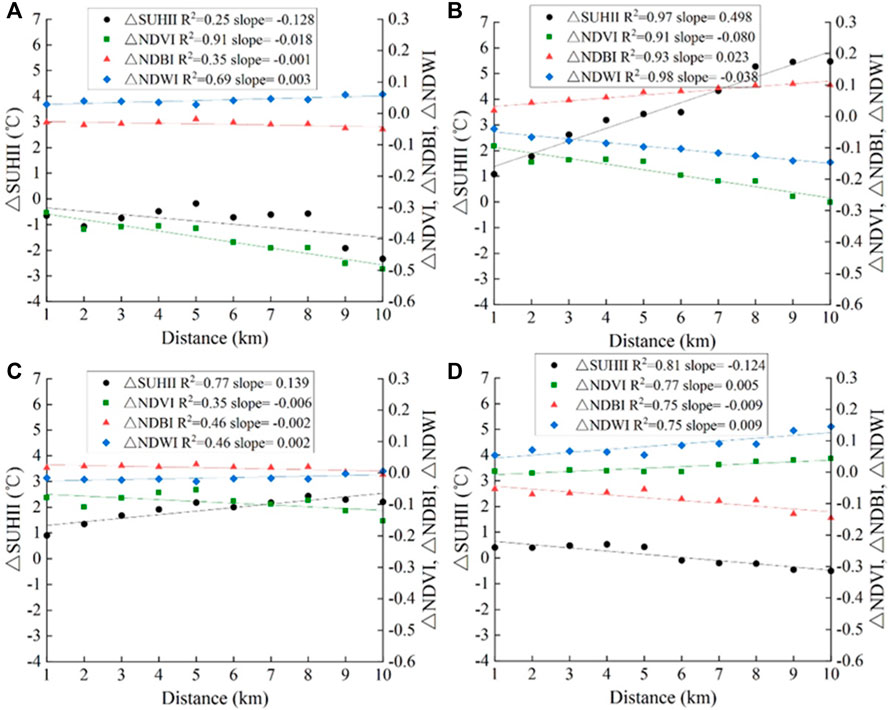
FIGURE 7. Correlation between ∆SUHII, ∆NDVI, ∆NDBI, and ∆NDWI, and the distance from the built-up area in: (A) spring, (B) summer, (C) autumn, and (D) winter. Distance represents that from the built-up area, in km.
At present, most night light data selected for the extraction of built-up areas are DMSP/OLS and NPP-VIIRS (Yu et al., 2021; Zheng et al., 2021), which have low spatial resolution. However, the Luojia-1A data used in this study had a spatial resolution of 130 m, and studies have showed that Luojia-1A data was more sensitive in detecting new emerging urban built-up areas, which can better reflect the spatial structure of urban system and achieve a higher extraction accuracy (Li et al., 2018; Hu et al., 2021b; Wang and Shen, 2021). In addition, this study adopted an object-oriented segmentation method for determining the optimal threshold. Comparing the built-up area data in the statistical yearbook, the mean deviation and standard deviation of the two were 0.0054 and 0.0076, respectively, which greatly improved the accuracy of the built-up area extraction.
Recently, the UHI effect has attracted much attention with the acceleration of urbanization. With the continuous improvement of remote sensing technology, many scholars have begun to explore the spatiotemporal changes, impact mechanisms, and mitigation strategies of SUHI (Cosgrove and Berkelhammer, 2018; Zhang, 2020;Liu et al., 2021a; Schwaab et al., 2021). To explore the relationship between SUHI and vegetation, water, bare soil, and impervious surface, three indices (NDVI, NDBI, and NDWI) were selected to analyze the seasonal differences in SUHII and the relationships among them. To further study the differences of dominant role of SUHII along the urban-rural gradient, this study used ArcGIS software to create fishnet (the rectangular cells) of 300 m, intersected the fishnet with the urban-rural gradient, and counted the values of SUHII, NDVI, NDBI, and NDWI corresponding to each fishnet, Finally, each fishnet was selected according to the urban-rural gradient, and the correlation between SUHII and NDVI, NDBI, and NDWI was calculated by SPSS 24.0 software. The correlations between SUHII and NDVI, NDBI, and NDWI at different distances were shown in Table 5. Overall, the correlations between NDBI, NDWI, and SUHII were significant, and NDBI and SUHII showed a positive correlation regardless of the season. NDWI and SUHII showed a negative correlation; whereas, for NDVI, 52.4% showed a negative correlation with SUHII, most of which occurred in summer and autumn, 47.6% showed a positive correlation, and 25% showed a non-significant correlation. Specifically, most within the range of 0–10 km from the built-up area, the dominant factor of SUHII changes was partially consistent with the analysis results. That is, in spring and summer, SUHII was more affected by water, followed by buildings, and less affected by vegetation; whereas, in autumn and winter, SUHII was more affected by water and building, and less affected by vegetation. However, in summer within 4 and 5 km and in spring within 6 km from the built-up area, SUHII was more affected by buildings (−0.47, −0.53, and 0.60 respectively) than water and vegetation, and the effect of water (−0.45, −0.45, and −0.60, respectively) was higher than that of vegetation (−0.06, 0.05, and 0.44, respectively). In autumn within 7 km from the built-up area, SUHII was mostly affected by vegetation (correlation coefficient of 0.37) followed by water and buildings (correlation coefficients of 0.28 and −0.28, respectively). In spring within 8 and 9 km and in summer within 10 km, from the built-up area, the correlations between vegetation and SUHII were higher than those between buildings and water. In other urban-rural gradients in different seasons, the dominant factors of SUHII changes were consistent with the overall conclusions in the results analysis. In addition, NDVI correlation with SUHII showed a trend of first increasing and then decreasing along the urban-rural gradient in spring, while in summer showed a trend of first decreasing and then increasing, in autumn, except for 0, 6 and 10 km from the built-up area, the absolute value of the correlation coefficient was basically stable between 0 and 0.2, and in winter, the correlation coefficient was basically stable between 0 and 0.2. For NDBI, its correlation with SUHII showed a trend of first increasing and then decreasing in spring along the urban-rural gradient and the inflection point was within 5 km from the built-up area, in summer, there was a trend of fluctuation and decline, and the inflection point was also within 5 km from the built-up area, in autumn, the correlation coefficient with SUHII was basically stable at approximately 0.6, except for the significantly low value within 6 km from the built-up area, and in winter, there was a fluctuating upward trend, and the maximum correlation coefficient appeared within 6 km from the built-up area. NDWI correlation with SUHII along the urban-rural gradient showed a minimum value in spring except for 6 km away from the built-up area, and the absolute value of the remaining correlation coefficients was stable between 0.5 and 0.7, while in summer showed a trend of rising after fluctuation and decline and the inflection point was 6 km away from the built-up area, and in autumn and winter, its changing trend was the same as that of NDBI. Therefore, the correlations between NDVI, NDBI, and NDWI and SUHII showed significant differences along the urban-rural gradient, and the main inflection point was within 5–6 km from the built-up area. Hence, for future urbanization construction, the urban layout can be reasonably planned with reference to the role of different land use types on SUHI. However, our study have not conducted in-depth research on the reasons for this difference, and the effects of other factors such as land cover and landscape pattern should also be considered in future studies.
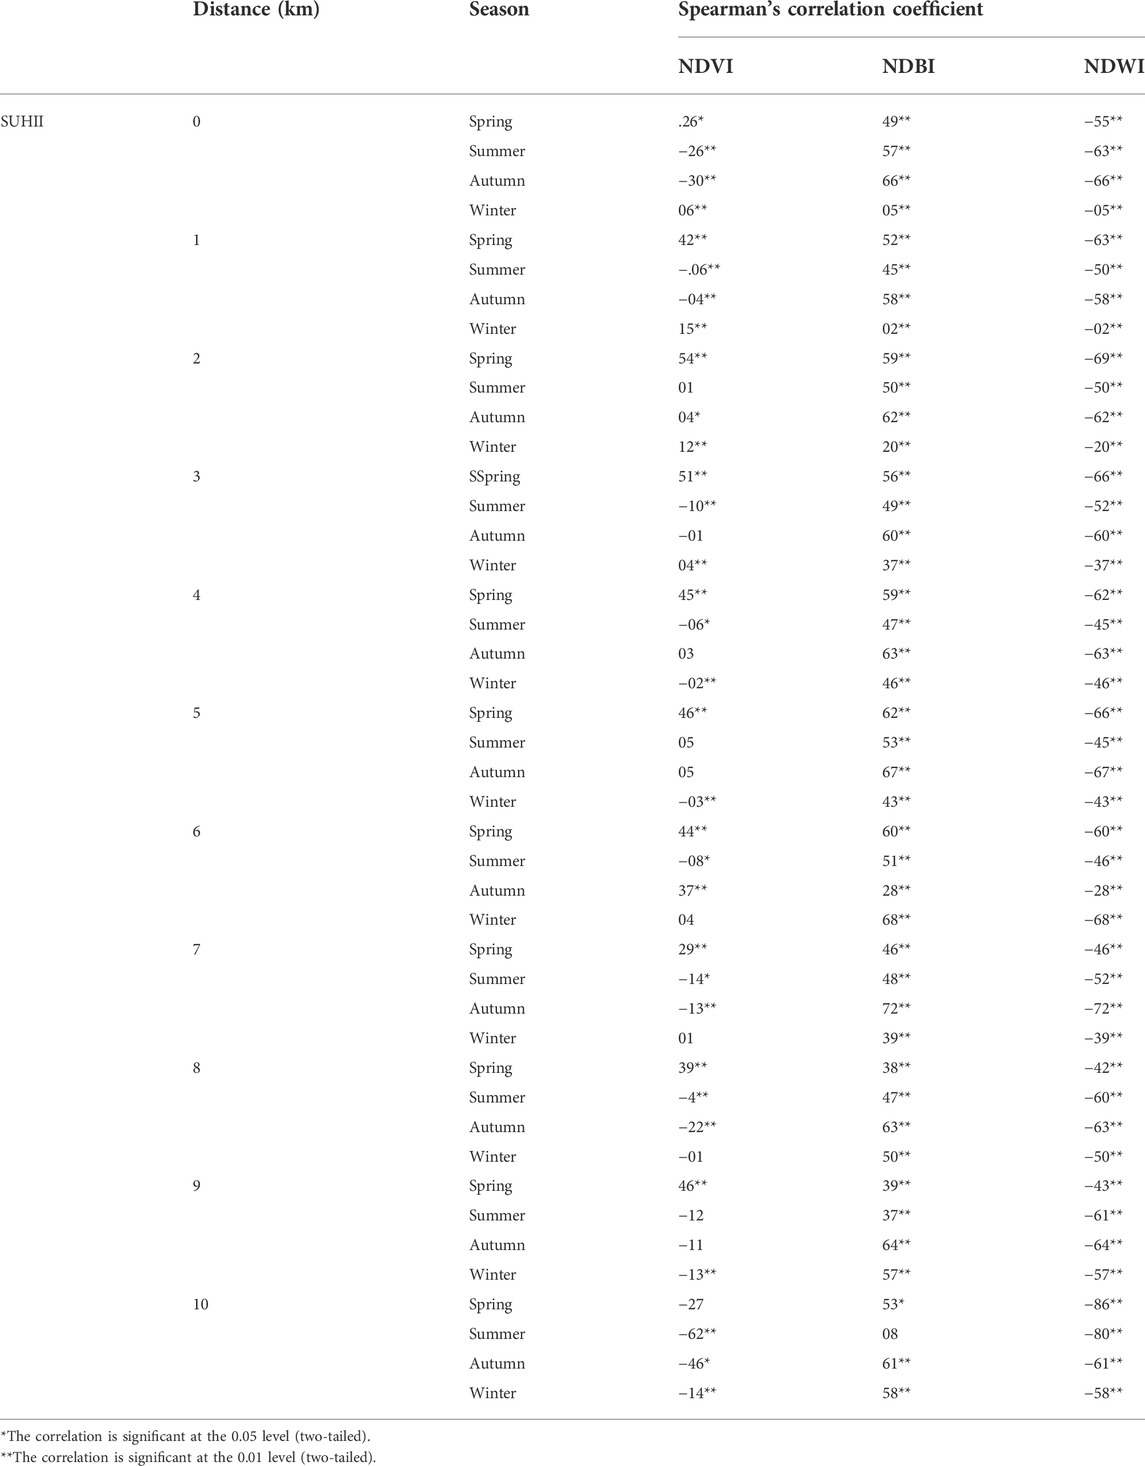
TABLE 5. The correlation between SUHII and NDVI, NDBI, and NDWI on the urban-rural gradient in different seasons.
In Distance, 0 represents the built-up area, 1–10 represent the distance from the built-up area, and in km.
The results of the importance of each variable (Figures 8, 9) showed that: in spring, within 0, and 6 km from the built-up area, NDWI was more important, followed by NDVI; at 7 and 8 km, NDBI was more important, followed by NDVI, at 10 km, NDBI contributed more, followed by NDVI, at 3, 4, 5, and 9 km, the importance result was NDVI > NDBI > NDWI, at 1 km, the importance result was NDVI > NDWI > NDBI, at 2 km, the importance result was NDBI > NDVI > NDWI. In summer and autumn, NDWI and NDVI contribute greatly, and in 63.6% of cases, NDWI contributed more; in winter, only at 10 km, the influence of NDBI was greater, followed by NDVI, while the rest of the gradients were mainly contributed by NDVI and NDWI. The cases where NDVI and NDWI were the most contributing variables accounted for 50% each.
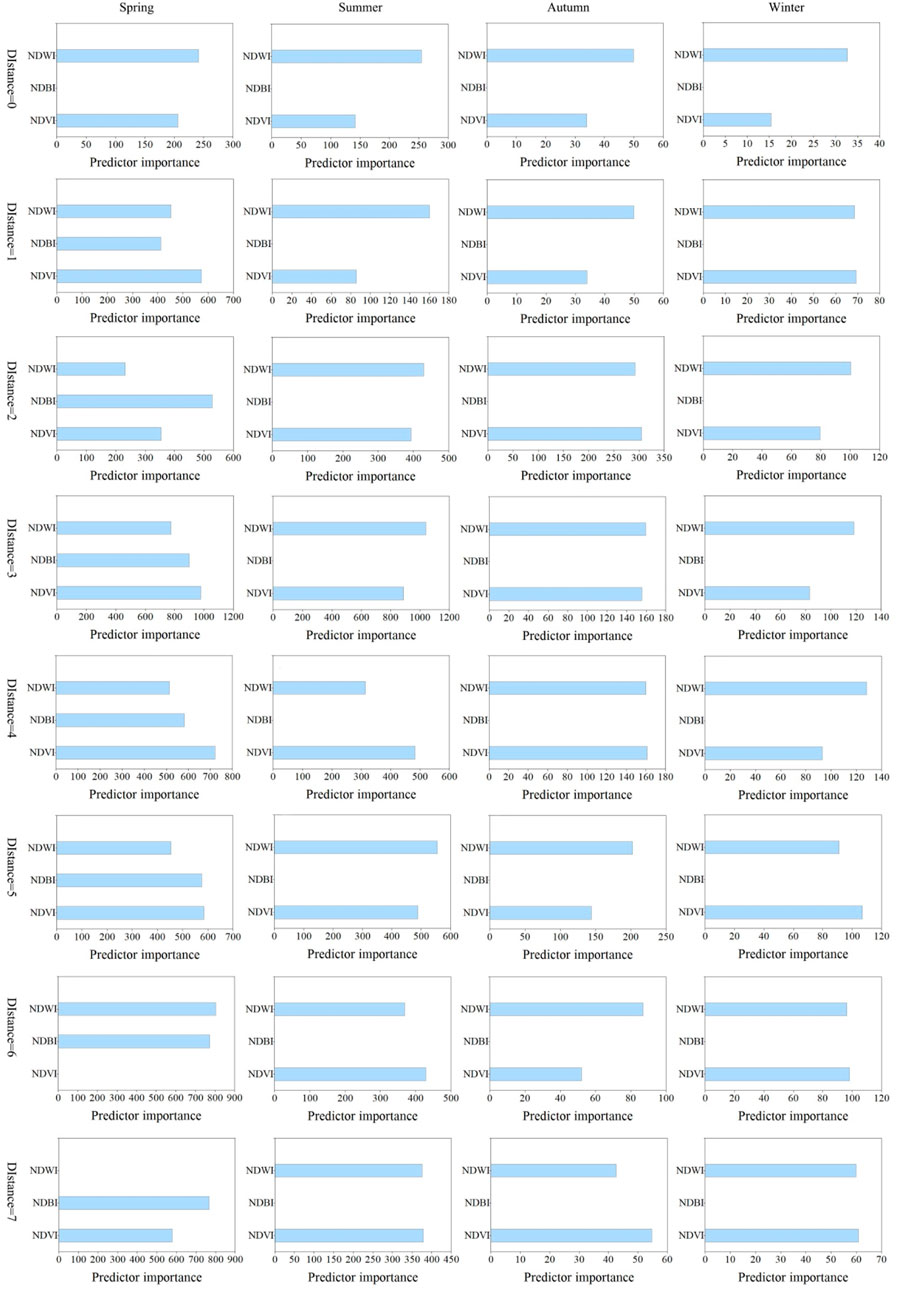
FIGURE 8. The importance of each predictor variable in different seasons. Distance represents that from the built-up area, in km. The predictor values refers to the importance and contribution of NDVI, NDBI, and NDWI.
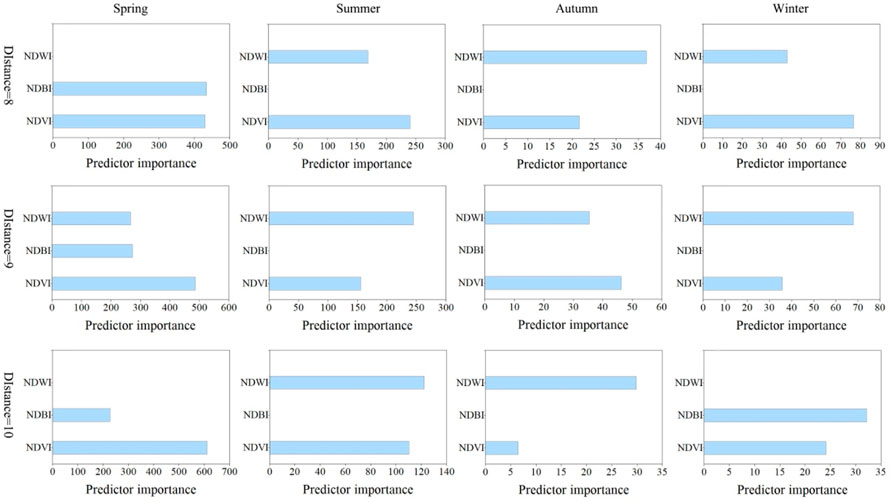
FIGURE 9. The importance of each predictor variable in different seasons. Distance represents that from the built-up area, in km. The predictor values refers to the importance and contribution of NDVI, NDBI, and NDWI.
Although many studies have assessed the influencing factors of SUHI, most have focused more on the simple correlation between SUHI and various factors (Li and Zhou, 2019; Varentsov et al., 2021; Liu et al., 2022), and have not conducted in-depth research on the contribution of each factor (Xiong et al., 2022). NDVI, NDBI, and NDWI do not always show strong importance in different seasons and different gradients in this paper, which has important reference significance for understanding the influencing factors of SUHI.
This study analyzed the seasonal differences of SUHII and its dominant factors in different seasons. In addition, the changes in SUHII, NDVI, NDBI, and NDWI in different urban‒rural gradients were analyzed, which provided an important insights into mechanism of SUHII and identifying appropriate mitigation strategies. However, this study has some limitations. In the extraction of built-up areas, we used Luojia-1A data, and the resolution was increased to 130 m. However, the resolution was still not sufficiently high, hence higher-precision data should be considered for cross-extraction in the future. Secondly, due to the long-term revisit period of the Landsat data, only one period of seasonal data in the study area could be selected for analysis, and data with higher temporal resolution should be considered for research in the future. Finally, since the Landsat data were only from the daytime, this study only considered seasonal differences, and hence diurnal differences should be considered in the future.
Since the beginning of the 21st century, China's urbanization process has accelerated, especially in coastal cities. As a typical coastal city in the Liaoning Province, Dalian City has experienced a surge in urban population and a significant UHI effect. Based on Luojia-1A, statistical yearbook, and Landsat eight remote sensing image data, this study analyzed the seasonal differences in SUHI and remote sensing indices along the urban-rural gradient. The conclusions were as follows:
The SUHII differed among seasons. In the urban built-up area, the mean SUHI intensity (SUHII) decreased from that in summer (2.74°C) > autumn (1.65°C) > winter (0.28°C) > spring (−0.79°C), while the maximum (25.34°C) and minimum (−19.73°C) SUHII values appeared in autumn and spring, respectively.
Overall, NDBI and SUHII showed positive correlations, while NDWI and SUHII showed negative correlations in all seasons. Whereas, NDVI showed positive correlations in spring, but negative correlations in summer, autumn and winter. In all seasons, buildings enhanced UHI, while water weakened UHI, whereas vegetation enhanced UHI in winter and spring and weakened UHI in summer and autumn.
SUHII, NDVI, NDBI, and NDWI showed differences along the urban-rural gradient. In summer and autumn, SUHII decreased along the urban-rural gradient, with the largest change in summer (2.74°C to −2.74°C), while that in spring was lower (−1 and 1°C). In winter, SUHII showed a trend of first decreasing and then increasing with an increase along the urban-rural gradient, with an overall increase of 0.50°C. Except in spring, NDVI increased from 0.09 to 0.59 with an increase in the distance from built-up areas. In other seasons, NDVI, NDBI, and NDWI remote sensing indices changed little along the urban-rural gradient and were all within 0.2.
The original contributions presented in the study are included in the article/supplementary material, further inquiries can be directed to the corresponding authors.
JY contributed to all aspects of this work, JX wrote the main manuscript text. L-EW, CJ, XX, and JX conducted the experiment and analyzed the data. All authors reviewed the manuscript.
This research study was supported by the National Natural Science Foundation of China (Grant Nos 41771178, 42030409), the Fundamental Research Funds for the Central Universities (Grant No. N2111003), Basic Scientific Research Project (Key Project) of the Education Department of Liaoning Province (Grant No. LJKZ0964), the Second Tibetan Plateau Scientific Expedition and Research Program (STEP) (Grant No. 2019QZKK1004), and Innovative Talents Support Program of Liaoning Province (Grant No. LR2017017).
The authors would like to acknowledge all colleagues and friends who have voluntarily reviewed the translation of the survey and the manuscript of this study.
The authors declare that the research was conducted in the absence of any commercial or financial relationships that could be construed as a potential conflict of interest.
All claims expressed in this article are solely those of the authors and do not necessarily represent those of their affiliated organizations, or those of the publisher, the editors and the reviewers. Any product that may be evaluated in this article, or claim that may be made by its manufacturer, is not guaranteed or endorsed by the publisher.
Arabi Aliabad, F., Zare, M., and Ghafarian Malamiri, H. (2021). Comparison of the accuracy of daytime land surface temperature retrieval methods using Landsat 8 images in arid regions. Infrared Phys. Technol. 115, 103692. doi:10.1016/j.infrared.2021.103692
Carrillo-Niquete, G. A., Andrade, J. L., Valdez-Lazalde, J. R., Reyes-García, C., and Hernández-Stefanoni, J. L. (2022). Characterizing spatial and temporal deforestation and its effects on surface urban heat islands in a tropical city using Landsat time series. Landsc. Urban Plan. 217, 104280. doi:10.1016/j.landurbplan.2021.104280
Chang, Y., Xiao, J., Li, X., Frolking, S., Zhou, D., Schneider, A., et al. (2021). Exploring diurnal cycles of surface urban heat island intensity in Boston with land surface temperature data derived from GOES-R geostationary satellites. Sci. Total Environ. 763, 144224. doi:10.1016/j.scitotenv.2020.144224
Cosgrove, A., and Berkelhammer, M. (2018). Downwind footprint of an urban heat island on air and lake temperatures. npj Clim. Atmos. Sci. 1, 1–10. doi:10.1038/s41612-018-0055-3
Deliry, S. I., Avdan, Z. Y., and Avdan, U. (2021). Extracting urban impervious surfaces from Sentinel-2 and Landsat-8 satellite data for urban planning and environmental management. Environ. Sci. Pollut. Res. 28, 6572–6586. doi:10.1007/s11356-020-11007-4
Dewan, A., Kiselev, G., Botje, D., Mahmud, G. I., Bhuian, Md. H., and Hassan, Q. K. (2021). Surface urban heat island intensity in five major cities of Bangladesh: Patterns, drivers and trends. Sustain. Cities Soc. 71, 102926. doi:10.1016/j.scs.2021.102926
Erdem, U., Cubukcu, K. M., and Sharifi, A. (2021). An analysis of urban form factors driving urban heat island: The case of izmir. Environ. Dev. Sustain 23, 7835–7859. doi:10.1007/s10668-020-00950-4
Feng, R., Wang, F., Wang, K., Wang, H., and Li, L. (2021). Urban ecological land and natural-anthropogenic environment interactively drive surface urban heat island: An urban agglomeration-level study in China. Environ. Int. 157, 106857. doi:10.1016/j.envint.2021.106857
Guo, A., Yang, J., Xiao, X., Xia (Cecilia), J., Jin, C., and Li, X. (2020). Influences of urban spatial form on urban heat island effects at the community level in China. Sustain. Cities Soc. 53, 101972. doi:10.1016/j.scs.2019.101972
He, X., Zhang, Z., and Yang, Z. (2021). Extraction of urban built-up area based on the fusion of night-time light data and point of interest data. R. Soc. Open Sci. 8, 210838. doi:10.1098/rsos.210838
Hsu, A., Sheriff, G., Chakraborty, T., and Manya, D. (2021). Disproportionate exposure to urban heat island intensity across major US cities. Nat. Commun. 12, 1–11. doi:10.1038/s41467-021-22799-5
Hu, D., Qiao, K., Wang, X., Zhao, L., and Ji, G. (2015). Land surface temperature retrieval from Landsat 8 thermal infrared data using mono-window algorithm. J. Remote Sens. 19, 964–976. https://kns.cnki.net/kcms/detail/11.3841.tp.20150929.1027.022.html.
Hu, T., Jin, S., Yan, Q., and Guo, X. (2021a). “Built-up areas mapping from Luojia 1-01 nighttime light imagery with considering observation number,” in 2021 photonics & electromagnetics research symposium (Hangzhou, China: IEEE), 2254–2259. doi:10.1109/PIERS53385.2021.9694698
Hu, Y., Dai, Z., and Guldmann, J.-M. (2021b). Greenspace configuration impact on the urban heat island in the Olympic Area of Beijing. Environ. Sci. Pollut. Res. 28, 33096–33107. doi:10.1007/s11356-020-12086-z
Imhoff, M. L., Zhang, P., Wolfe, R. E., and Bounoua, L. (2010). Remote sensing of the urban heat island effect across biomes in the continental USA. Remote Sens. Environ. 114, 504–513. doi:10.1016/j.rse.2009.10.008
Jiang, Y., and Lin, W. (2021). A comparative analysis of retrieval algorithms of land surface temperature from landsat-8 data: A case study of shanghai, China. Int. J. Environ. Res. Public Health 18, 5659. doi:10.3390/ijerph18115659
Joloudari, J. H., Hassannataj Joloudari, E., Saadatfar, H., Ghasemigol, M., Razavi, S. M., Mosavi, A., et al. (2020). Coronary artery disease diagnosis; ranking the significant features using a random trees model. Int. J. Environ. Res. Public Health 17, 731. doi:10.3390/ijerph17030731
Jun, Z., Xiao-Die, Y., and Han, L. (2021). The extraction of urban built-up areas by integrating night-time light and POI data—a case study of kunming, China. IEEE Access 9, 22417–22429. doi:10.1109/ACCESS.2021.3054169
Kamali Maskooni, E., Hashemi, H., Berndtsson, R., Daneshkar Arasteh, P., and Kazemi, M. (2021). Impact of spatiotemporal land-use and land-cover changes on surface urban heat islands in a semiarid region using Landsat data. null 14, 250–270. doi:10.1080/17538947.2020.1813210
Kim, S. W., and Brown, R. D. (2021). Urban heat island (UHI) intensity and magnitude estimations: A systematic literature review. Sci. Total Environ. 779, 146389. doi:10.1016/j.scitotenv.2021.146389
Koç, A., Caf, A., Koç, C., and Kejanli, D. T. (2022). Examining the temporal and spatial distribution of potential urban heat island formations. Environ. Sci. Pollut. Res. 29, 11455–11468. doi:10.1007/s11356-021-16422-9
Koko, A. F., Yue, W., Abubakar, G. A., Alabsi, A. A. N., and Hamed, R. (2021). Spatiotemporal influence of land use/land cover change dynamics on surface urban heat island: A case study of abuja metropolis, Nigeria. ISPRS Int. J. Geo-Information 10, 272. doi:10.3390/ijgi10050272
Li, C., Duan, P., Wang, M., Li, J., and Zhang, B. (2021). The extraction of built-up areas in Chinese mainland cities based on the local optimal threshold method using NPP-viirs images. J. Indian Soc. Remote Sens. 49, 233–248. doi:10.1007/s12524-020-01209-1
Li, H., Zhou, Y., Jia, G., Zhao, K., and Dong, J. (2022). Quantifying the response of surface urban heat island to urbanization using the annual temperature cycle model. Geosci. Front. 13, 101141. doi:10.1016/j.gsf.2021.101141
Li, L., Zha, Y., and Zhang, J. (2020). Spatially non-stationary effect of underlying driving factors on surface urban heat islands in global major cities. Int. J. Appl. Earth Observation Geoinformation 90, 102131. doi:10.1016/j.jag.2020.102131
Li, X., Zhao, L., Li, D., and Xu, H. (2018). Mapping urban extent using Luojia 1-01 nighttime light imagery. Sensors 18, 3665. doi:10.3390/s18113665
Li, X., and Zhou, W. (2019). Spatial patterns and driving factors of surface urban heat island intensity: A comparative study for two agriculture-dominated regions in China and the USA. Sustain. Cities Soc. 48, 101518. doi:10.1016/j.scs.2019.101518
Liu, H., Huang, B., Zhan, Q., Gao, S., Li, R., and Fan, Z. (2021a). The influence of urban form on surface urban heat island and its planning implications: Evidence from 1288 urban clusters in China. Sustain. Cities Soc. 71, 102987. doi:10.1016/j.scs.2021.102987
Liu, J., Zhang, L., Zhang, Q., Zhang, G., and Teng, J. (2021b). Predicting the surface urban heat island intensity of future urban green space development using a multi-scenario simulation. Sustain. Cities Soc. 66, 102698. doi:10.1016/j.scs.2020.102698
Liu, Q., Zhan, Q., Li, J., Yang, C., and Liu, W. (2021c). Extracting built-up areas using luojia-1A nighttime light imageries in wuhan, China. WHDXXBXXKXB 46, 30–39. doi:10.13203/j.whugis20190376
Liu, W., Zhao, H., Sun, S., Xu, X., Huang, T., and Zhu, J. (2022). Green space cooling effect and contribution to mitigate heat island effect of surrounding communities in beijing metropolitan area. Front. Public Health 10, 870403. doi:10.3389/fpubh.2022.870403
Luo, X., Yang, J., Sun, W., and He, B. (2021). Suitability of human settlements in mountainous areas from the perspective of ventilation: A case study of the main urban area of chongqing. J. Clean. Prod. 310, 127467. doi:10.1016/j.jclepro.2021.127467
Ma, L., Wang, Y., Liang, Z., Ding, J., Shen, J., Wei, F., et al. (2021a). Changing effect of urban form on the seasonal and diurnal variations of surface urban heat island intensities (SUHIIs) in more than 3000 cities in China. Sustainability 13, 2877. doi:10.3390/su13052877
Ma, X., and Peng, S. (2022). Research on the spatiotemporal coupling relationships between land use/land cover compositions or patterns and the surface urban heat island effect. Environ. Sci. Pollut. Res. 29, 39723–39742. doi:10.1007/s11356-022-18838-3
Ma, X., Zhang, L., Guo, M., and Zhao, J. (2021b). The effect of various urban design parameter in alleviating urban heat island and improving thermal health—A case study in a built pedestrianized block of China. Environ. Sci. Pollut. Res. 28, 38406–38425. doi:10.1007/s11356-021-13179-z
Manoli, G., Fatichi, S., Schläpfer, M., Yu, K., Crowther, T. W., Meili, N., et al. (2019). Magnitude of urban heat islands largely explained by climate and population. Nature 573, 55–60. doi:10.1038/s41586-019-1512-9
Meng, Q., Zhang, L., Sun, Z., Meng, F., Wang, L., and Sun, Y. (2018). Characterizing spatial and temporal trends of surface urban heat island effect in an urban main built-up area: A 12-year case study in beijing, China. Remote Sens. Environ. 204, 826–837. doi:10.1016/j.rse.2017.09.019
Mohammad, P., and Goswami, A. (2021a). Quantifying diurnal and seasonal variation of surface urban heat island intensity and its associated determinants across different climatic zones over Indian cities. null 58, 955–981. doi:10.1080/15481603.2021.1940739
Mohammad, P., and Goswami, A. (2021b). Spatial variation of surface urban heat island magnitude along the urban-rural gradient of four rapidly growing Indian cities. null 1, 23. doi:10.1080/10106049.2021.1886338
Morabito, M., Crisci, A., Guerri, G., Messeri, A., Congedo, L., and Munafò, M. (2021). Surface urban heat islands in Italian metropolitan cities: Tree cover and impervious surface influences. Sci. Total Environ. 751, 142334. doi:10.1016/j.scitotenv.2020.142334
Najafzadeh, F., Mohammadzadeh, A., Ghorbanian, A., and Jamali, S. (2021). Spatial and temporal analysis of surface urban heat island and thermal comfort using Landsat satellite images between 1989 and 2019: A case study in tehran. Remote Sens. 13, 4469. doi:10.3390/rs13214469
Nhu, V.-H., Shahabi, H., Nohani, E., Shirzadi, A., Al-Ansari, N., Bahrami, S., et al. (2020). Daily water level prediction of zrebar lake (Iran): A comparison between M5P, random forest, random tree and reduced error pruning trees algorithms. ISPRS Int. J. Geo-Information 9, 479. doi:10.3390/ijgi9080479
Niu, L., Zhang, Z., Peng, Z., Liang, Y., Liu, M., Jiang, Y., et al. (2021). Identifying surface urban heat island drivers and their spatial heterogeneity in China’s 281 cities: An empirical study based on multiscale geographically weighted regression. Remote Sens. 13, 4428. doi:10.3390/rs13214428
Peng, S., Piao, S., Ciais, P., Friedlingstein, P., Ottle, C., Bréon, F.-M., et al. (2012). Surface urban heat island across 419 global big cities. Environ. Sci. Technol. 46, 696–703. doi:10.1021/es2030438
Qin, Z. H., Zhang, M. H., Karnieli, A., and Berliner, P. (2001). Mono-window algorithm for retrieving land surface temperature from Landsat TM6 data. Acta Geogr. Sin. 56, 456–466. doi:10.11821/xb200104009
Ren, J., Yang, J., Zhang, Y., Xiao, X., Xia, J. C., Li, X., et al. (2022). Exploring thermal comfort of urban buildings based on local climate zones. J. Clean. Prod. 340, 130744. doi:10.1016/j.jclepro.2022.130744
Schwaab, J., Meier, R., Mussetti, G., Seneviratne, S., Bürgi, C., and Davin, E. L. (2021). The role of urban trees in reducing land surface temperatures in European cities. Nat. Commun. 12, 1–11. doi:10.1038/s41467-021-26768-w
Shastri, H., Barik, B., Ghosh, S., Venkataraman, C., and Sadavarte, P. (2017). Flip flop of day-night and summer-winter surface urban heat island intensity in India. Sci. Rep. 7, 1–8. doi:10.1038/srep40178
Shi, Z., Yang, J., Zhang, Y., Xiao, X., and Xia, J. C. (2022). Urban ventilation corridors and spatiotemporal divergence patterns of urban heat island intensity: A local climate zone perspective. Environ. Sci. Pollut. Res. 1, 13. doi:10.1007/s11356-022-21037-9
Smith, I. A., Winbourne, J. B., Tieskens, K. F., Jones, T. S., Bromley, F. L., Li, D., et al. (2021). A satellite-based model for estimating latent heat flux from urban vegetation. Front. Ecol. Evol. 9, 695995. doi:10.3389/fevo.2021.695995
Tran, H., Uchihama, D., Ochi, S., and Yasuoka, Y. (2006). Assessment with satellite data of the urban heat island effects in Asian mega cities. Int. J. Appl. Earth Observation Geoinformation 8, 34–48. doi:10.1016/j.jag.2005.05.003
Varentsov, M., Fenner, D., Meier, F., Samsonov, T., and Demuzere, M. (2021). Quantifying local and mesoscale drivers of the urban heat island of moscow with reference and crowdsourced observations. Front. Environ. Sci. 9, 716968. doi:10.3389/fenvs.2021.716968
Wang, J., Chen, Y., Liao, W., He, G., Tett, S. F. B., Yan, Z., et al. (2021a). Anthropogenic emissions and urbanization increase risk of compound hot extremes in cities. Nat. Clim. Chang. 11, 1084–1089. doi:10.1038/s41558-021-01196-2
Wang, Y., and Shen, Z. (2021). Comparing Luojia 1-01 and VIIRS nighttime light data in detecting urban spatial structure using a threshold-based kernel density estimation. Remote Sens. 13, 1574. doi:10.3390/rs13081574
Wang, Z., Meng, Q., Allam, M., Hu, D., Zhang, L., and Menenti, M. (2021b). Environmental and anthropogenic drivers of surface urban heat island intensity: A case-study in the yangtze river delta, China. Ecol. Indic. 128, 107845. doi:10.1016/j.ecolind.2021.107845
Wu, H., Wang, T., Riemer, N., Chen, P., Li, M., and Li, S. (2017). Urban heat island impacted by fine particles in Nanjing, China. Sci. Rep. 7, 1–11. doi:10.1038/s41598-017-11705-z
Xiong, L., Li, S., Zou, B., Peng, F., Fang, X., and Xue, Y. (2022). Long time-series urban heat island monitoring and driving factors analysis using remote sensing and geodetector. Front. Environ. Sci. 9, 828230. doi:10.3389/fenvs.2021.828230
Yang, G., Ma, Y., and Hu, J. (2021a). A fused variable by night light images and MODIS products for improving urban built-up area extraction. Technologies 9, 40. doi:10.3390/technologies9020040
Yang, J., Ren, J., Sun, D., Xiao, X., Xia, J., Cecilia), , et al. (2021b). Understanding land surface temperature impact factors based on local climate zones. Sustain. Cities Soc. 69, 102818. doi:10.1016/j.scs.2021.102818
Yang, J., Wang, Y., Xiu, C., Xiao, X., Xia, J., and Jin, C. (2020). Optimizing local climate zones to mitigate urban heat island effect in human settlements. J. Clean. Prod. 275, 123767. doi:10.1016/j.jclepro.2020.123767
Yang, J., Xin, J., Zhang, Y., Xiao, X., and Xia, J. C. (2022). Contributions of sea–land breeze and local climate zones to daytime and nighttime heat island intensity. npj Urban Sustain 2, 1–11. doi:10.1038/s42949-022-00055-z
Yang, J., Yang, Y., Sun, D., Jin, C., and Xiao, X. (2021c). Influence of urban morphological characteristics on thermal environment. Sustain. Cities Soc. 72, 103045. doi:10.1016/j.scs.2021.103045
Yao, R., Wang, L., Huang, X., Liu, Y., Niu, Z., Wang, S., et al. (2021). Long-term trends of surface and canopy layer urban heat island intensity in 272 cities in the mainland of China. Sci. Total Environ. 772, 145607. doi:10.1016/j.scitotenv.2021.145607
Yao, R., Wang, L., Huang, X., Zhang, W., Li, J., and Niu, Z. (2018). Interannual variations in surface urban heat island intensity and associated drivers in China. J. Environ. Manag. 222, 86–94. doi:10.1016/j.jenvman.2018.05.024
Yu, M., Guo, S., Guan, Y., Cai, D., Zhang, C., Fraedrich, K., et al. (2021). Spatiotemporal heterogeneity analysis of yangtze river delta urban agglomeration: Evidence from nighttime light data (2001–2019). Remote Sens. 13, 1235. doi:10.3390/rs13071235
Zhang, H., Liang, C., and Pan, Y. (2022). Spatial expansion of built-up areas in the beijing–tianjin–hebei urban agglomeration based on nighttime light data: 1992–2020. Int. J. Environ. Res. Public Health 19, 3760. doi:10.3390/ijerph19073760
Zhang, R. (2020). Cooling effect and control factors of common shrubs on the urban heat island effect in a southern city in China. Sci. Rep. 10, 1–8. doi:10.1038/s41598-020-74559-y
Zhang, Y., Li, D., Liu, L., Liang, Z., Shen, J., Wei, F., et al. (2021). Spatiotemporal characteristics of the surface urban heat island and its driving factors based on local climate zones and population in beijing, China. Atmosphere 12, 1271. doi:10.3390/atmos12101271
Zhao, Z., Sharifi, A., Dong, X., Shen, L., and He, B.-J. (2021). Spatial variability and temporal heterogeneity of surface urban heat island patterns and the suitability of local climate zones for land surface temperature characterization. Remote Sens. 13, 4338. doi:10.3390/rs13214338
Zheng, Y., Tang, L., and Wang, H. (2021). An improved approach for monitoring urban built-up areas by combining NPP-VIIRS nighttime light, NDVI, NDWI, and NDBI. J. Clean. Prod. 328, 129488. doi:10.1016/j.jclepro.2021.129488
Zhou, D., Zhao, S., Liu, S., Zhang, L., and Zhu, C. (2014a). Surface urban heat island in China’s 32 major cities: Spatial patterns and drivers. Remote Sens. Environ. 152, 51–61. doi:10.1016/j.rse.2014.05.017
Keywords: surface urban heat island, urban-rural gradient, normalized difference vegetation index, normalized difference build-up index, normalized difference water body index, dalian city
Citation: Xin J, Yang J, Wang L-e, Jin C, Xiao X and Xia J( (2022) Seasonal differences in the dominant factors of surface urban heat islands along the urban-rural gradient. Front. Environ. Sci. 10:974811. doi: 10.3389/fenvs.2022.974811
Received: 21 June 2022; Accepted: 24 August 2022;
Published: 09 September 2022.
Edited by:
Christos H. Halios, Public Health England, United KingdomReviewed by:
Decheng Zhou, Nanjing University of Information Science and Technology, ChinaCopyright © 2022 Xin, Yang, Wang, Jin, Xiao and Xia. This is an open-access article distributed under the terms of the Creative Commons Attribution License (CC BY). The use, distribution or reproduction in other forums is permitted, provided the original author(s) and the copyright owner(s) are credited and that the original publication in this journal is cited, in accordance with accepted academic practice. No use, distribution or reproduction is permitted which does not comply with these terms.
*Correspondence: Jun Yang, eWFuZ2p1bjhAbWFpbC5uZXUuZWR1LmNu; Ling-en Wang, d2FuZ2xlQGlnc25yci5hYy5jbg==; Cui Jin, amluY3VpQGxubnUuZWR1LmNu
Disclaimer: All claims expressed in this article are solely those of the authors and do not necessarily represent those of their affiliated organizations, or those of the publisher, the editors and the reviewers. Any product that may be evaluated in this article or claim that may be made by its manufacturer is not guaranteed or endorsed by the publisher.
Research integrity at Frontiers
Learn more about the work of our research integrity team to safeguard the quality of each article we publish.