 Wensheng Wang1
 Xiaoxuan Kao
 Zhihan Lin
- 1School of Management, China University of Mining and Technology-Beijing, Beijing, China
- 2Beijing Dongcheng District Manicipal Tax Service, State Taxation Administration, Beijing, China
After China’s “Double Carbon” strategy was proposed to reduce energy and consumption, the optimization of China’s energy consumption structure and whether China’s coal consumption have already reached its peak once again attracted attention. This paper uses the theory of system dynamics to build a system dynamics model of coal consumption. Based on data analysis and the grey prediction model, three categories and nine sub-scenarios are established and the peak coal consumption is analyzed under each scenario. The results show that: The peak of coal consumption in China can echo the strategic goal of peaking carbon in 2030, which is in line with the laws of reality. The economic growth rate has the greatest influence on the coal consumption peak, followed by industrial structure and coal consumption intensity, and the population growth rate has the least influence. The SD3 scenario is the optimal path for China’s future coal consumption development. Under this scenario, coal consumption will peak at 437.8 million tons in 2027. If the future energy consumption trend is close to the SD3 scenario, the socioeconomic growth rate will slow down, the population growth rate will slow down, the industrial structure optimization degree will be higher, and the intensity of coal consumption will be lower. The coal consumption peak varies greatly according to different development goals and transformation dynamics. Under the constraints of the established peak time, the scenario of coal consumption peak has a variety of combinations.
1 Introduction
The fourth assessment report issued by the Intergovernmental Panel on Climate Change (IPCC, 2007) points out that more than 90% of the climate warming in the past 50 years may be caused by human activities, mainly the consumption of fossil energy such as coal, oil and natural gas (2007). In September 2020, General Secretary Xi Jinping proposed that China would achieve a carbon peak by 2030 and carbon neutralization by 2060. This goal provides direction guidance and a grand blueprint for China’s response to climate change and green and low-carbon development. According to the World Bank, China surpassed the United States as the world’s largest energy producer in 2009. In 2018, China remained the world’s largest energy incremental country, accounting for 23.6% of total global energy consumption and 34.5% of net energy consumption growth. At present, about 70% of China’s carbon dioxide emissions are closely related to coal consumption (Liu et al., 2021). Actively pushing coal consumption to its peak is important content and a key step to promoting the transformation of energy structure and achieving the goal of Double-Carbon. Energy consumption peaked in the United States in 2007 and carbon emissions peaked in the same year; energy consumption peaked in the European Union in 2006 and carbon emissions peaked in the same year (2020). The development experiences of European and American countries confirm that the peak of energy consumption is the premise of the carbon peak. The reality of China’s energy structure shows that the peak of coal consumption is a necessary condition for China’s energy consumption to reach its peak, and the study of the coal peak is of great significance to realize the goal of the Carbon-Peak.
The issue of peak projections has received attention from researchers long ago, with Maggio and Cacciola (2012) projecting the peak consumption of the world’s major energy consumption categories. Li’s analysis of China’s response to the goal of peaking coal consumption by 2030 Li conducted a factor decomposition analysis of China’s goal to reach peak coal consumption by 2030 (Li and Qin, 2019), and Su used the optimal control and the STIRPAT model to analysis a scenario of when China would reach peak carbon emissions (Su and Lee, 2020). Li carried out a factor decomposition analysis on China’s goal to achieve peak coal consumption by 2030 (Li and Qin, 2019), and Su used the optimal control and the STIRPAT model to conduct a scenario analysis on when China’s carbon emissions peak (Su and Lee, 2020). Based on China’s coal consumption for carbon emissions and economic development, Liu et al. (2019) discuss the pathway to long-term low-carbon development from different perspectives. The peak and time-to-peak coal consumption determine the peak and time-to-peak carbon, and directly affect the length, cost, and difficulty of achieving carbon neutrality in China. At the same time, Wang et al. (2022) research results show that coal prices in the carbon neutral phase will also be affected accordingly. In 2013, China’s coal consumption reached a historical peak of 424 million tons. Influenced by factors such as economic slowdown and adjustment of the energy structure, China’s coal consumption began to decline in 2014, with total coal consumption falling by 2.9% year on year and negative growth for the first time in 15 years. As a result, some scholars and research institutions believe that China’s coal consumption has reached its peak (Wang and Li, 2017; Han et al., 2018). But there are still many experts and scholars who prove through theoretical research that 2013 is not the coal consumption peak in China. The coal peak research group led by the coal branch of the China Energy Research Association said that China’s total coal consumption will reach the peak in 2020, and BP predicted that China’s total coal consumption will reach the peak in 2030 (BP Statistical Review of World Energy (2020)). Tollefson, Green, and Stern believe that China’s carbon emissions will peak in 2025 (Tollefson, 2016; Green and Stern, 2017). Zhang et al. (2016) believe that the peak of coal supply and demand in China will occur around 2020. Since 2017, coal consumption has shown an upward trend again. During the peak period of power supply and heating in 2020, some areas will reappear the power restriction situation. In 2021, China’s coal production and consumption reached a record high. Many phenomena show that the contradiction between energy transition and energy security has been highlighted, clean energy is developing rapidly while coal demand is still strong, and the fossil energy consumption is still likely to rise. Therefore, for the sustainable development of China’s economy, the scenario of economic, industrial, and energy factors corresponding to the emergence of the coal peak is worth in-depth study. As early as 2010 the academic community has begun to pay attention to the issue of coal peak, some scholars think that China’s coal consumption has reached its peak in 2013 and 2014 (Wang and Li, 2017), but some scholars think that China’s coal consumption has not reached the peak yet. Lin and Li constructed a comprehensive prediction framework of environmental governance based on the theory that environmental governance forces the change of energy structure (Lin and Li, 2015). It is found that under the general intensity of environmental governance, China is expected to reach the peak of coal consumption by 2023, about 450 million tons. Hao et al. (2016) based on the Environmental Kuznets curve (EKC) of per capita coal consumption, the research show that the peak of coal consumption may not be reached for a long time in the future. Meanwhile, there have been many good quality results and findings in the exploration of carbon emissions in different sectors and industries in the field of environment and climate change. In his study, Zhang et al. (2022) measured and compared the potential for achieving carbon neutrality in China’s building sector operations by 2060, as well as the phenomenon of coal removal and low-carbon scenarios in construction operations (Xiang et al., 2022). Wu and Niu (2022) Explored the path planning model of China’s power sector during the low-carbon transition period under the 1.5°C temperature control target. From the perspective of cities (Liu et al., 2022) and families (Sun and Wang, 2021), Liu and Sun introduced the innovation role, governance performance methods (Xia et al., 2022a) and impact regulation effects (Xia et al., 2022b) under the carbon neutral target from the institutional level. Li et al. (2022) built a model for carbon emissions of Chinese coal enterprises. Based on the above research results and current research background, the argument that coal consumption has reached its peak needs to be updated. At the same time, previous studies did not answer the specific question of China’s coal consumption peak, nor did they give the scenario corresponding to the peak. Based on the above research, this paper takes the energy transformation and development under the goal of reaching the “Peak Carbon” as the background, uses the theory and method of system dynamics, and studies the coal consumption that is the most concerned in China’s energy system as the research theme. Under different development scenarios, when and under what circumstances will China’s coal consumption reach the peak, and expounds the corresponding economic, industrial, energy, population structure, and combination mode when the coal peak occurs, it updates and supplements the original research on the development prediction of China’s coal energy structure and coal consumption, and puts forward policy suggestions to adapt to the development scenario. Based on the above research, this paper takes the energy transformation and development under the goal of reaching the “Peak Carbon” as the background and uses the theory and method of system dynamics to study the coal consumption that is the most concerned in China’s energy system. Study the question of when and under what circumstances China’s coal consumption will peak under different development scenarios. This study clarifies the corresponding economic, industrial, energy, population structure, and combination patterns when the coal peak occurs, updates and supplements the original development prediction research on China’s coal energy structure and coal consumption, and proposes policy recommendations to adapt to the development scenarios.
2 Model construction and scenario setting
2.1 Model construction
Coal consumption forecasting is a complex system problem, which is influenced by many factors, such as the economy, population, industrial structure, technological progress, etc., System dynamics is an effective tool to study complex systems and deal with high-order, nonlinear, long-period, and multiple feedback (Zhang and Li, 2007; Li and Yang, 2010; Mao et al., 2020). Therefore, it is widely used in the supply and demand forecasting of energy systems.
The cause-and-effect diagram is drawn to describe qualitatively the cause-and-effect relationship among the system variables. The cause-and-effect relationship between the variables in the diagram is represented by a symbolic arrow, “+” represents positive correlation, and “−” represents negative correlation. Through the concrete analysis of the structure of the coal consumption system and the causal relationship between the factors in the system, draw the causal relationship diagram of the coal consumption system, as shown in Figure 1.
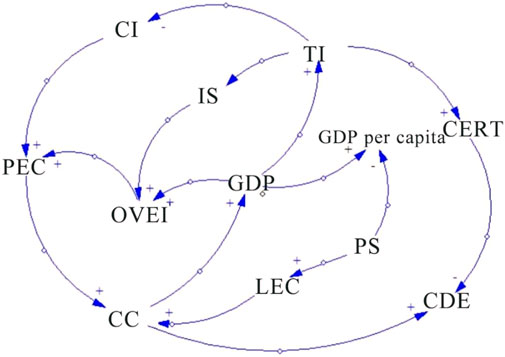
FIGURE 1. Causality diagram of coal consumption system.
The main feedback loops of the model include:
1) coal consumption→ + GDP→+industrial output value→ + production energy consumption→ + coal consumption
2) coal consumption→ + GDP→ + technology input→-industrial structure→ + industrial output value→ + production energy consumption→ + coal consumption
3) GDP→ + technology input→-coal intensity→ + production energy consumption→ + coal consumption→ + GDP
2.2 System dynamic flow diagram and equation
According to the causality diagram and the analysis of the properties of various variables in the system, the flow diagram of the system is drawn. As shown in Figure 2.
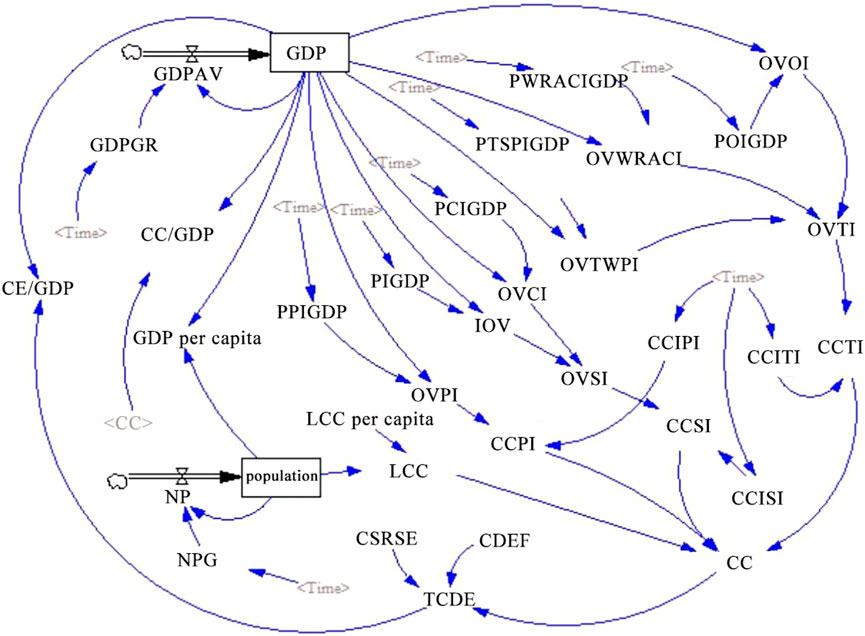
FIGURE 2. The dynamic flowchart of coal consumption system.
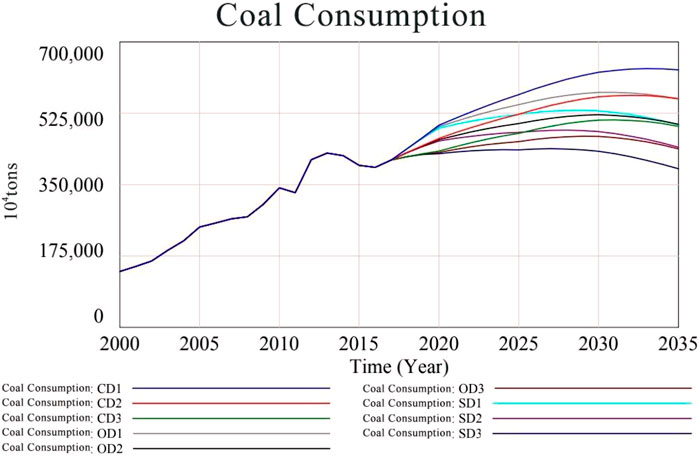
FIGURE 3. Scenario simulation of China’s coal consumption.
The main parameters and functional equations of the system dynamics model of coal consumption are in the appendix.
In the process of model construction, the data comes from authoritative databases and websites such as China Statistical Yearbook, China Energy Statistical Yearbook, BP World Energy Statistical Yearbook, and BP oil company website from 2001 to 2017. The system setting takes 2000 as the starting year, the target year is 2017, and the step length is 1 year. The equations are: Initial time = 2000; Final time = 2017; Saveper = Time step; Time step = 1.
2.3 Scenario parameter setting
2.3.1 Parameter setting of population growth rate
According to the data from the National Bureau of Statistics, China’s total population reached 1.4 billion at the end of 2019, the birth rate decreased, and the growth of the total population slowed down slightly. With the comprehensive promotion of the Two Child Policy, China’s total population will continue to grow in the coming period (2016). According to the National Population Development Plan (2016–2030), especially from 2021 to 2030, China’s population development will enter a key turning point (Zhou et al., 2017). By 2020, the total population will reach about 1.42 billion. The total population will reach a peak around 2030. Population growth rate is set as shown in Table 1.
2.3.2 Economic development speed setting
In recent years, China’s economic growth has slowed down, but it still maintains a high development speed. It is expected that the growth rate of China’s GDP will decrease in the next few years. Many institutions, experts, and scholars at home and abroad have made predictions about China’s future economic development. In the 13th Five-Year Plan and Energy Economy Outlook 2030, it is mentioned that China’s average annual GDP growth rate will steadily decline to 5% by 2030 (Hao et al., 2016). The macroeconomic data analysis report released by the Institute of the economics of Renmin University of China puts forward that the GDP growth rate will remain in the target range of 5.5%–6% in 2020, which can achieve the goal of doubling the GDP in 2020 compared with 2010 (RUC, 2020). Zhou (2019), the Research Institute of the Bank of China, believes that China’s economic growth in 2020 is necessary and can be maintained at about 6%. The World Bank and the Development Research Center of the State Council predict that under the condition of stable economic operation, China’s economy will maintain an average annual growth rate of 7% from 2016 to 2020, 5.9% from 2021 to 2025 and 5% from 2026 to 2030 (World Bank, 2013). According to the prediction of the Macroeconomic Research Center of the Chinese Academy of Social Sciences, the average annual economic growth rate from 2021 to 2025 is 5.5%, and the average annual economic growth rate from 2026 to 2030 is 4.876% (Li et al., 2020). According to the research data from the Economic Prediction Office of the National Information Center (Niu, 2016) and the Japan Economic Research Center (2016), it is predicted that the growth rate of China’s economy in the next 10 years will be much lower than that in the past 10 years, and the growth rate of GDP will be 4.00%–6.00% from 2021 to 2030. Combined with the research results of the above institutions and researchers and the current situation of China’s economic growth, the average annual growth rate of China from 2018 to 2035 is defined as three scenarios: high growth rate, medium growth rate, and low growth rate, as shown in Table 2.
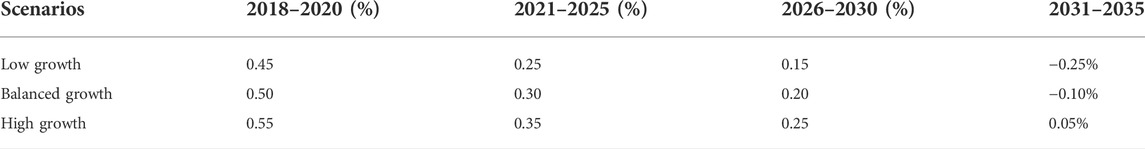
TABLE 1. Population growth rate setting under different scenarios.
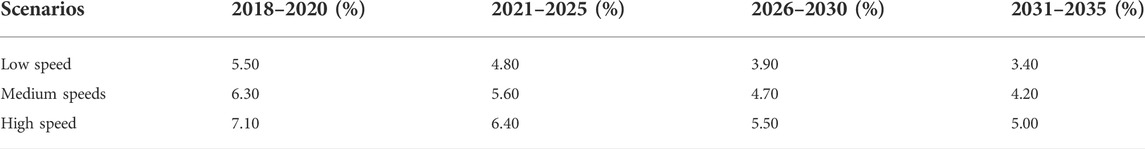
TABLE 2. GDP growth rate under different scenarios.
2.3.3 Industrial structure setting
The industrial structure can reflect China’s economic growth mode and the overall quality of the domestic economy. It is an important indicator to measure the level of economic development. China’s industrial structure is mainly divided into three categories: the primary industry refers to agriculture, forestry, fishery, and animal husbandry, the secondary industry refers to industry and construction, and the tertiary industry mainly includes transportation, warehousing and postal services, wholesale and retail, accommodation and catering, finance, real estate, and other industries.
As is shown in Table 3, from 2008 to 2017, the proportion of the primary industry gradually decreased from 10.5% to 8.4%, and the proportion of industrial output value in the secondary industry also showed an obvious downward trend, from 41.4% to 32.9%, and the construction industry showed a certain upward trend, from 5.7% to 6.9%. In the tertiary industry, only the transportation, warehousing, and postal industry showed a slight downward trend, and the rest showed an upward trend.
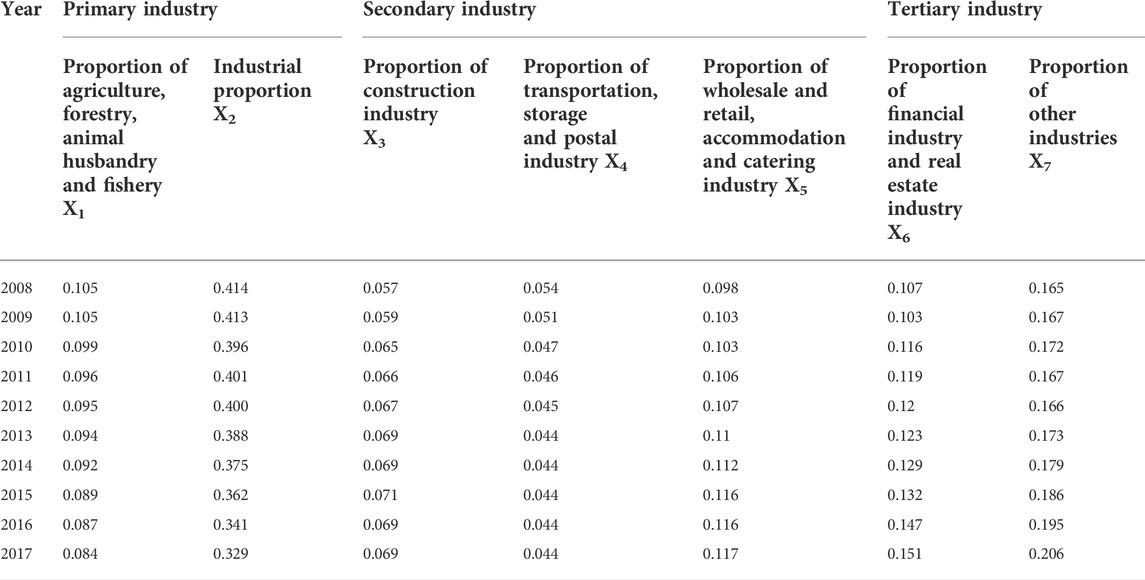
TABLE 3. China’s different industrial output value as a proportion of GDP in 2008–2017.
For the industrial structure, the sum of the proportion of each industry is equal to 1. This data combination is called component data. In this paper, the Log ratio Transformation Method can effectively eliminate the constraints of variable prediction, and then create a prediction model for the transformed variables to obtain the changing trend of each variable after transformation, and finally restore the prediction results of the original variables.
1) According to the Log ratio Transformation Method, the component data X of the industrial structure (as is shown in Eq. 1) is transformed into an unconstrained new variable Y by Eq. 2, and the transformed results are shown in Table 4. Before the establishment of the model, the feasibility test is carried out, and the level ratio test method is used to judge the interval in which the level ratio meets (
2) The Grey Prediction GM (1,1) model is used to simulate and predict the time series data Y1, Y2, Y3, Y4, Y5, and Y6 after Log ratio Transformation from 2009 to 2017. The significance test and posterior difference test are carried out for the simulation results, as shown in Table 4. The modeling accuracy p0 of the grey prediction model is greater than 90%, and the posterior difference C is less than 0.35. All models have passed the test, and the prediction effect is good. The test results are shown in Table 5.
3) According to the predicted values of Y1, Y2, Y3, Y4, Y5, and Y6 from 2018 to 2035, use Eq. 3 to calculate the proportion of output value of each industry in GDP, to obtain the future trend of China’s industrial structure, as is shown in Table 6. The predicted results comply with the relevant provisions of China’s industrial structure upgrading policy. It is expected that the proportion of output value of China’s primary industry will fluctuate on a small scale and the proportion of output value of the secondary industry will decrease significantly and the proportion of tertiary industry output value will show an overall trend of gradual increase.
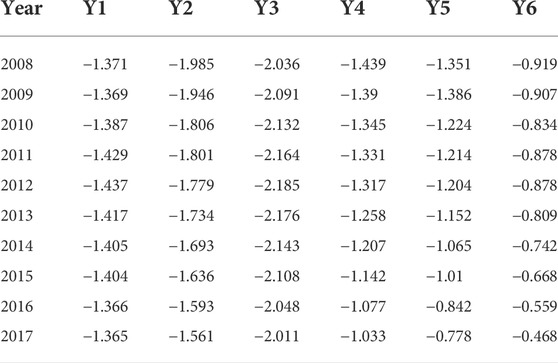
TABLE 4. Relevant data of new variables after Logratio Transformation of component data from 2008 to 2017.
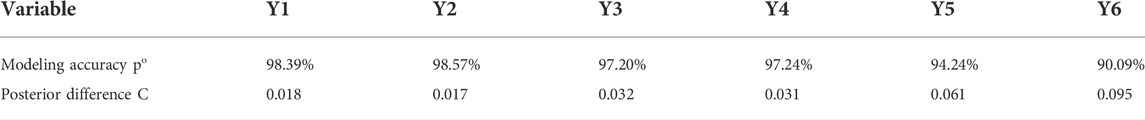
TABLE 5. Residual test and posterior test of grey prediction model.
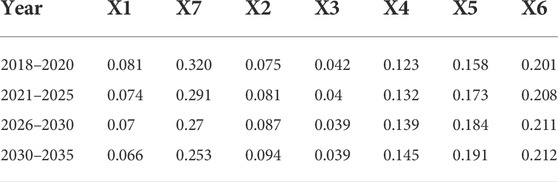
TABLE 6. Change trend of China’s industrial structure from 2018 to 2035.
When setting the industrial structure parameters under different scenarios, it is necessary to take the total proportion of the financial industry, real estate industry, and other industries as the proportion of other industries. From 2018 to 2035, China’s industrial structure is set as industrial, balanced, and service-oriented, as shown in Table 7.
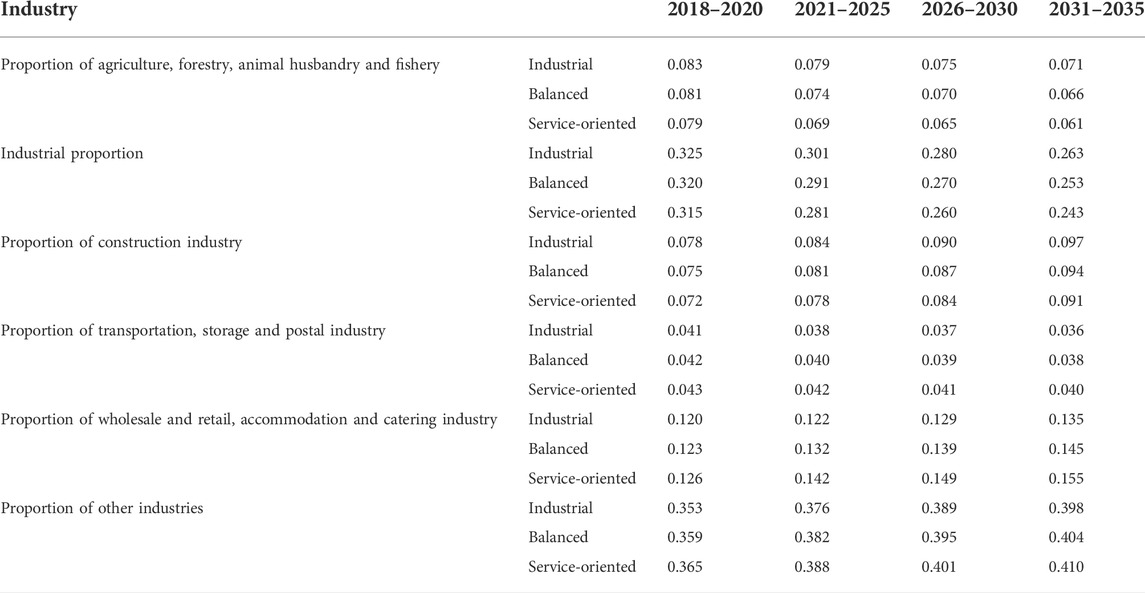
TABLE 7. Industrial structure setting under different scenarios.
2.3.4 Coal consumption intensity setting
This paper selects the coal consumption and output value of China’s primary industry, secondary industry, and tertiary industry from 2008 to 2017, and calculates the coal consumption intensity of each industry. It can be seen that the coal consumption intensity of China’s primary industry, secondary industry, and tertiary industry shows a downward trend from 2008 to 2017, in which the change range of coal consumption intensity of primary industry is small, the coal consumption intensity of the secondary industry and the tertiary industry changes greatly. As shown in Table 8.
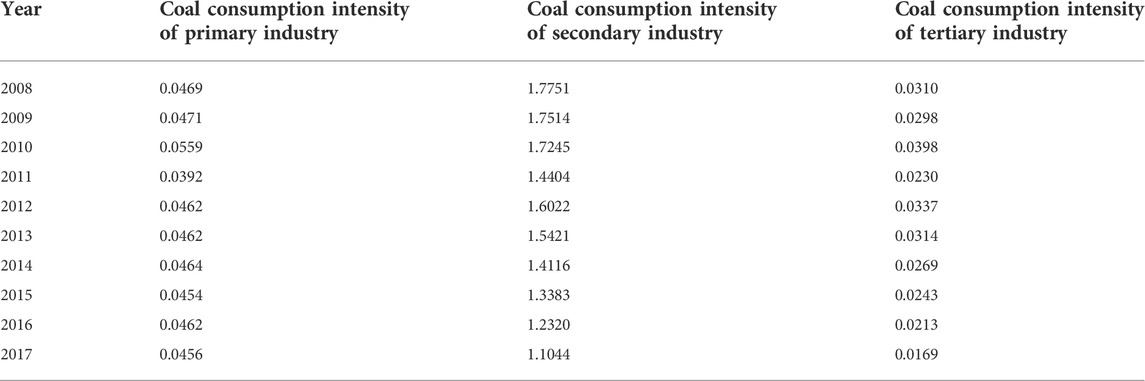
TABLE 8. Coal consumption intensity data of various industries (Unit: 104 tons/100 million CNY).
The Grey Prediction GM (1,1) model is established to predict the coal consumption intensity from 2018 to 2035. According to the impact of future technical levels and energy-saving and emission reduction policies, the coal consumption intensity is divided into three scenarios: high energy-saving, medium energy-saving, and low energy-saving, as shown in Table 9.
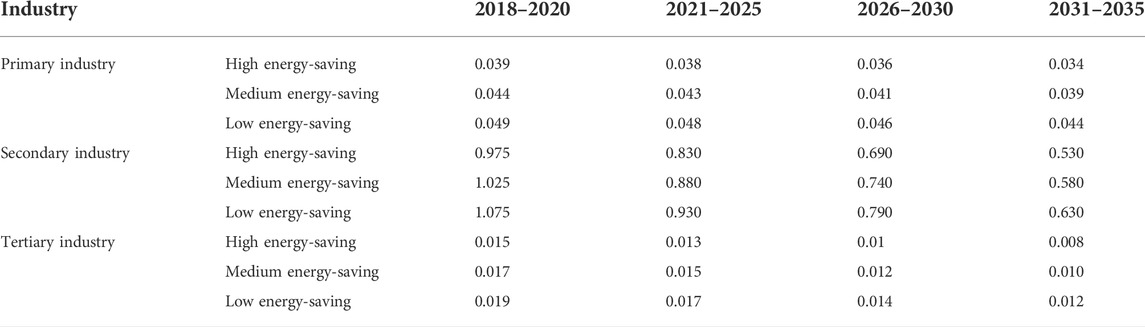
TABLE 9. Coal consumption intensity setting under different scenarios.
2.4 Scenario design
Based on the parameter setting of influencing factor indicators above, this paper sets China’s development scenario from 2018 to 2035 into three categories according to the economic growth, industrial structure, coal consumption intensity and population growth rate driving coal consumption, they are Conservative Development (CD), Optimized Development (OD) and Strengthened Development (SD). Three sub-scenarios are set under each major development scenario (2016), the specific development scenario setting is described in Table 10 below. Among them, OD2 sub-scenario is the benchmark scenario. With reference to China’s current development situation, medium population growth, medium GDP growth, continuation of the current industrial structure and coal consumption intensity decreases slightly.
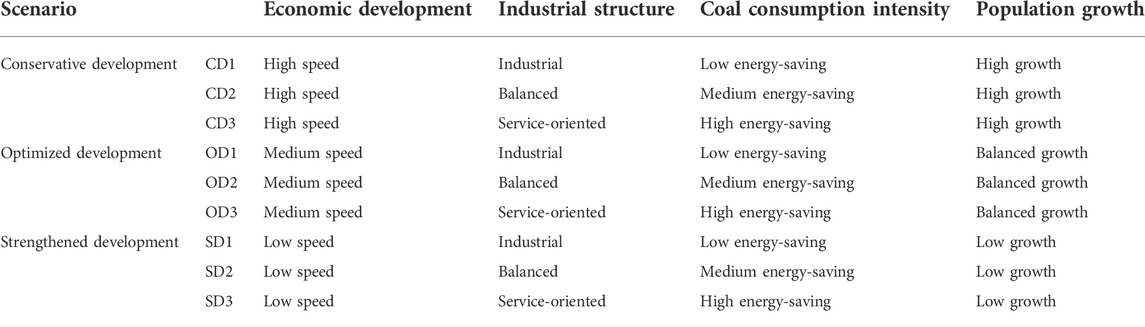
TABLE 10. Description of development scenario setting.
3 Simulation and analysis
3.1 Model consistency test
In order to test the goodness-of-fit between the model and the real system, this paper mainly uses the existing historical data and simulation results to test the error. In this paper, three main indicators are selected: gross domestic product (GDP), coal consumption of the secondary industry, and total coal consumption. The initial inspection year is 2000, the end year is 2017, the time step is set to 1 year, and the inspection period is 18 years. The goodness-of-fit test results of the coal consumption system are shown in Table 11.
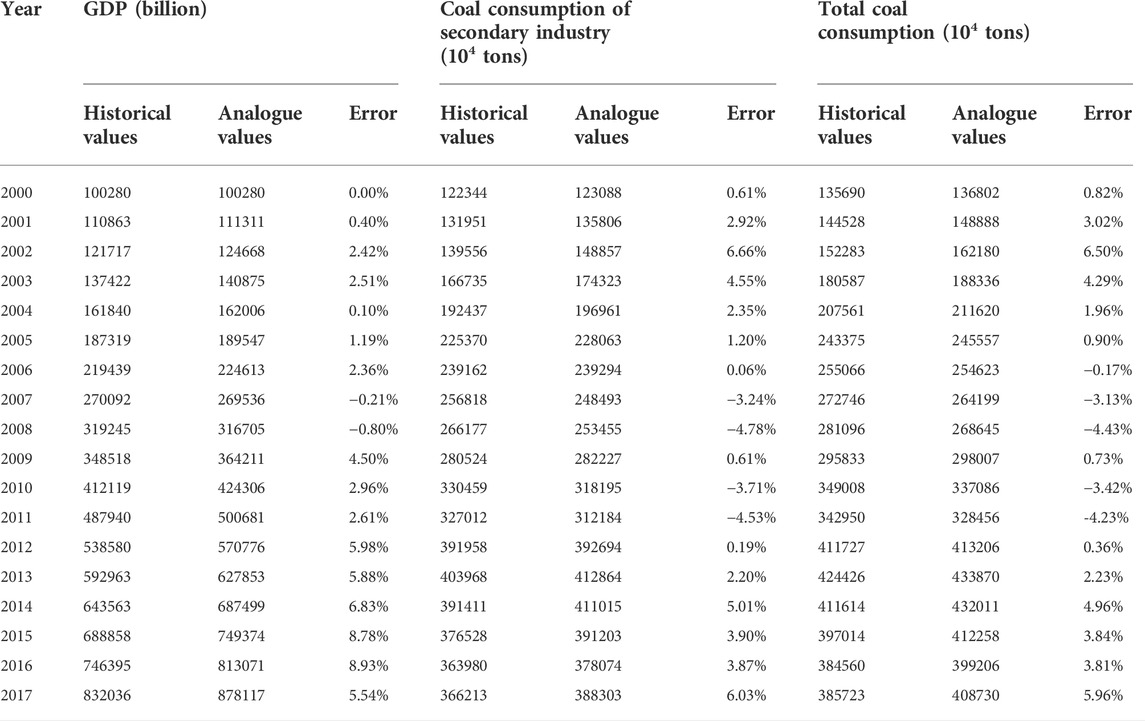
TABLE 11. Test result of historical value and simulated value of model (unit: 104 tons).
The test results show that the relative error between the simulated value and the historical value is within 9%, and the trend of the predicted value is basically consistent with the historical trend. The goodness-of-fit test results of other variables in the model are high and close to the actual situation. Therefore, the coal consumption system dynamics model in this paper can be used to predict and analyze the future coal consumption trend through the goodness-of-fit test.
3.2 Prediction results and analysis
3.2.1 Peak prediction results
In the system dynamics model of coal consumption peak, the parameters set in nine sub-scenarios are input for simulation operation respectively, so as to obtain the coal consumption data under nine sub-scenarios. The specific coal consumption data are shown in Table 12 below.
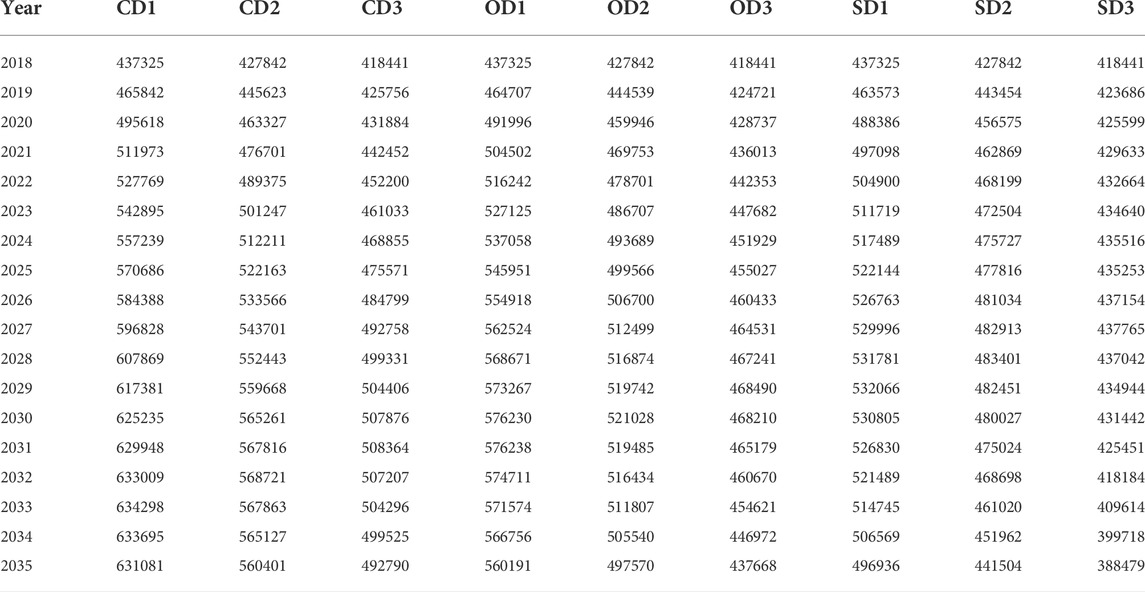
TABLE 12. Simulation results of China’s coal consumption scenario (unit: 104 tons).
The simulation results of China’s coal consumption from 2018 to 2020 are given in the form of the trend chart above. As shown in Figure 3 the peak value and occurrence time of China’s coal consumption under the above nine coal consumption development scenarios are shown in Table 13 below.
1) Analysis of coal consumption peak in China
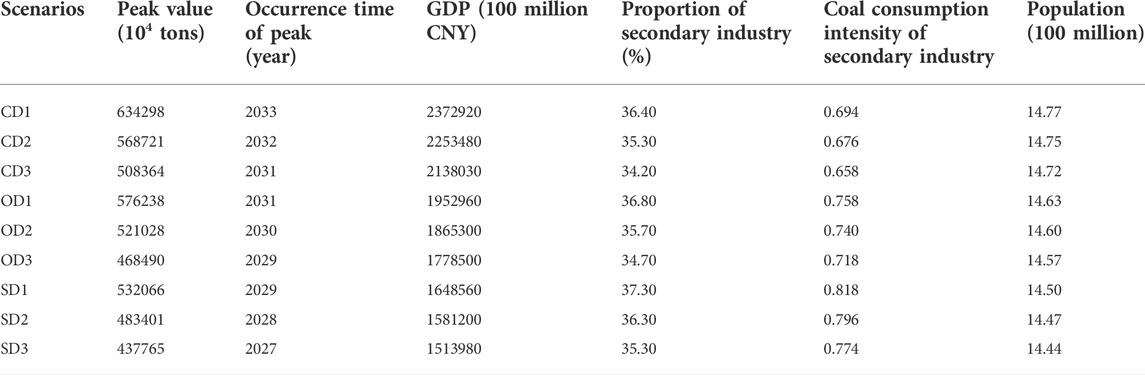
TABLE 13. China’s coal consumption peak and its related indicators.
The peak of China’s coal consumption occurred in the CD1 scenario, reaching 6.343 billion tons; the OD1 scenario took the second place, reaching 5.762 billion tons; the third is the coal consumption peak under the CD2 scenario, which is 5.687 billion tons; the fourth is the peak of coal under SD1 scenario, with a value of 5.221 billion tons; the coal consumption peak under OD2 scenario is 5.21 billion tons, ranking fifth; the sixth is the coal consumption peak under the CD3 scenario, with a value of 5.084 billion tons; the coal consumption peak under SD2, OD3 and SD3 scenarios is less than five billion tons. To sum up, t the order of peak coal consumption in China from largest to smallest is Scenario CD1, OD1, CD2, SD1, OD1, CD2, CD3, SD2, OD3, and SD3.
2) Time analysis of coal consumption peak in China
The peak of China’s coal consumption first occurred in the SD3 scenario in 2027; under the SD2 scenario, the coal consumption peak occurs in 2028; the coal consumption peak under SD1 and OD3 occurs in 2029, second only to the SD2 scenario; in the fourth place is the OD2 scenario, and the coal consumption peak appears in 2030; the occurrence time of coal peak under OD1 and CD3 scenarios is 2031, ranking fifth, slightly later than OD2 scenario; under the CD2 scenario, China’s coal consumption peak appears in 2032; the coal peak under CD1 scenario appears in 2033, the latest. To sum up, the time sequence of peak coal consumption in China is SD3, SD2, SD1 (also od3), OD2, OD1 (also CD3), CD2, and CD1.
3.2.2 Comprehensive analysis of prediction results
1) Conservative development scenario
CD scenario includes three sub-development scenarios: CD1, CD2, and CD3. The economic growth and population growth of the three sub-scenarios remain high, while the industrial structure and coal consumption intensity are different in different sub-development scenarios. Under the CD1 scenario, the industrial structure is industrial and the coal consumption intensity is low energy-saving; under the CD2 scenario, the industrial structure is balanced and the coal consumption intensity is medium energy-saving; under the CD3 scenario, the industrial structure is service-oriented and the coal consumption intensity is strong energy-saving. The peak value of China’s coal consumption under the conservative development scenario is shown in Figure 4.

FIGURE 4. Coal consumption and growth trend in China under conservative development scenario from 2018 to 2035.
As can be seen from Figure 4, none of the three sub-scenarios under the conservative development scenario can reach the coal consumption peak before 2030. Under the conservative development scenario, the coal consumption peak of the CD1 sub-scenario is the highest, reaching 6.343 billion tons, and the coal consumption peak occurs at the latest in 2033. The occurrence time of coal consumption peak in CD2 and CD3 scenario is earlier than that in CD1 scenario, but the coal consumption is much less than that in CD1 scenario, 656 million tons and 1.259 billion tons lower respectively. The coal consumption of CD1, CD2, and CD3 sub-scenarios increased by 45.04%, 32.93%, and 21.49% respectively from 2018 to the peak level, and the coal consumption in 2035 decreased by 0.51%, 1.46% and 3.06% respectively compared with its peak level. Under the CD1 scenario, before reaching the peak of coal consumption, the growth rate of coal consumption is the largest, followed by the CD2 scenario and CD3 sub-scenario.
Under the conservative development scenario, analyze several main parameters when each sub-scenario reaches the peak of coal consumption: under the CD1 scenario, the coal consumption peak will be reached in 2033, the GDP will be 237 trillion CNY, the proportion of the secondary industry will be 36.4%, the coal consumption intensity of the secondary industry will be 0.694, and the population will be 1.477 billion; Under the CD2 scenario, the coal consumption peak will be reached in 2032, with a GDP of 225 trillion CNY, a proportion of 35.3% in the secondary industry, a coal consumption intensity of 0.676 in the secondary industry and a population of 1.475 billion; Under the CD3 scenario, the coal consumption peak will be reached in 2031, with a GDP of 214 trillion CNY, the proportion of the secondary industry is 34.2%, the coal consumption intensity of the secondary industry is 0.658, and the population is 1.472 billion. When the coal consumption peak is reached under the conservative development scenario, the GDP of the three sub-scenarios is generally high, the proportion of the secondary industry and coal consumption intensity is reduced, the optimization of industrial structure is obvious, and the degree of population growth is small. The GDP, proportion of the secondary industry, coal consumption intensity, and population of CD1 scenario is the highest, which is not different from that of CD2 and CD3 scenarios.
2) Optimized development scenario
OD scenario includes three sub-development scenarios: OD1, OD2, and OD3. The economic growth and population growth under the three sub-scenarios maintain a medium speed, while the industrial structure and coal consumption intensity are different in different sub-development scenarios. Under the OD1 scenario, the industrial structure is industrial and the coal consumption intensity is low energy-saving; Under the OD2 scenario, the industrial structure is balanced and the coal consumption intensity is medium energy-saving; Under the OD3 scenario, the industrial structure is service-oriented and the coal consumption intensity is strong energy-saving. The peak value of China’s coal consumption under the optimized development scenario is shown in Figure 5.
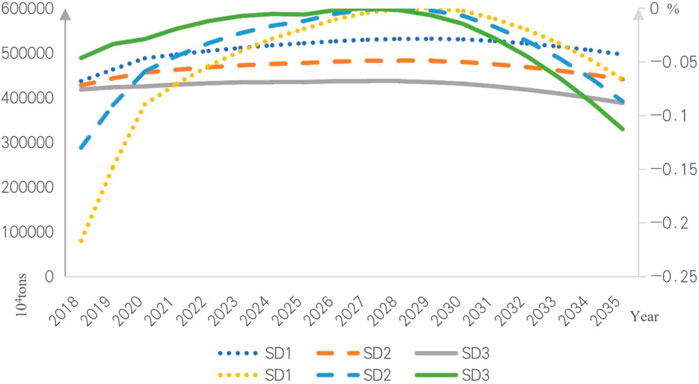
FIGURE 5. Gap between China’s coal consumption and peak value under the optimized development scenario from 2018 to 2035.
Under the optimized development scenario, the gap between the coal consumption peak of the three sub-scenarios is small. The coal consumption peak of the OD1 scenario is the highest, reaching 5.762 billion tons. The coal consumption peak occurs at the latest, in 2031. The occurrence time of coal consumption peak in OD2 and OD3 scenarios is earlier than that in OD1 scenarios, in 2030 and 2029, with the peak values of 5.21 billion tons and 4.685 billion tons respectively. It can be seen that the optimized industrial structure and low coal consumption intensity are conducive to reducing the peak of coal consumption and the arrival of the peak of coal consumption in advance. From 2018 to the coal peak, OD1, OD2, and OD3 sub-scenarios increased by 31.76%, 21.78%, and 11.96% respectively, and the growing gap between sub-scenarios narrowed. In 2035, coal consumption decreased by 2.78%, 4.50%, and 6.58% respectively compared with its peak level. The decline of coal consumption under the OD3 scenario was the largest, followed by the OD2 scenario and OD1 sub-scenario, and the decline was much higher than that under the conservative development scenario.
Under the optimized development scenario, several main parameters when each sub-scenario reaches the peak of coal consumption are analyzed: under the OD1 scenario, the coal consumption peak will be reached in 2031, the GDP will be 195 trillion CNY, the proportion of secondary industry will be 36.8%, the coal consumption intensity of secondary industry will be 0.758, and the population will be 1.463 billion; under OD2 scenario, the coal consumption peak will be reached in 2030, with a GDP of 187 trillion CNY, a proportion of 35.7% in the secondary industry, a coal consumption intensity of 0.740 in the secondary industry and a population of 1.46 billion; under the OD3 scenario, the coal consumption peak will be reached in 2029, with a GDP of 178 trillion CNY, a proportion of 34.7% in the secondary industry, a coal consumption intensity of 0.718 in the secondary industry and a population of 1.457 billion. When the coal consumption peak is reached under the optimized development scenario, the GDP of the three sub-scenarios is relatively high, the proportion of the secondary industry decreases significantly, the industrial structure optimization is obvious, and the coal consumption intensity of the secondary industry decreases slightly, the coal utilization efficiency is slightly improved, and the population growth is small. OD1 scenario has the highest GDP, proportion of the secondary industry, coal consumption intensity, and population, which is slightly different from OD2 and OD3 scenarios.
3) Enhanced development scenario
SD scenario includes three sub-development scenarios: SD1, SD2, and SD3. The economic growth and population growth under the three sub-scenarios remain low, while the industrial structure and coal consumption intensity are different in different sub-development scenarios. Under the SD1 scenario, the industrial structure is industrial and the coal consumption intensity is low energy-saving; under the SD2 scenario, the industrial structure is balanced and the coal consumption intensity is medium energy-saving; under the SD3 scenario, the industrial structure is service-oriented and the coal consumption intensity is strong energy-saving. The peak value of China’s coal consumption under the enhanced development scenario is shown in Figure 6.
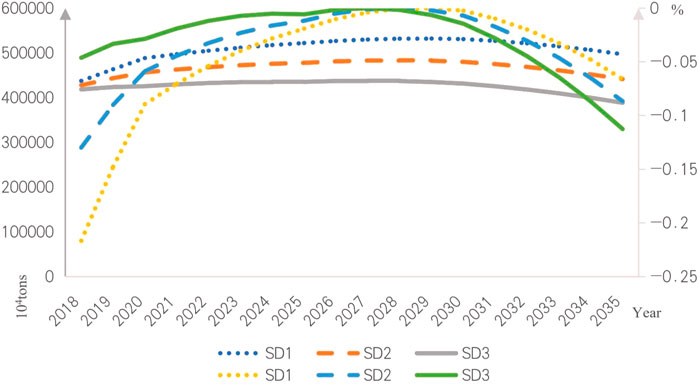
FIGURE 6. Gap between China’s coal consumption and peak value under the enhanced development scenario from 2018 to 2035.
Under the SD development scenario, the coal consumption peak in the SD1 scenario is the highest, reaching 5.321 billion tons, followed by the coal consumption peak in the SD2 scenario, reaching 4.834 billion tons, and the coal consumption peak in the SD3 scenario is only 4.378 billion tons, far lower than the peak in SD1 and SD2 scenarios. The coal consumption peak appears under the SD1 scenario in 2029, the SD2 sub-scenario in 2028, and the SD3 scenario in 2027. The peak time of coal consumption in the SD3 scenario is also earlier than that in the SD1 and SD2 scenarios. For the three sub-scenarios under the SD scenario, from 2018 to the peak coal consumption, the coal consumption increased by 21.66%, 12.99%, and 4.62% respectively, with a smaller and smaller growth rate. In 2035, coal consumption decreased by 6.60%, 8.67%, and 11.26% respectively compared with its peak level. It can be seen that adjusting the speed of industrial structure and coal consumption intensity under the enhanced development scenario is conducive to reducing the peak of coal consumption, the early arrival of the peak of coal consumption, and increasing the decline range of coal consumption after reaching the peak.
Under the enhanced development scenario, analyze several main parameters when each sub-scenario reaches the peak of coal consumption: under the SD1 scenario, the coal consumption peak will be reached in 2029, with a GDP of 165 trillion CNY, a proportion of the secondary industry of 37.3%, a coal consumption intensity of 0.818 in the secondary industry and a population of 1.45 billion; under the SD2 scenario, the coal consumption peak will be reached in 2028, with a GDP of 158 trillion CNY, a proportion of 36.3% in the secondary industry, a coal consumption intensity of 0.796 in the secondary industry and a population of 1.447 billion; under the SD3 scenario, the coal consumption peak will be reached in 2027, with a GDP of 151 trillion CNY, a proportion of 34.7% in the secondary industry, a coal consumption intensity of 0.774% in the secondary industry and a population of 1.444 billion. When the coal consumption peak is reached under the enhanced development scenario, the GDP of the three sub-scenarios is relatively low, the proportion of the secondary industry and the coal consumption intensity are reduced less, the coal utilization efficiency is improved less, and the population growth is less. SD1 scenario has the highest GDP, proportion of the secondary industry, coal consumption intensity, and population, which is slightly different from SD2 and SD3 scenarios.
Through the horizontal comparative analysis within the above three scenarios, we can draw a conclusion: that under the condition that the economic growth and population growth remain unchanged, the faster the adjustment speed of industrial structure and coal consumption intensity, the earlier the peak of coal consumption occurs, the slower the rise speed before reaching the peak, the smaller the growth range, and the faster the decline speed after reaching the peak, the greater the decline range; faster adjustment speed of industrial structure and coal consumption intensity. When the total coal consumption reaches the peak, the smaller the GDP, the lower the proportion of the secondary industry in the industrial structure, and the lower the coal consumption intensity of the secondary industry, the more effective it is to reduce the peak coal consumption, promote the arrival of the peak coal consumption in advance, make the industrial structure more reasonable and the coal utilization efficiency higher.
4) Cross-scenario comparative analysis
1) Comparison of CD1—OD1—SD1.
The industrial structure under the CD1 scenario, OD1 scenario, and SD1 scenario is industrial, and the coal consumption intensity is low energy-saving, but the economic growth and population growth are high under the CD1 scenario; under the OD1 scenario, economic growth and population growth are medium; under SD1 scenario, economic growth and population growth are low. Under the sub-scenarios of CD1, OD1, and SD1, China’s coal consumption from 2018 to 2035 and the gap from the peak are shown in Figure 7.
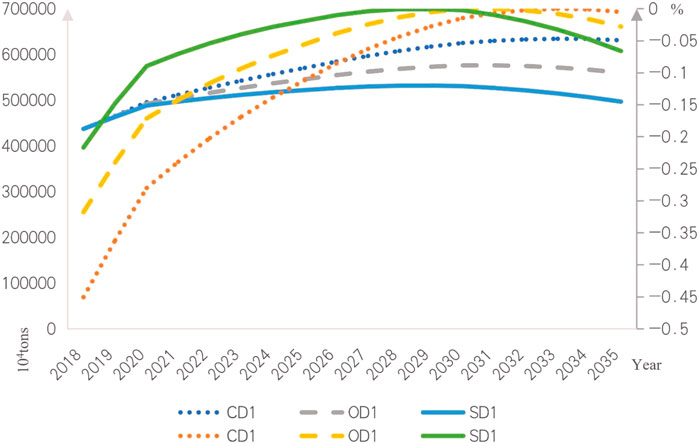
FIGURE 7. Gap between China’s coal consumption and peak value under CD1-OD1-SD1 scenario from 2018 to 2035.
It can be seen from the above figure that the sub-scenarios of coal consumption peak from early to late are the SD1 scenario, OD1 scenario, and CD1 scenario; the coal consumption peak is SD1 scenario, OD1 scenario, and CD1 scenario from low to high. The coal consumption peak under the CD1 scenario is 10.08% and 19.21% higher than that under the OD1, and SD1 scenarios. From 2018 to the peak of coal consumption, the growth rate of coal consumption in the CD1 scenario is the fastest, the OD1 scenario is the second, and the SD1 scenario is the slowest. It can be seen that under the condition of maintaining a low adjustment speed of industrial structure and coal consumption intensity, the higher the economic growth and population growth, the higher the peak of coal consumption, the later the occurrence time of the peak, the faster the rising speed before the peak, and the greater the growth range; the slower the rate of decline after reaching the peak, the smaller the decline range.
Compare several main parameters when the three sub-scenarios reach the peak of coal consumption: the GDP and population at the peak of coal consumption in the CD1 scenario are the highest, and the proportion of secondary industry and coal consumption intensity of secondary industry is the lowest; under SD1 scenario, the GDP and population at the peak of coal consumption are the lowest, and the proportion of secondary industry and coal consumption intensity of secondary industry is the highest; OD1 scenario is somewhere in between. Among them, the GDP difference at the peak of the three sub-scenarios is obvious. The highest GDP under the CD1 scenario is 23.7 billion CNY, 21.50% higher than the OD1 scenario and 43.94% higher than the SD1 scenario; the coal consumption intensity of the secondary industry varies greatly. The maximum coal consumption intensity of the secondary industry in the SD1 scenario is 0.818, which is 7.92% higher than that in the OD1 scenario and 17.87% higher than that in the SD1 scenario; there is little difference between the proportion of the secondary industry and the population.
2) Comparison of CD2—OD2—SD2
The industrial structure under the CD2 scenario, OD2 scenario, and SD2 scenario is balanced, and the coal consumption intensity is medium energy-saving, but the economic growth and population growth are high under the CD2 scenario; under the OD2 scenario, economic growth and population growth are medium; under SD2 scenario, economic growth and population growth are low. Under the sub-scenarios of CD2, OD2, and SD2, China’s coal consumption from 2018 to 2035 and the gap from the peak are shown in Figure 8.
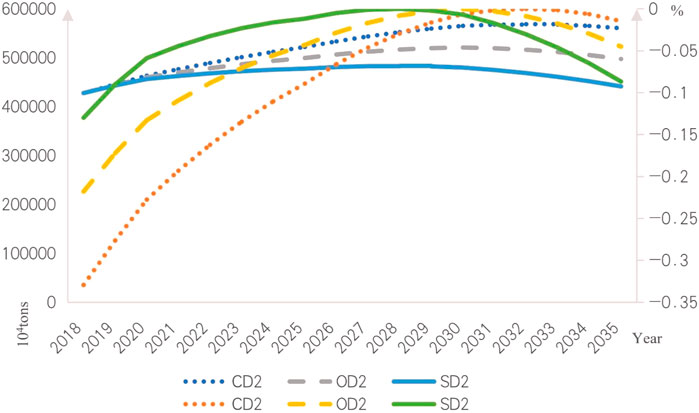
FIGURE 8. Gap between China’s coal consumption and peak value under CD2-OD2-SD2 scenario from 2018 to 2035.
It can be seen from the above figure that the sub-scenarios of coal consumption peak from early to late are the SD2 scenario, OD2 scenario, and CD2 scenario; the coal consumption peak is the SD2 scenario, OD2 scenario, and CD2 scenario from low to high. The coal consumption peak under the CD2 scenario is 9.15% and 17.65% higher than that under OD2 and SD2 scenarios. From 2018 to the peak of coal consumption, the growth rate of coal consumption in the SD2 scenario is the smallest, the OD2 scenario is the second, and the CD2 scenario is the slowest. It can be seen that under the condition that the industrial structure and coal consumption intensity maintain a medium adjustment speed, the higher the economic growth and population growth, the higher the coal consumption peak, the later the occurrence time of the peak, and the faster the rise speed before the peak, and the greater the growth range; the slower the rate of decline after reaching the peak, the smaller the decline range.
Compare several main parameters when the three sub-scenarios reach the peak of coal consumption: the GDP and population at the peak of coal consumption in the CD2 scenario are the highest, and the proportion of secondary industry and coal consumption intensity of secondary industry is the lowest; under SD2 scenario, the GDP and population at the peak of coal consumption are the lowest, and the proportion of secondary industry and coal consumption intensity of secondary industry is the highest; OD2 scenario is somewhere in between. Among them, the GDP at the peak of the three sub-scenarios varies greatly. The highest GDP under the CD2 scenario is 22.5 billion CNY, 20.81% higher than the OD2 scenario and 42.52% higher than the SD2 scenario; the coal consumption intensity of the secondary industry varies greatly. The highest coal consumption intensity of the secondary industry in the SD2 scenario is 0.796, which is 7.57% higher than that in the OD2 scenario and 17.75% higher than that in the SD2 scenario; there is little difference between the proportion of secondary industry and the number of population.
3) Comparison of CD3—OD3—SD3
The industrial structure under the CD3 scenario, OD3 scenario, and SD3 scenario is service-oriented, and the coal consumption intensity is high energy-saving, but the economic growth and population growth are high under the CD3 scenario; under the OD3 scenario, economic growth and population growth are medium; under SD3 scenario, economic growth and population growth are low. Under the sub-scenarios of CD3, OD3, and SD3, China’s coal consumption from 2018 to 2035 and the gap from the peak are shown in Figure 9.
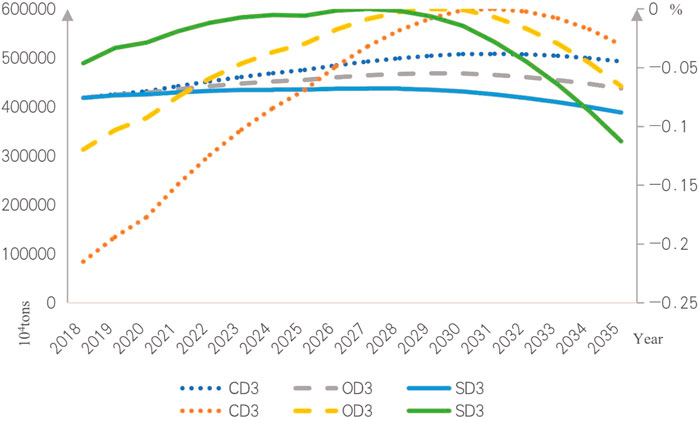
FIGURE 9. Gap between China’s coal consumption and peak value under CD3-OD3-SD3 scenario from 2018 to 2035.
It can be seen from the above figure that there is little difference in the coal consumption peak under the scenarios of CD3, OD3, and SD3, which are 5.084 billion tons, 4.685 billion tons, and 4.378 billion tons respectively; the coal consumption peak under CD3 scenario is the highest, 8.51% and 13.89% higher than that under OD3 and SD3 scenarios. The coal consumption peak under the SD3 scenario appears in 2027, which is significantly later than 2031 and 2029 under CD3 and OD3 scenarios. Under the SD3 scenario, the growth range before the peak is the smallest, but the decline range after the peak is the largest, the OD3 scenario is the second, and the CD3 scenario is the smallest. It can be seen that under the condition that the industrial structure and coal consumption intensity maintain a rapid adjustment speed, the higher the economic growth and population growth, the higher the peak of coal consumption and the later the occurrence time of peak; the faster the rise before the peak, the greater the growth range, especially in the SD3 scenario with the lowest economic growth and population growth.
Compare several main parameters when the three sub-scenarios reach the peak of coal consumption: the GDP and population at the peak of coal consumption in the CD3 scenario are the highest, and the proportion of secondary industry and coal consumption intensity of secondary industry is the lowest; under SD3 scenario, the GDP and population at the peak of coal consumption are the lowest, and the proportion of secondary industry and coal consumption intensity of secondary industry is the highest; OD3 scenario is somewhere in between. Among them, the GDP at the peak of the three sub-scenarios varies greatly. The highest GDP under the CD3 scenario is 21.4 billion CNY, 20.22% higher than the OD3 scenario and 41.22% higher than the SD3 scenario; the coal consumption intensity of the secondary industry varies greatly. The highest coal consumption intensity of the secondary industry in the SD3 scenario is 0.796, which is 7.80% higher than that in the OD3 scenario and 17.63% higher than that in the SD3 scenario; there is little difference between the proportion of secondary industry and the number of population.
Through the vertical comparative analysis of the above three sub-scenarios, we can draw a conclusion: that under the condition that the adjustment speed of industrial structure and coal consumption intensity remains unchanged, the lower the economic growth and population growth, the earlier the peak of coal consumption occurs, the slower the rise before reaching the peak, the smaller the growth range, and the faster the decline after reaching the peak, the greater the decline range; the lower the economic growth and population growth, the lower the GDP when the total coal consumption reaches the peak, the greater the proportion of the secondary industry in the industrial structure, and the higher the coal consumption intensity of the secondary industry, which can reduce the coal consumption peak to a certain extent, shorten the time of carbon peak and carbon neutralization, and reduce the difficulty of carbon neutralization.
4 Conclusion and policy recommendations
4.1 Conclusions
Through the system dynamics simulation experiment, this paper obtains the peak value of coal consumption and its corresponding occurrence time under multi scenarios; under the constraint of the carbon peak goal and the actual demand for economic development, it is still possible that China’s coal consumption has not reached the peak; the corresponding economic development level, industrial structure, coal consumption intensity and population structure under different scenario peaks before 2030 are clarified. The research conclusion show that:
1) According to scenario analysis, it is concluded that the peak time of China’s coal consumption is from 2027 to 2033, and the peak time of coal consumption is between 4.378 and 6.343 billion tons. Furthermore, this study assumes that China’s coal consumption has not yet peaked, and it considers factors such as China’s population, economy, and industrial structure at this stage. In addition to the research hypothesis, the context of the study differs from previous studies, which were all conducted before the introduction of the “Double Carbon” target. As a result, in comparison, this study is more pertinent in this new phase of development and can assist in providing reasonable guidance to the sector and industry in their development. At the same time, this study echoes China’s strategic goal of reaching carbon neutrality by 2030, and it is consistent with the reality that coal consumption will reach its peak by 2030.
2) Economic growth, industrial structure, coal consumption intensity, and population growth are discovered to have varying degrees of influence on the peak value and occurrence time of coal consumption peak. Economic growth has the greatest influence on peak coal consumption, followed by industrial structure and coal consumption intensity, with population growth having the least.
3) SD3 development scenario in this study is the optimal development path for coal consumption in China in the future. In this scenario, coal consumption will peak in 2027 at 4,378 million tons. If the future energy consumption trend is close to the SD3 scenario, the economic growth of society will slow down significantly, the population growth will slow down, the optimization of industrial structure will be high, and the coal consumption intensity will be low.
4) Through scenario setting and experimental simulation, it is concluded that the peak value of coal consumption is greatly different according to different development goals and transformation dynamics. Under the constraints of carbon peak and occurrence time of coal consumption peak, there are still many combination modes of coal consumption peak mode.
4.2 Policy recommendations
Through the prediction of coal peak under various scenarios, this paper expounds on the economic and industrial models of different coal consumption states in the future. Facing the multiple pressures among economic development, energy supply, and environmental regulation, to ensure the peak of transformation and the smooth realization of development objectives, the following suggestions are put forward:
1) Improve the design of the system and set up a loose and tight market control policy. Improving the political, economic, cultural, social, and ecological operating systems and introducing market mechanisms. Improve China’s carbon trading mechanism and form a reasonable carbon price. Carbon tax shall be levied in due time according to the operation of the carbon trading market. Provide systematic and holistic solutions for economic growth and coal consumption transformation, and ensure the smooth progress of economic development and energy transformation.
2) Stop local governments and enterprises from adopting “One-Size-Fits-All” energy substitution initiatives in the blind pursuit of short-term environmental performance. Fully study the relationship between other influencing factors and carbon emissions, as well as the differences in influencing factors between different regions. In particular, under the current system of power supply and heating operation, every effort should be made to avoid regional and seasonal energy shortages arising from the blind pursuit of coal removal and low carbon.
3) Establish an intelligent and efficient energy system based on clean energy. Promote energy conservation and efficiency gains in key energy-consuming industries and equipment, improve the level of science and technology, and promote the continuous decline of energy consumption per unit product. By the development requirements that the proportion of non-fossil energy consumption will reach about 25% by 2030, accelerate the improvement of the contribution rate of various new clean energy sources, and establish an efficient energy system based on the clean energy system.
4) Guide the whole people to live a Low-carbon life and actively promote international cooperation. Guide the whole people to develop a green and Low-carbon lifestyle from the consumer side, establish a new concept of environmental protection and Low-carbon, and force the production and circulation links to adopt consumption reduction. In the face of global climate change, China should advocate the concept of joint construction and win-win results, explore the path of common development, and lead global climate governance and cooperative action.
5 Limitations
There are some deficiencies in this study, but this is meaningful, and the research team will solve it in the next research work. There are many factors affecting coal consumption, but this paper does not consider all factors when building the coal consumption system dynamics model. There are the following reasons. First, the relationship between different influencing factors in economic phenomena is complex, and some of them have little impact on the peak value of coal consumption. Incorporating these influencing factors into the dynamic model of coal consumption system will eliminate the role of important influencing factors; Second, the influence of some influencing factors on the simulation results of coal consumption is not easy to measure, such as policy factors.
In future research, researchers can also consider the impact of price factors and coal supply on coal consumption. There is a certain deviation between the dynamic model of coal consumption system in this paper and the existing actual coal consumption system. Therefore, in future research, it is also necessary to include more influencing factors of coal consumption into this model, and further update and improve the research results through research means such as multi model prediction and comparison, so as to make the prediction closer to the actual situation, which can be used to guide the development of energy system and assist the formulation of environmental policies.
Data availability statement
Publicly available datasets were analyzed in this study. This data can be found here: All data used in this study are available publicly or upon request from the corresponding authors according to reasonable requirements.
Author contributions
WW provides ideas, funding acquisition and project administration for this article; XK are responsible for the realization of the thesis ideas, formal analysis, writing—original draft and editing; ZL polished the language of this article; YZ supported data curation and software.
Funding
This work was supported by the National Social Science Fund of China (Grant No. 16BJY054).
Conflict of interest
The authors declare that the research was conducted in the absence of any commercial or financial relationships that could be construed as a potential conflict of interest.
Publisher’s note
All claims expressed in this article are solely those of the authors and do not necessarily represent those of their affiliated organizations, or those of the publisher, the editors and the reviewers. Any product that may be evaluated in this article, or claim that may be made by its manufacturer, is not guaranteed or endorsed by the publisher.
References
BP Statistical Review of World Energy (2020). Statistical review of world energy 2020. Available at https://www.bp.com/en/global/corporate/news-and-insights/press-releases/bp-statistical-review-of-world-energy-2020-published.html.
Green, F., and Stern, N. (2017). China's changing economy: Implications for its carbon dioxide emissions. Clim. Policy 17 (4), 423–442. doi:10.1080/14693062.2016.1156515
Han, S., Chen, H., Long, R., and Cui, X. (2018). Peak coal in China: A literature review. Resour. Conservation Recycl. 129 (02), 293–306. doi:10.1016/j.resconrec.2016.08.012
Hao, Y., Liu, Y., Weng, J., and Gao, Y. (2016). Does the environmental Kuznets curve for coal consumption in China exist? New evidence from spatial econometric analysis. Energy 114, 1214–1223. doi:10.1016/j.energy.2016.08.075
Hao, Y., Zhang, Z., and Liao, H. (2016). China’s energy new normal: The forecasts for energy economy during the 13th five-year plan and by 2030. J. Beijing Inst. Technol. Soc. Sci. Ed. 18 (02), 1–7. doi:10.15918/j.jbitss1009-3370.2016.0201
IPCC (2007). Climate change 2007: Synthesis report, cambridge. http://www.ipcc.ch/publications_and_data/ar4/syr/en/contents.html.
Japan Economic Research Center (2016). China's economic growth will drop to 4.1% in 2025. Available at http://japan.people.com.cn/n/2015/0702/c35463-27244670.html.
Joint research group of the development research center of the State Council of the World Bank (2013). China in 2030: Building a modern, harmonious and creative society. Beijing: China finance and Economics Press.
Li, H., and Qin, Q. (2019). Challenges for China's carbon emissions peaking in 2030: A decomposition and decoupling analysis. J. Clean. Prod. 207, 857–865.
Li, W., and Yang, G. (2010). A study on the sustainable development of energy consumption in shanxi province based on system dynamics. Resour. Sci. 32 (10), 1871–1877.
Li, X., Lu, M., Wang, H., Feng, M., Lou, F., Zhang, B., et al. (2020). Research on the potential growth of the Chinese economy in the next15 Years and the main goals and indicators of economic and social. China ind. Econ. (04), 5–22. doi:10.19581/j.cnki.cieournal.20200422.001
Li, Y., Jin, X., Wang, G., Ren, Y., Tan, H., and Li, N. (2022). Construction and application of a carbon emission model for China’s coal production enterprises and result analysis. J. Clean. Prod. 10, 889877.
Lin, B., and Li, J. (2015). Transformation of China’s energy structure under environmental governance constrains: A peak value analysis of coal and carbon dioxide. Soc. Sci. China 09, 84–107.
Liu, B., Wang, J., Li, R. Y. M., Peng, L., and Mi, L. (2022). Achieving carbon neutrality – the role of heterogeneous environmental regulations on urban green innovation. Front. Ecol. Evol. 10, 923354. doi:10.3389/fevo.2022.923354
Liu, J., Xiahou, Q., Wang, K., Zou, J., and Kong, Y. (2019). Study on mid-and long-term low carbon development pathway of China’s industry sector. China Soft Sci. 11, 31–41.
Liu, R., Wang, G., Huang, N., and Ding, M. (2021). Research on the path of China's scientific and technological innovation supporting carbon peaking and carbon neutralization. Guangxi Soc. Sci. (08), 1–7. doi:10.3969/j.issn.1004-6917.2021.08.001
Maggio, G., and Cacciola, G. (2012). When will oil, natural gas, and coal peak? Fuel 98 (08), 111–123. doi:10.1016/j.fuel.2012.03.021
Mao, Z., Fan, R., and Chen, L. (2020). A dynamic SD forecasting model study and simulation for Chinese open economy system in the new era. Manag. Rev. 32 (06), 29–44. doi:10.14120/j.cnki.cn11-5057/f.20191127.006
Niu, L. (2016). China's GDP will exceed that of the United States around 2025. Available at http://finance.ifeng.com/a/20141221/13371888_0.shtml.
RUC Research Group of Macroeconomic Analysis and Forecasting, Renmin University of China (2020). China's macroeconomic report 2019-2020-China's macro-economics in the period of structural adjustment. Econ. Theory Bus. Manag. 1, 21–41.
State Council (2016). National population development plan (2016-2030). http://www.gov.cn/zhengce/content/2017-01/25/content_5163309.htm.
Su, K., and Lee, C. (2020). When will China achieve its carbon emission peak? A scenario analysis based on optimal control and the STIRPAT model. Ecol. Indic. 112, 106138. doi:10.1016/j.ecolind.2020.106138
Sun, X., and Wang, Z. (2021). Can Chinese families achieve a low-carbon lifestyle? An empirical test of China’s low-carbon pilot policy. Front. Energy Res. 9, 655733. doi:10.3389/fenrg.2021.655733
Tollefson, J. (2016). China’s carbon emissions could peak sooner than forecast. Nature 531, 425. doi:10.1038/531425a
Wang, Q., and Li, R. (2017). Decline in China's coal consumption: An evidence of peak coal or a temporary blip? Energy Policy 108 (09), 696–701. doi:10.1016/j.enpol.2017.06.041
Wang, X., Mao, Y., Duan, Y., and Guo, Y. (2022). A Study on China coal Price forecasting based on CEEMDAN-GWO-CatBoost hybrid forecasting model under Carbon Neutral Target. Front. Environ. Sci. 10, 1014021. doi:10.3389/fenvs.2022.1014021
Wu, G., and Niu, D. (2022). A study of carbon peaking and carbon neutral pathways in China's power sector under a 1.5 °C temperature control target. Environ. Sci. Pollut. Res. Int. doi:10.1007/s11356-022-21594-z
Xia, J., Li, R. Y. M., Zhan, X., Song, L., and Bai, W. (2022a). A study on the impact of fiscal decentralization on carbon emissions with U-shape and regulatory effect. Front. Environ. Sci. 10, 964327. doi:10.3389/fenvs.2022.964327
Xia, J., Zhan, X., Li, R. Y. M., and Song, L. (2022b). The relationship between fiscal decentralization and China’s low carbon environmental governance performance: The malmquist index, an SBM-DEA and systematic GMM approaches. Front. Environ. Sci. 10, 945922. doi:10.3389/fenvs.2022.945922
Xiang, X., Ma, M., Ma, X., Chen, L., Cai, W., Feng, W., et al. (2022). Historical decarbonization of global commercial building operations in the 21st century. Appl. Energy 322, 119401. doi:10.1016/j.apenergy.2022.119401
Zhang, H., and Li, Z. (2007). Affecting factors and projected scenarios for coal demand in China. J. China Coal Soc. 05, 557–560. doi:10.13225/j.cnki.jccs.2007.05.025
Zhang, S., Ma, M., Xiang, X., Cai, W., Feng, W., and Ma, Z. (2022). Potential to decarbonize the commercial building operation of the top two emitters by 2060. Resour. conservation, Recycl. 185, 106481. doi:10.1016/j.resconrec.2022.106481
Zhang, X., Karplus, V. J., Qi, T., Zhang, D., and He, J. (2016). Carbon emissions in China: How far can new efforts bend the curve? Energy Econ. 54, 388–395. doi:10.1016/j.eneco.2015.12.002
Zhou, J., Du, S., Shi, J., and Guang, F. (2017). Carbon emissions scenario prediction of the thermal power industry in the Beijing-Tianjin-Hebei region based on a back propagation neural network optimized by an improved particle swarm optimization algorithm. Pol. J. Environ. Stud. 26 (3), 1895–1904. doi:10.15244/pjoes/68881
Keywords: system dynamics, Chinese coal, consumption peak, prediction, scenario analysis
Citation: Wang W, Kao X, Lin Z and Zhang Y (2022) Has China’s coal consumption really peaked?—Prediction and scenario analysis of China’s coal consumption peak under the double-carbon target. Front. Environ. Sci. 10:974763. doi: 10.3389/fenvs.2022.974763
Received: 21 June 2022; Accepted: 20 September 2022;
Published: 06 October 2022.
Edited by:
Rita Yi Man Li, Hong Kong Shue Yan University, Hong Kong SAR, ChinaReviewed by:
Hong-Dian Jiang, China University of Geosciences, ChinaMinda Ma, Tsinghua University, China
Copyright © 2022 Wang, Kao, Lin and Zhang. This is an open-access article distributed under the terms of the Creative Commons Attribution License (CC BY). The use, distribution or reproduction in other forums is permitted, provided the original author(s) and the copyright owner(s) are credited and that the original publication in this journal is cited, in accordance with accepted academic practice. No use, distribution or reproduction is permitted which does not comply with these terms.
*Correspondence: Xiaoxuan Kao, a3h4QHN0dWRlbnQuY3VtdGIuZWR1LmNu