 Zhenzhao Xia
 Jingyin Mao
 Guangyao Chen3
 Yao He
94% of researchers rate our articles as excellent or good
Learn more about the work of our research integrity team to safeguard the quality of each article we publish.
Find out more
ORIGINAL RESEARCH article
Front. Environ. Sci. , 18 October 2022
Sec. Environmental Economics and Management
Volume 10 - 2022 | https://doi.org/10.3389/fenvs.2022.972677
This article is part of the Research Topic Carbon Neutrality Approaches in Buildings and Agriculture Sectors View all 12 articles
The tunnel construction process is accompanied by high resource consumption and non-negligible greenhouse gas emissions. Reducing the carbon emissions from this process is an issue that should be considered in the decision-making stage. For tunnel construction using the drill-and-blast process, selecting a reasonable excavation scheme is a feasible method for reducing carbon emissions. This paper proposes an evaluation index system that takes into account the stability of the tunnel construction process and the reasonable assessment of carbon emission levels. For various scenarios with different focus on stability requirements, theoretical deductions are used to filter out the key indicators that should be used as assessment items. For the determination of carbon emission assessment indicators, this study is guided by the life cycle theory, and in the determined calculation boundary, the reference of previous projects and expert opinions are selected as the item source to fill the unfavorable situation in which the carbon emissions of different excavation schemes cannot be accurately calculated because of the lack of bills of quantities in the engineering decision stage. This paper also proposes an intelligent decision method based on a support vector machine to better complete the task of calculating and ranking the utility of excavation schemes to adapt the proposed multi-factor parallel evaluation system. Finally, the proposed decision indicator system and decision method were applied to the selection of the excavation scheme in an engineering case, and reasonable and realistic scoring results were obtained.
The choice of tunnel construction excavation method based on the drill and blast method determines whether the tunnel construction can meet the required technical and economic demands. Different excavation methods have different engineering effects in different rock conditions and other realistic situations; the choice of the appropriate excavation method will have a positive effect on the safety as well as economic aspects of the project; the current common method of comparative selection work is based on pure numerical simulations, or numerical simulations combined with theoretical calculations, field monitoring, and experiments are used to compare stability indicators such as stress distribution and deformation conditions, either individually or independently of each other: Gong et al. (2009) used finite element numerical simulation to analyze vault displacements, surface settlements, intermediate rock column stresses, and stability of surrounding rock in three different excavation schemes. Jiang et al. (2012) used dynamic numerical simulation to sort double drifts method, CD method and CRD method, and select the best excavation method from them for the evaluation items of vault subsidence, horizontal displacement of intermediate rock column, horizontal displacement of surrounding rock and variation of plastic zone in surrounding rock. Li et al. (2014) used finite element numerical simulations to compare and analyze the feasibility of the CD method and the three-bench seven-procedure excavation method from the perspectives of the surrounding rock deformation, stress field changes and initial support stresses in the corresponding projects. Mou et al. (2017) compared the bench method, CRD method and core soil method from the perspectives of arch top settlement, arch bottom uplift, horizontal convergence and arch internal force distribution; Jiang et al. (2018) conducted a comprehensive calculation and comparison from surrounding rock to support system from the perspectives of arch top settlement, arch bottom uplift, side wall convergence, surrounding rock stress, initial support internal force, and second lining internal force for the CD method and two types of bench methods, the calculation and comparison of the three methods are carried out from the perspective of the surrounding rock to the support system. In some studies, numerical simulations were combined with field monitoring and testing and complemented each other to achieve more comprehensive and realistic analysis results (Liu and Zhang, 2011; Zhou et al., 2013; Hou et al., 2017).
In addition to the evaluation of independent stability indicators for the comparison and selection of tunneling methods, studies related to the selection of methods using comprehensive evaluation theory or optimization decision theory also exist (Zhang et al., 2007; Golestanifar et al., 2011; Bi et al., 2013; Zheng, 2016; Wu et al., 2020; Wu et al., 2021). But they are basically case-by-case special applications, none of which is comprehensive and general evaluation guidelines have not been formed. On the other hand, most of the evaluation methods used in the traditional evaluation index system require the calculation of combined weight coefficients. When the evaluation index system is complex, an excessively large weight matrix will cause calculation difficulties, so we can try to propose a calculation model without weight coefficients to simplify the evaluation of the scheme under complex indexes. While the use of intelligent methods for decision making has emerged in the last 30 years (Sellak et al., 2017; Fu et al., 2020) and its essence is the adaptive identification and generation of patterns between decision elements and decision options, which has the underlying characteristic of not relying on weights.
At the same time, the traditional process of selecting engineering solutions is too sparse to consider carbon emissions, but Miliutenko et al. (2012) point out that the greenhouse gas emissions caused by tunneling are much larger than those of other engineering constructions, and under the trend of increasingly significant attention to carbon emissions by governments and organizations (Liu et al., 2022; Xia et al., 2022), research work on the qualitative, quantitative, and control of carbon emissions in the construction process is gradually being carried out: Guo et al. (2020) summarized the carbon emission calculation boundary and existing calculation methods for tunneling projects; Ahn et al. (2010) conducted a carbon footprint tracking and quantification study using the direct carbon emission calculation method for the carbon emissions of the TBM method portion of the North Edmonton Public Health Trunk Line Tunnel in Canada; Morris et al. (2016) conducted a study on the Hong Kong Cross-Harbor Tunnel project and summarized the set of factors to be considered in the selection of the method during tunnel construction, including application demand factors, site geotechnical constraints, length and section use factors, and ecological and environmental impacts. These studies provide a basis for further investigations of carbon emission patterns during tunnel construction.
In addition to the differences in applicability under different geological conditions, the environmental impact factors, such as carbon emission levels, are also very different among the different methods. Therefore, for future tunnel excavation scheme selection, it is necessary to introduce reasonable carbon emission evaluation indicators and integrate them with traditional indicators, and to adopt more efficient evaluation criteria and calculation methods to adapt multi-attribute decision models with hierarchical relationships. Therefore, an intelligent evaluation method based on support vector methods, a machine learning-based approach to pattern recognition and mapping, was proposed to solve the scheme ranking problem, and feasible solutions were obtained for selected engineering cases.
When considering the idealist scheme for the main purpose of stabilizing the excavation process, the grade and specific nature of the surrounding rock, as well as other original environmental factors, are the primary factors in the scheme decision. The selection of a reasonable evaluation indicator system to comprehensively, jointly, and effectively assess the mechanical behavior and deformation of the surrounding rock before and after excavation using various methods is key to accurately determining the most appropriate construction scheme.
Due to the existence of the three-dimensional effect of the excavation face, the rock at the front end of the excavation face can maintain temporary stability; under the coupling effect of the bell-shaped constraint along the tunnel axis direction section and the circular constraint on the plane section perpendicular to the axis (Sun and Zhu, 1994), the convergence deformation of the section within a certain distance from the current excavation palm face is suppressed, in order to describe the effect more intuitively and accurately, the displacement release coefficient is introduced, that is, the displacement of point
with the introduction of the displacement release coefficient, the above equation can be rewritten as
where is the distribution of the virtual support force along the excavation axis at the excavation surface, note
It is not difficult to find from Figure 1 that the maximum radial convergence deformation occurs at a certain distance from the excavation face; therefore, in the monitoring and simulation process, the location of monitoring points or numerical calculation of the value of the cross-section should be elected at a distance of more than three times the diameter of the palm face. Therefore, for the need for a comprehensive and full assessment, it should be clear that according to the division of the critical area, the stability of the excavation face, and the radial stability of the section of the two elements needs to be judged independently, and the stability of the excavation face is not the only element of the stability of the excavation process.
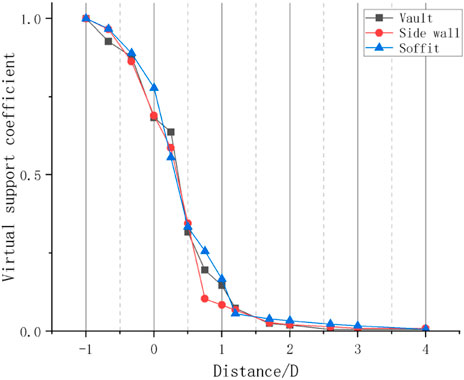
FIGURE 1. Virtual support force distribution in tunnel space.
The stability of the excavation face can be further discussed, and the excavation face can be further divided into palm, side wall, and vault faces. For weak and fractured rocks, the excavation palm face often cannot hold itself and undergoes large deformation and fragmentation, and it is necessary to pay attention to the convergence deformation of the palm face if it is not clear whether the corresponding work method will cause serious destabilization problems, such as collapse.
The calculation of the mechanical effect is mainly performed by numerical simulation based on finite element (Zhao, 2012; Real et al., 2015; Song et al., 2019), discrete element (Xiang et al., 2018; Wu et al., 2020; Chen et al., 2022) or the finite difference method (El Omari et al., 2021; Zaheri et al., 2021; Bai et al., 2022), The distribution of the plastic zone of the surrounding rocks is evaluated against the calculation, but most of the cases are limited to direct comparison, and the reasons for the appearance of the plastic zone and the influence of the plastic zone on the calculation results were not analyzed, which sometimes caused some deviation in the process of evaluating the excavation scheme only by numerical simulation. Criteria for assessing stratigraphic stability. The stress redistribution caused by excavation is the main reason for the plastic zone, but the perturbation of the surrounding rock during excavation can also cause the plastic zone of the adjacent rock to expand further, and the existence of cases (Song et al., 2019) can confirm this. The elastic modulus of the surrounding rock in the plastic zone is weakened, which requires the selection of the physical property parameters of the surrounding rock for simulation work to be more refined, and the modulus of the disturbed rock body needs to be discounted if the corresponding plasticity criteria are selected. This simplification can be avoided if the corresponding plasticity-reduction damage criterion is selected; otherwise, it can cause considerable differences between the calculated results and actual effects. It is worth mentioning that the means of reducing the geotechnical strength parameters are more commonly used to indirectly discover the potential structural risks of underground works; this reduction is also desirable in the simulation process of direct demonstration of tunnel construction flows or final results.
During tunnel excavation, the elastic modulus, cohesion, and shear angle of the surrounding rock in the plastic zone change to some extent (Zhang et al., 2016), but given that changes in different parameters have different effects on the deformation of the tunnel in each zone, that is, they have different sensitivities to the results, it is not necessary to focus on all material parameter changes. According to relevant studies (Huang et al., 2008; Wang and Chen, 2012), the sensitivity of the elastic modulus to convergence deformation and settlement is higher than that of cohesion, shear angle, and Poisson’s ratio, and it is feasible to correct the elastic modulus only for the plastic zone. There are two common ways to describe the elastic modulus variation in the plastic zone: pressure-dependent elastic modulus (PDM), which considers the change in the elastic modulus of the plastic part of the surrounding rock to be based on the hydrostatic pressure
Because both the stress redistribution in the surrounding rock and the disturbance during excavation are closely related to the distance, and
where
The distribution of the annular elastic-plastic zone of the surrounding rock is as follows:
For the above equation, assume that n < 0, that is, the elastic modulus inside the plastic zone is smaller than the elastic modulus of the free face, and then substitute the calculation will come to the opposite conclusion, which means n ≥ 0 is correct, and further it is not difficult to find that if n > 0, the elastic modulus of the plastic zone is constantly smaller than the elastic modulus of the interface of the elastic-plastic zone, and reach the minimum and maximum value in the free face and the interface of the elastic-plastic region, respectively (As shown in Figure 2); According to the above rules, in the process of numerical simulation, the criteria of discounting the material parameters into the plastic deformation stage should be introduced as much as possible, and if the applicable constitutive model cannot be introduced, the equivalent elastic modulus change in the plastic zone should be considered to be directly discounted, and when the shape of the section is more regular, the above expression of elastic modulus can be introduced to calculate directly, and those cases with situ sampling or real-time monitoring conditions can collect samples and data to make combinational correction. It can be seen that the plastic zone, as an indicator to be considered in the process of scheme comparison, is not only for direct comparison, but also for the excavation schemes with large disturbances of the surrounding rock, and the analysis of the area of the plastic zone of the section and the evolution process with the flows can be more intuitive and clearer for analyzing the final impact of the disturbance.
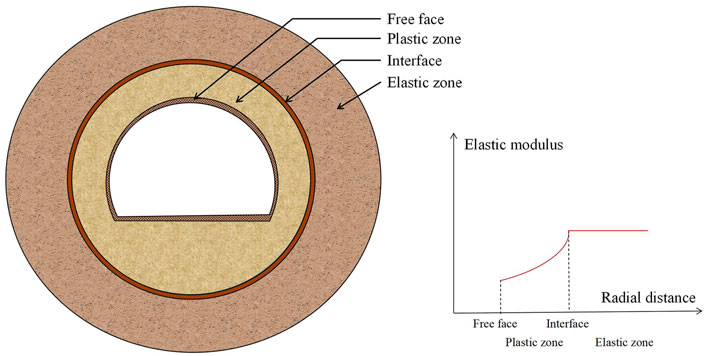
FIGURE 2. Elastic modulus distribution of the annular elastic-plastic zone of the surrounding rock in excavated tunnel.
When it comes to the specific excavation scheme selection, for the judgement criteria of the surrounding rock deformation, the most used indicator is the vault settlement (Liu and Zhang, 2011; Hou et al., 2017), followed by the arch foot or other free convergence deformation. There are also some engineering cases (Gong et al., 2009) because of the special nature of the rock that needs to investigate the longitudinal displacement of the arch foot or arch bottom and to be adjusted in time, and the calculation and investigation of the surrounding rock stress mainly rely on stress nephograms, especially in cases with special structures Sun as the center columns.
In summary, when considering the judgement criteria for evaluating the applicability of each excavation scheme in terms of rock stability, it is possible to consider the selection of indicators, such as vault settlement, arch foot settlement, or other parts of the headroom convergence, plastic zone, and stress nephograms.
For shallow buried tunnels built in urban areas, there is less tolerance for ground settlement caused by their engineering behavior because they are often adjacent to a large number of buildings and other infrastructure, and it is necessary to establish and refine the evaluation indicators of alternative excavation methods based on the examination of the causes of ground settlement. The main methods for the quantitative assessment of ground deformation caused by underground excavation are the Peck method and stochastic medium method (SMM).
The Peck method was first proposed by Peck (1969) based on the analysis of a large amount of actual measurement data, and it has been refined by other scholars since then, and eventually the modified peck equation for urban underground tunnelling emerged, as well as the analysis of the process mechanism corresponding to the equation (Rankin, 1988), which is a near-complete answer to the question of the characteristics of the Peck method, and how to tailor it to fit with different geotechnical conditions.
While the stochastic medium method (SMM) was first proposed by Litwiniszyn (1958), which were first applied in mining engineering and then extended to the analysis of engineering problems in urban underground space construction (Han and Li, 2007). Together with the Peck method, they have become two common methods for the study of surface settlement patterns. The evolution and control factors of ground settlement and surface deformation induced by tunnel excavation were analyzed by deriving their unified forms and comparing their similarities and differences.
The modified Peck method (Rankin, 1988), which is widely used today, describes the ground settlement trough cross-section as a normally distributed curve, and the model expression is:
where
where
Stochastic medium theory considers that the process of ground subsidence and displacement caused by the excavation of underground space is the superposition of the subsidence effect of the excavation of infinite micro-units. The complexity of geotechnical parameters and mechanical behavior makes micro-unit a “stochastic medium,” so the settlement performs a random nature and takes a micro-unit analysis; when it is in a state of unconsolidated undrained and complete collapse, the longitudinal displacement of any point on the upper surface plane is:
The integral equation of it is as follows:
where
Generally, it is considered that the major influence area of the settlement trough is a funnel shape centered on the tunnel, and the expression of the major influence area of the settlement trough (Knothe, 1957) is as follows:
where
In accordance with the full radial convergence form of the tunnel proposed by Han and Li (2007), for integration over the collapsed area, the surface settlement expression can be derived as
By definition, Eq. 5 is the integral of the fully collapsed micro units in the fully convergent collapsed region, and Eq. 5 can be rewritten as
Comparing Eq. 7, it is easy to find that the two forms are unified when there exists
When the excavation section scale is much smaller than the burial depth, the calculation results are consistent if both adopt the same assumption of normally distributed curved section settlement troughs. The transformation of
When the tunnel burial depth is shallow, the excavation scale is not negligible compared with the burial depth, and when the superposition of Gaussian curves of surface settlement caused by collapsing microunits does not fully comply with the normal distribution, the
When it is necessary to focus on the influence of different excavation schemes on ground settlement, the observed or simulated value of ground settlement can be selected as the primary indicator, and the maximum plastic zone of the surrounding rock, amount of arch settlement, and amount of free convergence represented by the arch foot convergence as key indicators, as auxiliary reference items for direct calculation results to strengthen the reliability of the demonstration.
Rock pressure is the pressure directly acting on the support structure system caused by the deformation of the surrounding rock and is the main source of load for the support system. The deformation pressure is the main and most common form of pressure, which refers to the internal force of the support and the contact stress between the supports caused by the deformation of the surrounding rock. When the buried depth of the tunnel is shallow, it is difficult for the surrounding rock to form a complete pressure arch, and the pressure acting on the structure is approximately linearly distributed according to the buried depth. When the buried depth reaches the depth at which the surrounding rock forms a complete pressure arch, the pressure acting on the tunnel structure only comes from the surrounding rock, which is called deep burial. The lack of a pressure arch and uneven pressure distribution are the fundamental reasons for the design of temporary and permanent support for shallow and ultra-shallow buried tunnels, which is much more difficult than for deep buried tunnels because the support systems at this point not only need to directly share the extra active load, which is offset by the original arch effect in deep buried zones, but also to offset the more significant induced ground settlement than in the deep buried area; therefore, it is necessary to establish an evaluation indicator system for support stability based on relevant theories and existing work for shallow or ultra-shallow buried tunnels.
Under the guidance of the New Austrian Tunneling Method (NATM) concept developed on the basis of the continuous medium theory, the elastic resistance of the support plays an important role in limiting the further development of the surrounding rock deformation. Therefore, discussing the coupling effect between the support and the surrounding rock is a reasonable way to make a reasonable selection and ranking of the evaluation indicators involving the stability of the support system. The convergence-confinement method is commonly used for the stability analysis of tunnel rock-support coupling systems (Paraskevopoulou and Diederichs, 2018). The idea is to examine the convergence curves of the rock and support at the same scale and analyze the state when they reach the same value of convergence steady state, and to consider the support and rock as a stable joint system rather than as individual isolated load-bearing elements. In the process of the convergence-confinement method, it is particularly useful to use the surrounding ground reaction curve (GRC), support characteristic curve (SCC), and longitudinal deformation curve (LDP), of which the first two are the curves describing the relationship between stress and displacement of each medium, respectively, and the latter is the curve describing the distance between the section deformation and excavation surface. All three considered the mechanical and geometric properties of different rock masses in different engineering environments during the time scale excavation process. Under the assumption that the deformation of the surrounding rock eventually converges, the GRC will intersect the horizontal coordinate, that is, the radial stress is zero (as shown by the black curve in Figure 3), which means that the surrounding rock can eventually stabilize itself after releasing sufficient deformation, even if no support is provided. However, in the case of shallow buried tunnels, where the strength of the surrounding rock is extremely weak and the self-gravity of the plastic zone is extremely pronounced, the curve will show an upward trend (as shown by the red curve in Figure 3), indicating that the application of support is essential from the point of view of maintaining the tunnel section. In most cases, the purpose of the support system is to limit the development of radial convergence of the surrounding rock by artificially creating a new pressure-deformation state. It can be further seen that the stiffness of the support is designed to cope with the surrounding rock pressure, and the joint GRC-SCC curves show that with the development of convergence deformation, the surrounding rock pressure will be reduced appropriately, and in its place is the question of whether the development of the surrounding rock deformation can meet the design requirements. Therefore, the assessment of the support can be transformed into the assessment of the pressure and deformation state of the surrounding rock support system when it reaches the steady state by relying on the convergence confinement method curves, which correspond to the stress and deformation of the surrounding rock in the process of selecting different excavation methods.
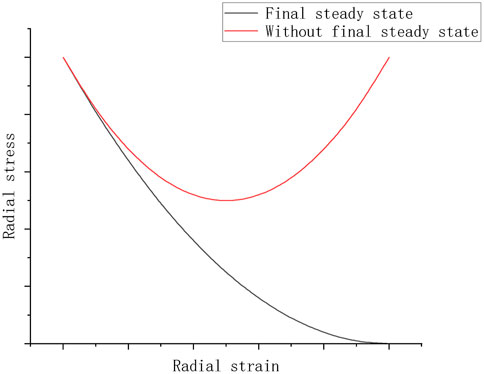
FIGURE 3. GRC curves for two different stable state of tunnel excavated section.
For tunnel structures with secondary lining or composite linings, the scheme assessment of the final state often ignores the initial support and only considers the global support role of the secondary lining, resulting in the calculated values of the surrounding rock pressure acting on the secondary lining being greater than the support pressures of the secondary lining, and the results tend to be conservative (Tang, 2009), thus only through the internal stress of the secondary lining to assess the impact of different methods on the final stability of the support is feasible; however, to assess the stability of the support during the current method, it is inevitably necessary to discuss the internal stress and deformation before and after the closure of the support.
In the support and lining system, shotcrete, cast-in-place concrete, and steel arches are continuous units that fit well to the tunnel section, whereas anchor rods are relatively individual units that are discrete in the joint support system. The main indicator factor for measuring the stability of anchor rods is the axial tensile force, which can be measured by numerical simulation or sensors such as anchor rod axial force meters in the field and laboratory (Li et al., 2018), Based on this, the anchor rod stress diagram of the test section can be generated to determine whether the anchor rods as significant support members maintain a high degree of cooperation with the mechanical process of the rest of the support system under the current excavation scheme, thus achieving a common support effect.
The process of quantifying carbon emissions is an effective combination of the currently existing carbon footprint tracing and carbon emission calculation processes; the former aims to clarify the latter calculation boundary, and the latter accumulates the carbon emission effects of each node marked by the former tracing based on available information (e.g., bill of quantities); however, there are two main problems in assessing the differences in carbon generation between each excavation scheme: 1) Most scheme evaluation stages do not have clear and detailed lists of the corresponding projects, so it is impossible to carry out accurate carbon emission calculation; 2) The calculated carbon generation under different calculation boundaries is different, and different standards may even produce different horizontal comparison results for alternative excavation schemes. For the first problem, the reference values can be obtained by investigating the calculation results of existing projects and adding some key indicators for reference correction; thus, the problem can be transformed into statistics of carbon emission data of different excavation methods and determination of the remaining evaluation indicators. For the latter problem, it is necessary to determine a broad-spectrum estimation model under a strong envelope framework to adapt to the application of engineering cases with actual situation changes.
Carbon emissions in the strict definition are the general terms for greenhouse gases (methane, nitrogen oxides, sulfur hexafluoride, HFCs, etc., including carbon dioxide) produced in the engineering process, all of which are converted into carbon dioxide equivalent values
In the tunnel construction process, the most direct source of carbon emissions is the carbon oxides and nitrogen oxides generated by the operation of the fuel machinery, excluding the carbon generated by the energy consumption of the machinery. The emissions generated by the production and transportation of various engineering materials and energy sources have a considerable impact on the environment, even in terms of emissions far beyond the direct application phase (Chen, 2017); Furthermore, when examining the tunnel construction process, the excavation and support (including over-support and rock support) and lining construction will involve large amounts of concrete and steel components (anchors, steel arches, etc.,), and the input of consumables in subsequent drainage prevention works, roadbed pavement works, and ventilation and lighting works is also a non-negligible factor, but only for the excavation scheme selection phase of tunnel construction, its consideration needs not be extended to the stage after the main body of the tunnel is formed, so the calculation boundary is shown in Figure 4.
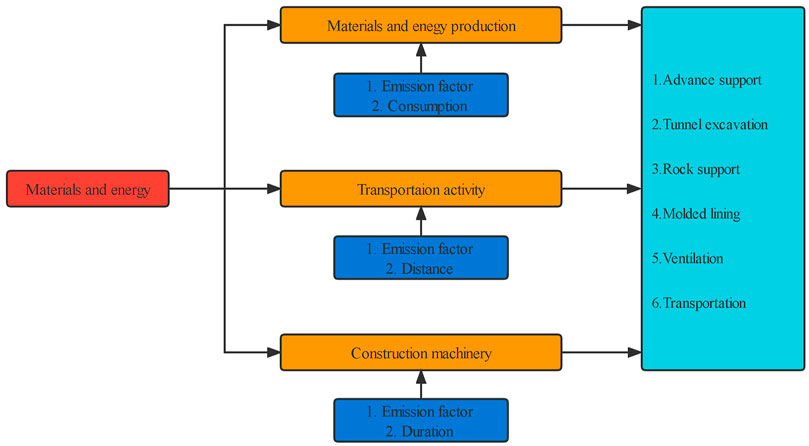
FIGURE 4. Calculation boundary of carbon emission in tunnel construction process.
Using this calculation boundary as the guide, a preliminary quantification of the key nodes of carbon emissions for the entire process of tunnel construction is discussed in conjunction with existing engineering cases (Guo et al., 2019): the tunnel in this case is located in Sichuan Province, China, which is a double-bore highway tunnel with four lanes, combining the designs and survey in the pre-construction stage mentioned in the corresponding literature, other organizational process assets and information provided by the upstream supply chain, as well as combining the IPCC, CLCD database, Chinese national official data, etc., the process of production and transportation of engineering consumables and energy transportation are converted into carbon emission equivalents, and the emissions of various types of energy and materials (Guo et al., 2020) are obtained, based on which the contribution of different processes and different materials and energy sources to the carbon emissions of the whole process are as Figures 5, 6 show.
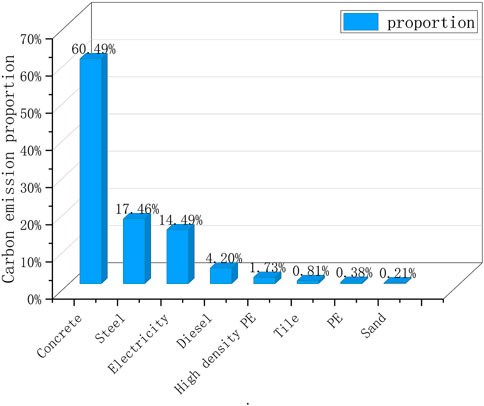
FIGURE 5. Carbon emission proportion of different materials and energy used in tunnel construction.
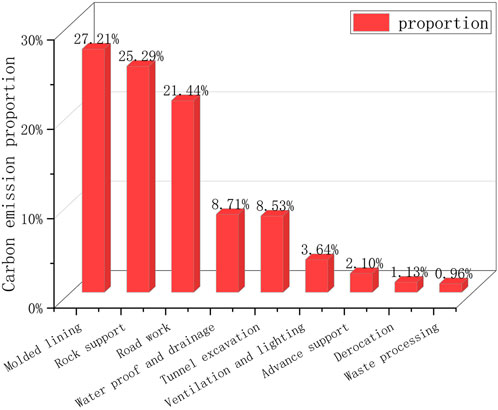
FIGURE 6. Carbon emission proportion in different procedure in tunnel construction.
As can be seen from the figures, the initial support work and the secondary lining (i.e., molded lining) work contribute the most carbon emissions in the construction implementation (27.53% and 25.59%). From the perspective of energy and materials, concrete accounts for 60.49% of global emissions and steel accounts for 17.46% of global emissions, which shows that carbon emissions from support work is an absolutely non-negligible factor under the guidance of the life cycle theory, which provides guidance for the addition of carbon emission assessment indicators. For example, although the single-side drift method and both side drift methods are both benching excavation methods with side drift (s), their support workloads are significantly different, so it is obvious that the carbon emission values of the two methods are not equivalent under the same objective conditions. Therefore, it is necessary to introduce the support construction workload as an indicator to participate in the measurement of carbon emission indicators and to make a reference comparison table according to the bill of quantities of the existing works for the comparison of subsequent methods.
As the mechanization level of tunnel drilling and blasting construction processes has been increasing in recent decades, the contribution of electricity to carbon emissions in terms of energy consumption is as high as 17.46%, which is much higher than that of diesel (4.60%). The calculation of carbon emissions caused by mechanization can give priority to electricity consumption to be considered, so electricity consumption can be used as a supplementary indicator to evaluate the carbon emissions for different schemes.
The mean values of carbon emissions under different excavation scheme series have been presented in the relevant literature (Guo et al., 2020), based on which other data sources (Yang, 2003; Zheng, 2016; Chen et al., 2020) were incorporated to derive more comprehensive statistics on the scale as shown in Table 1.
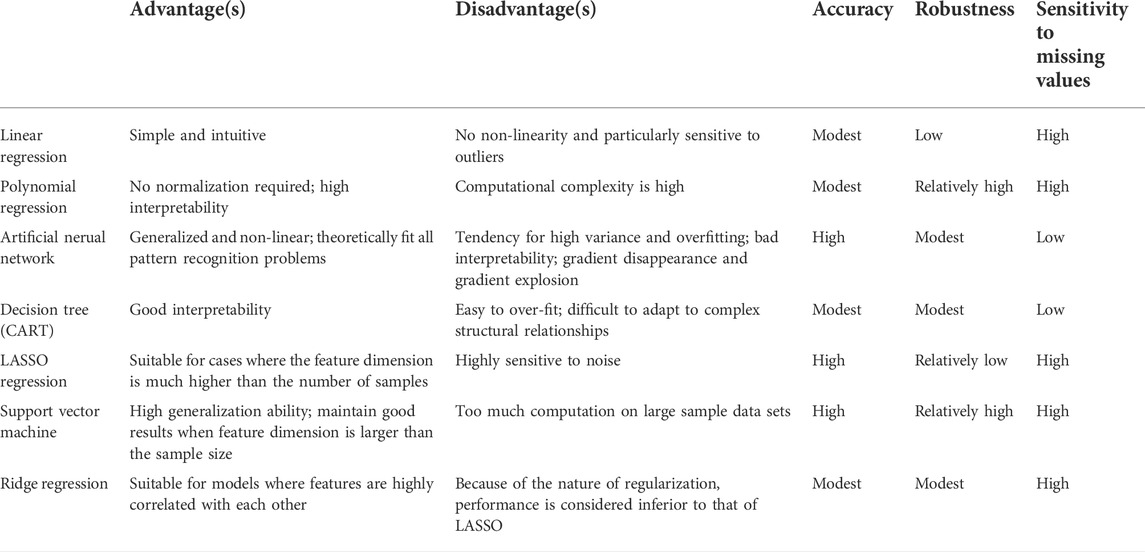
TABLE 1. Comparisons of 7 main machine learning algorithms used in regression tasks.
On this basis, further research is conducted to summarize the reference values of the average amount of concrete and steel consumption per linear meter for more specific common excavation methods such as the center diagram method, center cross diagram method, and both-side drift methods. The results are as Table 2 shows.
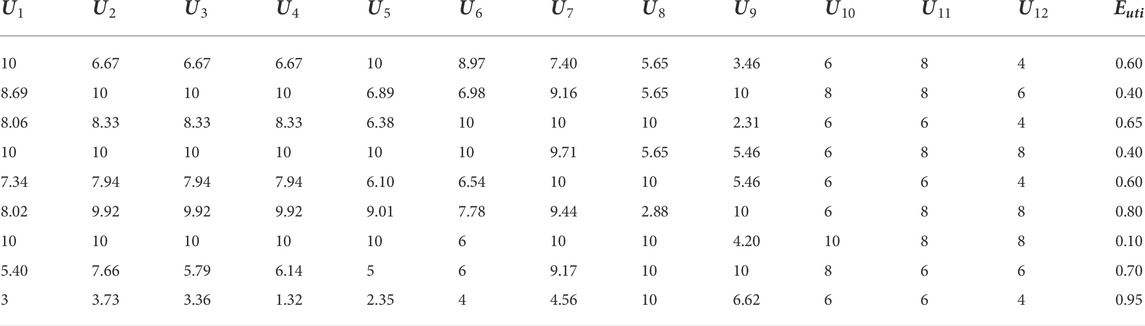
TABLE 2. Learning samples of each indicator and utility scores based on previous engineering case.
The above tables provide a reference basis for the decision-making stage of excavation methods in the absence of a detailed bill of quantities, and the integration of expert scoring to assess the gap between each excavation method on each project is also needed, because the same excavation method in the application process inevitably performs differently for various engineering conditions; the introduction of expert scoring is a way to inhibit the emergence of this unfavorable situation, which will be discussed further in subsequent sections.
According to the results of the above discussion, in the absence of the bill of quantities, the following carbon emission evaluation indicators proposed for different tunnel excavation schemes are listed: average value of total emissions in previous cases, reference value of concrete consumption in previous cases, reference value of steel consumption in previous cases, expert scoring value of total emissions in the current method, expert scoring value of concrete consumption in the current method, and expert scoring value of steel consumption in the current method.
When the quantification of all alternative excavation schemes is completed and the bill of quantities is clear, the evaluation indicators are the value of total emissions of each method, the reference value of concrete consumption in previous cases, the reference value of steel consumption in previous cases, the consumption of concrete in the current method, the consumption of steel in the current method, and the carbon emission equivalent of electricity in the current method.
Summarizing the previous, all indicators in attribute layer are now unified into a parallel relationship to realize that different attributes can be flexibly combined to adapt to different realistic requirements, and the recommended evaluation indicator systems are given as follows.
The indicator variables that must be included in the evaluation indicator system are vault settlement (monitoring and numerical simulation), at least one free convergence value represented by the arch foot (monitoring and numerical simulation), maximum principal stress (numerical simulation), and area (ratio) of the plastic zone (numerical simulation).
The system indicator variables selected according to the actual engineering cases are soffit deformation (monitoring, numerical simulation), vertical displacement associated with the free convergence represented by the arch foot (monitoring and numerical simulation), displacement at the bench intersection (monitoring, numerical simulation), and convergence displacement of the palm face (monitoring and numerical simulation).
The variables that must be included in the evaluation indicator system are the maximum surface settlement (monitoring, numerical simulation), vault settlement (monitoring, numerical simulation), at least one pair of vertical displacements represented by the arch foot (monitoring, numerical simulation), and plastic zone area (ratio) (numerical simulation).
The system variables selected according to the actual engineering cases are soffit deformation (monitoring, numerical simulation) and displacement at bench intersection (monitoring and numerical simulation).
The variables that must be included in the evaluation indicator system are the deformation of the surrounding rock at the vault (monitoring and numerical simulation), at least one pair of free convergence values of the surrounding rock represented by the foot arch (monitoring and numerical simulation), the area (ratio) of the plastic zone (numerical simulation), the maximum bending moment/tension of the closed initial support (numerical simulation), and the final lining stress (numerical simulation).
Based on the actual engineering situation, the following system variables were selected: elevation deformation of arch foot (monitoring, numerical simulation), vertical displacement associated with support prograde convergence represented by arch foot (monitoring and numerical simulation), surrounding rock displacement at bench intersection (monitoring, numerical simulation), anchor tension (monitoring, numerical simulation), maximum bending moment/tension of steel arch (numerical simulation), and other inter-media forces (monitoring and numerical simulation).
Scheme decisions in practical cases may need to take into account a variety of stability factors at the same time, so it is necessary to re-add or organize the evaluation indicator system, but must be included in the evaluation indicator system are: vault settlement (monitoring, numerical simulation), at least a pair of free convergence values (monitoring, numerical simulation), plastic zone area (ratio) (numerical simulation), at least one medium of stress or internal force distribution (monitoring, numerical simulation).
Additional measurement and evaluation items should be added according to the other requirements in the design plan.
Among the available comprehensive evaluation models, the most commonly used to select excavation schemes in tunnel engineering are the analytic hierarchy process (AHP) (Li et al., 2019), TOPSIS, fuzzy comprehensive evaluation, and other evaluation methods with weight coefficients.
Using the optimal excavation scheme selection of Xiaozhai tunnel using the AHP method (Zheng, 2016) as an example, it clarifies the target layer, program layer, and criterion layer objects after arguing the actual aspects of the project, establishes the judgment analysis matrix on this basis, transforms the priorities of all qualitative indicators into a quantitative matrix in the process of pairwise comparison with the help of linguist terms (Table 3), performs a consistency test, generates the sorting results under each criterion, and obtains the final selection results. Although there are only five evaluation criteria and four evaluation schemes, the computational process to be followed is slightly tedious, and the four judgment analysis matrices need to be tested sequentially in the consistency test. Once any direction (criterion or alternative program) is extended or both are extended at the same time, the computational expense increases significantly and the matrix consistency is more difficult to guarantee strictly; meanwhile, the process cannot be simplified.
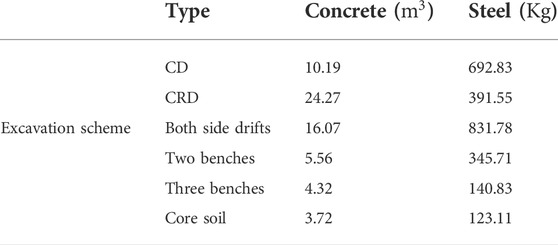
TABLE 3. Reference values of average concrete and steel consumption per linear meter for different excavation schemes.
Although the TOPSIS method has fewer subjective factors than the AHP, the entropy weight method, which is the main basis for the calculation of weight coefficients, requires sufficient experimental data to support, which increases the difficulty of practical application. In the study of the optimal excavation method for the southern limb of the access line of Tiantongyuan Station of Beijing Metro Line 17 (Wu et al., 2020), engineers relied on in situ section testing and set up 16 orthogonal tests to derive four evaluation indicator weights, which caused a certain amount of time and resource consumption.
To address the shortcomings of the above evaluation methods, the following improvement requirements were proposed and used as a basis to explore a comprehensive evaluation method based on machine learning techniques:
1) It can directly, conveniently and effectively combine experts’ engineering experience with numerical simulation and field measurement results;
2) It has relatively fixed evaluation pattern without tedious weight computation;
3) It has good scalability;
4) It has good programmability and executability in computing equipment.
Initial idea is to turn the evaluation problem into the quantifiable regression problem. There are many existing machine learning algorithms available for regression tasks, but different mechanisms imply differences in the applicability of the algorithms to specific problems. We conducted comparisons of the available algorithms, and the ensemble learning algorithms were not considered due to performance overflow. Seven mainstream algorithms were finally selected, and the results of the comparison are as Table 4 shows.
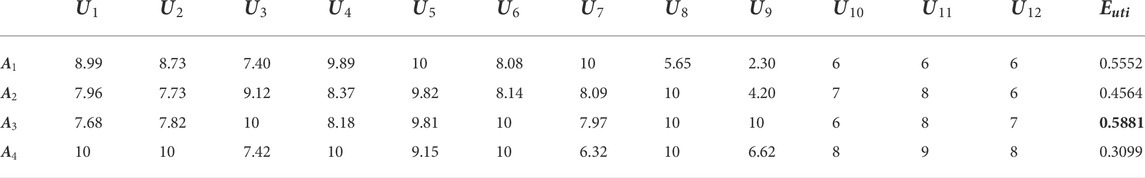
TABLE 4. Scoring results of each excavation scheme in this case.
Considering that the proposed evaluation system is a mixture of independent attributes (stable and non-stable factors) and correlated attributes (e.g., surface settlement and convergences), it is clear that both LASSO and ridge regression algorithms are not applicable to the evaluation task proposed in this paper. Only the CART algorithm among decision tree algorithms is competent for the regression task, and the pruning in the process implies particularly tedious computation, especially when the hierarchical relationships are complex (i.e., when there are many decision attributes). Artificial neural network method has been applied in existing study (Ghasemi and Asgharizadeh, 2014) and exposed the problem of fluctuating prediction results due to overfitting, so there is still a need for enhancement. For linear regression and polynomial regression, both are prone to the extremes of overfitting and underfitting, and are too sensitive to noisy samples.
Although the support vector machine method has some drawbacks, such as low tolerance for missing values and too much computation on large sample data sets, it is worth noting that based on the evaluation index system, the sample size we build cannot be too high and all the missing key indicators should be re-simulated to ensure the quality of the index data, so the support vector machine is worth being considered as the computational module.
The excavation scheme selection problem belongs to the multi attribution decision making (MADM) problem, which can be solved by coupling the support vector machine with the utility function approach (Wang et al., 2006), This refers to the use of a multi-attribute utility function (MAUT) by constructing a mapping of performance in each attribute to the overall utility value of each scheme, and then ranking the utility values of each scheme to determine the priorities for each alternative scheme.
In the previous decision methods, attribute weights reflect the degree of difference between attributes and the importance of the attributes to the decision maker. However, the proposed method only needs to learn the expert’s decision pattern by learning the scoring values under each attribute of the alternative excavation scheme in previous projects and the utility values calibrated with the actual project, without the direct calculation of each attribute weight coefficient.
Support vector machine is a powerful machine learning algorithm, which is based on decision boundary theory and replicates the mapping relationship between samples and labels. As one of supervised learning models, there are two phases in SVM regression process: learning phase and regression phase. In the learning phase, input training dataset is used to train the SVM model, in which a decision boundary is formed from an optimum separating hyperplane that best fits all data samples. Data samples that lie on the decision boundary are namely Support Vectors (SVs), which are defined in the learning phase and are then used for the regression tasks.
The following paper focuses on its combination with multi-attribute utility functions (MAUT) and briefly describes how this SVM-MAUT method can be used in case applications for alternative evaluation. The flow of SVM-MAUT model can be shown as Figures 7, 8, Tables 5, 6 show.
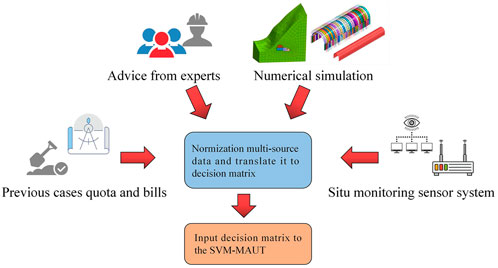
FIGURE 7. The input source of SUM-MAUT model used in the excavation scheme evaluation tasks.

FIGURE 8. Flow of SVM MAUT.
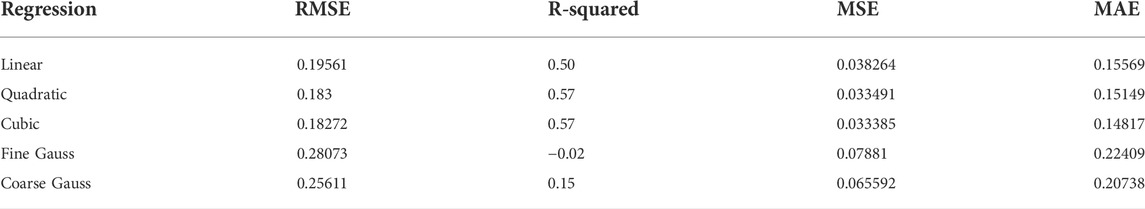
TABLE 5. Comparison of the effectiveness of training results under five regression models.
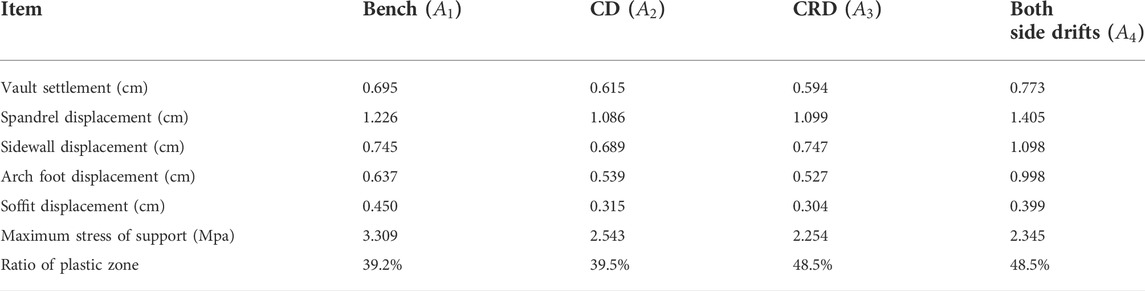
TABLE 6. Numerical simulation results of tunnel section in alternative excavation scheme.
For the scheme evaluation and selection summarized in the existing works, the scores of each attribute indicator are standardized by a decimal system, and the indicators that need to be scored by experts are assigned a decimal system following a linguist terms table. The continuous-valued indicators from tests or simulations are decimalized on a uniform scale; the final utility is specified as a continuous decimal between 0 and 1; this transformation and quantification criterion is common to all training, validation, and test set data.
In the process of previous scheme selection, especially in the description of the plastic zone, most of the literature did not use detailed data to express, but used vague linguist descriptions such as “large” and “small” to describe, for such subjective factors that lead to the uncertainty of the indicators, it is necessary to introduce the linguist terms table (Table 3) that can maintain the accuracy and is compatible with the system to correct it; for cases where too much natural linguist scales is used to describe the indicator, it cannot be used as learning samples due to the model requirement of accuracy and robustness.
The main advantages of this method are as follows:
1) It is not necessary to know which schemes were chosen by the experts in which comparison tasks; only the combination of attribute values and total utility values of a certain scale can be learned to capture the expert’s decision pattern and generate memory of the expert’s decision orientation with the corresponding pattern.
2) This method bypasses the previous problems of converting qualitative concepts to quantitative representations (i.e., the affiliation function problem) or unifying the scales in the process of fusing continuous and discrete values.
3) The attributes corresponding to the project set and the evaluation index system can theoretically be expanded without restriction within the acceptable range of computational expense, and the size of the consistency matrix of AHP, for example, is limited to 15, which cannot meet the requirements of scheme evaluation when the type of indicator is beyond 15.
In this study, the excavation scheme selection for a shallow buried subway tunnel under the existing highway at Xiamaixi Station of Guiyang Metro Line No. 1 was considered as an engineering case (Song et al., 2019). The total length of the tunnel is 528 m, and the line is designed as a single two-lane structure, with a total of 110 m of tunnel under the highway embankment and culvert exit.
The geological conditions of the shallow buried tunnel under the highway are poor, and the geotechnical investigation report shows that the geological components of the underpass section are mainly shale and the quaternary soil layer, the rock fragmentation degree belongs to grade V surrounding rock, the highway road surface is 23 m from the vault of the underpass tunnel, and the highway should be used during tunnel construction. Therefore, the tunnel section in this case is a classic shallow buried tunnel with various challenges in terms of engineering stability. The combination of vault settlement, free displacement of the spandrel, side wall, and arch foot, vertical displacement of the soffit, plastic zone ratio, and maximum stress of the initial support were selected as the stability factor part of the index system to evaluate the alternative excavation schemes in this case. The alternative excavation schemes included the up and down bench method (
Using the 3D finite element calculation models built on MidasGTS/NX, the optimal excavation scheme was obtained by simulating four different excavation schemes considering the three-dimensional effect during the tunnel excavation process and comparing the indicators of displacement field changes and stress conditions under different excavation schemes. In view of the complexity of the geological conditions, the model was simplified by treating both the tunnel envelope and soil as anisotropic, and the yield criterion was adopted from the Mohr-Column criterion. In the actual construction, the anchor rods were made of steel, and the initial support and secondary lining were mainly reinforced arch and concrete; therefore, their yield criterion was linear elasticity, and the 2D unit simulation was used. The equivalent modulus of elasticity of the initial support was calculated using the aforementioned discounting strategy and simulation method.
To avoid the aforementioned three-dimensional effects, the middle section of the tunnel (X = 85.5 m) was selected for the analysis and comparison.
In the Midas simulation, the steps of the bench method were as follows: the upper bench was constructed first; the length of the upper bench was 20 m per cycle; the lower bench was constructed; and the distance between the upper and lower steps was 20 m. The construction steps of the CD method were as follows: excavating the left side of the tunnel first, then excavating the right side of the tunnel; the CRD method construction steps were as follows: the left side of the tunnel section and the right side of the tunnel were excavated alternately; both side wall drifts method was similar to the CD method; the steps were as follows: first, the left side of the tunnel was excavated, the intermediate core soil was preserved during this period, and then the middle section of the tunnel was excavated. Except for the bench method, each cycle advance was 3 m in length for all three remaining schemes. The results of the simulation are as follows:
Considering that previous cases of excavation scheme evaluation and selection were carried out without bills of quantities, the non-stability factors of the evaluation index system consisted of the reference value of total emissions and steel consumption in previous cases, and the total emissions and consumption of concrete and steel in the current method judged by experts.
According to the reference comparison table based on the bill of quantities of the existing works, there are obvious differences between bench methods and side drift methods (CD, CRD, and both-side wall drift wall method) in mean values of carbon emissions, while the more detailed gap between the three alternative schemes has not been presented due to the limitation of statistical results; therefore, we scored all the three methods in the side drift method series in values of 10 in the comparison sorting process, while the values of the bench method have been scored as 5.65 after decimal normalization; the scores of the four schemes in
The expert scoring indicators are
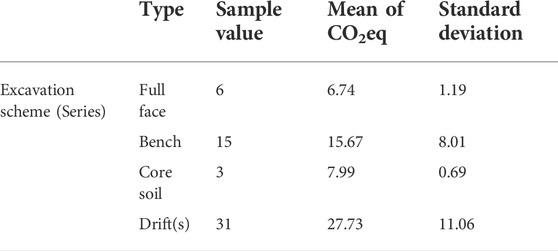
TABLE 7. Summary of the average carbon emission equivalent values for different excavation schemes (series).
As Figure 9 shows, there are 12 types of indicators in the evaluation index system designed to evaluate this case, based on which learning samples have been constructed (Zhang, 2012; Mou et al., 2017), and all the samples should contain complete information for each indicator. In other words, the missing value should not appear in this process because of the sensitivity to missing values in support vector machine algorithm, which is a difficult line for the determination of learning samples. To address this requirement, some supplementary numerical simulations were executed, and the description of the plastic zone was translated according to the proposed linguistic terms. All utility scores were determined by experts. The samples are as follows:
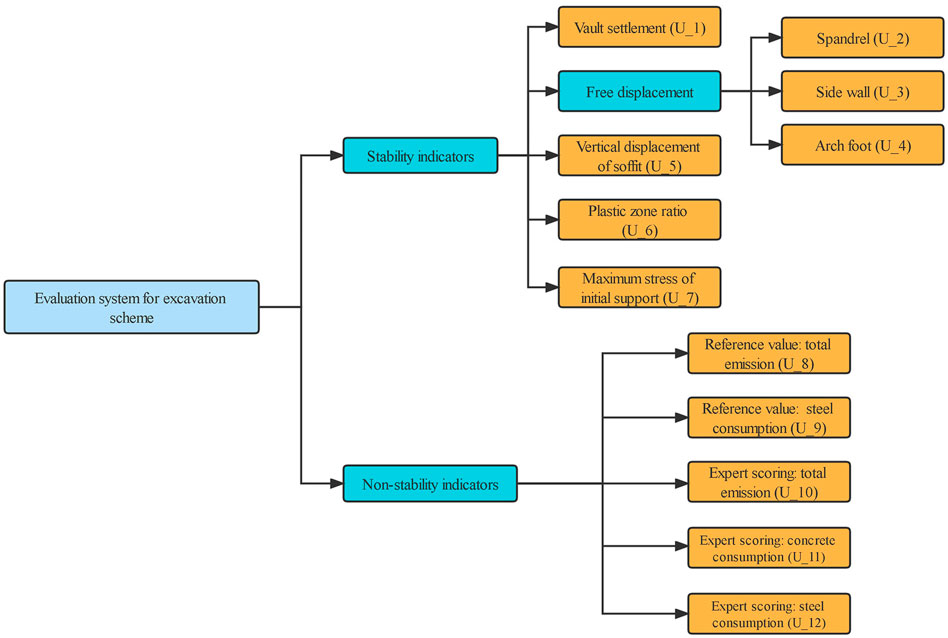
FIGURE 9. Evaluation index system used in this case.
In this study, five regression models (i.e., kernel functions) used in the support vector process were considered, and the model with the best performance (RMSE validation) was determined as the final regression model used in subsequent studies. The performance measurements for each regression model are as Table 7 shows.
The SVM with the cubic kernel function was determined because of its idealist performance in RMSE. Then, by inputting all the normalized data for indicators of the four alternative schemes to the pretraining model, the utility ranking scores can be calculated as Table 8 shows:
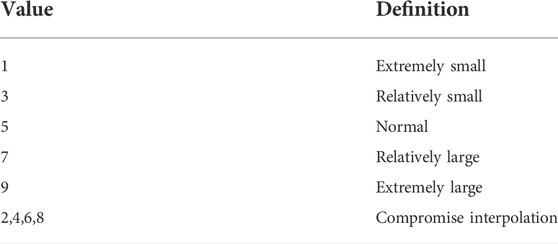
TABLE 8. Linguistic terms used in proposed model.
It is easy to observe that the CRD method has the highest score, which indicates that the CRD method is the optimal solution for carbon emission control under the premise of maintaining safety stability, while the bench method cannot be the optimal solution because it cannot provide sufficient capacity to maintain stability; however, the both-side wall drift method has the lowest score after fully considering the carbon emission factor, which indicates that the scoring model effectively integrates the elements based on the existing engineering samples and expert experience, and effectively realizes the concept of safety factors as the dominant factor proposed in this paper.
The basic process of TOPSIS is to first normalize the original data matrix to obtain the normalized matrix to eliminate the influence of each index scale, and find the optimal solution and the worst solution among the finite solutions, and then calculate the distance between each evaluation object and the optimal solution and the worst solution respectively to obtain the relative proximity between each evaluation object and the optimal solution, which is used as the basis for evaluating whether the solution is ideal or not.
Previous indicator combination (
Normalization process follows equations as below:
Obviously, the normalized matrix
The distances between each object (each scheme in this case) and idealist or worst objects can be determined as follows:
The score of objects (schemes) can be defined as follows:
Corresponding indicator samples have been selected from Tables 3, 8. The scores of 4 alternative schemes are: 0.3248 (
This paper attempts to combine several theoretical approaches with realistic scenarios, discusses the association between indicators that can be directly observed, and indicators such as mechanical laws that cannot be directly observed. Finally, we summarize and select several collections of evaluation indicators with different orientations based on priority ranking, which provide widely applicable and clear guidance for the selection of stability criteria in excavation scheme evaluation.
For the scheme selection process using numerical simulation analysis as the main data source, this study points out a detailed requirement for the specific orientation of the measurement items and the distribution of measurement points based on relevant theories. For the calculation model using the simplified yield criterion (i.e., the constitutive models without considering the weakening of material properties), the mechanical parameters based on the distribution law of the plastic zone should be discounted and corrected under the premise of accuracy requirements, so as to avoid the error of comparison results caused by the over-simplification of the model. At the same time, it is clearly pointed out that the plastic zone also measures the degree of excavation disturbance of the current excavation method.
Based on the premise of stability indicators, this study also proposes a corresponding method for measuring and evaluating the degree of carbon emissions of different excavation schemes. In view of the objective reality that the engineering inventory is generally lacking in the feasibility evaluation stage, this study takes the carbon emission calculation boundary guided by the life cycle theory as the guide, fully considers and uses a combination of previous engineering data and expert experience, and uses the advantages of each to eliminate the uncertainty of other methods. Thus, the credibility of the results of considering the carbon emission difference of different schemes is further enhanced.
In addition, this paper critically discusses the traditional methods of comprehensive evaluation and ranking based on weight coefficients and points out the problems of cumbersome procedures and large workloads in the calculation of weight coefficients in this series of methods. The scoring method is called the support vector machine-multi attribute utility function method, which combines the measured data, expert scores, simulation results, and previous engineering data in the same computational model and greatly improves the executability of the multi-attribute evaluation by using the superiority of machine learning algorithms in pattern capturing and pattern reproduction. The optimal scheme ranking in the selected case was calculated after integrating the new objectives, achieving effective unification of carbon emission control and construction safety requirements in the scheme selection.
In order to demonstrate the feasibility of the proposed evaluation method, the paper combines the selected engineering cases and compares it with the TOPSIS method at the end, and the comparison results show that the proposed evaluation method is more reliable than the ranking results calculated by the TOPSIS method.
The original contributions presented in the study are included in the article/supplementary material, further inquiries can be directed to the corresponding author.
ZX contributed to conception and design of the study, wrote the main body of the manuscript. JM and YH revised sections of the manuscript and format. GC and DW proposed some supplementary and DW is as the funding represent to funded the research. All authors contributed to manuscript revision, read, and approved the submitted version.
This research was funded by the Youth Science and Technology Innovation Fund of the Anhui and Huaihe River Institute of Hydraulic Research (KY202004).
We sincerely thank the Anhui and Huaihe River Institute of Hydraulic Research for the financial support of this study. Furthermore, Prof. Song and his team at the Xi’an University of Architecture and Technology offered us many materials in tunnel engineering to support our research. As the corresponding author, I would like to thank Ms. Schwarz in Rhode Island for her spiritual and academical support of my personal work and for being there for me in my darkest moments from 2020 to 2021.
The authors declare that the research was conducted in the absence of any commercial or financial relationships that could be construed as a potential conflict of interest.
All claims expressed in this article are solely those of the authors and do not necessarily represent those of their affiliated organizations, or those of the publisher, the editors and the reviewers. Any product that may be evaluated in this article, or claim that may be made by its manufacturer, is not guaranteed or endorsed by the publisher.
Ahn, C., Xie, H., Lee, S., Abourizk, S., and PEñA-Mora, F. (2010). Carbon footprints analysis for tunnel construction processes in the preplanning phase using collaborative simulation. Constr. Res. Congr., 1538–1546. Innovation for Reshaping Construction Practice, 2010.
Bai, Y., Li, X., Yang, W., Xu, Z., and Lv, M. (2022). Multiscale analysis of tunnel surrounding rock disturbance: A PFC3D-flac3d coupling algorithm with the overlapping domain method. Comput. Geotechnics 147, 1–13. doi:10.1016/j.compgeo.2022.104752
Bi, L., Ren, B. Y., Zhong, D. H., and Hu, L. X. (2013). “Evaluation and optimal selection of diversion tunnels construction simulation schemes based on multi-level fuzzy comprehensive evaluation,” in Applied mechanics and materials (Tianjin, China: Trans Tech Publ), 1361–1365.
Chen, J., Ge, H., Zhou, Z., Hu, T., and Yang, J. (2020). Comparison and selection of construction methods for large-span tunnel in jointed rock mass based on carbon emission assessment. J. Guizhou Univ. Sci. 37, 86–91. doi:10.15958/j.cnki.gdxbzrb.2020.01.15
Chen, L. (2017). “Study on characteristics and influencing mechanism of road tunnel traffic carbon emission,” in Eng master (Chongqing, China: Chongqing Jiaotong University).
Chen, L., Jin, A., Wu, S., Chu, C., and Li, X. (2022). Numerical study on spalling failure of rock surrounding deep buried tunnel based on DEM. Comput. Geotechnics 145, 1–21. doi:10.1016/j.compgeo.2022.104653
El Omari, A., Chourak, M., Cherif, S.-E., Ugena, C. N., Rougui, M., Chaaraoui, A., et al. (2021). Numerical modeling of twin tunnels under seismic loading using the finite difference method and finite element method. Mater. Today Proc. 45, 7566–7570. doi:10.1016/j.matpr.2021.02.519
Ewy, R., and Cook, N. (1990). Deformation and fracture around cylindrical openings in rock—I. Observations and analysis of deformations. Int. J. rock Mech. Min. Sci. geomechanics Abstr. 27, 387–407. doi:10.1016/0148-9062(90)92713-O
Fu, H., Manogaran, G., Wu, K., Cao, M., Jiang, S., and Yang, A. (2020). Intelligent decision-making of online shopping behavior based on internet of things. Int. J. Inf. Manag. 50, 515–525. doi:10.1016/j.ijinfomgt.2019.03.010
Ghasemi, A. R., and Asgharizadeh, E. (2014). Presenting a hybrid ANN-MADM method to define excellence level of Iranian petrochemical companies. J. Inf. Technol. Manag. 6, 267–284. doi:10.22059/jitm.2014.50864
Golestanifar, M., Goshtasbi, K., Jafarian, M., and Adnani, S. (2011). A multi-dimensional approach to the assessment of tunnel excavation methods. Int. J. Rock Mech. Min. Sci. 48, 1077–1085. doi:10.1016/j.ijrmms.2011.07.001
Gong, J.-W., Xia, C.-C., Zhu, H.-H., and Tang, Y. (2009). Optimal analysis of construction schemes for Heshangsmall-space tunnels with large section. Rock Soil Mech. 30, 236–240. doi:10.16285/j.rsm.2009.01.011
Guo, C., Xu, J., Yang, L., Guo, X., Liao, J., Zheng, X., et al. (2019). Life cycle evaluation of greenhouse gas emissions of a highway tunnel: A case study in China. J. Clean. Prod. 211, 972–980. doi:10.1016/j.jclepro.2018.11.249
Guo, C., Xu, J., and Zhang, J. (2020). Calculation methods and prediction models of carbon emission of tunnel construction. Tunn. Constr. 40, 1140–1146. doi:10.3973/j.issn.2096-4498.2020.08.005
Han, X., and Li, N. (2007). Comparative analysis of strata prediction models for ground movement induced by tunnel construction. Chin. J. Rock Mech. Eng. 26, 594–600. doi:10.3321/j.issn:1000-6915.2007.03.022
Hou, F., Sun, K., Zhao, R., Zhou, H., Xu, W., Zhou, Z., et al. (2017). Applicability study on construction method of super-large section neighborhood tunnel. China Civ. Eng. J. 50, 111–116. doi:10.15951/j.tmgcxb.2017.s1.020
Huang, S., Feng, X., and Zhang, C. (2008). Study of method of comprehensive evaluation for parameters of constitutive model of rock mass. Chin. J. Rock Mech. Eng. 27, 2624–2630. CNKI:SUN:YSLX.0.2008-S1-009.
Jiang, K., Xia, C.-C., and Bian, Y.-W. (2012). Optimal analysis of construction schemes of small space tunnel with bidirectional eight traffic lanes in jointed rock mass. Rock Soil Mech. 33, 841–847. doi:10.16285/j.rsm.2012.03.032
Jiang, X., Li, K., Li, C., and Zhang, L. (2018). Alternative selection for soft rock tunnels with high ground stress. Mod. Tunn. Technol. 2. doi:10.13807/j.cnki.mtt.2018.S2.040
Kielbassa, S., and Duddeck, H. (1991). Stress-strain fields at the tunnelling face—three-dimensional analysis for two-dimensional technical approach. Rock Mech. Rock Eng. 24, 115–132. doi:10.1007/BF01042857
Knothe, S. (1957). “Observations of surface movements under influence of mining and their theoretical interpretation,” in Proceedings of the European congress on ground movement (Leeds, UK, 9–12.
Li, B., Wu, L., Zuo, Q. J., Chen, J., and Yuan, Q. (2014). Study on the optimization of construction methods and circulation measurement parameters for super-large cross section tunnel under complicated geological conditions. Saf. Environ. Eng. 21, 159–164. doi:10.13578/j.cnki.issn.1671-1556.2014.04.032
Li, K., Jia, C., di, S., Zhang, J., and Yu, W. (2018). Monitoring analysis on the mechanical properties for tunnel support system under full section excavation. Chin. J. Undergr. Space Eng. 14, 860–868. CNKI:SUN:BASE.0.2018-S2-052.
Li, R. Y. M., Chau, K. W., and Zeng, F. F. (2019). Ranking of risks for existing and new building works. Sustainability 11, 1–26. doi:10.3390/su11102863
Litwiniszyn, J. (1958). Statistical methods in the mechanics of granular bodies. Rheol. Acta 1, 146–150. doi:10.1007/BF01968857
Liu, B., Wang, J., Li, R. Y. M., Peng, L., and Mi, L. (2022). Achieving carbon neutrality–the role of heterogeneous environmental regulations on urban green innovation. Front. Ecol. Evol. 10, 1–12. doi:10.3389/fevo.2022.923354
Liu, X., and Zhang, Y. (2011). Analysis of reasonable excavation sequence and stress characteristics of portal section of shallow tunnel with unsymmetry loadings Chinese Journal of rock Mechanics and engineering, 3066–3073. CNKI:SUN:YSLX.0.2011-S1-062.
Miliutenko, S., Åkerman, J., and BJöRKLUND, A. (2012). Energy use and greenhouse gas emissions during the Life Cycle stages of a road tunnel-the Swedish case norra länken. Eur. J. Transp. Infrastructure Res. 12, 39–50. doi:10.18757/ejtir.2012.12.1.2948
Morris, M., Yang, M. W., Tsang, C. K., Hu, A. Y., and Shut, D. S. (2016). “An overview of subsea tunnel engineering in Hong Kong,” in Proceedings of the institution of civil engineers-civil engineering (Thomas Telford Ltd), 9–15.
Mou, Z., Yan, T., Tian, M., and Zhang, J. (2017). Research on the construction method and reasonable excavation sequence of shallow tunnel with unsymmetrical loadings adjacent to changing road bed slope. China Civ. Eng. J. 50, 203–208. doi:10.15951/j.tmgcxb.2017.s2.032
O'reilly, M. P., and New, B. (1982). Settlements above tunnels in the United Kingdom-their magnitude and prediction.
Paraskevopoulou, C., and Diederichs, M. (2018). Analysis of time-dependent deformation in tunnels using the Convergence-Confinement Method. Tunn. Undergr. Space Technol. 71, 62–80. doi:10.1016/j.tust.2017.07.001
Peck, R. B. (1969). Deep excavations and tunneling in soft ground. Proc. 7th ICSMFE, 1969225–1969290.
Rankin, W. (1988). Ground movements resulting from urban tunnelling: Predictions and effects. London: Geological SocietyEngineering Geology Special Publications.
Real, T., Zamorano, C., Ribes, F., and Real, J. (2015). Train-induced vibration prediction in tunnels using 2D and 3D FEM models in time domain. Tunn. Undergr. Space Technol. 49, 376–383. doi:10.1016/j.tust.2015.05.004
Sellak, H., Ouhbi, B., Frikh, B., and Palomares, I. (2017). Towards next-generation energy planning decision-making: An expert-based framework for intelligent decision support. Renew. Sustain. Energy Rev. 80, 1544–1577. doi:10.1016/j.rser.2017.07.013
Song, Z., Wang, K., Wang, T., Wang, J., and Tang, K. (2019). Analysis of construction method of shallow metro tunnel under the crossing highway. J. Xi 'an Univ. Archit. Technol. Nat. Sci. Ed. 51, 503–510. doi:10.15986/j.1006-7930.2019.04.006
Sun, J., and Zhu, H. (1994). Mechanical simulation and analysis of behaviour of soft and weak rocks in the construction of a tunnel opening. Rock Soil Mech. 15, 20–33. doi:10.16285/j.rsm.1994.04.003
Tang, J. (2009). Theoretical research and application of tunnel convergence constraint method. Doctor, Wuhan, China: Huazhong University of Science and Technology.
Wang, H., and Chen, W. (2012). Sensitivity analysis of mechanical parameters to deformation of surrounding rock in Galongla tunnel. Chin. J. Geotechnical Eng. 34, 1548–1553. CNKI:SUN:YTGC.0.2012-08-036.
Wang, M., and Zhang, J. (1998). Study on mechanical effect of engineering measures to control tunnel surrounding rock deformation. Chin. J. Geotechnical Eng. 20, 30–33. CNKI:SUN:YTGC.0.1998-05-005.
Wang, Q., Shen, Y., and Chen, Y. (2006). The support vector machine method for multiple attribute decision making. Syst. Engineering-Theory Pract. 26, 54–58. doi:10.3321/j.issn:1000-6788.2006.06.010
Wu, B., Lu, M., Lei, L., Huang, W., and Huang, Z. (2020a). Study on tunnel construction scheme optimization based on improved TOPSIS method. J. Railw. Sci. Eng. 17, 1471–1479. doi:10.19713/j.cnki.43-1423/u.T20190691
Wu, L., Zhang, X., Zhang, Z., and Sun, W. (2020b). 3D discrete element method modelling of tunnel construction impact on an adjacent tunnel. KSCE J. Civ. Eng. 24, 657–669. doi:10.1007/s12205-020-2054-2
Wu, Y., Song, M., Liu, S., and Xie, Q. (2021). MTS-Choquet group decision-making method-based study on optimization of tunnel construc-tion method. Water Resour. Hydropower Eng. 52, 58–66. doi:10.13928/j.cnki.wrahe.2021.06.007
Xia, J., Zhan, X., Li, R., and Song, L. (2022). The relationship between fiscal decentralization and China’s low carbon environmental governance performance: The malmquist index, an SBM-DEA and systematic GMM approaches. Front. Environ. Sci. 10, 1–12. doi:10.3389/fenvs.2022.945922
Xiang, Y., Liu, H., Zhang, W., Chu, J., Zhou, D., and Xiao, Y. (2018). Application of transparent soil model test and DEM simulation in study of tunnel failure mechanism. Tunn. Undergr. Space Technol. 74, 178–184. doi:10.1016/j.tust.2018.01.020
Yang, J. (2003). “Study on technical and economic post evaluation of tunnel construction,” in Master (Chengdu, China: Southwest Jiaotong University).
Zaheri, M., Ranjbarnia, M., and Oreste, P. (2021). Performance of systematic fully grouted rockbolts and shotcreted layer in circular tunnel under the hydrostatic conditions using 3D finite difference approach. Geomechanics Geoengin. 16, 198–211. doi:10.1080/17486025.2019.1648885
Zhang, C., Shen, Q., and Huang, H. (2007). Study on surrounding rock construction optimization of kuigang tunnel based on function analysis system technique. Chin. J. Rock Mech. Eng. 26, 2669–2677. doi:10.3321/j.issn:1000-6915.2007.z1.012
Zhang, C., Zhao, J., and Fan, W. (2016). Influence of deformation characteristics of surrounding rock in plastic zone on tunnel convergence-confinemen. China J. Highw. Transp. 29, 106–115. doi:10.19721/j.cnki.1001-7372.2016.03.014
Zhang, Z. (2012). Comparative study on excavation methods of Guanggan expressway soft rock tunnel. Master, Chengdu, China: Southwest Jiaotong University.
Zhao, Y. (2012). Research on deformation mechanism and control technology of soft and weak surrounding rock of tunnel. Doctor, Beijing, China: Beijing Jiaotong University.
Zheng, H. (2016). Study on the characteristics of the soft and weak surrounding rock section of Xiaozhai Tunnel and construction scheme selection. Master, Chengdu, China: Southwest Jiaotong University.
Keywords: carbon emission assessment, tunnel engineering, life cycle theory, support machine vector, excavation scheme
Citation: Xia Z, Mao J, Chen G, Wu D and He Y (2022) Decision criteria and intelligent decision method for tunnel excavation scheme selection considering carbon emissions. Front. Environ. Sci. 10:972677. doi: 10.3389/fenvs.2022.972677
Received: 18 June 2022; Accepted: 08 August 2022;
Published: 18 October 2022.
Edited by:
Xianbo Zhao, Central Queensland University, AustraliaReviewed by:
Rita Yi Man Li, Hong Kong Shue Yan University, Hong Kong SAR, ChinaCopyright © 2022 Xia, Mao, Chen, Wu and He. This is an open-access article distributed under the terms of the Creative Commons Attribution License (CC BY). The use, distribution or reproduction in other forums is permitted, provided the original author(s) and the copyright owner(s) are credited and that the original publication in this journal is cited, in accordance with accepted academic practice. No use, distribution or reproduction is permitted which does not comply with these terms.
*Correspondence: Zhenzhao Xia, a2FzaGluc3lvdUAxNjMuY29t
Disclaimer: All claims expressed in this article are solely those of the authors and do not necessarily represent those of their affiliated organizations, or those of the publisher, the editors and the reviewers. Any product that may be evaluated in this article or claim that may be made by its manufacturer is not guaranteed or endorsed by the publisher.
Research integrity at Frontiers
Learn more about the work of our research integrity team to safeguard the quality of each article we publish.