 Wenwen Bai
 Yang Shi
 Zhifeng Zhao1
 Jiahua Wei
- 1School of Water Resources and Electric Power/Laboratory of Ecological Protection and High-Quality Development in the Upper Yellow River/State Key Laboratory of Plateau Ecology and Agriculture/ Key Laboratory of Water Ecology Remediation and Protection at Headwater Regions of Big Rivers, Ministry of Water Resources, Qinghai University, Xining, China
- 2State Key Laboratory of Hydroscience and Engineering, Tsinghua University, Beijing, China
For the droplets with different size distribution, reasonably selecting the frequency and period of acoustic waves are of great significance to acoustic agglomeration. To investigate critical responses of microdroplets under the action of low-frequency acoustic waves, laboratory experiments and numerical simulations of acoustic interference were conducted, and statistical test and theoretical analysis were carried out. A total of 1,680 sets of experiments were performed, from which about 300,000 particle size samples were collected, with sound frequency of 30–280 Hz and the sound pressure level (SPL) of 70–130 dB. Droplet size distribution (DSD), equilibrium response time (ERT), the nodal plane in the air chamber and entrainment coefficient were analyzed. The critical SPL of acoustic agglomeration was 110 ± 15 dB based on average droplet size increment, and the variation of droplet size indicated that the ERT of acoustic intervention on microdroplets under the critical SPL was 44 ± 12 s. In addition, lower sound frequencies corresponded to larger widths of droplet size with significant response (DSSR), which were jointly affected by sound pressure gradient (SPG), the entrainment coefficient and the droplet concentration. For microdroplets with unknown particle size distribution, acoustic intervention with variable frequencies is suggested for fog elimination and precipitation enhancement.
1 Introduction
In recent years, the issue of atmospheric quality has attracted extensive attention from researchers (Sotty et al., 2019; Liu, 2021). One effective way to improve atmospheric quality is to eliminate the harmful aerosols by technical approaches (Dass et al., 2021; Meng et al., 2021). Acoustic agglomeration technology has great potential in the removal of fine particulate matters and the precipitation enhancement (Zhou et al., 2016; Zhang et al., 2018; Shi et al., 2021b; Wei et al., 2021) due to its safety and convenience. Dynamic reactions of fluid-particle/droplet and particle/droplet was induced and intensified by acoustic waves through inputting external energy (Yang and Fan, 2014). This in turn increased the probability of collision and accelerated the formation of large agglomerates. The main mechanisms of particle/droplet acoustic agglomeration include orthokinetic interactions (Cheng et al., 1983; Dong et al., 2006), hydromechanical interactions such as acoustic radiations and acoustic wake effects (Hoffmann and Koopmann, 1996), and acoustically generated turbulences (Tiwary et al., 1984). Although the orthokinetic mechanism reveals the agglomeration of the polydisperse particles/droplets, it cannot explain the agglomeration process of the monodisperse particles/droplets. The acoustic wake effects and acoustic radiations are complementary to the acoustic agglomeration mechanism. In other words, monodisperse particles/droplets have the opportunity to collide and merge in asymmetric flow fields and scattered sound fields. The mechanism of acoustically generated turbulences involves the existence of velocity differences between particles due to turbulent inhomogeneities, which leads to chaotic particle collisions. The acoustically generated turbulences requires the sound intensity to be large enough to reach a certain critical sound pressure level (SPL). Due to the complexity and difficulty of turbulence, acoustically generated turbulence is still controversial. All of those results show that various agglomeration mechanism coexist in acoustic experiments, the effects and corresponding threshold for particles/droplets agglomeration should be further investigated.
Quantitative evaluation of the acoustic agglomeration performance of suspended particles/droplets and determination of the optimal acoustic frequency and SPL are of great significance to the optimization of agglomeration efficiency. For example, through intervention of 1,000 Hz and 3,000 Hz acoustics, Shaw and Tu (1979) found that the decrease in dioctyl phthalate (DOP) concentration in the aerosol was more significant at lower sound frequencies (1,000 Hz) when the SPL was 145 dB. Cheng et al. (1983) experimentally found that the agglomeration rate of NH4Cl aerosols increased with the rising acoustic frequency (600–3,000 Hz). Chen et al. (2007) investigated the effects of acoustic agglomeration on removing submicron particles in coal-fired fumes using 1,000 Hz acoustics, and reported that the total particle mass concentrations of PM2.5 and PM10 were reduced by 58% and 77%, respectively. The agglomeration effect also occurs when acoustic waves interfere with liquid droplets, at lower acoustic frequencies compared to particle agglomeration. For example, Chang et al. (1963) performed acoustic experiments at 500–2,400 Hz, and found that acoustic waves could significantly accelerate the dissipation of water mist. In 2002, Hou et al. (2002) performed an acoustic intervention experiment at relatively lower frequency of 20–50 Hz, and found that the acoustic frequency corresponding to the optimal agglomeration effect is 20 Hz. For 40–100 Hz acoustic intervention on microdroplets, Bai et al. (2020); Bai et al. (2021a); Bai et al. (2021b) found that the particle size increment was significantly affected by the sound frequency, and the droplets isotope values increased after interference of acoustics. He et al. (2021) conducted experiments on droplets by combined sound waves of 200–600 Hz and electric field. The effects of sound wave and electricity on droplet agglomeration have been proved, and the optimal sound frequency was 400 Hz. These studies have reported the optimal acoustic frequency and SPL, but the dimension and distribution of droplets are spatiotemporally different. Moreover, previous studies show that the acoustic agglomeration effect was directly influenced by sound field characteristics and particle/droplet size distribution (Qu et al., 2020). The standing wave field had a better agglomeration effect than the traveling wave field (Chang et al., 1963). This may be attributed to the continuous oscillation of fluid medium around the wave node, so the acoustic wave forces the particles/droplets to move towards the node. In addition, it was found that acoustic agglomeration effect enhanced significantly with the increasing particle size difference and particles concentration (Yuen et al., 2017). The previous studies mainly focus on particles agglomeration, so it is necessary to systematically investigate the droplet response to low-frequency acoustic waves.
The droplets agglomeration caused by acoustic waves is manifested in the variation of diameter and concentration. The response of droplets to acoustic intervention, especially the critical SPL and the optimal frequency, is worthy of attention. This paper attempts to experimentally investigate the critical SPL of low-frequency acoustic intervention. The significance test was adopted to investigate responses of microdroplets subjected to acoustic waves. The control experiments including natural (without acoustic intervention) and acoustic intervention conditions were designed, and the critical SPL and its equilibrium response period under the action of sound waves with 30–280 Hz were analyzed. According to the significance test, the droplet size with significant response (DSSR) under fixed critical SPL and different sound frequencies was obtained, and the influence factors were analyzed. This study has certain reference value for the frequency optimization of acoustic agglomeration.
2 Materials and methods
2.1 Experimental devices
The experiment device consists of an air chamber, sound and aerosol generators, and monitoring devices (Figure 1). The monitoring devices mainly includes temperature and humidity sensors, laser particle analyzer, and microdroplet collection beaker. The air chamber consists of a cylindrical Plexiglas tube and a conical bottom plate with slope of 1:2, conical bottom plate is used to collection droplets and isolate bottom of the air chamber from environment. The diameter and height of air chamber are 600 mm and 2000 mm, respectively. Sound generator is fixed on the top of air chamber. A plastic film with high sound permeability is adopted to isolate the top of chamber. Microdroplets nozzle, temperature and humidity sensors are all fixed in the middle of air chamber. To pass the laser beam of laser particle analyzer for size observation, a hole with a diameter of 100 mm is placed along the radial direction of the air chamber, with 300 mm away from the bottom of the air chamber. Microdroplet collection beaker is located at the bottom of air chamber. The experimental device could monitor dynamic variations of droplet size before and after acoustic intervention. The sound generator was capable of adjusting the frequency (30–280 Hz constant frequency loading) and SPL (70–130 dB) of the sound source. The SPLs at different positions of the air chamber could be measured with accuracy of 0.1 dB. The aerosol generator can continuously produce microdroplets from 5 to 100 μm and can control the input volume (Q) and its peak shape. The droplets size distribution (DSD) can be continuously observed using particle analyzer (winner 319, Jinan Micro-nano Particle Instrument Co., Ltd.), with the time resolution of 1 s and observable range of 1–500 μm in size dimension, the accuracy was less than or equal to 3%. Environmental parameters such as air temperature and humidity can be real-time monitored with temporal resolution of 1.0 s.
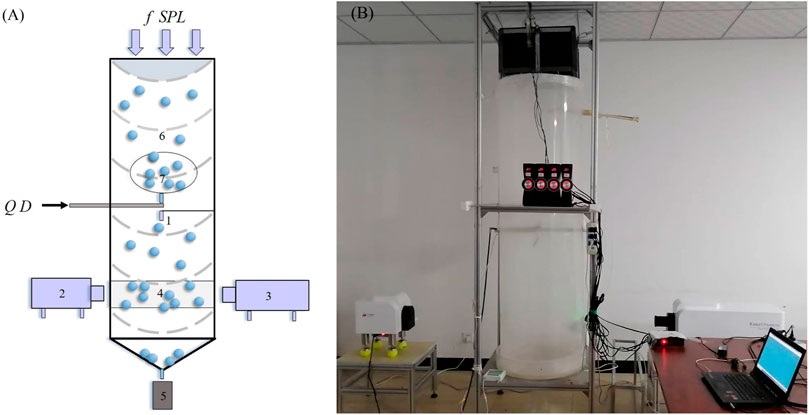
FIGURE 1. Sketch (A) and on-site picture (B) of the experimental devices (Q represents input volume of droplets; D represents input diameter of microdroplets; f represents frequency of acoustic source; and SPL represent intensity of acoustic source. 1-Temperature and humidity sensors; 2-Laser transmitter; 3-Laser receiver; 4-Monitoring region of droplets; 5-Microdroplet collection beaker; 6-Air chamber; 7-Microdroplets).
2.2 Experimental process and conditions
The experiments were carried out in the alternation of natural settlement and acoustic intervention. Acoustic frequency was 30–280 Hz with a step of 10 Hz, and the SPL was 70–130 dB with a step of 5 dB. To reduce the occasionality and statistical error of the experimental results, three control or replicate experiments were conducted for each scenario, with each group of samples collected for more than 180 s.
To ensure the accuracy of the measurements, the standard solution was used to calibrate the observation instrument before the experiment. Agglomeration tests were carried out at room temperature (20°C). A total of 840 groups of control experiments were performed, with more than 300,000 samples being collected.
2.3 Experimental data processing
(i) Determination of critical SPL. For acoustic interventions with fixed acoustic frequency, there is a critical SPL, which can effectively influence the droplet size. When the droplet is intervened by acoustic waves with SPL0 and SPL1 (SPL0 + 5 dB), the average droplet size increases by more than 0.1 μm, and the size increment is relatively larger for cases with acoustic intensity of SPL1. This indicates that stable agglomeration occurs after acoustic intervention, and the corresponding SPL0 can be determined as the critical SPL under a certain sound frequency. Note that increment refers to the droplet size with acoustic action minus that without acoustic operation.
(ii) Significance test. According to the critical SPL determined in section (i), statistical tests are carried out on droplet size. In other words, acoustic wave as the influencing factor, one-way ANOVA is conducted to test the significance level (0.05) of the acoustic waves influence on volume frequency of the each droplet size (different sound frequencies, critical SPLs). The corresponding droplet size that passes the significance test can be defined as droplet size with significant response (DSSR).
3 Experimental results and analysis
3.1 Critical sound pressure level and variations of droplets size distribution
The critical SPL of the acoustic agglomeration for microdroplets in this study was concentrated at 110 dB. The average sizes of the microdroplets in the 840 control groups were counted, and thereby the critical SPL and its effective sound pressure distribution for cases of 30–280 Hz as shown in Figure 2. The black dots in the figure represent the critical SPL for corresponding certain acoustic frequency, and the shaded area denotes the effective SPL range of acoustic operation. The critical SPL showed a fluctuating trend with the sound frequency. The maximum critical SPL was 125 dB, and the corresponding sound frequency was 190 Hz; the lowest critical SPL was 95 dB with sound frequency of 110 Hz. In general, lower sound frequencies corresponded to lower critical SPLs.
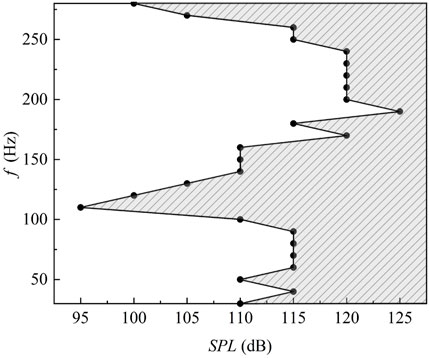
FIGURE 2. The Critical SPLs at different acoustic frequencies. (Shaded area represents the effective SPL range for acoustic interference).
The peak shape of DSD remained unchanged after acoustic intervention. To obtain a comparison chart of the DSD, the droplet volume frequencies of control groups were averaged. The DSD under the action of acoustic waves with f = 30–90 Hz presented a unimodal trend (Figure 3), with identical peak shape. This indicated that the agglomeration process of microdroplets was greatly restricted by the initial DSD. Further analysis revealed that variation rate of volume frequency for relatively smaller droplets was significantly higher than that for larger ones after acoustic intervention. In addition, the agglomeration effect was related to the volume frequency of droplets, indirectly confirming the effect of particle number on acoustic agglomeration (Shi et al., 2020).
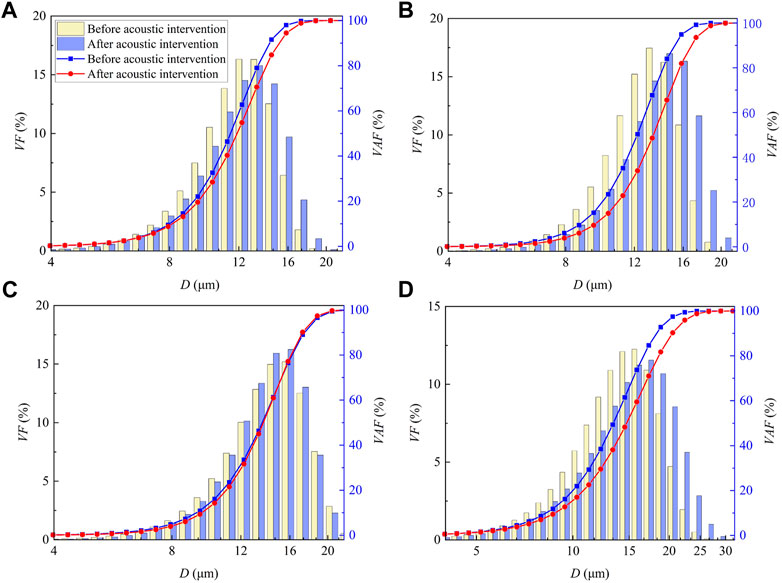
FIGURE 3. Variation of DSD under fixed critical SPL and different acoustic frequencies. (A) 30 Hz, (B) 50 Hz, (C) 70 Hz, (D) 90 Hz. (VF: volume frequency; VAF: volume accumulated frequency).
The droplets agglomeration and fragmentation coexisted with acoustic operation, while the aggregation effect dominated. According to the number of intersection points of the volume accumulative frequency curve before and after acoustic intervention (Figure 3 and Supplementary Figure S1 in Supplementary), the agglomeration effects can be subdivided into two types. The first type had two intersection points, the size of microdroplets increased after acoustic intervention, which was mainly caused by the agglomeration of droplets, with the sound frequencies of 30–50 Hz, 90–230 Hz, and 250–280 Hz. The second type had more than two intersection points, the size of microdroplets first increased and then decreased with sound frequencies of 60–80 Hz, and 240 Hz, indicating droplets agglomeration and fragmentation effect (Shi et al., 2020) coexist, thus the volume accumulative frequency of droplet group presented a staggered variation trend.
3.2 Equilibrium response time of microdroplets
The equilibrium response time (ERT) of the microdroplets was concentrated at 44 s under the critical SPL (Table 1). The ERT varied with sound frequencies. The minimum ERT was 32 s with sound frequency of 210 Hz; the maximum ERT value was 56 s, and the corresponding sound frequency was 140 Hz. The equilibrium response time was impacted by the DSD, the sound field distribution inside the air chamber. The sound field distribution in the air chamber remained unchanged for a constant acoustic frequency. Therefore, the equilibrium response time was mainly influenced by sound frequency.
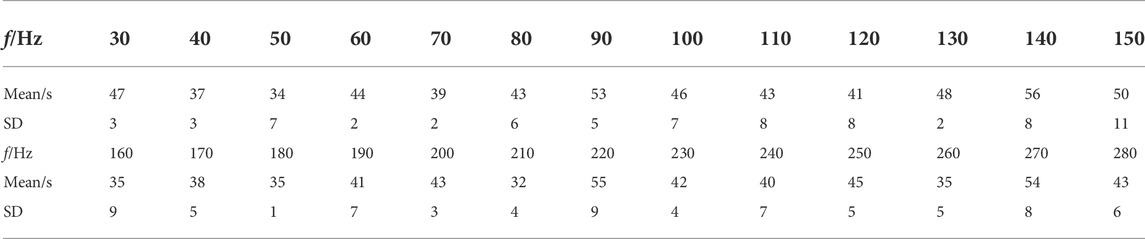
TABLE 1. ERT of microdroplets under the action of acoustic waves with fixed critical SPL and different acoustic frequencies.
With the increase of the acoustic intervention period, the particle size generally tended to increase first, and then maintained a dynamic equilibrium. Figure 4 shows the variation of droplet size with acoustic action time under the action of acoustic waves with 90 Hz and 190 Hz. After acoustic operation, the particle size D90 (indicating that the volume frequency of droplets smaller than this size accounted for 90% of the total volume) increased because of the droplets agglomeration. In the initial stage, the size of microdroplets generally showed an increasing trend, this can be well demonstrated by D90 variation before the three dashed line in Figure 4. The sudden decrease of D90 was caused by the fragmentation of microdroplets, but the D90 showed an ascending trend at this stage due to stronger agglomeration. From the equilibrium response time on, the agglomeration-fragmentation inside the microdroplets reached a dynamic equilibrium, and average D90 remained roughly unchanged.
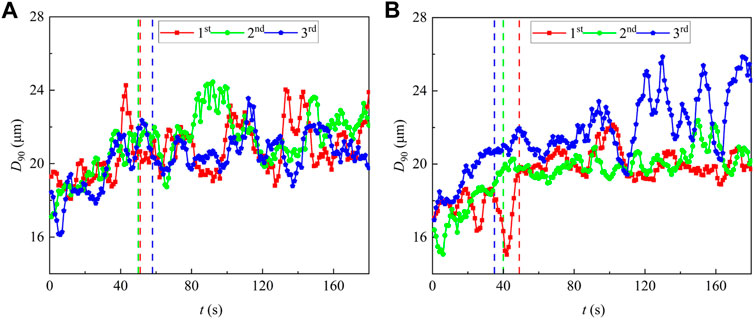
FIGURE 4. Variation of particle size over acoustic operation time under 90 Hz (A) and 190 Hz (B). (1st, 2nd, 3rd represent the experimental order; the red, green and blue dashed lines represent equilibrium response time of 1st, 2nd, 3rd experiment respectively).
4 Discussion
4.1 Droplet size with significant response under different sound frequencies
The DSSR was varied with acoustic frequency. In general, a lower acoustic frequency corresponded to a larger width of DSSR. The significance test was performed to investigate response degree of droplet size for acoustic intervention with fixed critical SPL and different frequencies (30–280 Hz). From Figure 5A, widths of DSSR for cases with f = 30–110 Hz were obviously larger than those of above 110 Hz. The break points can be clearly seen for D = 4–8 μm after acoustic intervention with f = 110–140 Hz. The critical SPLs for acoustic operation with f = 30–110 Hz were generally lower than those with f = 110–280 Hz. This meant that the larger width of DSSR may corresponds to the lower critical SPL. In addition, effective frequency range of acoustic operation for D < 4 μm was significantly larger than that of droplets larger than 4 μm.
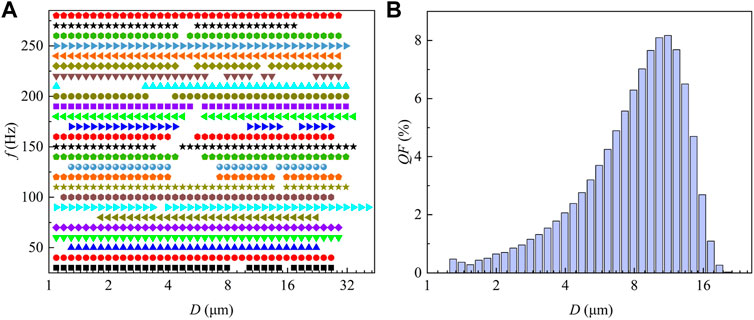
FIGURE 5. Width of DSSR with respect to different acoustic frequency (A) and DSD (B).
The concentration of microdroplets also affected width of DSSR. To illustrate the relationship between width of DSSR and the droplet concentration, Figure 5B shows DSD before acoustic operation. The droplet size corresponding to the largest volume frequency also had the highest concentration (comparing Figure 5B with Figure 3). In addition, the droplet sizes with non-significant response were mainly distributed in range of 4–8 μm with middle concentration (except droplet sizes with non-significant response was 1–3 μm after acoustic intervention with f = 210 Hz). This indicated that the width of DSSR was affected by both microdroplets sizes and concentration. Detailed discussion can be found in Section 4.4.
4.2 Numerical simulation of acoustic structures inside air chamber
In this study, a commercial computational fluid dynamics software, COMSOL Multiphysics, was applied to study the distribution of sound field with f = 30 Hz, 120 Hz, 200 Hz and 280 Hz in the air chamber. Detailed simulation information can be found in the work of Shi et al. (2020). As shown in Figure 6, the nodal planes of acoustic waves moved from the top to the bottom in air chamber. The plane number increased with the sound frequency, which was consistent with the experimental results (Bai et al., 2020). Specifically, there were one, two and three acoustic planes in the frequency bands of 30–120 Hz, 130–210 Hz, and 220–290 Hz, respectively. The sound pressure gradient (SPG) force near the nodal plane was relatively larger, leading to an increased probability of droplet aggregation. In addition, the width of DSSR could be influenced by the number of acoustic planes and their distribution. The pressure distribution in air chamber varied with sound frequency, and could impact the acoustic agglomeration effect of droplet aerosols.
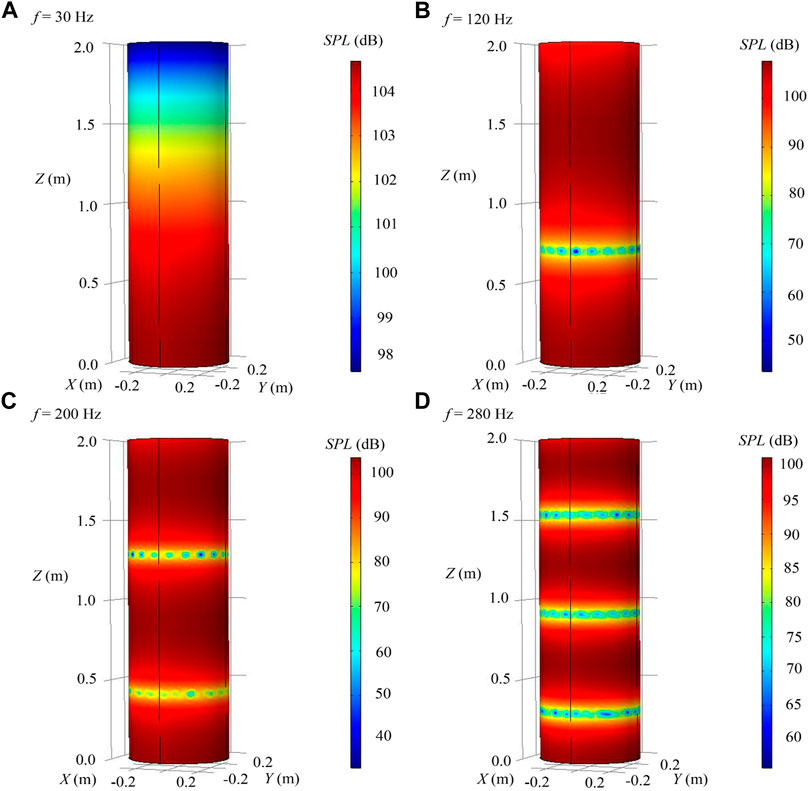
FIGURE 6. Variation characteristics of SPL in air chamber. [(A–D) represent 30 Hz, 120 Hz, 200 Hz and 280 Hz, respectively; X-Y-Z represents the spatial coordinate system, and the Z axis is along the axis of the air chamber].
To investigate the effect of sound pressure gradient on droplets agglomeration, the vertical sound pressure and its gradient along the air chamber axis of 30 Hz, 120 Hz, 200 Hz and 280 Hz was extracted (see Figure 7). The amplitude of sound pressure gradient increased with acoustic frequency. Figure 7A shows that the sound pressure exhibited a sinusoidal variation along the chamber axis. The fluctuation amplitude and the direction were influenced by the chamber size and the sound frequency. The acoustic amplitude and number of alternating directions were positively correlated with the acoustic frequency. Figure 7B confirms that the amplitude of sound pressure gradient along chamber axis also increased with sound frequency.
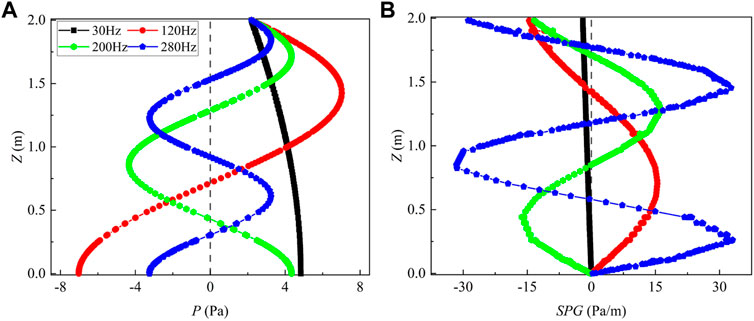
FIGURE 7. Distribution of total sound pressure (A) and sound pressure gradient (B) along the axis of the air chamber.
4.3 Entrainment effect of acoustic frequencies on microdroplets
The acoustic agglomeration was obviously affected by orthokinetic agglomeration, and the entrainment coefficient for droplets with different size varied with the sound frequency. According to the entrainment force of the sound wave exerted on particles (Brandt and Hiedemann, 1936; Cheng et al., 1983; Song et al., 1994; Hoffmann and Koopmann, 1996), and shear forces exerted on droplets in the Stokes flow (Re < 1) (Tiwary and Reethof, 1986), entrainment coefficient can be derived as follows.
where τp is the relaxation time of particles, which is proportional to the droplet density and the square of radius, and inversely proportional to flow viscosity; ω is the angular frequency. Regardless of the properties of droplets and environment, the entrainment coefficient of acoustic on droplet is only affected by acoustic frequency.
For cases with sound frequencies of 30–300 Hz, air temperature of 20°C and dynamic viscosity of 0.01809 Pa·s, the entrainment coefficient for droplets with size in range of 1–64 μm were obtained (Figure 8). In general, the lower sound frequency, the larger entrainment effect on the droplets and the larger droplet amplitude caused by acoustic waves. The wider the size spectrum of droplets, the more significant the agglomeration effect. Thus, low-frequency acoustic waves were apt to influences droplets with wider size spectrum.
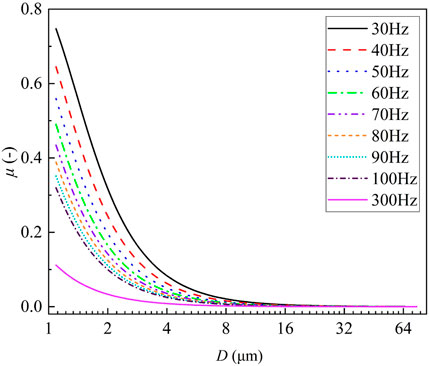
FIGURE 8. Entrainment coefficients of acoustic frequencies for droplets with different sizes.
4.4 Comprehensive analysis of factors affecting droplet size with significant response
The width of DSSR was jointly affected by the sound field, especially sound pressure gradient, the entrainment coefficient and the droplet concentration. For cases with low sound frequencies (30–110 Hz), the width of the DSSR was mainly subjected to the entrainment effect. With increasing of sound frequency (120–210 Hz), the wavelength declined, and thereby the number of nodal planes in the air chamber rose to 2. For cases with frequency in range of 120–210 Hz, entrainment and agglomeration effects on 1–4 μm droplets were relatively stronger. The volume frequency of droplets above 8 μm varied significantly due to their predominance in concentration. In addition, small droplets were apt to generate larger droplets due to acoustic agglomeration. The width of DSSR was jointly affected by the droplet concentration, sound distribution and flow entrainment, resulting in a “breakpoint” in the width of the DSSR at D = 4–8 μm for f = 120–210 Hz. As the sound frequency further increased from 220 to 280 Hz, the number of nodal planes in the air chamber increased to 3. Despite the smaller entrainment coefficient of those acoustic operations, the effect of the sound pressure gradient force was stronger. As a result, the width of DSSR for acoustic waves with f over 220 Hz was larger.
It has always been a core concern to determine the optimal acoustic parameters to achieve the best agglomeration effect in practice. For a specific DSD, the optimal frequency and effective SPL can be determined by laboratory experiments. However, it is inconvenient to conduct experiments due to the inability to simulate DSD and its environmental conditions indoors. Given the width of DSSR obtained in this study, acoustic intervention with variable frequency was recommended to obtain better agglomeration performance. Thus, sweep-frequency acoustic intervention was applied to on-site artificial precipitation enhancement (Shi et al., 2021a; Shi et al., 2021b; Wei et al., 2021).
5 Conclusion
In this study, the responses of microdroplets under acoustic intervention of 30–280 Hz are studied through laboratory experiments, numerical simulations and theoretical analysis. Droplet size distribution (DSD), equilibrium response time (ERT), the nodal plane in the air chamber and entrainment coefficient were analyzed. The critical SPL and its equilibrium response time are presented based on average droplet size increment and the variation of droplet size respectively. The main conclusions are as follows.
(i) For acoustic waves with f = 30–280 Hz, the critical SPL is 110 ± 15 dB, and the equilibrium response time was concentrated in 44 ± 12 s, the critical SPL and its equilibrium response time varied with acoustic frequency.
(ii) The width of DSSR was impacted by the acoustic entrainment, sound distribution, and droplet concentration. The entrainment effect of acoustic waves on the width of DSSR decreased with increasing frequency, while the sound pressure gradient effect became significant.
(iii) For the target microdroplets whose optimal frequency is unknown, such as fog or cloud droplets, acoustic intervention with sweep frequency could be used, which can theoretically enhance the intervention effect.
This study did not take into account the trajectory of the droplets under the action of acoustic waves and turbulence flows. In the future, kinematics and dynamic response of droplets under acoustic intervention will be investigated with high-speed cameras.
Data availability statement
The original contributions presented in the study are included in the article/Supplementary Material; further inquiries can be directed to the corresponding authors.
Author contributions
WB: Conceptualisation, Methodology, Writing—Original Draft, Formal Analysis, Investigation; YS: Methodology, Writing—Original draft, Writing—Review and Editing, Supervision, Funding Acquisition; ZZ: Data Curation, Investigation, Formal Analysis; JW: Methodology, Suggestions, Supervision, Project Administration.
Funding
This research was funded by the National Key Research and Development Program [Grant No. 2017YFC0403600]; the Open Research Foundation by State Key Laboratory of Hydroscience and Engineering-Tsinghua University [Grant No. sklhse-2022-B-02]; the National Natural Science Foundation of China [Grant No. 52209092, 52009059]; China Postdoctoral Science Foundation [Grant No. 2021T140385, 2018M641372]; Young Elite Scientist Sponsorship Program by China Association for Science and Technology [Grant No. YESS20200094]; the Shuimu Tsinghua Scholar Program [Grant No. 2021SM010] of Tsinghua University.
Acknowledgments
Zhijie Jiang, Zifei Li, Jing Zhou, Yan Li and Yige Hu participated in the experiment, and their contributions are greatly appreciated.
Conflict of interest
The authors declare that the research was conducted in the absence of any commercial or financial relationships that could be construed as a potential conflict of interest.
Publisher’s note
All claims expressed in this article are solely those of the authors and do not necessarily represent those of their affiliated organizations, or those of the publisher, the editors and the reviewers. Any product that may be evaluated in this article, or claim that may be made by its manufacturer, is not guaranteed or endorsed by the publisher.
Supplementary material
The Supplementary Material for this article can be found online at: https://www.frontiersin.org/articles/10.3389/fenvs.2022.972648/full#supplementary-material
References
Bai, W., Wei, J., Li, Q., Shi, Y., Ni, S., and Lei, F. (2021a). The hydrogen and oxygen isotope characteristic of droplet collision and deposition under the action of acoustic wave. J. Appl. Acoust. 40 (1), 1–11. (in Chinese).
Bai, W., Wei, J., Ni, S., and Shi, Y. (2020). Experimental study on micro-droplet sedimentation under the action of low-frequency acoustic wave. J. Basic Sci. Eng. 28 (2), 247–258. (in Chinese).
Bai, W., Wei, J., Shi, Y., Zhao, Z., and Li, Q. (2021b). Microphysical characteristics and environmental isotope effects of the micro-droplet groups under the action of acoustic waves. Atmos. (Basel). 12 (11), 1488. doi:10.3390/atmos12111488
Brandt, O., and Hiedemann, E. (1936). The aggregation of suspended particles in gases by sonic and supersonic waves. Trans. Faraday Soc. 42 (190), 1101–1110. doi:10.1039/tf9363201101
Chang, H., Kan, C., and Wei, Y. T. (1963). Sonic dissipation of water fog-A preliminary experimental study. J. Nanjing Univ. Nat. Sci. 2 (5), 21–28. (in Chinese).
Chen, H., Zhao, B., Xu, J., and Shen, X. (2007). Experimental study on acoustic agglomeration of ultrafine fly ash particles. Proc. CSEE 27 (35), 28–32. (in Chinese). doi:10.13334/j.0258-8013.pcsee.2007.35.002
Cheng, M. T., Lee, P. S., Berner, A., and Shaw, D. (1983). Orthokinetic agglomeration in an intense acoustic field. J. Colloid Interface Sci. 91 (1), 176–187. doi:10.1016/0021-9797(83)90324-7
Dass, A., Srivastava, S., and Chaudhary, G. (2021). Air pollution: A review and analysis using fuzzy techniques in Indian scenario. Environ. Technol. Innov. 22, 101441. doi:10.1016/j.eti.2021.101441
Dong, S., Lipkens, B., and Cameron, T. M. (2006). The effects of orthokinetic collision, acoustic wake, and gravity on acoustic agglomeration of polydisperse aerosols. J. Aerosol Sci. 37 (4), 540–553. doi:10.1016/j.jaerosci.2005.05.008
He, F., Li, J., Li, C., Wang, P., Wang, Z., Zhang, M., et al. (2021). Investigation on collision-coalescence of droplets under the synergistic effect of charge and sound waves: Orthogonal design optimization. J. Phys. D. Appl. Phys. 55 (7), 075204. doi:10.1088/1361-6463/ac34ac
Hoffmann, T. L., and Koopmann, G. H. (1996). Visualization of acoustic particle interaction and agglomeration: Theory and experiments. J. Acoust. Soc. Am. 99 (4), 2130–2141. doi:10.1121/1.415400
Hou, S., Wu, J., and Xi, B. (2002). Experiments on acoustic dissipation of water fog at low frequency. Exp. Meas. Fluid Mech. 16 (4), 52–63. (in Chinese).
Liu, D. (2021). Value evaluation system of ecological environment damage compensation caused by air pollution. Environ. Technol. Innov. 22, 101473. doi:10.1016/j.eti.2021.101473
Meng, C., Tang, Q., Yang, Z., Cheng, H., Li, Z., and Li, K. (2021). Collaborative control of air pollution in the Beijing–Tianjin–Hebei region. Environ. Technol. Innov. 23, 101557. doi:10.1016/j.eti.2021.101557
Qu, G., Fan, F., Zhang, S., and Su, M. (2020). Interaction between monodisperse fine particles in a standing wave acoustic field. Acta Phys. Sin. 69 (6), 064704. (in Chinese). doi:10.7498/aps.69.20191681
Shaw, D., and Tu, K. (1979). Acoustic particle agglomeration due to hydrodynamic interaction between monodisperse aerosols. J. Aerosol Sci. 10 (3), 317–328. doi:10.1016/0021-8502(79)90047-8
Shi, Y., Wei, J., Bai, W., and Wang, G. (2020). Numerical investigations of acoustic agglomeration of liquid droplet using a coupled CFD-DEM model. Adv. Powder Technol. 31 (6), 2394–2411. doi:10.1016/j.apt.2020.04.003
Shi, Y., Wei, J., Li, Q., Yang, H., Qiao, Z., Ren, Y., et al. (2021a). Investigation of vertical microphysical characteristics of precipitation under the action of low-frequency acoustic waves. Atmos. Res. 249, 105283. doi:10.1016/j.atmosres.2020.105283
Shi, Y., Wei, J., Ren, Y., Qiao, Z., Li, Q., Zhu, X., et al. (2021b). Investigation of precipitation characteristics under the action of acoustic waves in the source region of the yellow river. J. Appl. Meteorol. Climatol. 60 (7), 951–966. doi:10.1175/jamc-d-20-0157.1
Song, L., Koopmann, G. H., and Hoffmann, T. L. (1994). An improved theoretical model of acoustic agglomeration. J. Vib. Acoust. 116 (2), 208–214. doi:10.1115/1.2930414
Sotty, J., Garcon, G., Denayer, F. O., Alleman, L. Y., Saleh, Y., Perdrix, E., et al. (2019). Toxicological effects of ambient fine (PM2.5-0.18) and ultrafine (PM0.18) particles in healthy and diseased 3D organo-typic mucocilary-phenotype models. Environ. Res. 176, 108538. doi:10.1016/j.envres.2019.108538
Tiwary, R., and Reethof, G. (1986). Hydrodynamic interaction of spherical aerosol particles in a high intensity acoustic field. J. Sound. Vib. 108 (1), 33–49. doi:10.1016/s0022-460x(86)80309-1
Tiwary, R., Reethof, G., and McDanie, O. H. (1984). Acoustically generated turbulence and its effect on acoustic agglomeration. J. Acoust. Soc. Am. 76 (3), 841–849. doi:10.1121/1.391308
Wei, J., Qiu, J., Li, T., Huang, Y., Qiao, Z., Cao, J., et al. (2021). Cloud and precipitation interference by strong low-frequency sound wave. Sci. China Technol. Sci. 64 (2), 261–272. doi:10.1007/s11431-019-1564-9
Yang, X., and Fan, F. (2014). Numerical simulation of the effects of gas temperature and particle density on particle dynamics in acoustic field. Acta Acust. 39 (6), 745–751. (in Chinese). doi:10.15949/j.cnki
Yuen, W. T., Fu, S. C., and Chao, C. Y. H. (2017). The effect of aerosol size distribution and concentration on the removal efficiency of an acoustic aerosol removal system. J. Aerosol Sci. 104, 79–89. doi:10.1016/j.jaerosci.2016.11.014
Zhang, G., Zhou, T., Zhang, L., Wang, J., Chi, Z., and Hu, E. (2018). Improving acoustic agglomeration efficiency of coal-fired fly-ash particles by addition of liquid binders. Chem. Eng. J. 334, 891–899. doi:10.1016/j.cej.2017.10.126
Keywords: acoustic agglomeration, equilibrium response time, critical SPL, droplet size with significant response, sound pressure gradient, entrainment coefficient
Citation: Bai W, Shi Y, Zhao Z and Wei J (2022) Investigation of critical response characteristics of micro-droplets under the action of low-frequency acoustic waves. Front. Environ. Sci. 10:972648. doi: 10.3389/fenvs.2022.972648
Received: 18 June 2022; Accepted: 01 September 2022;
Published: 30 September 2022.
Edited by:
Songdong Shao, Dongguan University of Technology, ChinaReviewed by:
Ehsan Kazemi, The University of Sheffield, United KingdomFan Li, Dongguan University of Technology, China
Copyright © 2022 Bai, Shi, Zhao and Wei. This is an open-access article distributed under the terms of the Creative Commons Attribution License (CC BY). The use, distribution or reproduction in other forums is permitted, provided the original author(s) and the copyright owner(s) are credited and that the original publication in this journal is cited, in accordance with accepted academic practice. No use, distribution or reproduction is permitted which does not comply with these terms.
*Correspondence: Yang Shi, dGh1c2hpeWFuZ0B0c2luZ2h1YS5lZHUuY24=; Jiahua Wei, d2VpamlhaHVhQHRzaW5naHVhLmVkdS5jbg==