 Yi-Hua Hsiao
 Chun-Che Chen1
 Yi-Chiung Chao
 Ching-Hsien Ho
- 1National Science and Technology Center for Disaster Reduction, New Taipei, Taiwan
- 2National Science and Technology Council, Taipei, Taiwan
- 3Department of Fisheries Production and Management, National Kaohsiung University of Science and Technology, Kaohsiung, Taiwan
- 4National Center for High-Performance Computing, Hsinchu, Taiwan
- 5Disaster Prevention and Water Environment Research Center, National Yang Ming Chiao Tung University, Hsinchu, Taiwan
Flooding is the main disaster type in Taiwan and is usually caused by typhoons and heavy rainfall. To understand the flood impacts in Taiwan caused by increasing rainfall due to global warming, this study adopts a high-resolution atmospheric model (HiRAM) under the representative concentration pathway (RCP) 8.5 scenario to project future changes in flood impact. For the flood simulation, the SOBEK flood model was used to determine the maximum accumulated flooding depth and flood probability in the two periods of the present and the middle of the 21st century. Yilan County, one of the most flood-prone areas in Taiwan, was chosen as a demonstration case for the development of flood impact maps. According to the results of flood map application, flooded areas were predicted to increase in the middle period of the 21st century due to increasing rainfall, especially in paddy fields, maricultural farms, and stock farms. From the base period to the middle of the 21st century, the area of flooding impacts was projected to increase from 24% to 40% in paddy fields, from 9% to 15% in maricultural farms, and from less than 1% to 9% in stock farms. These results show that the development of flood maps can help elucidate the actual impacts of climate change in Taiwan and serve as a scientific basis for adaptation actions.
1 Introduction
In recent years, the frequency of extreme events caused by climate change have increased. Such events have included the flood disaster in Jakarta, Indonesia, in January 2020; cyclone Amphan in the Indian Ocean in May 2020; the continual typhoon events in South Korea in August 2020; the typhoon and tropical depression in Vietnam in October 2020; floods in Indonesia and East Timor in April 2021; short-duration intense rainfall in Zhengzhou, Henan Province, China in July 2021; tropical storm Lupit and heavy rainfall in Taiwan in August 2021; and floods in west-central Malaysia in December 2021 (National Science and Technology Center for Disaster Reduction, Taiwan, Global Disaster Event Book) Extreme climate events have led to severe disasters all over the world and have caused significant changes in the flooding potential in various regions. These changes are key aspects of short-term disaster mitigation and long-term adjustment by policymakers.
The Intergovernmental Panel on Climate Change (IPCC) Fifth Assessment Report (AR5) issued in December 2014 defined climate change risk assessment as a function of hazard, vulnerability, and exposure. Hazard represents the physical effects of natural or anthropogenic climate changes, vulnerability is the tendency of exposure to hazards to cause disasters, and exposure is the degree of potential exposure of objects to external hazards. To understand the impacts of climate change on flood disasters, this study used IPCC AR5 climate change data to carry out research on flood disasters.
To effectively develop various adaptation strategies, the construction of risk maps has been widely used (ex., Van et al., 2012; Wei et al., 2016; Chow et al., 2017; Tong et al., 2017). In particular, many related studies have been performed using the SOBEK model (ex., Bhattacharya, 2010; Dahm et al., 2014; Suman et al., 2014; Lai, 2015; Guo et al., 2019; Hsiao et al., 2019; Wei et al., 2020; Wu et al., 2020) and have also presented results of various flooding disaster simulations. The SOBEK model is often used to plan flood potential maps by the Water Resources Agency of the Ministry of Economic Affairs, Taiwan (ex., Water Resources Planning Institute, Water resources Agency, Ministry of Economic Affairs, 2012; Water Resources Planning Institute, Water resources Agency, Ministry of Economic Affairs, 2018).
In this study, based on the definition of risk given above and by assessing the rates of change in climatic factors to conduct a hazard analysis climate hazard maps were produced. In addition, by simulating the flooding hazard to conduct an impact analysis, flood impact maps were produced.
2 Overview of data and study area
2.1 Climate change data
For rainfall under the climate change scenario, the high-resolution atmospheric model (HiRAM) developed by the Geophysical Fluid Dynamics Laboratory (GFDL) in the United States (U.S.) was used to obtain typhoon estimation data with a horizontal spatial resolution of 25 km; however, this spatial resolution cannot effectively resolve heavy rainfall events due to topographic effects. To address the insufficient resolution, the Weather Research and Forecasting (WRF) model developed by the U.S. National Center for Atmospheric Research (NCAR) was introduced to dynamically downscale the HiRAM estimation data, and the spatial resolution was improved to 5 km (Chiang et al., 2020). Although this method achieved a relatively high rainfall resolution, differences between the rainfall intensity and the historical observational data remained. Therefore, the cumulative distribution function (CDF) of the probability density was adopted to perform bias correction on the rainfall data while considering typhoon paths, and better climate change estimation data were obtained. Based on the simulation framework described above, the worst-case scenario representative concentration pathway (RCP) 8.5 (Mizuta et al., 2014) was used in the Coupled Model Intercomparison Project 5 (CMIP5); 149 typhoon events were identified in the base period (1979-2008), and 450 typhoon events were predicted to occur in the middle of the century (2040-2065) in the study area. The sea surface temperature (SST) data for typhoon events in the base period were observational data, so there was no scenario classification. However, four scenarios for the SST data for projected typhoon events in the middle of the century were identified: the ensemble average SST scenario was obtained from multiple models, and the other three SST scenarios were obtained by combining cluster analysis and the ensemble average (cluster analysis was performed to obtain three clusters of SST changes, and then the ensemble average was performed on each SST cluster). The information described above was sourced from the Taiwan Climate Change Projection Information and Adaptation Knowledge Platform (TCCIP). This platform builds the climate change dataset, supplies projected climate change downscaling data, and provides climate change scientific data service.
In this study, the global tidal model was used for tide level in the climate change scenario. The model is based on the assimilation of radar altimetry data for 66°N and 66°S between the TOPEX/POSEIDON and Jason satellites, and the harmonic constants of the global ocean tide prediction model were combined with each typhoon event. Considering the effect of storm tides, the tidal level of each river estuary was calculated by using the regional hydrological model.
2.2 Study area
The study area covers all catchment areas in Yilan County. Yilan County is located in the eastern portion of the main island of Taiwan and borders New Taipei City, Taoyuan City, Hsinchu County, Taichung City, Hualien County, and the Pacific Ocean to the east, with a total area of 2,143.63 km2 and 12 townships and cities. From north to south, there are 12 catchment areas: the Gengfang Creek, Toucheng Creek, Fudekeng Creek, Houdongkeng Creek, Dezikou Creek, Lanyang Creek, Dongshan River, Xincheng Creek, Su-ao Creek, Dong-ao Creek, Nan-ao Creek, and Guanyin River catchments. The southern part of Yilan County and the northern part of Hualien County are within the Heping Creek basin. Considering the topographical factors, this catchment area belongs to the Hualien area, not the Yilan area. Therefore, the overall study area was approximately 6,056.37 km2 and is shown in Figure 1.

FIGURE 1. The study area: all catchment areas in the Yilan area.
3 Research methods
To explore and present the possible future hazards and impacts in the study area under the climate change scenario, two types of maps were produced: climate hazard and flood impact maps. The overall workflow is shown in Figure 2. Changes in rainfall and cumulative rainfall trends in different periods were analysed using four indicators (total cumulative rainfall, maximum 24-h cumulative rainfall, maximum 12-h cumulative rainfall, and maximum 6-h cumulative rainfall), and climate hazard maps were generated from the results. For the flood impact maps, the SOBEK model from the Water Resources Agency of the Ministry of Economic Affairs was used to perform regional flooding simulations and flooding disaster analysis. Based on the results, the distribution of the maximum accumulated flooding depth and the probability of occurrence of flooding with different flooding depths in the two periods were calculated (according to the Water Resources Agency’s flooding potential map, depth was divided into ≥0.3 m, ≥0.5 m, ≥1 m, ≥2 m, and ≥3 m), and the flood impact maps were plotted.
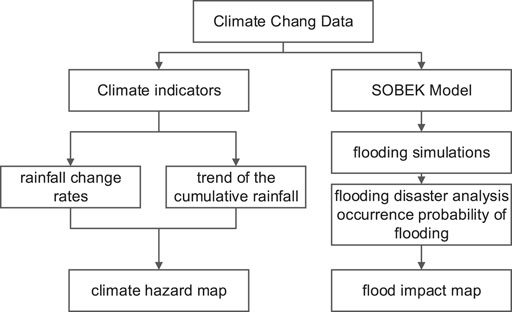
FIGURE 2. Flow chart of the production process.
3.1 Flood impact simulation models
The SOBEK flood model, developed by the Dutch company Delft Hydraulics, integrates rivers, regional drainage systems, and urban rainwater drainage systems and includes modules for rainfall runoff (RR), open channel flow, sewers, water quality, sand transport, overland flow, and real-time control. Applications of the model include river, urban sewer system, and flooding simulations. Simulation results can be used as a reference for flood control by water resource managers for relevant management, decision-making, and analysis (Deltares, 2015). This study applied the high-efficiency SOBEK model calibrated and verified by the Water Resources Planning Institute, Water Resources Agency, Ministry of Economic Affairs. The RR, channel flow, and overland flow modules were used for simulation. The construction of the one-dimensional numerical model was mainly based on the existing river engineering facilities, including river cross-sections, sewers, weirs and gates, pumping stations, bridges, maricultural farms, and other related features.
3.1.1 SOBEK-urban 1DFLOW and RR modules
Hydrological analysis in the RR module applied the Sacramento Model to simulate the formation of RR, including evaporation, infiltration, subsurface runoff, and underground water discharge. This physically based model entails converting effective rainfall at the surface into surface runoff through a unit hydrograph and then adding soil surface moisture, intermediate flow, and groundwater discharge (base flow) to obtain the total runoff. The Sacramento Model includes a mathematical equation that accounts for each process in the transformation of rainfall into outflow towards a river. The concept of the Sacramento Model is shown in Figure 3.
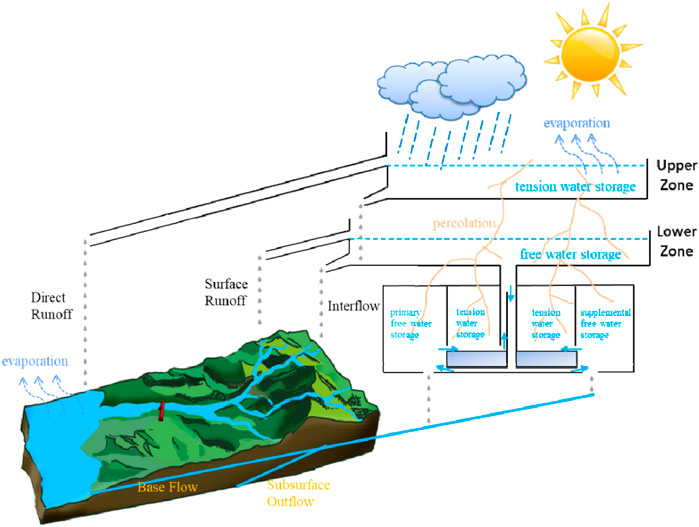
FIGURE 3. Concept of the Sacramento model.
3.1.2 SOBEK-rural 1DFLOW module
River flood routing in SOBEK-Rural is based on the dynamic wave transfer theory for one-dimensional (1D) varied flow; that is, de Saint-Venant’s gradually varied flow equation for describing water flow in rivers. This module can be set to simulate river bridges, reservoirs, and structures crossing river channels such as weirs, culverts, orifices, and pump stations. Equations of continuity (1) and motion (2) were considered for flood routing on the basis of de Saint-Venant’s 1D gradually varied flow equation, which is the dynamic wave model:
where Q is the discharge (m3/s), g denotes acceleration caused by gravity (m/s2), h is the water depth (m), t denotes time (s), x refers to distance (m), R is the hydraulic radius (m), qlat is the lateral discharge per unit length (m3/s), Af is the flooded area (m2), B is the flow width (m), C is the Chezy coefficient, τw is the wind shear stress (N/m2), and ρw is the density of water (kg/m3).
3.1.3 SOBEK-rural 1DFLOW and of modules
The OF module of SOBEK-Rural is designed to calculate two-dimensional (2D) flooding scenarios. The module is fully integrated with the 1DFLOW module for accurate flooding simulation. Surface rainfall is used to generate overland flow (OF) and thereby calculate flow through outside channels. Equations of continuity (3) and motion (4, 5) were considered for flood routing on the basis of a 2D dynamic wave formula:
where u is the x direction average flow (m/s), v is the direction average flow (m/s), V denotes velocity
3.1.4 1D-2D connection
When calculating the combined 1D CF module and 2D OF module, RR is regarded as the discharge under continuous flooding (CF). The 2D grid cell is counted as part of the 1D node, as shown in Figure 4.
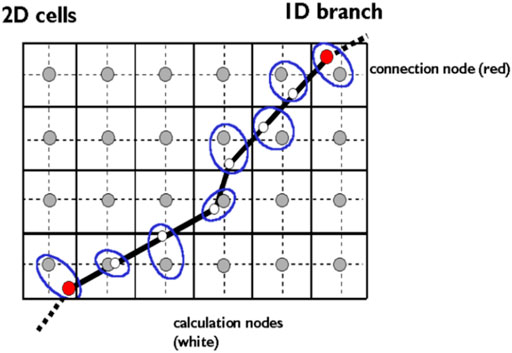
FIGURE 4. Connections between the 1D and 2D modules (SOBEK, 2015).
3.2 Selection of data parameters in the study area
This study used the SOBEK numerical model, which is shown in Figure 5. According to the hydrological and geological data required for flooding simulation, rainfall, tide level, terrain elevation, land use, and river cross-section data were included. The relevant contents are briefly described as follows:
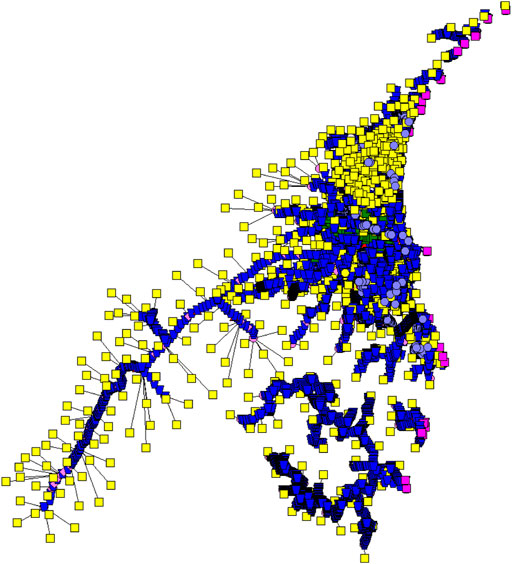
FIGURE 5. The SOBEK numerical model for the Yilan area.
3.2.1 Rainfall data
The rainfall data for the SOBEK model corresponded to the spatial distribution of the catchment areas. The total area of the subcatchments and the precision of the rainfall data grid were relatively small; therefore, the rainfall grid data were first refined from 5 km to 1.3 km by spatial interpolation conversion, and then the rainfall weights were calculated according to the proportion of the grid occupied by the catchments to determine the rainfall of the catchment area used in the SOBEK model. A schematic diagram of the catchment divisions is shown in Figure 6.
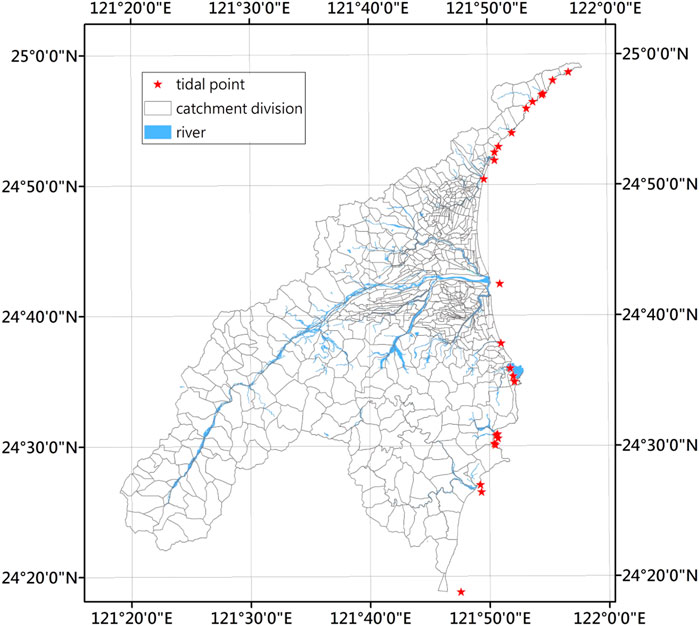
FIGURE 6. Diagram of catchment divisions and tidal points for the Yilan area.
3.2.2 Tide-level data
By using the global ocean tide prediction model, the longitudinal and latitudinal coordinates of the precalculated points and the simulation time were input into the hydrological model to obtain the water level of the point at that time (Water Resources Agency, Ministry of Economic Affairs, 2011). For the Yilan area, 24 downstream boundary conditions were included. The longitude and latitude and the simulation time of each point were entered into the model, and the storm tide simulation was performed to obtain the hourly tide-level data for each point. The relative positions of the tide points are shown in Figure 6 with red asterisks.
3.2.3 Terrain elevation data
The climate change scenario focused on an analysis of large-scale flooding conditions and measured the simulated longitude and the model performance. A digital elevation model (DEM) was used to determine the elevation of the terrain. The model was based on the latest 40-m spatial resolution data from the Ministry of the Interior.
3.2.4 Land use data
The nine major categories of land use data from the Ministry of the Interior in 2019, including agriculture, forestry, transportation, water conservancy, construction, public, recreational, mineral salt, and others, were used.
3.2.5 River cross-section data
The river cross-section data were provided by the Water Resources Agency and the Yilan County Government (Yilan County Government, Taiwan, 2020) and included all the main tributaries of the rivers managed by the central government and the drainages managed by the districts and townships of Yilan County. However, many drainages that are managed by districts and included in the model lacked cross-sectional data, so these drainages were processed by using a 1-m high-resolution DEM, orthophotography, or Google images and street maps.
4 Research results and discussion
4.1 Rainfall hazard analysis under the climate change scenario
The climate hazard map indicators refer to the simulation scenario of the flood potential map of the Ministry of Economic Affairs, and rainfall can be represented by four indicators: the total cumulative rainfall, the maximum 24-h cumulative rainfall, the maximum 12-h cumulative rainfall, and the maximum 6-h cumulative rainfall. Based on the top 30% of the events in both periods, rates of change in rainfall were calculated, and climate hazard maps were plotted, as shown in Figure 7.
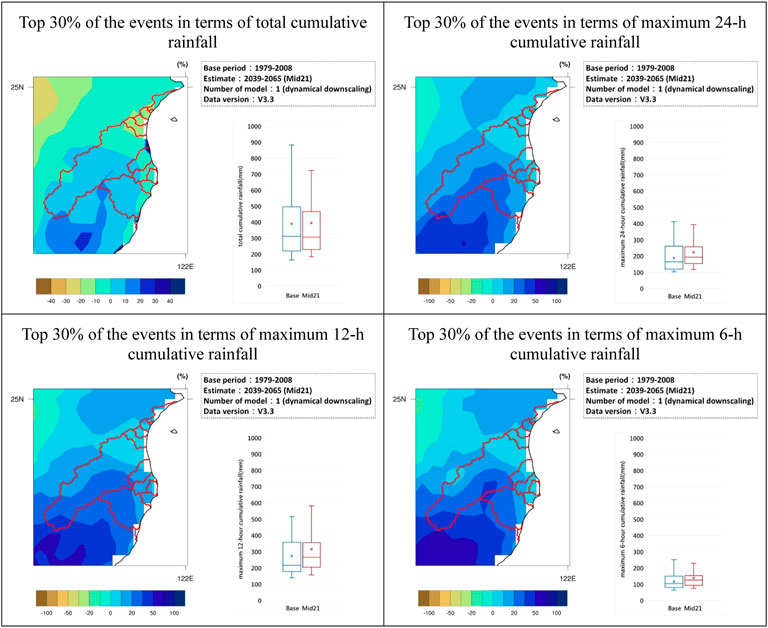
FIGURE 7. Climate hazard maps for the Yilan area.
As shown in Figure 7, based on the top 30% of the events in terms of the total cumulative rainfall, the rate of change in rainfall was projected to decline in the northern portion of the study area and most of the coastal areas and increase in the upper reaches of Lanyang Creek and Nan-ao Creek; the average rainfall was approximately 389 mm in the base period and was predicted to be approximately 394 mm in the middle of the century, with an increase of approximately 5 mm. Based on the top 30% of the events in terms of the maximum 24-h cumulative rainfall, the rainfall change rate was projected to increase overall and decrease from south to north (decreasing from upstream to downstream along Lanyang Creek); the average rainfall was approximately 273 mm in the base period and projected to be approximately 316 mm in the middle of the century, with an increase of approximately 43 mm. Based on the top 30% of the events in terms of the maximum 12-h cumulative rainfall, the rainfall change rate was projected to increase overall and decline from south to north (decreasing from upstream to downstream along Lanyang Creek); the average rainfall was approximately 188 mm in the base period and projected to be approximately 224 mm in the middle of the century, for an increase of approximately 36 mm. Based on the top 30% of the events in terms of the maximum 6-h cumulative rainfall, the rainfall change rate was projected to increase, and the magnitude of predicted change in the middle and upper reaches of Lanyang Creek and Nan-ao Creek was relatively large; the average rainfall was approximately 117 mm in the base period and projected to be approximately 139 mm in the middle of the century, with an increase of approximately 22 mm.
Values predicted for the four indicators are summarized in Table 1. Table 1 shows that the rainfall change rates of the top 30% of the events in terms of the maximum 6-h and 12-h cumulative rainfalls were greatest; the increase in the average cumulative rainfall was the largest for the top 30% of the events in terms of the maximum 24-h cumulative rainfall.
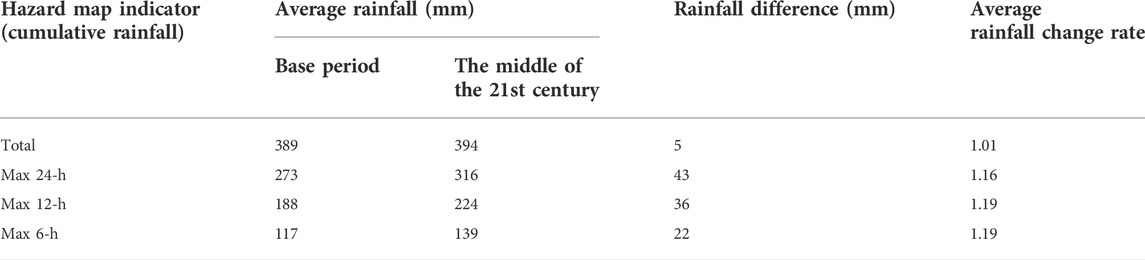
TABLE 1. Rainfall statistics in the base period and projected for the middle of the century in the Yilan area.
4.2 Flood disaster impact analysis
For the flood impacts under the climate change scenario, the 24-h rainstorm frequency obtained from the regional drainage system planning and management of the Water Resources Agency was used as a reference, and the SOBEK flood model was used to perform flood simulations for the top 30% of the events in terms of the maximum 24-h cumulative rainfall in the two periods. Based on the simulations, the distribution of the maximum accumulated flooding depth and the probability of flooding with different flooding depths in the two periods were calculated (according to the Water Resources Agency’s flooding potential map, the depth was divided into ≥0.3 m, ≥0.5 m, ≥1 m, ≥2 m, and ≥3 m), and the flood impact maps were plotted.
In terms of the distribution of the maximum accumulated flooding depth (depth ≥0.3 m), the maximum flooded area of the Yilan area was approximately 42 km2 in the base period and projected to be approximately 74 km2 in the middle of the century, i.e., the flooded area in the middle of the century was forecast to increase by approximately 1.7 times compared to that in the base period. In addition, the maximum flooded area was compared between the flooding depth <0.5 m and the flooding depth >0.5 m, and the results show that the ratio of area flooded was approximately 3:7 in the base period and predicted to be approximately 2:8 in the middle of the century. This comparison shows that the overall flooded area for flooding depths >0.5 m is expected to increase, and the overall flooding depth in the middle of the century is predicted to increase.
The biggest difference between this study and previous studies is that most previous studies that have assessed flood impacts have most often used a single extreme rainfall event, which cannot address the uncertainty in flooding results. To reduce the uncertainty of flooding simulation, this study used a large number of typhoon events to assess the probability of flooding; 30% of 149 typhoon events were identified in the base period (1979-2008), and 30% of 450 typhoon events were projected to occur in the middle of the century (2040-2065). Furthermore, to better show the difference in the potential for occurrence and to conservatively assess the possible disaster-affected areas in the future, probability of occurrence was divided into three levels of low, medium, and high (i.e., <25%, 25-50%, and >50%, respectively). By classifying the occurrence probability >50% as the high level, greater attention and assessment can be devoted to the possibility of future adaptation planning in the distribution area. The flooded areas under different occurrence probabilities were compared between the two periods. In the base period, approximately 85% of the area showed a low probability, 13% had a medium probability, and 2% had a high probability; in the middle of the century, approximately 93% of the area was found to have a low probability, 6% had a medium probability, and 1% had a high probability. According to the distribution of disasters in the two periods, flooding is mostly concentrated in the lower reaches of Houdongkeng Creek, Dezikou Creek, Lanyang Creek, Dongshan River, and Xincheng Creek, and occurrence probability was relatively high around the estuaries of Houdongkeng Creek, Dezikou Creek, and Lanyang Creek; the confluence of the Dongshan River; and the coastal area of Xincheng Creek, as shown in Figure 8.
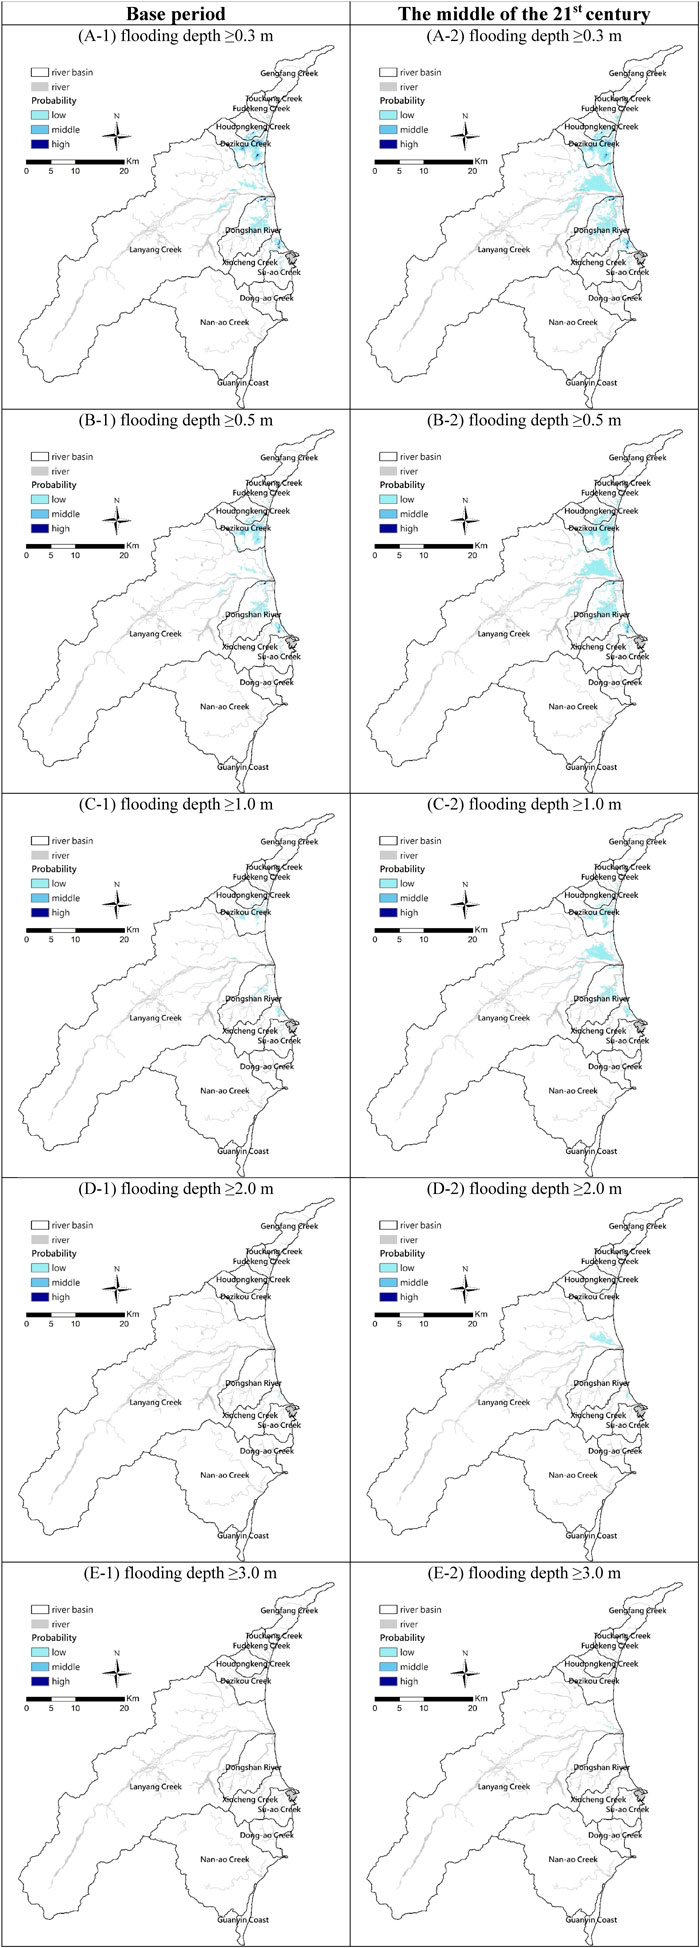
FIGURE 8. Continued.
4.3 Flood impact map application in yilin county
The flood impacts obtained in this study can be applied in various fields, such as agriculture, fisheries, stock farming, and transportation. The selection and overlay were performed by combining different land uses and impact indicators, which can reveal the potential range of impacts on different land uses and the probability of future flooding to facilitate the subsequent evaluation of relevant disaster mitigation and adaptation planning strategies.
The formulation and updating of land use classification in Taiwan is carried out by the National Land Surveying and Mapping Center, Ministry of Interior. The first level is divided into nine categories, including agriculture, forest, traffic, water, building, public, recreation, rock salt, and other land use. The second level is subdivided into 48 categories according to the first level. This study applied the land use data for the nine categories in Yilin (shown in Figure 9) for flood impact assessment.
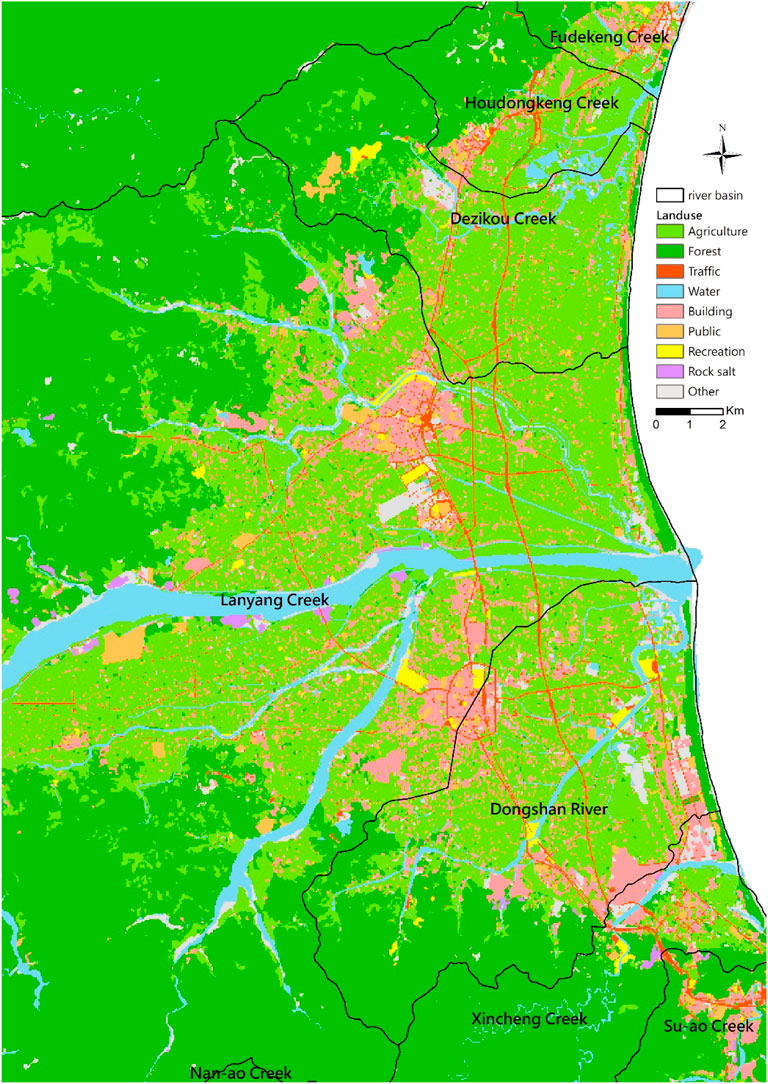
FIGURE 9. Land use distribution map for the Yilan area (First level: nine categories).
In this study, according to the land use distribution, the occurrence probability map for flooding depths ≥0.3 m was overlaid with the nine land use categories listed above, and an analysis was performed. Not including land related to water use (that is, facilities used for water distribution and storage), agricultural land covered the most flooded area in the base period and was projected to do so in the middle of the century. The second highest coverage was found for construction land, accounting for approximately 4.4% in the base period and approximately 6.8% in the middle of the century; the third place was other land use (wetland, grassland, bare land, open land, etc.), accounting for approximately 4.4% in the base period and approximately 3.7% in the middle of the century.
Because agricultural land covers the most flooded area, this study further analysed agricultural classification. The secondary level of classification of agriculture includes farmland, aquaculture, livestock farms and poultry houses, and agricultural production facilities. In this study, farmland, maricultural farms, and livestock farms were selected for the application of flooding impact map data.
According to the statistics of the Council of Agriculture, Executive Yuan, ROC, there are rice, scallion, cabbage, watermelon, and other crops in the Yilan area, dominated by rice. Therefore, rice production area is the most affected, so the evaluation was mainly based on paddy fields. Rice crops in the mature stage are easily damaged if soaked in water for a long time. Therefore, the occurrence probability map for flooding depths ≥0.3 m was overlaid with a paddy field map, as shown in Figure 10. Figure 10 shows that the affected paddy fields were distributed downstream of Dezikou Creek, Lanyang Creek, the Dongshan River, and Xincheng Creek. The numerical analysis shows that the affected paddy fields accounted for approximately 727 ha (24% of the area of all paddy fields in the Yilan area) in the base period and were projected to account for approximately 1,214 ha (40% of the area of all paddy fields in the Yilan area) in the middle of the century, with the affected area in the middle of the century approximately 1.7 times that of the base period (Table 2).
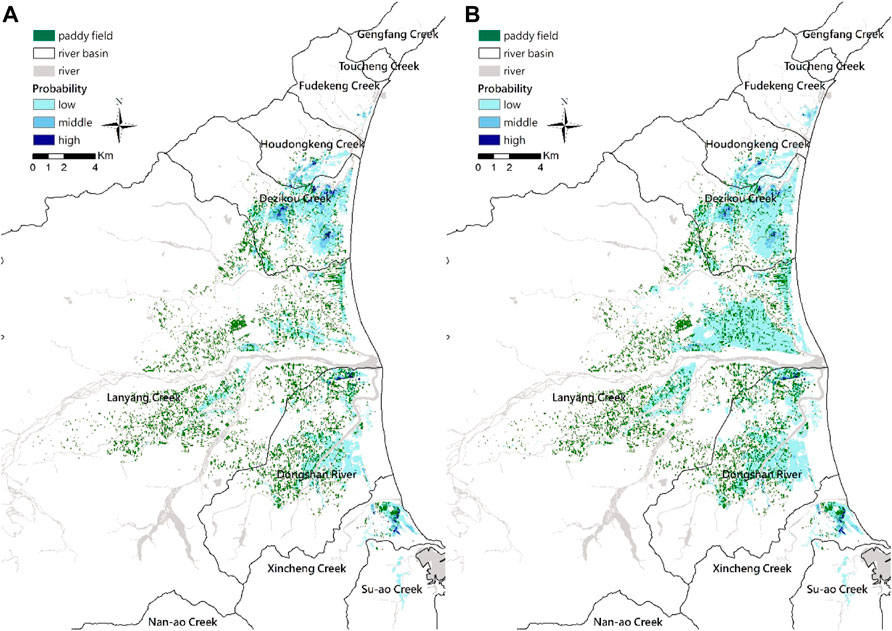
FIGURE 10. Overlaid maps of paddy field and flood impacts for the flooding depth ≥0.3 m in the Yilan area: (A) base period and (B) the middle of the century.
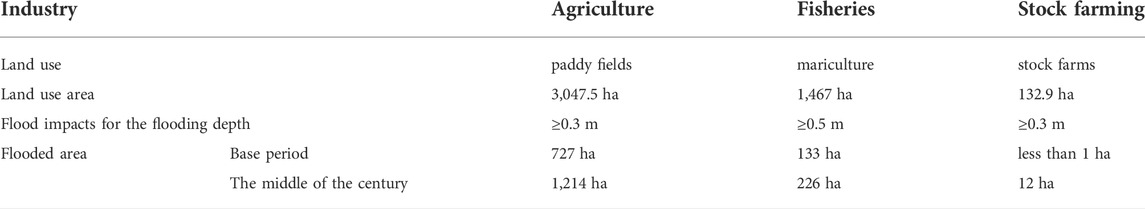
TABLE 2. Comparison of the areas affected by flooding in the Yilan area.
The maricultural farms in the Yilan area are mainly cement ponds with mixed saltwater and freshwater, and the main cultured species include Penaeus japonicus, Penaeus monodon, Scylla serrata, and Haliotis diversicolor aquatilis. For this type of mariculture, the rainfall and disturbance caused by typhoon events may lead to changes in osmotic pressure of the pond water, threatening the survival of cultured species. In addition, excessive rainfall can cause flooding events, such as a sudden increase in river runoff and overflowing dikes, which may damage mariculture and cause the loss of fish and shrimp. Because the typical height of most maricultural farm dikes is approximately 0.5 m, the occurrence probability map for flooding depths ≥0.5 m was overlaid with a maricultural farm map, and an analysis was performed. The maricultural farm map and flood impact map for flooding depths ≥0.5 m in the two periods were overlayed, as shown in Figure 11. Figure 11 shows that the affected maricultural farms were distributed in the areas of Houdongkeng Creek and Dezikou Creek. The numerical analysis showed that the affected maricultural farms accounted for approximately 133 ha (9% of the area of all mariculture in the Yilan area) in the base period and were projected to cover approximately 226 ha (15% of the area of all mariculture in the Yilan area) by the middle of the century, with the affected area in the middle of the century projected to be approximately 1.7 times that of the base period.
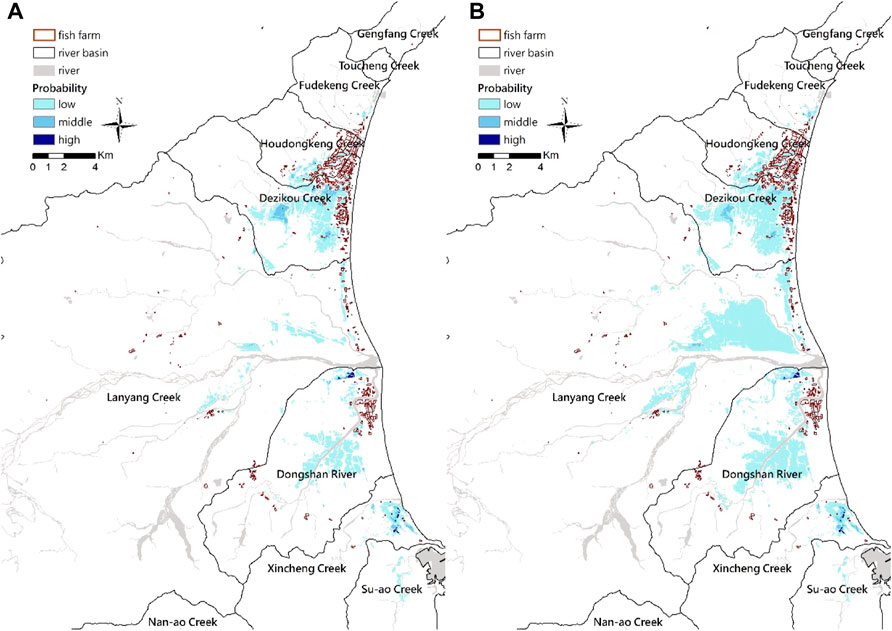
FIGURE 11. Overlaid maps of fish farms and flood impacts for flood depths ≥0.5 m in the Yilan area: (A) base period and (B) the middle of the century.
With regard to stock farming, the Yilan area is known for ducks. Relevant products include duck treats, roasted duck, duck eggs, etc., which are special products of the Yilan area. There is even Taiwan’s first duck tourism factory, which demonstrates the importance of ducks in the Yilan area. In addition to ducks, there are also sheep, pigs, chickens, and other livestock. Flooding can damage machinery and equipment, cause livestock deaths, etc. If a large number of livestock die, the corpses are soaked in water, making them difficult to handle and potentially also indirectly bringing about infectious diseases and other effects. Stock farming is scattered in the Yilan area, so there are fewer areas affected by flooding. The occurrence probability map for flooding depths ≥0.3 m was overlaid with a stock farming map, as shown in Figure 12. Figure 12 shows that flooding did not affect stock farms during the base period, and affected stock farms were projected to account for approximately 12 ha (9% of the area of all stock farms in the Yilan area) in the middle of the century.
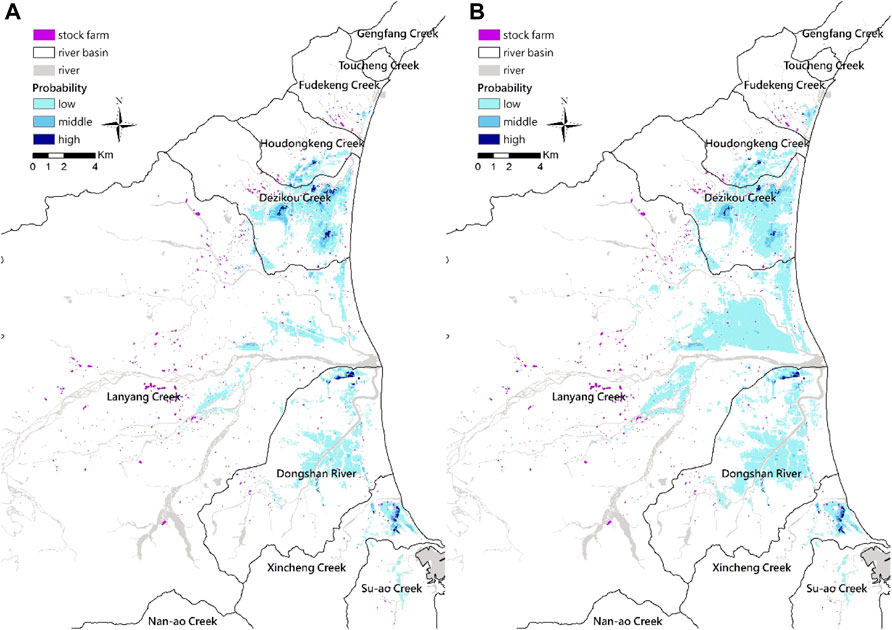
FIGURE 12. Overlaid maps of stock farms and flood impacts for flood depths ≥0.3 m in the Yilan area: (A) base period and (B) the middle of the century.
The areas of the three industries impacted in this study are compared in Table 2. The range of impact on industry is projected to increase due to flooding disasters under climate change. Based on the impacts of flooding on different land uses, various adaptation measures can be carried out on a scientific and quantitative basis, including pumping part of the water from rice fields before a typhoon, increasing the elevations of maricultural farms, improving the drainage systems of the floodplains by engineering methods, changing planting areas, etc.
5 Conclusion
In this study, the Yilan area was used as an example, and estimated typhoon event data were applied (the typhoon event data were first obtained by a HiRAM under the RCP 8.5 scenario and then processed with dynamical downscaling). In total, 149 typhoon events were identified in the base period (1979-2008), and 450 typhoon events were projected to occur in the middle of the century (2040-2065). Relevant simulations and analyses were performed. Based on the results, climate hazard and flood impact maps were plotted.
As shown in the climate hazard maps, based on the top 30% of the events in terms of the total cumulative rainfall, the rainfall change rate was predicted to increase in the northern portion of the study area and most of the coastal areas and increase in the upper reaches of Lanyang Creek and Nan-ao Creek; the average rainfall was approximately 389 mm in the base period and projected to be approximately 394 mm in the middle of the century, with an increase of approximately 5 mm and a rainfall change rate of 1.01. The results for the four indicators show that the rainfall change rates of the top 30% of the events in terms of the maximum 6-h and 12-h cumulative rainfall were greatest; the increase in the average cumulative rainfall was the largest for the top 30% of the events in terms of the maximum 24-h cumulative rainfall.
In terms of the distribution of the maximum accumulated flooding depth (depth ≥0.3 m), the maximum area flooded in the Yilan area was approximately 42 km2 in the base period and predicted to be approximately 74 km2 in the middle of the century; i.e., the flooded area in the middle of the century is expected to increase by approximately 1.7 times compared to that in the base period. In addition, the maximum flooded area was compared between the flooding depth <0.5 m and the flooding depth >0.5 m, and the results show that the ratio of area flooded was approximately 3:7 in the base period and projected to be approximately 2:8 in the middle of the century. This comparison shows that the overall area flooded for flooding depths >0.5 m and the overall flooding depth are expected to increase by the middle of the century. According to the flood impact maps, the area flooded with different occurrence probabilities were compared between the two periods. In the base period, approximately 85% of the area had a low flood probability, 13% had a medium probability, and 2% had a high probability; in the middle of the century, approximately 93% of the area was projected to have a low probability, 6% a medium probability, and 1% a high probability. According to the distribution of disasters in the two periods, flooding was mostly concentrated in the lower reaches of Houdongkeng Creek, Dezikou Creek, Lanyang Creek, Dongshan River, and Xincheng Creek, and the occurrence probabilities were relatively high around the estuaries of Houdongkeng Creek, Dezikou Creek, and Lanyang Creek; the confluence of the Dongshan River; and the coastal area of Xincheng Creek. This study also employed flood impact maps to assess the impacts on paddy fields, mariculture, and stock farms. From the base period to the middle of the 21st century, the impact of flooding on paddy fields was projected to increase from 24% to 40% of the paddy field land area; flooding of maricultural farms were predicted to increase from 9% to 15%; and flooding of stock farms was expected to increase from less than 1% to 9% of the stock farm land area.
Based on the results described above and the flood hazard and flood impact maps, the rainfall changes, the differences in the degree of flooding, and the probabilities of flooding in the two periods in the study area can be understood, and the results can be used as an important reference for subsequent risk assessments. Future research will focus more on uncertainty considering both rainfall events and flooding simulations. Due to the limitations of computer resources, this research only examined the first 30% of rainfall events, and additional typhoon events will be added for analysis in the future. In addition, the simulation results for different flooding methods will be added to reduce systematic errors through multimodel results.
Data availability statement
The original contributions presented in the study are included in the article/supplementary materials, further inquiries can be directed to the corresponding author.
Author contributions
Miss Hsiao is the main writer of this article, and conducts results analysis, hazard and impact map drawing, and industrial application analysis. Mr. Chen assists with climate change scenario data processing and SOBEK model flooding simulation. PhD. Chao and PhD. Li provides suggestions on research directions, article writing methods, and map presentations. Prof. Ho gives technical guidance on the application of industrial. PhD. Hsu gives technical guidance on SOBEK model simulation adjustment. Prof. Yeh gives technical guidance on flooding disaster analysis.
Acknowledgments
We thank the National Science and Technology Council for providing equipment and resources and are grateful for the flooding module provided by the Water Resources Planning Institute, Water Resources Agency, Ministry of Economic Affairs.
Conflict of interest
The authors declare that the research was conducted in the absence of any commercial or financial relationships that could be construed as a potential conflict of interest.
Publisher’s note
All claims expressed in this article are solely those of the authors and do not necessarily represent those of their affiliated organizations, or those of the publisher, the editors and the reviewers. Any product that may be evaluated in this article, or claim that may be made by its manufacturer, is not guaranteed or endorsed by the publisher.
References
Bhattacharya, N. (2010). Flood risk assessment in Barcelonnette, France. Int. Inst. Geo-Information Sci. Earth Observation.
Chiang, H. Y., and Cheng, C. T. (2020). Changes in rainfall characteristics of catastrophic typhoons under climate change. China: Taiwan Climate Change Projection Information and Adaptation Knowledge Platform TCCIP. e-newspaper, Issue 43 https://tccip.ncdr.nat.gov.tw/km_newsletter_one.aspx?nid=20201117180501.
Chow, C., Chen, W. T., Lo, M. H., Lee, M. A., Hsu, H. H., Hung, C. C., et al. (2017). Taiwan climate change scientific Report (Book1) - physical phenomena and mechanisms. China: Taiwan Climate Change Projection Information and Adaptation Knowledge Platform TCCIP. https://tccip.ncdr.nat.gov.tw/publish_01_one.aspx?bid=20171220135820.
Dahm, R., Hsu, C. T., Lien, H. C., Chang, C. H., and Prinsen, G. (2014). Next generation flood modelling using 3Di:A case study in Taiwan. DSD Int. Conf, Hong Kong, Paper (A5-3). Available at: https://www.dsd.gov.hk/rdforum/2014/abstract/Paper%20(A5-3).pdf
Deltares, (2015). Hydraulics SOBEK User Manual. Delft: The Netherlands. (suitable for SOBEK 2.14). Available at: https://content.oss.deltares.nl/delft3d/manuals/SOBEK_User_Manual.pdf
Guo, W. D., Wei, H. P., Yeh, S. H., Fu, H. S., Chen, W. B., and Chang, C. H. (2019), Analysis and comparison of different hydrodynamic flooding models applied to flooding simulation in Jiadong Fangliao area, The 24th Hydraulic Engineering Conference, Taiwan, 12-14.9.2018.
Hsiao, Y. H., Chao, Y. C., Chen, L. T., Hsu, C. T., Li, H. C., and Yeh, K. C. (2019), Flood disaster assessment under climate change in Taichung city, Taiwan., 16th Annual Meeting Asia Oceania Geosciences Society, 28 Jul to 2 Aug, 2019, Singapore, AS08-D3-PM1-P-059AOGS, AS08-A014, page M124.
Lai, J. M. (2015). Study on street flooding simulations by multi-scale grid configuration and building effect. Taiwan: National Chiao-Tung University. Thesis.
Mizuta, R., Arakawa, O., Ose, T., Kusunoki, S., Endo, H., and Kitoh, A. (2014). Classification of CMIP5 future climate responses by the tropical sea surface temperature changes. SOLA 10, 167–171. doi:10.2151/sola.2014-035
National Science and Technology Center for Disaster Redution (NCDR) Global disaster event Book. New Taipei, Taiwan: National Science and Technology Center for Disaster Redution NCDR. https://den.ncdr.nat.gov.tw/.
Suman, A., and Akther, F. (2014), River flood modelling using SOBEK: A case study from ciliwung catchment, Indonesia, Int. J. Eng. Res., Volume No.3, Issue No.11, pp : 662–668. doi:10.17950/ijer/v3s11/1108
Tong, C. P., Lee, P. F., Lin, H. J., Li, M. H., Lu, H. S., Chang, C. C., et al. (2017). National science and Technology center for disaster reduction. Taiwan: Taiwan Climate Change Projection Information and Adaptation Knowledge Platform TCCIP. https://tccip.ncdr.nat.gov.tw/publish_01_one.aspx?bid=20171220140117.
Van, P. D. T., Popescu, I., van Griensven, A., Solomatine, D. P., Trung, N. H., and Green, A. (2012). A study of the climate change impacts on fluvial flood propagation in the Vietnamese Mekong Delta. Hydrol. Earth Syst. Sci. 16, 4637–4649. doi:10.5194/hess-16-4637-2012
Water Resources Agency (2018). Application of hydro digital elevation model on high resolution inundation modeling. Taiwan: Water Resources Agency, Ministry of Economic Affairs. Water Resources Planning institute.
Water Resources Agency (2011). Research on the production of national coastal flooding potential map data. Taichung, Taiwan: Water Resources Agency1/2
Water Resources Agency (2012). Water resources planning institute. Taiwan: Water Resources Agency, Ministry of Economic Affairs. The study of flood inundation simulation and damage control plan in response to climate change (3/3) final report.
Wei, H. P., Su, Y. F., Cheng, C. T., and Yeh, K. C. (2020). Levee overtopping risk assessment under climate change scenario in kao-ping river, taiwan. Sustainability 12, 4511. doi:10.3390/su12114511
Wei, H. P., Yeh, K. C., Liou, J. J., Chen, Y. M., and Cheng, C. T. (2016). Estimating the risk of river flow under climate change in the tsengwen river basin. Water 8, 81. doi:10.3390/w8030081
Wu, S. J., Chang, C. H., and Hsu, C. T. (2020). Real-time error correction of two-dimensional flood-inundation simulations during rainstorm events. Stoch. Environ. Res. Risk Assess. 34, 641–667. Springer. doi:10.1007/s00477-020-01792-2
Keywords: climate change, extreme typhoon events, rainfall change rate, flooding, Taiwan, Yilan
Citation: Hsiao Y-H, Chen C-C, Chao Y-C, Li H-C, Ho C-H, Hsu C-T and Yeh K-C (2022) Development and application of flood impact maps under climate change scenarios: A case study of the Yilan area of Taiwan. Front. Environ. Sci. 10:971609. doi: 10.3389/fenvs.2022.971609
Received: 17 June 2022; Accepted: 08 August 2022;
Published: 02 September 2022.
Edited by:
Ali Danandeh Mehr, Antalya Bilim University, TurkeyReviewed by:
Nasrin Fathollahzaddeh Attar, University of Tabriz, IranMir Jafar Sadegh Safari, Yaşar University, Turkey
Mohammad Ali Ghorbani, University of Tabriz, Iran
Copyright © 2022 Hsiao, Chen, Chao, Li, Ho, Hsu and Yeh. This is an open-access article distributed under the terms of the Creative Commons Attribution License (CC BY). The use, distribution or reproduction in other forums is permitted, provided the original author(s) and the copyright owner(s) are credited and that the original publication in this journal is cited, in accordance with accepted academic practice. No use, distribution or reproduction is permitted which does not comply with these terms.
*Correspondence: Ching-Hsien Ho, Q0NIT0Bua3VzdC5lZHUudHc=