 Wen Tong
 Hengyu Liu2*
- 1Department of Logistics Economics and Statistics, School of Economics and Management, Shanghai Maritime University, pudong, China
- 2Department of Management Science and Engineering, School of Economics and Management, Beijing University of Posts and Telecommunications, Beijing, China
- 3Upper Great Plains Transportation Institute, NDSU, Fargo, ND, United States
Governments, enterprises, and customers have become more concerned about environmental protection. Following the world’s largest carbon trading market (EU ETS), China has also implemented a market-based carbon trading mechanism (CAT) to reduce CO2. Simultaneously, customers have low-carbon preferences for environmental products. Thus, the enterprises’ strategic decisions and collaboration modes have changed. This article develops the Stackelberg game model to explore the impacts of CAT and customers’ low-carbon preference on the carbon emission reduction and promotion strategies in a retailer-led supply chain (such as RT-Mart, Walmart, Amazon, etc.). In this model, the retailer decides whether to promote environmentally safe products and the manufacturer decides whether to reduce CO2. We find that carbon trading market price and customers’ low-carbon preference are key factors influencing the retail price, total carbon emissions, and social welfare. Interestingly, there is not always a positive correlation between customers’ low-carbon preference and social welfare. To achieve Pareto improvement of social welfare, manufacturers and retailers require co-optimization. Theoretically, our research enriches the research streams of the CAT policy and socially responsible operations of the supply chain. Moreover, managerial insights are provided for retailer-led supply chain stakeholders and emission reduction regulators, which contribute to enhancing the social and environmental benefits of the supply chains.
Introduction
Carbon dioxide, methane, ozone, and other greenhouse gasses (GHG) from industrial production processes mainly cause climate change. Among them, carbon dioxide accounted for the highest proportion of 65% (Solomon et al., 2009). Governments and enterprises are becoming more concerned about environmental protection (Fang et al., 2021). To achieve its carbon peak and carbon neutrality targets, China has implemented policies, legislations, and supporting measures for peaking CO2 emissions in core areas and key industries, and map paths (such as the “1 + N” policy framework) to achieve carbon peaking and carbon neutrality goals (Z. Sun et al., 2022). Following the world’s largest carbon trading market (EU ETS), China has also implemented a market-based carbon trading mechanism (CAT) to reduce carbon emissions. CAT is a market-based mechanism that allows carbon credits to be traded freely as a commodity. At the beginning of each accounting year, the government allocates free carbon quotas (called emissions cap) to an enterprise with high carbon emissions. The cap is always the hardest challenge in CAT. If the enterprise emits a smaller amount of CO2 emissions than the emissions cap, it can gain additional revenue by selling surplus carbon quotas; otherwise, to avoid high fines, it has to go to the carbon trading market to buy carbon quotas (Benjaafar, Li, and Daskin 2013). Since 2011, China has established Beijing, Shanghai, Guangdong, and five other carbon trading systems. That means that CAT, which could have an impact on the enterprises’ strategic decisions and collaboration modes, has created a new mechanism of the costs and returns account for enterprises.
Another factor that contributes to strategic decisions in a retailer-led supply chain is the customers’ environmental preferences. In recent years, customers have become more concerned about protecting the environment and are willing to pay more for low-carbon products. Low-carbon products (e.g. natural bamboo and wood products, solar energy products, electronic signatures, and inverter air conditioners) refer to products that can save energy and reduce GHG emissions. “Carbon labels” or other channels can provide information on the emission-reduction level for consumers. The 2021 China Sustainable Consumption Report said that over 70% of consumers believe that low-carbon consumption can motivate the achievement of the “30·60” carbon peaking and carbon neutrality goals.
As mentioned previously, a manufacturer may be incentivized by CAT and customers’ environmental preferences to invest in carbon reduction technologies (e.g. IRWIN’s Carbon Cure CO2 recovery technology) and projects such as Carbon Sequestration Project (Sun et al., 2020). In 2020, Alibaba conducts clean energy power trading. From January to September 2021, Alibaba traded 224 million kWh of green electricity. From 2018 to September 2021, Alibaba’s Zhangbei Data Center has traded about 600 million kWh of new energy electricity and reduced carbon emissions by 523,000 tons. Meanwhile, powerful retailers (e.g. RT-Mart, Auchan, H&M, Amazon, Alibaba) have gradually more pricing power than manufacturers (Lou et al., 2020; Yuyan Wang et al., 2021), some retailer-led supply chains have occurred. These retailers become more socially responsible to protect the environment (Styles, Schoenberger, and Galvez-Martos 2012). They can install ventilation systems with heat recovery, build an eco-friendly distribution center, encourage customers to participate in environmental protection activities, and promote low-carbon products with carbon labeling by displaying them in preferential areas (Brunner et al., 2018). For instance, Walmart has established a low-carbon marketing team to carry out low-carbon public relations, and actively cooperate with the government, associations, and the media. Walmart has participated in the “Hundreds of Low-Carbon Demonstration Stores” organized by the Chain Store and Franchise Association in China. Walmart also held a 2-month long theme activity named “Focus on Climate Warming and Make the Earth Healthier”. Through low-carbon marketing, Walmart transmits a good low-carbon corporate image to its suppliers and customers.
However, each stakeholder is not concerned about the entire supply chain’s profits; they only act for their own maximized profits. When one enterprise makes efforts to reduce emissions or promote green/sustainable products, other companies will take a free ride to the benefit from the spillover that emerges (Gui et al., 2022). The one who invests in eco-friendly actions will feel unfair. Therefore, this contradiction can be alleviated by cooperation between the upstream and downstream stakeholders to reduce emissions.
Up to now, a thorough understanding of the impacts of CAT on its social and environmental benefits of a retailer-led supply chain and its implications to different stakeholders who are environmentally conscious is absent in the literature yet, especially in operations management (OM). To address this gap, we want to answer the following questions: 1) What are the strategic decisions of supply chain stakeholders under different scenarios considering the consumers’ low-carbon preference and CAT mechanism? 2) What effects do the market price of carbon credits, emission cap, consumers’ environmental behaviors, and other external parameters exert on the equilibrium solutions, total carbon emissions, and profits of the supply chain? 3) What management insights can governments and enterprises get?
We organize the rest of our article as follows: In the Literature review section, we review the relevant literature and identify our research gaps. In the Model formulation section, we describe the model formulations and derive the equilibrium solutions under each strategy combination of the retailer and the manufacturer who all make efforts to do socially responsible operations. In The results analysis section, we theoretically analyze the equilibrium solutions under different modes. In the Modeling calibration and discussions section, we conduct a numerical study and explore more managerial insights. All the proofs are postponed to Appendix A.
Literature review
Considering the CAT mechanism and consumers’ environmental preference for low-carbon producing and selling, this article drives the strategic decisions for the manufacturer and retailer. There are three streams of literature related to this study: 1) sustainable supply chain management, 2) socially responsible operations of the supply chain, and 3) consumers’ buying behavior based on environmental preference.
The first stream of literature related to this study is sustainable supply chain management. We refer readers to Goulder and Schen (2013), Barbosa-Povoa et al. (2018), Koberg and Longoni (2019), and Lu et al. (2022) for comprehensive reviews. Fang et al. (2021) applied the Differences in Differences (DID) method to find that government environmental regulations have a positive impact on corporate green innovation. To increase the benefits of an integrated forward/reverse logistics network and maximize the score of green design and quality indicators, Porkar et al. (2020) developed bi-objective non-linear programming. Zakeri et al. (2015) examined the supply chain performance under carbon taxes and carbon emissions trading by an analytical supply chain planning model. The results showed that the carbon trading scheme was better. Yang et al. (2020) compared the total emission reduction and operational decisions under the grandfathering and benchmarking rules for the allocation of carbon quotas. They found that the emission reduction under the grandfathering rule was greater. Above all, we concluded that these existing studies have mainly researched the impacts of macroeconomic regulations that control carbon emissions on the supply chain performance, ignoring the collaboration mode among supply chain stakeholders, especially in a socially responsible operations management.
Another stream of literature closely related to our study is the socially responsible operations of the supply chain. Some latest literature studies have investigated the low-carbon scenario or carbon-neutral potential of building operations. Xiang et al. (2022) used the decomposing structural decomposition method to assess the decarbonization progress of commercial building operations taking China and the United States (U.S.) as examples. S. Zhang et al. (2022) illustrated the potential for progressive decarbonization of global commercial building operations to achieve carbon neutrality. However, these studies did not consider the CAT mechanism.
A new mechanism of the costs and returns account for enterprises has been created by CAT, which could have an impact on the enterprises’ operation strategies and cooperation modes with other companies (Ma et al., 2021). From the operational management point of view, Wang et al. (2019) studied the joint replenishment policy as well as the carbon trading behavior for a fresh food supply chain. They found that retailers’ leader–follower structure could cause the least carbon emissions. Considering environment protection, Taleizadeh et al. (2022) developed an EOQ model based on partial trade credit combined with partial back-ordering. In this article, demand is affected by selling price and carbon emissions per unit of product. Based on the decision theory, Saunders et al. (2020) determined the optimal level of sustainability for bidding suppliers considering the buyers’ environmental preferences. Min Wang et al. (2021) optimized the operational decisions of a transnational manufacturer under different carbon trading mechanisms implemented in two countries. Xu and Wang (2018) indicated that decentralized decision-making in CLSC could cause a double-marginal effect and affect the operating efficiency of the supply chain. Yuyan Wang et al. (2021) constructed three decision-making models to compare the decisions and benefits of the stakeholders. They proposed a cost-sharing contract with an altruistic preference to coordinate the retailer-led low-carbon supply chain, and found that retailers needed to share more than 1/2 of the carbon emissions cost. Based on the carbon trading mechanism, Mondal and Giri (2021) developed centralized, decentralized, retailer-led revenue sharing, and bargaining revenue sharing models. In addition, they assumed that the manufacturer, retailer, and consumers are all environmentally conscious. The results demonstrated that retailer-led revenue sharing could coordinate the supply chain and improve benefits for both stakeholders. However, they did not consider the retailer’s environmental behavior, such as promoting low-carbon products by advertising or displaying them in the preferential area.
Recently, customers have become more concerned about protecting the environment and are willing to pay more for low-carbon products (Du et al., 2015; Dardanoni and Guerriero 2021). To solve the problem of carbon emissions transfer and reduction among supply chain stakeholders, Sun et al. (2020) constructed a Stackelberg differential game model with considerations of emissions reduction technology lag time and customers’ environmental preferences. Tong and Du (2019) developed an actual evolutionary game process to examine the evolution of the behaviors of powerful retailers and manufacturers with consideration of CAT and customers’ low-carbon preferences.
The work that is most related to ours is that of Xia et al. (2018), who indicated that customers’ low-carbon preferences motivated supply chain members to make efforts to reduce carbon emissions and promote low-carbon products under the CAT system. Our work differs from that of Xia et al. (2018) in two aspects as follows. First, Xia et al. (2018) suppressed the influence of wholesale price and retailer price. In this work, we optimize both wholesale price and retailer price. Second, Xia et al. (2018) analyzed the farms’ environmental behavior from the perspective of coordinating the supply chain, and thus did not take into account the collaboration modes among supply chain stakeholders. From the perspective of micro-games, we characterized the farms’ equilibrium strategic decisions under five scenarios.
For the convenience of the readers, a quick overview of the closely relevant previous research articles has been provided in comparative Table 1. From this table, most mentioned articles have failed to take carbon emission issues of the retailer-led supply chain structure into account. Also, most articles on carbon emissions have failed to consider the collaboration modes and the environmental preferences of the manufacturer, retailer, and consumers simultaneously in real-life situations. Therefore, our research enriches the research streams mentioned previously. That is, to address these gaps, we developed the Stackelberg game model to explore the impacts of CAT and customers’ low-carbon preference on the carbon emissions reduction and promotion strategies in a retailer-led supply chain.
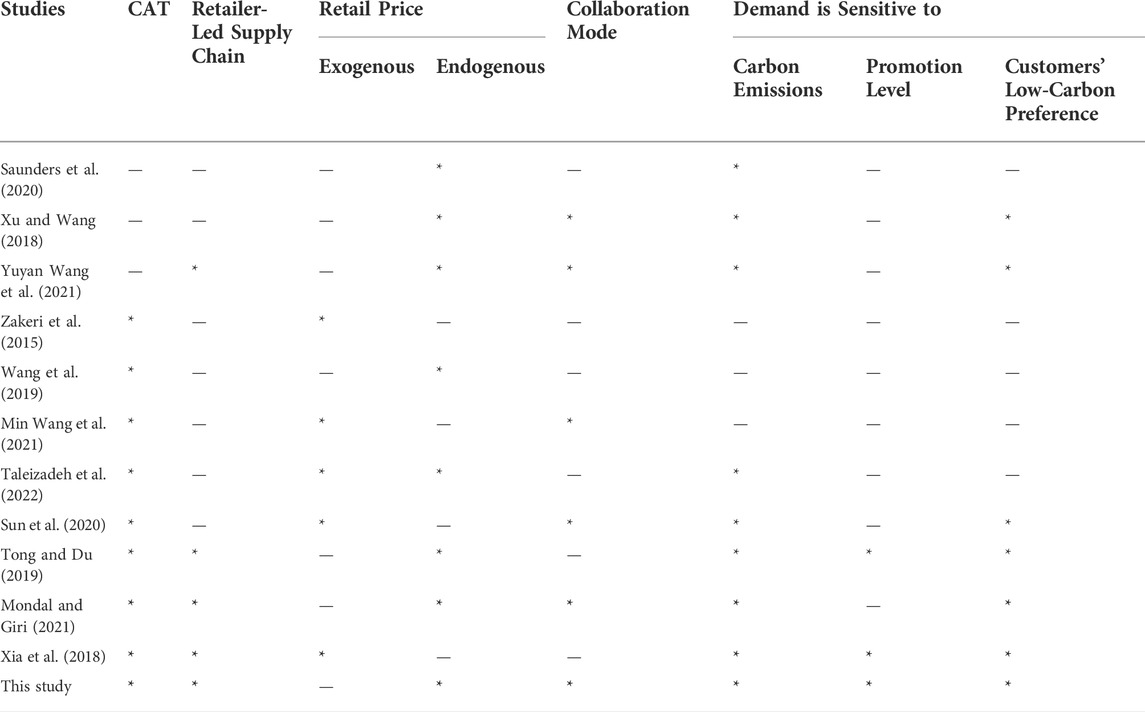
TABLE 1. The contributions of our research.
Model formulation
Model description
In this section, considering the CAT mechanism and customers’ low-carbon preferences, we develop a Stackelberg game model to identify the optimal decisions for the manufacturer and retailer who are perfectly rational and make economic profits. In a retailer-led supply chain, the manufacturer responds to customers’ environmental preferences by introducing low-carbon products to meet the demand. It sells ordinary products or low-carbon products to the retailer. The retailer sells these products to the customers. The timeline of the events is as follows (see Figure 1).
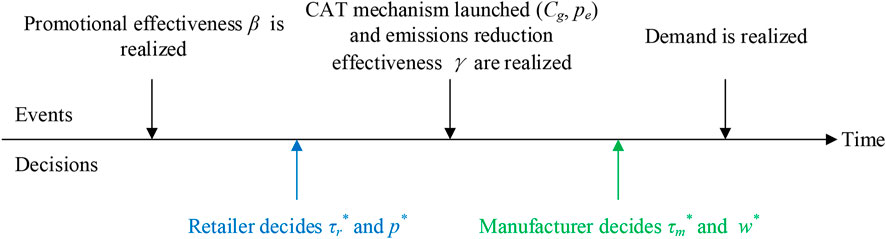
FIGURE 1. Two-echelon supply chain structure.
As depicted in Figure 1, 1) the effectiveness of promoting low-carbon products β can be realized by retailer’s market survey or forecasting. Based on β, the retailer simultaneously and individually decides whether to invest in promoting low-carbon products (P) or not invest in promotion (NP), the promotional effort level τr., and low-carbon products’ retail price p. The promotion cost coefficient can be denoted as hr.
2) Based on the baseline method, the manufacturer can be allocated free carbon quotas Cg by the government. The initial carbon emissions per unit of product are em. In particular, carbon credits can only be bought/sold in one production period at market price pe. The carbon trading price is only determined by the carbon market. Particularly, we assume that the technology of carbon emissions reduction will not change significantly in a short period because of the long investment cycle. The manufacturer’s market survey can realize the effectiveness of carbon emissions reduction γ.
3) According to the retailer’s decisions and information about CAT, the manufacturer acts as a follower who simultaneously and individually decides whether to invest in reducing carbon emissions (R) or not reducing carbon emissions (NR), the emissions reduction level τm, and the products’ wholesale price w. Emissions reduction investment coefficient can be denoted as hm. The production cost per unit of the product is fixed and environmental improvement has an increasing marginal cost.
4) Each consumer chooses to buy the products that maximize their utility. We assume the fixed potential market demand is a. The price elasticity of demand is b.
The objectives of the retailer and manufacturer are to maximize their profits. In the following, we denote the equilibrium values by an asterisk “
Under centralized decision-making (SC mode), the manufacturer adopts a carbon emissions reduction strategy while the retailer adopts a promotion strategy. In this cooperation model, the demand D is affected by the retail price, emissions reduction level, and promotion level. The demand function is given by Equation (1).
The overall profit functions for the supply chain are provided as follows:
where
Optimal solutions
When the manufacturer and retailer make decentralized decisions, the optimal solutions for the manufacturer and retailer in each combination strategy are present in our previous research (Tong and Mu, 2019). To proceed with the analysis, we make the following assumptions:
Assumption.
Theorem 1. There exists a unique optimal solution to the SC mode. The optimal promotional effort level, the emissions reduction level, production quantity, and retail price and production are as follows:
Proof. The third-order Hessian matrix for Equation (2) is
The profit of manufacturer and retailer is
The results analysis
Comparison of emissions reduction levels
Proposition 1. The ratio of the emissions reduction level under the (P, R) strategy to that under the (N, R) strategy is greater than 1.From Tong and Du (2019), we know that,
Let,
Proposition 2. implies that, under the PR strategy, the emissions reduction level is twice as high as that of the NR strategy. It means that, although the retailer does not contribute to carbon emissions reduction and low-carbon product promotion, they can benefit from the manufacturer’s emission reduction as the manufacturer is a rational agent who is concerned about fairness. Compared with the PR strategy, the manufacturer has a lower willingness to reduce emissions under the NR strategy.
Comparison of profits
Proposition 3. The relationship between the profits of the retailer and the manufacturer under centralized decision-making and decentralized decision-making is:
Comparison of total carbon emissions
Proposition 3. The relationship between the carbon emissions per unit of a product under centralized decision-making and decentralized decision-making is
Proposition 4. The relationship between the production quantities under each strategy combination is:
Since
The impacts of carbon credit market price on emissions reduction level
Proposition 5. The impacts of carbon credit market price on emissions reduction levels under strategy NR are summarized in this proposition.
1) If
2) If
See Appendix A for proof. We can easily find that

FIGURE 2. The first partial derivative of the emissions reduction level with respect to
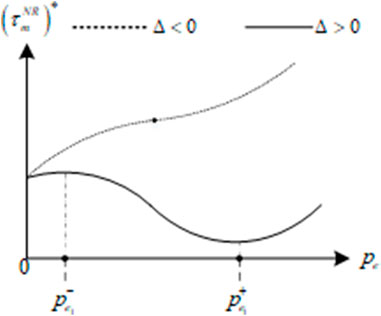
FIGURE 3. Emissions reduction level under strategy NR.
Proposition 6. The impacts of the carbon credit market price on emissions reduction levels under strategy PR are summarized in this proposition.
1) If
2) If
3) If
4) If
In Figure 4 and Figure 5, we illustrate the observations in Proposition 6.When

FIGURE 4. The first partial derivative of the emissions reduction level with respect to
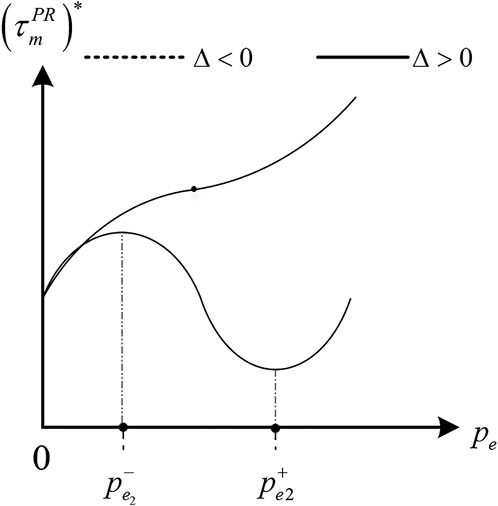
FIGURE 5. Emissions reduction level under strategy PR.

FIGURE 6. The first partial derivative of the emissions reduction level with respect to

FIGURE 7. Emissions reduction level under strategies PR and NR.
Modeling calibration and discussions
Data description
Based on the obtained theoretical results, this section uses MATLAB software to carry out numerical examples to focus on comparing the impact of CAT and consumers’ low-carbon preference on the optimal strategy, profit, total carbon emissions, and social welfare of enterprises under different strategies. We apply the Stackelberg model to the Chinese refrigerator industry. In 2021, the Chinese company JD sold 13 million refrigerators online. Then, the potential market demand was set as 10 million. Since China launched CAT in Shanghai, the carbon trading price in Shanghai’s Carbon Trading Center has been 59.5 RMB/Ton (Greco Consulting (Beijing) Co., Ltd.). Based on the baseline method, the manufacturer can be allocated free carbon credits that are set as 1 million tons. It takes 14 kWh to produce one refrigerator (Zhang et al., 2016). Thus, em = 14 kWh×0.785 kWh/kg (Calculation of carbon emissions 2014). One-third of a refrigerator’s manufacturing cost is the price of a compressor, which is 300 RMB yuan (Zhang et al., 2016). The production cost can be set as 900 RMB yuan. The values of these input parameters are shown in Table 2.
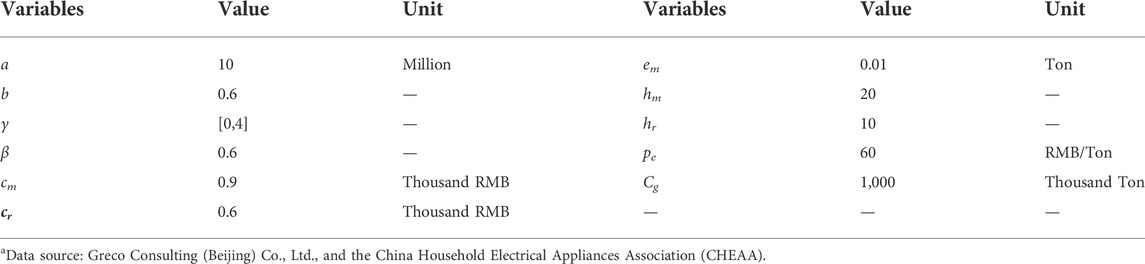
TABLE 2. Input parameters of the simulation.
The impact of customers’ low-carbon preference on the retail price per unit of a product
To investigate the influence of customers’ low-carbon preference on the optimal retail price, we set the interval of customers’ low-carbon preference as [1, 4] with an interval of 0.1.
Figure 8 presents that under decentralized decision-making, if the manufacturer does not invest in reducing carbon emissions, there will be no low-carbon products in the market. Then, the consumers’ low-carbon preference has no impact on the retail price per unit of a product of strategy combination NN and strategy combination PN. Since the implementation of the manufacturer’s carbon emissions reduction strategy and the retailer’s promotion strategy requires a certain investment, they will pass the investment cost to the consumer. Then, the retail price per unit of the product under the centralized decision-making mode and PR strategy is generally higher than other strategy combinations when the retailer does take measures to promote low-carbon products.
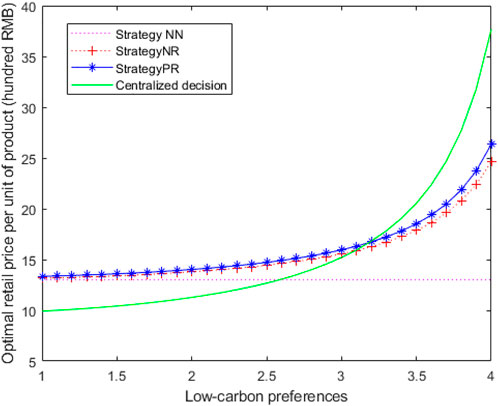
FIGURE 8. Optimal retail price responses to customers’ low-carbon preference.
It is interesting that when customers’ low-carbon preference varies in the range of [1, 4], the retail price per unit of the product under the NN strategy is higher than that of other strategy combinations. It is very likely that there are only ordinary products in the market, and the manufacturer and the retailer make more profits by raising the wholesale price and retail prices. After that, the retail price increases with the increase in consumers’ low-carbon preferences. At this time, the manufacturer invests more in reducing carbon emissions, and retail starts promoting low-carbon products to make profits through “small profits but quick turnover”. However, since the low-carbon technologies gradually meet the ceilings, the increase in investment costs for carbon emissions reduction and promotion, and retail costs will cause the profit margins of the manufacturer and retailer to gradually be compressed. Therefore, the retail price has to increase.
In the centralized decision-making mode, when customers’ low-carbon preference varies in the range of [1, 3.2], the retail price per unit of a product is always lower than that in the decentralized decision-making mode, but the profit is the highest. It indicates that, when the retailer and the manufacturer cooperate, the products will be cheap and environmentally friendly, so the demand will increase, and the total profit of the supply chain will be sustainable. We also find that, under a centralized decision-making mode, when the low-carbon preference coefficient is over 3.2, the optimal retail price per unit of the product will exceed any other strategy combinations. It means that, when consumers’ low-carbon preference coefficient is high enough, the retail price per unit of low-carbon products will be higher than that of ordinary products.
The impact of customers’ low-carbon preference on the total carbon emissions
To investigate the influence of customers’ low-carbon preference on the total carbon emissions, we set the interval of the customers’ low-carbon preference as [0, 1] with an interval of 0.1.
Figure 9 shows that under decentralized decision-making, when the manufacturer does not adopt carbon emissions reduction technologies, the total carbon emissions are higher than in the other two cases. When the consumers’ low-carbon preference varies between [0, 0.7], the total carbon emissions under the centralized decision-making mode are higher than those under the decentralized decision-making mode. This is because, under a centralized decision-making mode, although consumers are willing to pay more for low-carbon products, the manufacturer and the retailer need to share the benefits of the premium consumers’ pay. In other words, the shared benefits are not enough to balance the investment costs for carbon emissions reduction and promotion, so the effect of carbon emissions reduction is not much higher than that under decentralized decision-making. In the short term, under a certain emissions reduction level, the promotion will increase the production quantity and total carbon emissions. On the contrary, under a decentralized decision-making mode, the manufacturer can share most of the premium consumers’ pay. In addition, the effect of carbon emissions reduction will not be too bad. Although the sales volume is not as good as that of the centralized decision-making mode, the total carbon emissions will be slightly lower. Under the decentralized decision-making mode, as consumers’ low-carbon preferences continue to increase, manufacturer’s carbon emissions reduction actions are slow. When the customers’ low-carbon preferences coefficient is higher than 0.7, the total carbon emissions are higher than those in the centralized decision-making mode.
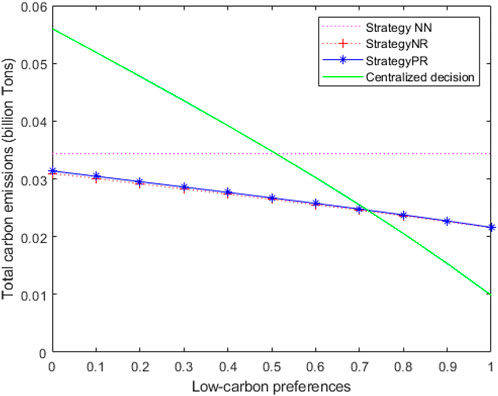
FIGURE 9. Total carbon emissions responses to customers’ low-carbon preference.
The impacts of the carbon credit market price and customers’ low-carbon preference on total carbon emissions
To investigate the combined impacts of the carbon credit market price and customers’ low-carbon preferences on total carbon emissions, we set the interval of customers’ low-carbon preferences as [0, 2] with an interval of 0.1, and carbon credit market price as [50, 70] with an interval of 1. Figure 10 shows that the customers’ low-carbon preferences have a greater impact on the total carbon emissions. Regardless of the carbon price, consumers who are willing to pay more for low-carbon products can always reward the manufacturer and retailer.
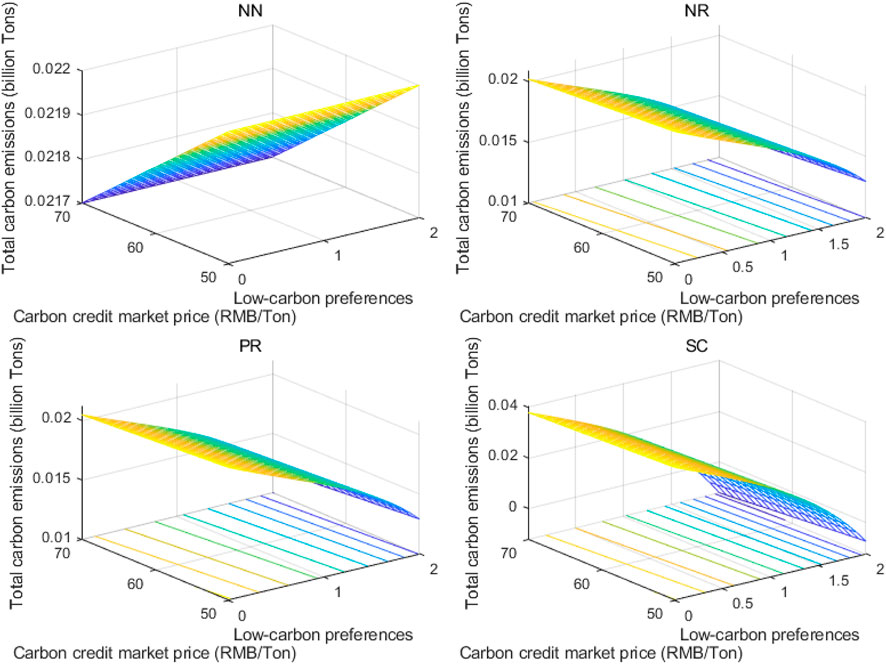
FIGURE 10. Total carbon emissions responses to customers’ low-carbon preference and carbon trading price.
Within a limited range, the total carbon emissions of the supply chain decrease as consumers’ low-carbon preference and carbon credit market price both increase, except in the NN mode. It means that as long as the manufacturer adopts a reduction strategy, total carbon emissions will finally be reduced. This is because, if the manufacturer does not reduce emissions, once the emissions exceed the cap, he will have to buy the carbon credits at a high price. If the manufacturer adopts a reduction strategy, he can earn additional revenue by selling the surplus carbon credits at a high market price. On the other hand, the manufacturer and retailer could gain the benefits from premium consumers who will pay for low-carbon products. The higher the carbon price and consumers’ low-carbon preference, the more incentive for the manufacturer to reduce emissions and the retailer to promote low-carbon products. Then, the total carbon emissions will become lower and lower.
The impact of customers’ low-carbon preference on social welfare
To investigate the influence of customers’ low-carbon preference on the total profit of the manufacturer and the retailer, we set the interval of the customers’ low-carbon preference as [0, 2] with an interval of 0.1. Figure 11 shows that within a limited range, the overall profit of the supply chain increases as consumers’ low-carbon preference increases, and the profit of the supply chain under centralized decision-making is always higher than that under decentralized decision-making.
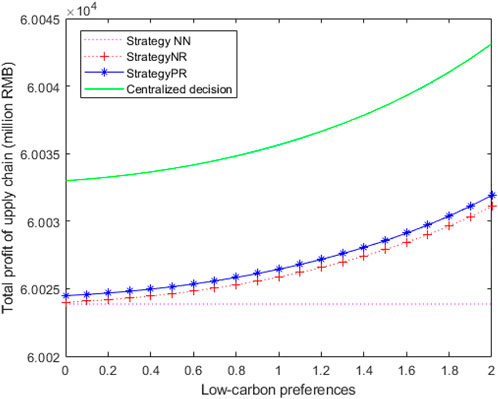
FIGURE 11. Profits of supply chain responses to customers’ low-carbon preference.
Under decentralized decision-making, if the manufacturer does not invest in reducing carbon emissions, there will be no low-carbon products in the market. Then, consumers’ low-carbon preference has no impact on the supply chain profits of the strategy combination NN and strategy combination PN. As consumers become more environmentally aware and become willing to pay more for low-carbon products, market demand is most affected by customers’ low-carbon preferences. If the retail price per unit of a product increases within a reasonable range, consumers will also be willing to buy. It is easy to find that when the retail price per unit of a product no longer dominates the consumers’ buying behavior, the market will be similar to the auction market. That is, as long as consumers like low-carbon products, the products will not be unsalable, which is very friendly to the manufacturer and retailer. The profit of the supply chain will increase unabated. However, in real life, on one hand, low-carbon products do not occupy the entire market. On the other hand, consumers tend to consume rationally. So, to buy products with the highest cost performance, consumers will have to trade-off between the retail price and emissions reduction level.
Without considering externalities, social welfare is the sum of producer surplus and consumer surplus (Tang and Du, 2019). The social welfare in this study can be expressed by Equation 17:
We can rewrite social welfare as
Then, the social welfare of each strategy is as follows:
The influence of customers’ low-carbon preference on social welfare is shown in Figure 12.
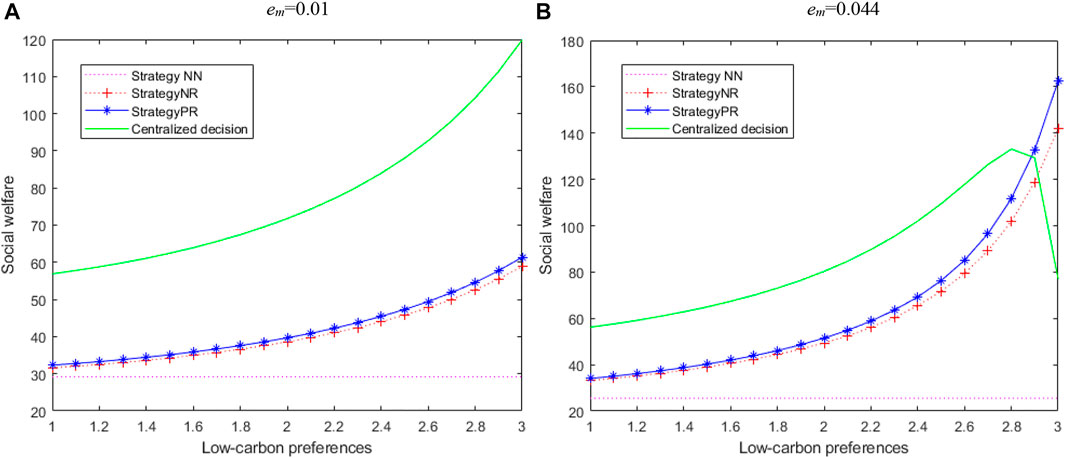
FIGURE 12. Social welfare responses to customers’ low-carbon preference.
Figure 12A shows that when the initial carbon emissions of a product are 0.01, that is the level of emissions reduction is high, the social welfare under centralized decision-making is always higher than that under decentralized decision-making. As long as the manufacturer and retailer adopt sustainable strategies, it is good for society and the environment, However, Figure 12B shows that when the level of emissions reduction is low (em = 0.044) and customers’ low-carbon preference continues to increase beyond 2.8, the social welfare under centralized decision-making declines rapidly. This is because, although consumers are willing to pay more for low-carbon products, consumer surplus decreases as purchase cost increases. The figure shows that as consumers’ low carbon preference increases, the profits of the supply chain will increase accordingly, but this increased profit comes at the expense of consumer surplus. Therefore, if the profits of the manufacturer and retailer increase based on the remaining consumer surplus unchanged or slightly increased, the social welfare will be Pareto-improved. That is, while reducing production costs or raising retail prices, the manufacturer and retailer can increase consumer utility by the same amount by investing in carbon emissions reduction or promoting low-carbon products.
These observations offer the following management insights for policy-makers and entities in low-carbon products who promote and produce.
1) When the consumers’ low-carbon preference coefficient is low, the manufacturer can single-handedly minimize the total carbon emissions of the supply chain by adopting low-carbon technology. At the same time, the retailer can take a free ride.
2) When the carbon price and consumers’ low-carbon preference are high enough, the optimal retail price will always be higher than that of ordinary products. Each stakeholder can make decisions to maximize self-profits. However, it inevitably brings about a double-marginal effect and affects the total profits of the supply chain in any collaboration mode under a decentralized scenario.
3) To obtain the highest total profits and lowest carbon emissions, the manufacturer and retailer can centrally make the strategic decisions of emissions reduction and promotion decisions. But the social welfare declines rapidly because it is affected by the initial carbon emissions per unit of a product and the carbon trading price of the CAT mechanism.
4) To keep social welfare from being reduced, retailers can appropriately lower the retail price, or stakeholders can save the cost of investing in reducing carbon emissions and promoting low-carbon products. Social welfare will increase when the level of emissions reduction in society is high enough, which requires all manufacturers to make efforts to adopt low-carbon technology. At the same time, retailers and customers need to be environmentally friendly.
In brief, under the CAT mechanism, manufacturers and retailers need to adjust their strategic decisions of emissions reduction and promotion at any time according to the initial carbon emissions of a product and different consumers to balance the trade-off between social and environmental benefits of the retailer-led supply chain.
Conclusion
Governments, enterprises, and customers pay more attention to protecting the environment, such as manufacturers investing in low-carbon technologies, retailers making efforts to promote low-carbon products, and consumers having low-carbon preferences. Specifically, among other strategies, CAT has reduced carbon emissions effectively. Considering CAT and consumer environmental preferences, we developed a Stackelberg game model that characterizes gaming and cooperative behaviors of the manufacturer and retailer. The equilibrium solutions under each strategy combination in a decentralized decision-making mode have been solved. The key findings are summarized in the following terms. 1) It is the most economical and environmentally friendly when the manufacturer makes efforts to reduce emissions and the retailer invests in promoting low-carbon products. 2) Sensitivity experiments showed that the CAT mechanism, emissions reduction level, the promotional effort level, and the customers’ environmental preferences could influence the optimal solutions of the manufacturer and retailer in the decentralized decision-making mode and cooperative mode. 3) The manufacturer is willing to invest in reducing emissions when the carbon trading prices are high. However, the emissions reduction level does not always increase with carbon trading prices unless the allocation of carbon credits is sufficient. 4) When the customers’ low-carbon preference coefficient is large enough, the total carbon emissions are highest when the manufacturer and retailer make decisions together, and the social welfare of the centralized decision-making mode is lower than that of a decentralized decision-making mode when the retailer takes a promotion strategy and the manufacturer takes an emissions reduction strategy. These findings can be useful for both the government and stakeholders in the supply chain.
There are several interesting extensions to this work. We assume that: 1) the levels of emissions reduction and promotion efforts are the same for all low-carbon products, 2) stakeholders are perfectly rational, and 3) markets and CAT have not changed over time. Then, more actual models can be developed to understand the stakeholders’ behavior and predict the market trend. Second, in a real market, the supply chain, consisting of multiple stakeholders, the coordination, and profit-sharing mechanism of the supply chain network based on a multi-agent game, needs further research. Finally, we only considered one carbon emissions policy. Other nuanced models could be constructed to identify how stakeholders make better long-term decisions under complex policies to reduce carbon emissions.
Data availability statement
The original contributions presented in the study are included in the article/Supplementary Material; further inquiries can be directed to the corresponding author.
Author contributions
Conceptualization, WT and HL; methodology, software, and formal analysis, WT; data curation, JD; writing—original draft preparation, WT; writing—review and editing, HL and JD; supervision, HL; funding acquisition, HL. All authors have read and approved the final manuscript.
Funding
This study is supported by the National Natural Science Foundation of China under grant number (No. 72001028), and the National Natural Science Foundation of China under grant number (No. 72172012).
Conflict of interest
The authors declare that the research was conducted in the absence of any commercial or financial relationships that could be construed as a potential conflict of interest.
The reviewer LX declared a shared affiliation with the author WT to the handling editor at the time of review.
Publisher’s note
All claims expressed in this article are solely those of the authors and do not necessarily represent those of their affiliated organizations, or those of the publisher, the editors, and the reviewers. Any product that may be evaluated in this article, or claim that may be made by its manufacturer, is not guaranteed or endorsed by the publisher.
References
Barbosa-Povoa, A. P., da Silva, C., and Carvalho, A. (2018). Opportunities and challenges in sustainable supply chain: An operations research perspective. Eur. J. Operational Res. 268 (2), 399–431. doi:10.1016/j.ejor.2017.10.036
Benjaafar, S., Li, Y., and Daskin, M. (2013). Carbon footprint and the management of supply chains: Insights from simple models. IEEE Trans. Autom. Sci. Eng. 10 (1), 99–116. doi:10.1109/tase.2012.2203304
Brunner, F., Kurz, V., Bryngelsson, D., and Hedenus, F. (2018). Carbon label at a university restaurant - label implementation and evaluation. Ecol. Econ. 146, 658–667. doi:10.1016/j.ecolecon.2017.12.012
Dardanoni, V., and Guerriero, C. (2021). Young people’ s willingness to pay for environmental protection. Ecol. Econ. 179, 106853. doi:10.1016/j.ecolecon.2020.106853
Du, S., Zhu, J., Jiao, H., and Ye, W. (2015). Game-theoretical analysis for supply chain with consumer preference to low carbon. Int. J. Prod. Res. 53 (12), 3753–3768. doi:10.1080/00207543.2014.988888
Fang, Z., Kong, X., Sensoy, A., Cui, X., and Cheng, F. (2021). Government’s awareness of environmental protection and corporate green innovation: A natural experiment from the new environmental protection law in China. Econ. Analysis Policy 70, 294–312. doi:10.1016/j.eap.2021.03.003
Goulder, L. H., and Schen, A. R. (2013). Carbon taxes versus cap and trade: A critical review. Clim. Chang. Econ. (Singap). 04 (03), 1350010–1350028. doi:10.1142/s2010007813500103
Gui, H., Xue, J., Li, Y., and Chen, L. (2022). Research on carbon emissions reduction strategy considering government subsidy and free riding behavior. Environ. Eng. Sci. 39 (4), 329–341. doi:10.1089/ees.2021.0192
Koberg, E., and Longoni, A. (2019). A systematic review of sustainable supply chain management in global supply chains. J. Clean. Prod. 207, 1084–1098. doi:10.1016/j.jclepro.2018.10.033
Laffont, J-J., and Tirole, J. (1993). A theory of incentives in procurement and regulation. MIT press.
Lou, Y., Feng, L., He, S., He, Z., and Zhau, X. (2020). Logistics service outsourcing choices in a retailer-led supply chain. Transp. Res. Part E Logist. Transp. Rev. 141, 101944. doi:10.1016/j.tre.2020.101944
Lu, H., Zhao, G., and Liu, S. (2022). Integrating circular economy and industry 4.0 for sustainable supply chain management: A dynamic capability view. Prod. Plan. Control, 1–17. doi:10.1080/09537287.2022.2063198
Ma, J., Hou, Y., Wang, Z., and Yang, W. (2021). Pricing strategy and coordination of automobile manufacturers based on government intervention and carbon emission reduction. Energy Policy 148, 111919. doi:10.1016/j.enpol.2020.111919
Min Wang, M., Ouyang, J., and Zhao, L. (2021). Production planning with transshipment in a global supply chain under different carbon trading mechanisms. Operational Res. 21 (4), 2309–2331. doi:10.1080/09537287.2022.2063198
Mondal, C., and Giri, B. C. (2021). Analyzing a manufacturer-retailer sustainable supply chain under cap-and-trade policy and revenue sharing contract. Oper. Res. Int. J., 1–36. doi:10.1007/s12351-021-00669-8
Porkar, S., Mahdavi, I., Maleki Vishkaei, B., and Hematian, M. (2020). Green supply chain flow analysis with multi-attribute demand in a multi-period product development environment. Oper. Res. Int. J. 20 (3), 1405–1435. doi:10.1007/s12351-018-0382-5
Saunders, L. W., Brooks, J. P., Merrick, J. R. W., and Autry, C. W. (2020). Addressing economic/environmental sustainability trade-offs in procurement episodes with industrial suppliers. Prod. Oper. Manag. 29 (5), 1256–1269. doi:10.1111/poms.13162
Savaskan, R. C., and Van Wassenhove, L. N. (2006). Reverse channel design: The case of competing retailers. Manag. Sci. 52 (1), 1–14. doi:10.1287/mnsc.1050.0454
Solomon, S., Plattner, G. K., Knutti, R., and Friedlingstein, P. (2009). Irreversible climate change due to carbon dioxide emissions. Proc. Natl. Acad. Sci. U. S. A. 106 (6), 1704–1709. doi:10.1073/pnas.0812721106
Styles, D., Schoenberger, H., and Galvez-Martos, J-L. (2012). Environmental improvement of product supply chains: A review of European retailers’ performance. Resour. Conservation Recycl. 65, 57–78. doi:10.1016/j.resconrec.2012.05.002
Sun, L., Cao, X., Alharthi, M., Zhang, J., Taghizadeh-Hesary, F., and Mohsin, M. (2020). Carbon emission transfer strategies in supply chain with lag time of emission reduction technologies and low-carbon preference of consumers. J. Clean. Prod. 264, 121664. doi:10.1016/j.jclepro.2020.121664
Sun, Z., Ma, Z., Ma, M., Cai, W., Xiang, X., Zhang, S., et al. (2022). Carbon peak and carbon neutrality in the building sector: A bibliometric review. Buildings 12 (2), 128. doi:10.3390/buildings12020128
Taleizadeh, A. A., Aliabadi, L., and Park, T. (2022). Operational research A sustainable inventory System with price-sensitive Demand and carbon Emissions under partial trade Credit and partial backordering. Springer Berlin Heidelberg.
Tong, W., Du, J., Zhao, F., Mu, D., and Sutherland, J. (2019). Optimal joint production and emissions reduction strategies considering consumers’ environmental preferences: A manufacturer’s perspective. Sustain. Switz. 11 (2), 474. doi:10.3390/su11020474
Tong, W., Mu, D., Zhao, F., Mendis, G. P., and Sutherland, J. W. (2019). The impact of cap-and-trade mechanism and consumers’ environmental preferences on a retailer-led supply chain. Resour. Conservation Recycl. 142, 88–100. doi:10.1016/j.resconrec.2018.11.005
Wang, M., Zhao, L., and Herty, M. (2019). Joint replenishment and carbon trading in fresh food supply chains. Eur. J. Operational Res. 277 (2), 561–573. doi:10.1016/j.ejor.2019.03.004
Xia, L., Hao, W., Qin, J., Ji, F., and Yue, X. (2018). Carbon emission reduction and promotion policies considering social preferences and consumers’ low-carbon awareness in the cap-and-trade system. J. Clean. Prod. 195, 1105–1124. doi:10.1016/j.jclepro.2018.05.255
Xiang, X., Ma, M., Ma, X., Chen, L., Cai, W., Feng, W., et al. (2022). Historical decarbonization of global commercial building operations in the 21st century. Appl. Energy 322, 119401. doi:10.1016/j.apenergy.2022.119401
Xu, L., and Wang, C. (2018). Sustainable manufacturing in a closed-loop supply chain considering emission reduction and remanufacturing. Resour. Conservation Recycl. 131, 297–304. doi:10.1016/j.resconrec.2017.10.012
Yang, W., Pan, Y., Ma, J., Yang, T., and Ke, X. (2020). Effects of allowance allocation rules on green technology investment and product pricing under the cap-and-trade mechanism. Energy Policy 139, 111333. doi:10.1016/j.enpol.2020.111333
Yuyan Wang, Y., Yu, Z., Jin, M., and Mao, J. (2021). Decisions and coordination of retailer-led low-carbon supply chain under altruistic preference. Eur. J. Operational Res. 293 (3), 910–925. doi:10.1016/j.ejor.2020.12.060
Zakeri, A., Dehghanian, F., Fahimnia, B., and Sarkis, J. (2015). Carbon pricing versus emissions trading: A supply chain planning perspective. Int. J. Prod. Econ. 164, 197–205. doi:10.1016/j.ijpe.2014.11.012
Zhang, B., Wan, C., Wang, L., and Cao, N. (2016). Research on Household refrigerators ’ evaluation index system for carbon. Electr. Appliances 9, 29–33. doi:10.3969/j.issn.1673-6079.2016.09.010
Zhang, S., Ma, M., Xiang, X., Cai, W., Feng, W., and Ma, Z. (2022). Potential to decarbonize the commercial building operation of the top two emitters by 2060. Resour. Conservation Recycl. 185, 106481. doi:10.1016/j.resconrec.2022.106481
Appendix A: For ease of reference, Equation (x) in the article is referred to as (E.x) in this appendix
Proof of Proposition 5
From our previous research (Tong and Mu, 2019), we can get the optimal carbon emissions reduction under strategy NR is
When
When
Q.E.D.
Proof of Proposition 6
From our previous research (Tong and Mu, 2019), we can get the optimal carbon emissions reduction under strategy PR, which is
Let
When
When
Keywords: carbon trading, emissions reduction, consumers’ low-carbon preferences, stackeberg game, promotional efforts
Citation: Tong W, Liu H and Du J (2022) Does the carbon trading mechanism affect social and environmental benefits of the retailer-led supply chain: Strategic decisions of emissions reduction and promotion. Front. Environ. Sci. 10:971214. doi: 10.3389/fenvs.2022.971214
Received: 16 June 2022; Accepted: 27 July 2022;
Published: 12 September 2022.
Edited by:
Ruidong Chang, University of Adelaide, AustraliaReviewed by:
Lang Xu, Shanghai Maritime University, ChinaBin Liu, University of Shanghai for Science and Technology, China
Copyright © 2022 Tong, Liu and Du. This is an open-access article distributed under the terms of the Creative Commons Attribution License (CC BY). The use, distribution or reproduction in other forums is permitted, provided the original author(s) and the copyright owner(s) are credited and that the original publication in this journal is cited, in accordance with accepted academic practice. No use, distribution or reproduction is permitted which does not comply with these terms.
*Correspondence: Hengyu Liu, aGVuZ3l1X2xpdUBidXB0LmVkdS5jbg==