 Salvatore Romano
 Susy Pichierri
 Gianluca Quarta
- Centro di Fisica Applicata, Datazione e Diagnostica CEDAD, Dipartimento di Matematica e Fisica “E. De Giorgi”, Università del Salento, Lecce, Italy
Both teflon and quartz PM2.5 filters collected from January to July 2021 at the monitoring site of the Department of Mathematics and Physics of the University of Salento in Lecce (Italy) were analyzed by integrating different characterization techniques (Particle Induced X-ray Emission PIXE, Isotope Ratio Mass Spectrometry IRMS, and Accelerator Mass Spectrometry AMS) at the CEDAD (Center of Applied Physics, Dating and Diagnostics) of the Department of Mathematics and Physics, University of Salento. The PM2.5 concentration analyses allowed to identify the variation of the main PM2.5 characteristics as a function of the season and the day of the week. This last characterization was integrated by the results from the PIXE, which allowed to identify the heavy elements and their concentrations. The main results showed the presence of different elements, such as S and Zn (considered as markers of anthropogenic sources for PM2.5) and Ca and Fe (as markers of natural sources). The concentrations of these elements showed a significant decrease during the weekend, mostly in the case of elements of anthropogenic origin, according to the data on the PM2.5 temporal evolution. Using the isotopic markers of carbon and nitrogen by means of the IRMS, we determined values of δ15N between 4.5 and 10.6‰, which are consistent with the origin of PM2.5 from anthropic combustion processes and a secondary contribution from vehicular traffic. Similarly, the values of δ13C obtained by IRMS were in the range between −24.4 and −26.7‰, generally associated with biomass combustion and with vehicular traffic. An analysis of the fossil and modern contribution was carried out on the PM2.5 filters by measuring radiocarbon using the integrated IRMS-EA system connected with the TANDETRON accelerator and AMS spectrometer. In more detail, we found a percentage of modern carbon in the range 71.6–92.4% that indicates a larger bio-derived contribution with respect to the contribution from fossil sources during the analyzed period. The parameters obtained from PIXE, IRMS, and AMS techniques were finally used as input for different ordination methods that allowed their deeper characterization.
Introduction
Total carbon (TC), composed by organic and elemental carbon (OC and EC, respectively), represents in Southern European urban sites about 30% and 21% of the PM2.5 and PM10 mass percentage, respectively, according to Putaud et al. (2010). OC and EC present adverse impact on human health (Lelieveld et al., 2015), climate (Bond et al., 2013), and air quality (Zheng et al., 2013) and include a relevant fraction of the anthropogenic pollution. EC, also denoted as black carbon (BC), is generally associated with primary emissions due to the incomplete combustion of fossil fuel and biomass. In contrast, OC presents both a primary organic carbon (POC) and a secondary organic carbon (SOC) contribution (Lim and Turpin, 2002; Hallquist et al., 2009). Radiocarbon (14C) analyses provide a further characterization of carbonaceous particles allowing estimating the fossil and non-fossil contribution to both OC and EC particles (Zhang et al., 2021). In fact, emissions from fossil sources are 14C-free because their age greatly exceeds the half-life of 14C (5730 years) and, therefore, 14C has completely decayed. In contrast, 14C is found with concentrations like those of CO2 in the current atmosphere for the contemporary carbonaceous sources (Minguillón et al., 2011; Zhang et al., 2012). The radiocarbon content of a carbonaceous sample is expressed as the “fraction of contemporary carbon” (fc).
Gelencsér et al. (2007) measured the radiocarbon content of PM2.5 samples collected at five rural/remote sites in Europe. They found at all sites that EC was mainly due to fossil-related sources throughout the year. OC was mainly due to biomass burning primary emissions in winter, with some additional contributions from fossil fuel combustion. Minguillón et al. (2011) analyzed the 14C content of PM1 EC and OC particles collected both at an urban background site in Barcelona and at a forested regional background site in Montseny in the western Mediterranean. They also provided a summary of the fossil carbon percentages available in literature for different PM fractions and sites. Vlachou et al. (2018) analyzed the radiocarbon content of PM10 particles collected at the Alpine valley of Magadino (Switzerland) during the years 2013 and 2014. They found that the non-fossil contributions to POC represented 57% and 75% during autumn and winter, respectively. In contrast, the non-fossil contributions to SOC became more pronounced in spring and summer (32 and 40%, respectively). In fact, the strong solar radiation, which favors photo-oxidation processes of biogenic volatile organic compounds, and the elevated biogenic volatile organic compound emissions in the warm season likely favored the formation of SOC particles. Song et al. (2019) have recently monitored the 14C content of PM2.5 carbonaceous particles collected at Guangzhou in South China. They found that contemporary carbon contribution to TC varied within the 38.3–63.5% range. Other recent studies reported several attempts to couple 14C measurements with advanced tools to give new insights into the dynamics of atmospheric carbonaceous aerosols (Andersson et al., 2015; Winiger et al., 2017; Bonvalot et al., 2019). The worldwide monitoring of fossil and contemporary carbon has indeed shown that the radiocarbon content can vary with monitoring site features, seasons, and PM fraction.
This study aims to provide preliminary radiocarbon analyses of PM2.5 samples, collected at a site representative of Central Mediterranean coastal sites, by combining different characterization techniques and statistical ordination methods. In fact, a few studies on radiocarbon measurements for PM samples collected at Central Mediterranean sites are currently available to the best of our knowledge. The Mediterranean region has been identified as one of the most sensitive regions in the world to climate change (Giorgi, 2006) and radiocarbon measurements could contribute to gain a better understanding of the carbonaceous particle impact on the Mediterranean climate. Carbonaceous particles absorb the incoming solar radiation, perturb the temperature structure of the atmosphere, influence the cloud cover, and therefore affect the climate. In this work, we analyzed by different characterization techniques PM2.5 filters collected from January to July 2021 at the monitoring station of the Department of Mathematics and Physics of the University of Salento by using both teflon and quartz substrates. The study site is particularly relevant for the analysis of its aerosol properties because it is in a suburban area in Lecce, in south-eastern Italy and at the center of the Mediterranean area, and therefore is generally affected by different aerosol types (Romano et al., 2019; Romano et al., 2020a). Different characterization techniques (Particle Induced X-ray Emission PIXE, Isotope Ratio Mass Spectrometry IRMS, and Accelerator Mass Spectrometry AMS), widely described by Calcagnile et al. (2019) and by Quarta et al. (2020) and performed at the CEDAD (Center of Applied Physics, Dating and Diagnostics) of the Department of Mathematics and Physics of the University of Salento, were carried out on the PM2.5 filters to differentiate their properties. The PIXE technique allowed us to identify the heavy elements and their mass concentrations in the collected PM2.5 filters during the investigated period. The parameters obtained from PIXE, IRMS, and AMS techniques were used as input for different ordination methods: the Principal Component Analysis (PCA) using a standardized dataset, the dendrograms based on the Ward’s method, and the Redundancy Discriminant Analysis (RDA). In more detail, both PCA and dendrograms were mainly used to define potential clusters of the collected PM2.5 samples, trying to identify possible associations related to the different seasons and/or to the different origin of the samples, besides discriminating between weekdays and weekend samples. On the contrary, RDA analysis allowed us to study the possible relationships between the different chemical species concentrations (determined by PIXE) as explanatory (or predictive) variables and the radiocarbon parameters (determined by IRMS and AMS) as response (or dependent) variables.
Material and methods
Monitoring site and PM2.5 samplings
PM2.5 samples were collected both in weekdays and in weekend days at about 10 m above the ground level at the monitoring station of the Mathematics and Physics Department of the University of Salento. The monitoring site is located in Lecce, in a suburban area of south-eastern Italy (40.33°N; 18.11°E), away from large pollution sources and considered as representative of coastal sites of the Central Mediterranean (Romano et al., 2019). Therefore, the study area is affected by a large variety of aerosol types because of its geographic location at the center of the Mediterranean basin. More specifically, it is affected by mineral dust from the Sahara Desert and surrounding arid regions, polluted particles from urban and industrial areas of Northern and Eastern Europe, sea salt and spray from the Mediterranean Sea itself or from the Atlantic Ocean, and biomass-burning particles produced mostly in summer by forest fires (Perrone et al., 2014; Perrone et al., 2015). A HYDRA Dual Sampler (FAI Instruments) with a sampling flow rate of 2.3 m3 h−1 was used to simultaneously collect PM2.5 samples on 47-mm diameter quartz (PALLFLEX, Tissuquartz) and PTFE (TEFLO W/RING 2 μ, VWR International) filters. Quartz filters were pre-heated for 1 h at 700°C to remove adsorbed organic contaminants. Both filter types were conditioned for 48 h in an air-controlled chamber (25°C and 50% humidity) before and after sampling and the PM mass was determined by gravimetric measurements. The uncertainties on the mass concentration were lower than 5%. Blank filters located close to the sampler during the 24-h sampling period were treated exactly as the sample filters.
PIXE and IRMS techniques
The PIXE (Particle Induced X-ray Emission) technique represents one of the most widespread IBA (Ion Beam Analysis) techniques and is commonly used in various research fields. For the analysis measurements, it is necessary to have experimental equipment based on the use of particle accelerators with acceleration voltages of the order of MV. The PM samples were analyzed on the IBA line of the beam at the CEDAD with a ∼1 nA proton beam, produced by the Cs sputtering of TiH cathodes in an HVEE 860° ion source. The beam was accelerated to 3.7 MeV by a 3 MV Tandetron accelerator (Mod. HVEE 4130 HC) and, then, extracted into the air through an 8 μM thick Kapton window. The characteristic X-rays were detected by a Si (Li) detector (Canberra Mod. 80160) with an active area of 80 mm2 and a resolution of 150 eV at 5.9 keV (Mn Kα line). A 100 μM thick pinhole Al absorber with a 1 mm hole was placed in front of the Si (Li) detector to reduce the intense signal from light elements and improve the sensitivity for heavy elements. The measurement time was ∼10 min per sampling point. The iono-luminescence signal emitted by the filters was used for the focusing and positioning of the proton beam (Butalag et al., 2008). The detector, optimized for medium-high Z elements and placed as close as possible to the target, presents size and geometry such as to cover the greatest solid angle, to compensate for the lower cross sections of X production on these elements.
The IRMS (Isotope Ratio Mass Spectrometry) technique represents a mass spectrometry technique capable of determining the isotope ratios of different elements. Generally, the isotopes of light elements such as hydrogen, carbon, nitrogen, oxygen, and sulfur are the main subject of this analysis. In nature, the isotopes of an element tend to distribute themselves in a different way between coexisting phases of the same system, and this phenomenon is called isotopic fractionation (Tiwari et al., 2015). Since the isotope ratio of the elements is influenced by both chemical-physical and biological processes, both on a local scale (living organism, ecosystem) and on a global scale (biogeochemical cycles), IRMS represents a technique with applications in different fields such as geology, biology, forensic science, and environmental science (Kaklamanos et al., 2020). The IRMS does not provide absolute measurements, but the results are expressed in relation to an internationally accepted reference standard, such as Vienna Pee Dee Belemnite (VPDB) for carbon, Vienna Canyon Diablo Troilite meteorite (V- CDT) for sulfur, Vienna Standard Mean Ocean Water (VSMOW) for oxygen and hydrogen, and laboratory air for nitrogen (Muccio and Jackson, 2009). The isotope ratios are expressed as the ratio of the abundance of the heaviest isotope to that of the lightest isotope. Therefore, the isotope ratios of carbon and nitrogen are respectively:
Furthermore, the isotope enrichment is expressed through the delta (δ) notation defined as follows:
where Rsam represents the isotope ratio of the sample and Rstd represents that of the reference standard (Cook and Herczeg, 2000). The system used in this work is a Thermo Scientific IRMS - Delta V Plus mass spectrometer connected to a Flash 2000 Elemental Analyzer (EA). The two systems are interfaced with each other through a peripheral called ConFlo (Continuous Flow). An EA-IRMS system allows to perform isotope ratio measurements of solid and non-volatile liquid samples. The sample is carefully weighed (∼ 200 μg) with a precision balance (Mettler Toledo XP26 Microgram Lab Balance Scale) inside a tin capsule and, then, loaded into the EA autosampler. In the IRMS mass spectrometer, the sample is ionized inside the ion source and accelerated by an electrostatic lens system, generating a beam of charged particles directed towards the selector magnet that separates the particles based on their charged mass ratio (m/z) and deflects them towards the detection system. The signal of the various isotopes is then processed by the ISODAT software that calculates the values of the isotope ratios and the relative δ values.
AMS technique and 14C analysis of total carbon
The experimental set-up developed at the CEDAD (Centre for Applied Physics, Dating and Diagnostics, University of Salento) and reported in Figure 1 was used for the determination of the 14C content by AMS (Accelerator Mass Spectrometry) on PM samples with masses in the μm range (Calcagnile et al., 2019). The experimental set-up, described in detail by Quarta et al. (2020), is based on an automatic combustion system coupled, through a gas-handling interface, to a hybrid ion source designed to accept samples both in solid and in gaseous form. Overall efficiencies of the order of 4% were shown such as the capability to measure both 13C/12C and 14C/12C ratios by AMS with uncertainty levels of 0.5–1% (Calcagnile et al., 2018). Tests performed on field blanks showed that the contribution of carbon fractions was too low and the effect on the calculated value was negligible. The 14C abundance is expressed in relation to the 12C abundance and the values of this ratio (R14Csample) are expressed in relation to the equivalent ratio for a standard (R14CModern). Then, the ratio (R14Csample/R14CModern) represents the modern carbon fraction fM, also denoted as percent of modern carbon pCM, where pCM = 100 · fM. The percent of modern carbon can be also converted to the contemporary carbon (fc) by dividing it by a factor ranging from 1.08 to 1.30, according to Heal (2014). One should carefully select this factor because otherwise fM could be a substantial overestimate of the true fraction fc from the biomass-derived carbon. In this study, the percent of modern carbon of each sample was converted to contemporary carbon fc (%) by using as reference for the current 14C atmospheric level the value of 102 pMC, according to Quarta et al. (2018).
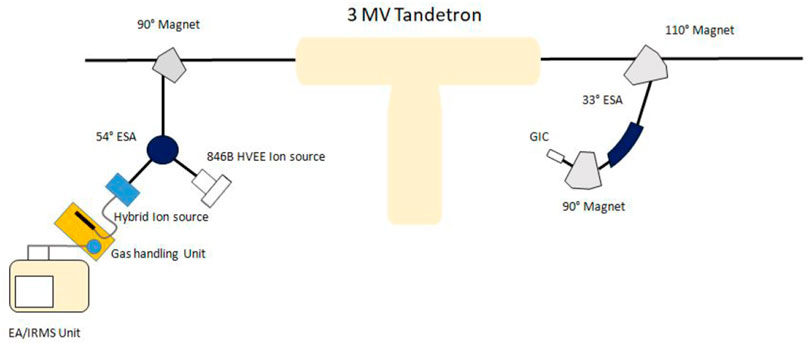
FIGURE 1. The experimental set-up developed at CEDAD (Center of Applied Physics, Dating and Diagnostics) of the Department of Mathematics and Physics, University of Salento, and used in this study: it is formed by an Elemental Analyzer (EA), a gas handling unit, a hybrid sputtering ion source, and a Tandem accelerator (Mod. 4130HC HVEE).
Statistical techniques for data analysis
The parameters obtained by the PIXE, IRMS, and AMS techniques were firstly analyzed by using the non-parametric Spearman’s rank-order correlation coefficients. In more detail, we tested whether the examined variables were not-normally distributed using the one-sample Kolmogorov–Smirnov test (using the MATLAB kstest function). Once we verified that the studied parameters were not-normally distributed, we estimated the non-parametric Spearman’s rank-order correlation coefficients and we reported them in a graphical format. The exploratory data analysis to study the relations among the investigated variables was subsequently performed by using a Principal Component Analysis (PCA) based on the spectral decomposition that examines the covariances/correlations between variables. In more detail, the PCA analysis was applied to our initial dataset after a standardization process. We also plotted the dendrograms to better visualize the main relations among the studied samples using the Ward’s method. If one uses this methodology based on the Euclidean distances, the related identified clusters are joined such that the increase in within-group variance is minimized. Observe that we used the PAST (Paleontological Statistics) software package (Version 4.03, Hammer et al., 2001) to calculate Spearman’s correlation coefficients, perform the PCA analysis, and plot the dendrograms using the PIXE-, IRMS-, and AMS-derived variables.
In this work, we also performed the redundancy discriminant analysis (RDA; Zuur et al., 2007) by following the procedure described in Romano et al. (2020b) and by using the MATLAB software. The RDA technique is a multivariate extension of a simple linear regression applied to some sets of variables with a combination of two datasets: “species data” as response (or dependent) variables and “environmental variables” as explanatory (or predictive) variables (Paliy and Shankar, 2016; Hervé et al., 2018). In more detail, we applied the RDA technique to examine the relationships between the main parameters obtained by IRMS and AMS techniques as response variables and the chemical element mass concentrations obtained by PIXE as predictive variables. The Fathom Toolbox by using both f_rda and f_rdaPlot functions (Jones, 2017) was utilized to apply the RDA analysis to the selected datasets. In the RDA triplots, the length and the direction of each arrow are closely associated with the variance explained by the examined variables (Paliy and Shankar, 2016). A larger absolute value of the cosine of the angle between two arrows is associated with stronger correlations between the two corresponding parameters. Positive and negative correlations between two analyzed variables are instead displayed by the related arrows in the same and in the opposite direction, respectively (Sun et al., 2018). The accuracy of each performed RDA analysis was then assessed utilizing the f_AIC and f_rdaAIC functions integrated in the MATLAB Fathom Toolbox.
Results and discussion
Analysis of PM2.5 concentration evolution
By comparing the average values and the relative standard deviations shown in Table 1, one can observe that the PM2.5 concentration values obtained using teflon and quartz filters are not statistically different. The PM2.5 concentration values obtained by quartz filters are slightly higher than those obtained by Teflon filters probably due to the greater influence of relative humidity on the quartz filters. On the contrary, the variations in PM2.5 concentrations between the winter and spring-summer periods are statistically significant both in the case of teflon filters and in the case of quartz filters. This significant result is closely linked to the relevant variations of the main sources of atmospheric PM at the study site during the different investigated seasons (Romano et al., 2019; Romano et al., 2020a). In fact, Table 1 shows a significant reduction in PM2.5 concentrations during the “hottest” spring and summer months, probably associated with a greater reduction in anthropogenic activities and in the effect of domestic heating that instead has a larger contribution during the winter months.
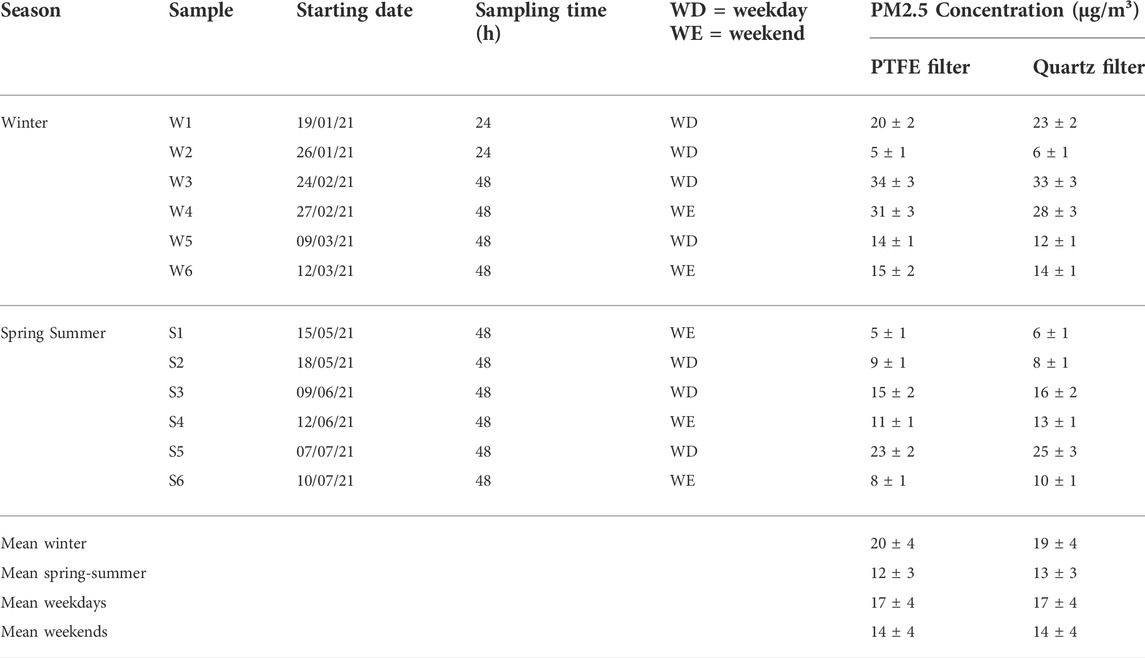
TABLE 1. PM2.5 concentrations (± corresponding uncertainties) determined using PTFE and quartz filters for each analyzed sample. The season, starting date, sampling time, and weekday/weekend indication have been also reported for each analyzed sample. The corresponding mean values (± standard error of the mean) for winter, spring-summer, weekday, and weekend samples have been also reported.
The previously reported experimental results were then analyzed by means of the back-trajectories (http://ready.arl.noaa.gov/HYSPLIT.php), i.e., the trajectories of the air masses at different heights, detected for the monitoring station of Lecce in the 4 days preceding the sampling days. We selected the days with the maximum (24 and 27 February) and the minimum (26 January and 15 May) concentrations, as reported in Table 1. Through the HYSPLIT analytical model developed by NOAA, one can trace the relative back-trajectories. In particular, in the investigated cases, the studied site was set as the arrival site (by entering the respective geographic coordinates as input of the model) and indicating the 96 h prior to the days in which the relative PM2.5 samplings were carried out. In the model, 3 trajectories at 3 different arrival heights (equal to 0, 500, and 1000 m above the ground level) were considered to trace the possible directions of the air masses at the different heights, thus inferring the respective potential sources of PM emissions. As reported in Supplementary Figure S1, in the two days with the highest concentrations of PM2.5 (equal to 34 and 31 μg/m³ on 24 and 27 February 2021, respectively, considering the results from teflon filters), the back-trajectories of the air masses can provide a possible explanation related to the respective evolutions. In fact, in the 4 days preceding 24 February 2021, the air masses seem to come mainly from Northern Italy and Eastern Europe, which are generally responsible for the transport of relevant quantities of fine particulate matter of anthropogenic origin (Romano et al., 2019). In the case of the trajectory that reaches Lecce at an altitude of 500 m (Supplementary Figure S1), one can also observe a possible transport activity from Northern Africa, which is generally responsible for the transport of significant quantities of desert dust, which leads to a high increase in PM concentrations. As observed from Supplementary Figure S2, on the other hand, in the two days with the lowest PM2.5 concentrations (equal to 5 μg/m³ on both 26 January and 15 May 2021 considering the teflon filters), the relative air masses seem to be mainly of marine origin. Accordingly, in the 4 days prior to 26 January, the air masses come mainly from the Northern Atlantic, while in the case of 15 May the air masses are mainly of Mediterranean origin. In fact, the air masses of marine origin are generally those mainly responsible for lower concentrations of PM at the study site (Romano et al., 2019).
Using PM2.5 concentrations obtained by both PTFE and quartz filters, their different contribution in weekdays (from Monday to Friday) and in weekends (Saturday and Sunday) was also determined and compared considering their average values and standard deviations, as shown in Table 1. In most cases the concentration is lower in holidays than in weekdays, most likely associated with the significant decrease in anthropogenic activities during the weekend and in addition to the marked reduction in vehicular traffic that represents an important source of air pollutants in the study area. In fact, if we consider the entire period analyzed between January and July 2021, we can note a relevant reduction in the concentration of PM2.5 from weekdays to weekends (reduction of 21%), for both PTFE and quartz filters, as reported in Table 1. In addition, there is an important difference if we compare the change in concentration of PM2.5 between holidays and weekdays in winter or in spring-summer. In fact, in winter we observed a slight average increase in PM2.5 concentrations in the weekend (equal to 3% for PTFE filters and considerably greater and equal to 15% for quartz filters), in contrast to what occurs in spring and summer with a significant decrease of PM2.5 concentrations in the weekends. A possible explanation of this remarkable difference for the concentrations of PM2.5 between weekends and weekdays as a function of the season can be found in the different typical seasonal sources of atmospheric PM at the study site. Since one of the main sources for PM2.5 concentrations in winter at the study site is the domestic heating, this possible source could explain the reduction in the differences of PM2.5 concentrations between weekdays and holidays during the “cold” period of the year. In fact, the domestic heating can be considered as a “continuous” source of PM2.5, as it presents its own contribution on both weekdays and weekends. On the contrary, the effect of anthropogenic activities on PM2.5 concentrations (and in particular that of vehicular traffic) is highly dependent on the day of the week, with a significant reduction in its contribution on Saturdays and Sundays. Therefore, given that the most important contribution on average in summer and spring is due to vehicular traffic, in this period the PM2.5 concentrations are significantly lower in the weekends. It is also important to note that the use of a PTFE filter or a quartz filter did not represent an important factor affecting our results, which were quite similar regardless of the type of the used filter.
Analysis of the main results from PIXE, IRMS and AMS techniques
After the PIXE analyses, the spectra of the obtained relative elements were extrapolated through an appropriate software procedure. For example, Figure 2 shows the PIXE spectrum obtained for the winter sample W2 collected by a quartz filter on 26 January 2021. Subsequently, the background subtraction was carried out from the surface concentrations (expressed in ng/cm2) and, then, the total mass of the various chemical elements (expressed in ng) was calculated by multiplying the relative surface concentration by the filter area (11.9 cm2). Considering the volume of air aspirated by the sampler, which is automatically provided by the device used for PM sampling, the volume concentration was obtained by dividing the obtained mass of each chemical element to the volume of air provided by the sampler. The volume concentration values of the four elements (expressed in the standard unit of μg/m3) obtained from the PIXE analyses are shown in Table 2. As one can observe, the volume concentrations obtained from the PIXE analysis of PTFE and quartz filters selected for this work correspond to those of sulfur (S) and zinc (Zn), which were selected as markers of anthropogenic sources of atmospheric PM, and those of calcium (Ca) and iron (Fe), which were mostly associated with a contribution from PM particles of natural origin (Chow, 1995; US-EPA, 2004; Marmur et al., 2007). As one can observe from Table 2, the values of mean concentration of the chemical elements obtained by PIXE analysis tend to decrease significantly over the weekend. This variation is mainly marked in the case of S and Zn, since they represent the two elements mostly associated with the anthropic contribution in the PM2.5 concentration among those analyzed in this study. In particular, the reduction in sulfur concentration between working days and holidays is high both considering the Teflon filters (−22%) and the quartz filters (−32%). Conversely, note from Table 2 a considerably smaller variation in the concentration of Ca and Fe in the weekend, since they generally present a significant contribution associated with natural sources of atmospheric PM and, consequently, they are less affected by the reduction of anthropogenic sources of PM2.5 concentrations that occurs mainly over the weekend. Table 2 also shows the possible seasonal variations in the concentrations of the chemical elements obtained by means of the PIXE technique. Except for Ca, which presents a different result between quartz and Teflon filters, in the case of the three remaining chemical elements, S tends to increase its PM2.5 concentration in spring-summer, while on the contrary Fe and Zn present higher concentrations in winter. These results occurred both in the case of Teflon filters and in the case of quartz ones. Finally, we also tested the correlation between the concentration of chemical elements obtained by PIXE for quartz and Teflon filters. The obtained linear correlation coefficients proved an excellent agreement between the concentrations estimated by the filters in Teflon and those in quartz, mostly in the case of S (with R2 = 0.78) and Fe (with R2 = 0.73).
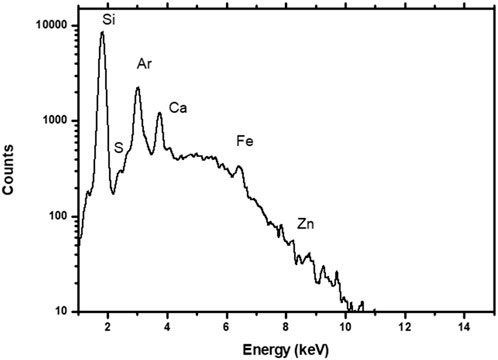
FIGURE 2. PIXE (Particle Induced X-Ray Emission) spectrum of the PM2.5 atmospheric aerosol sample that was collected by a quartz filter on 26 January 2021 and denoted as W2.
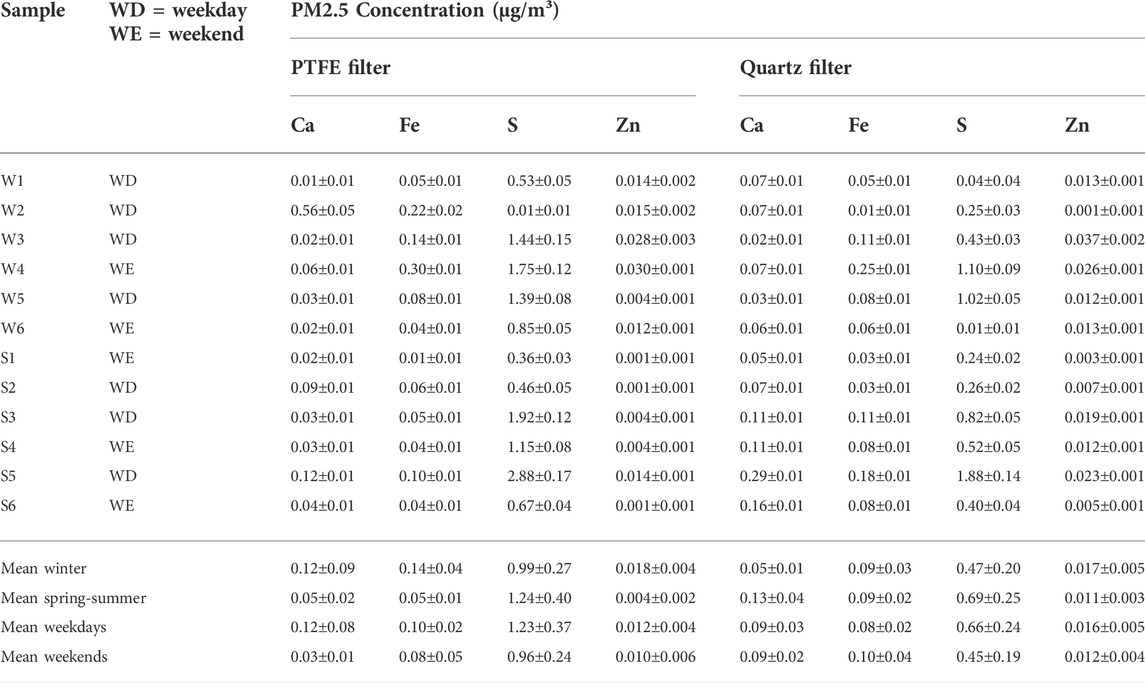
TABLE 2. Calcium (Ca), iron (Fe), sulphur (S), and zinc (Zn) concentrations (± corresponding uncertainties) determined by PIXE using PTFE and quartz filters for each analyzed PM2.5 sample. The weekday/weekend indication has been also reported for each analyzed sample. The corresponding mean values (± standard error of the mean) for winter, spring-summer, weekday, and weekend samples have been also reported.
Table 3 reports the values (± corresponding uncertainties) of stable isotope measurements of nitrogen and carbon (δ15N and δ13C, respectively), particulate nitrogen and carbon content (PN and PC, respectively), amount of 14C (expressed in a unit of percent of modern carbon pMC), and the contemporary carbon fraction fc (%) for each analyzed PM2.5 sample, in addition to the related averages for winter, spring-summer, weekdays, and weekends. Note that we were not able to measure the δ15N values for samples W1, W2, and S1 because the nitrogen was below the detection limit. Observe from Table 3 that the values of δ15N are in the range between 4.54 and 10.60‰ and are consistent with those reported by Park et al. (2018), who identified within this range the origin of atmospheric PM as due to anthropogenic combustion processes and a secondary contribution from vehicular traffic. The content of N (PN) varied from 1.5 to 8.2 μg for the 12 samples analyzed in this study. The δ15N values generally increase with increasing air pollution. On the other hand, the content of C (PC) in the sampled filters was highly variable and included in the range from 4.9 to 53.4 μg, while δ13C presented a limited variability, in the range from −24.41 to −26.70‰, generally consistent with the combustion of biomass (−26.7 ± 1.8‰) and with vehicular traffic (from −25.5 ± 1.3‰ for liquid fossil fuels to −23.4 ± 1.3‰ for solid fossil fuels), according to the values reported by Lim et al. (2022).
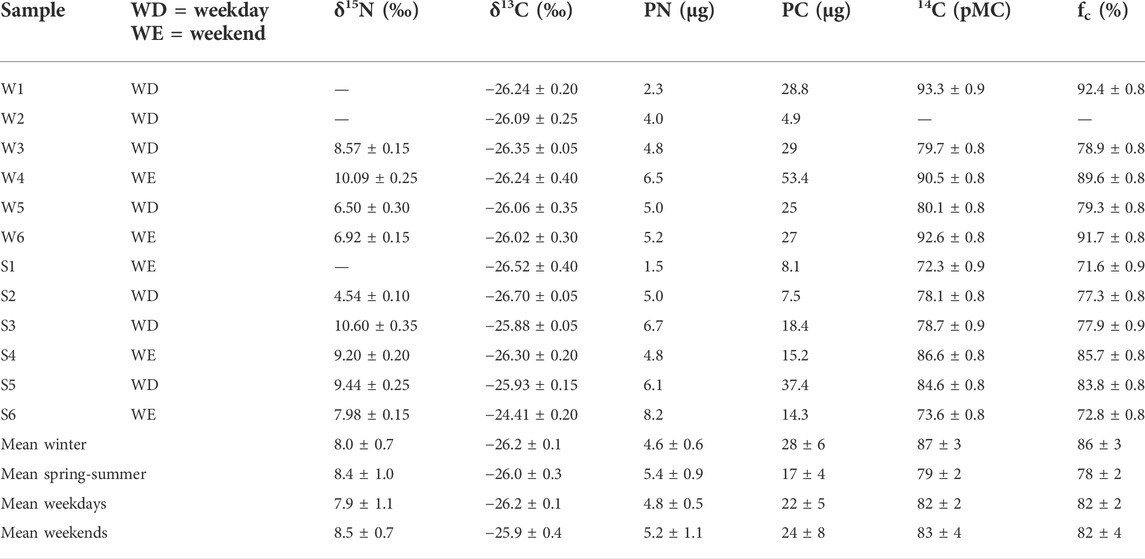
TABLE 3. Values (± corresponding uncertainties) of stable isotope measurements of nitrogen and carbon (δ15N and δ13C, respectively), particulate nitrogen and carbon content (PN and PC, respectively), amount of 14C expressed in a unit of percent modern carbon (pMC), and the contemporary carbon fraction fc (%) for each analyzed PM2.5 sample. The weekday/weekend indication has been also reported. The corresponding mean values (± standard error of the mean) for winter, spring-summer, weekday, and weekend samples have been also reported.
To further confirm these last results on the possible PM sources based on the measurement of stable isotopes, a direct analysis of the fossil and modern contribution was carried out on all the investigated filters by measuring the radiocarbon by the integrated IRMS-EA system connected to the Tandetron accelerator of the CEDAD and to the AMS spectrometer. The results are reported in Table 3 (denoted as 14C and fc). For the investigated PM2.5 samples, the 14C amount varied in the range from 72.3 to 93.3 pMC. Analogously, the percentage of contemporary carbon fc varied in the range from 71.6% (S1) to 92.4% (W1), showing larger values in winter than in spring-summer and similar values between weekdays and weekends. These last evolutions could be explained by considering the larger biomass combustion due to the domestic heating in winter than in spring-summer, while the effect of the domestic heating did not vary between weekdays and weekends. Note also from Table 3 that a very high contribution of modern carbon fc, likely associated with a larger biomass burning contribution, was observed only in 2 samples (W1 and W6). The values of fc reported in this study resulted slightly higher than those found by Major et al. (2022) who analyzed PM2.5 samples in different urban background, suburban background, and rural sites in Budapest (Hungary). In more detail, they found seasonal mean fc values between 50 and 78% suggesting that modern sources were significant during the observation year, regardless of the heating or vegetation periods. Szidat et al. (2004) collected both daytime and nighttime PM10 samples in August 2002 at an urban location in Zürich (Switzerland). They found fc values in the range 51–80%, which were slightly lower than those of our study and indicated a major biogenic influence. They explained this last result indicating that carbonaceous aerosol at their site was more dominated by the rural vicinity rather than the direct urban sources. In contrast to these higher fc values that indicate the dominance of modern carbon sources in Europe, the analyses in Asian monitoring sites provided relatively low fc values due to the significant use of fossil sources such as coal. In fact, Sun et al. (2012) found fc values in the range 30–44% for PM2.5 samples collected at the Yufa rural site near Beijing in China, while Uchida et al. (2010) found fc values in the range 31–42% for PM10 samples collected in a residential area of Tokyo (Japan).
Main results from correlation analysis and ordination methods
The main parameters obtained from the PIXE, IRMS, and AMS techniques were used as input for some correlation analyses and ordination methods trying to identify the main relationships among them. In more detail, the input variables represented the Ca, Fe, S, and Zn concentrations determined by PIXE using both PTFE (P) and quartz (Q) filters, in addition to the stable isotope measurements of nitrogen and carbon (δ15N and δ13C, respectively), the particulate nitrogen and carbon content (PN and PC, respectively), the amount of 14C expressed in a unit of percent modern carbon (pMC), and the modern carbon fraction fc (%). The first analysis was performed using the Spearman correlation coefficients reporting them in a color plot (Figure 3, with positive correlation coefficients in blue and with negative coefficients in red). The Spearman correlation coefficients significant at a p-level < 0.05 were reported by boxed circles. We can observe from Figure 3 that all the investigated chemical elements presented a high correlation among their concentrations obtained by quartz and teflon filter, especially in the case of S and Zn. Note also a significant correlation between the two chemical elements associated with anthropogenic sources (S and Zn) and between those related to natural sources (Ca and Fe), both for teflon and for quartz filters. About the correlations associated with radiocarbon parameters, one can observe from Figure 3 a high correlation of the amount of 14C and the percentage of modern carbon fc with the particulate carbon content PC. The stable isotope measurement of nitrogen δ15N presented a high correlation with all the analyzed chemical element concentrations, except for the Ca concentration obtained by the teflon filters. Conversely, the stable isotope measurement of carbon δ13C did not present significant correlations with the investigated element concentrations. The Ca concentrations obtained both by teflon and by quartz filters were the only element concentration not significantly correlated to the particulate carbon content PC. Note from Figure 3 that the two parameters associated with the radiocarbon measurements (14C and fc) were significantly correlated to the Zn concentrations, both for teflon and for quartz filters, since Zn is generally mostly related to the anthropogenic sources of the PM2.5 fraction.
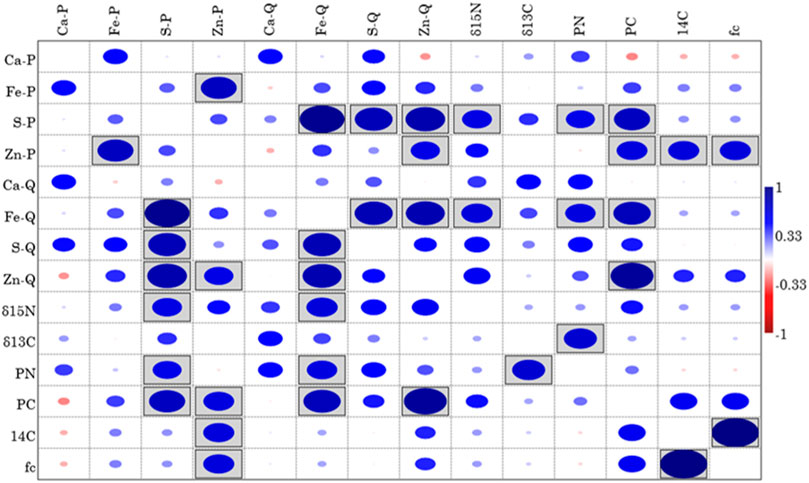
FIGURE 3. Color plot based on the Spearman correlation coefficients (positive coefficients are in blue, while negative coefficients are in red). The boxed circles represent the Spearman coefficients significant at a p-level < 0.05. The input variables are the Ca, Fe, S, and Zn concentrations determined by PIXE using both PTFE (P) and quartz (Q) filters, in addition to the stable isotope measurements of nitrogen and carbon (δ15N and δ13C, respectively), particulate nitrogen and carbon content (PN and PC, respectively), amount of 14C expressed in a unit of percent modern carbon (pMC), and the contemporary carbon fraction fc (%).
Then, three different ordination methods (PCA, dendrogram, and RDA) were applied to the parameters obtained by PIXE, IRMS, and AMS to define a possible clustering of the investigated samples and to deepen the study of their relations. Regarding the PCA analysis, we separately considered the clustering of the analyzed samples by using only the parameters from PIXE (Figure 4) and only the parameters from IRMS and AMS (Figure 5) as input variables. Note that both Figures 4, 5 reported both the relations between samples (score plot) and the relations between the chemical concentration and the radiocarbon parameters (green lines, loading plots), respectively. The high percentages of the total variance explained by the first and second principal component (49.7 and 24.7% for Figure 4 and 43.8 and 31.3% for Figure 5) highlight an excellent performance of the two reported PCA analyses. If we consider the chemical element concentrations as input parameters for PCA (Figure 4), we can observe a clear division between our winter (W) and spring-summer (S) samples. In more detail, the S samples appear to be more grouped in a specific region of the PCA biplot area, except for S5 sample collected in a working day characterized by a larger concentration than the other S samples. Conversely, Figure 4 shows that the W samples were characterized by a larger variability, as also proved by their different locations in the PCA biplot area. In fact, in spring-summer the air mass aging and the more stable atmospheric conditions generally found in the Central Mediterranean area favour the collection of PM samples with similar concentrations at the study site, while the high variability of the atmospheric conditions and the meteorology in winter are responsible for the collection of PM samples with variable concentrations (Romano et al., 2019). The loading plot (green lines) in Figure 4 also highlights the similar concentrations for S obtained by teflon and quartz filters for all the investigated samples, while a different concentration of Ca is obtained for teflon and quartz filters (note the opposite direction of the corresponding line in the loading plot of Figure 4). Conversely to what was obtained by considering the chemical element concentrations as input for PCA analysis, if we consider the IRMS- and AMS-derived parameters as input variables, the corresponding PCA score plot did not indicate the presence of specific clusters for the investigated samples as a function of the season. This last result highlights that these parameters do not present a marked seasonality, as on the contrary in the case of the chemical element concentrations. Considering the results reported both in Figures 4, 5, we did not observe a distinct clustering of the investigated samples as a function of the type of day (weekday or weekend) independently if we used the chemical concentrations or the IRMS- and AMS-derived parameters as input variables for the PCA analysis. This last result is also confirmed by the dendrogram based on the Ward’s method and reported in Figure 6, in which we used all the chemical concentrations obtained by PIXE and the IRMS- and AMS-derived parameters as input variables. In fact, as one can observe from Figure 6, the reported dendrogram provides a clear separation between the winter (W) and the spring-summer (S) samples, except for W2 (characterized by the lowest concentration among the analyzed winter samples) and S5 (with the highest concentration among the spring-summer samples).
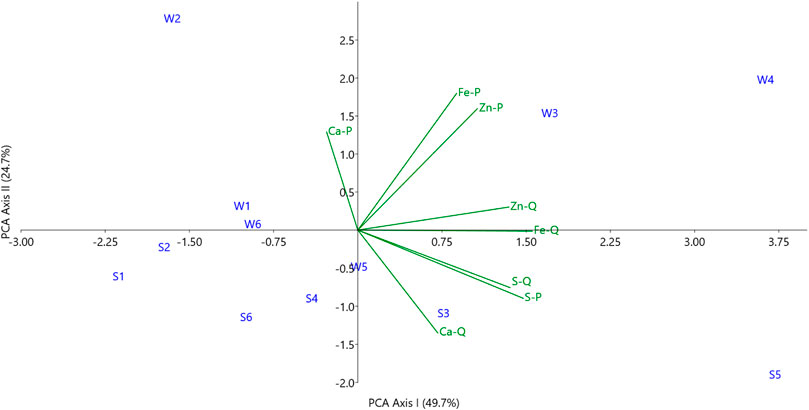
FIGURE 4. Two-dimensional Principal Component Analysis (PCA) for the 6 winter (W) and 6 spring-summer (S) samples. The input variables are the Ca, Fe, S, and Zn concentrations determined by PIXE using both PTFE (P) and quartz (Q) filters. The percentages of the total variance explained by the first and second principal component are also indicated in the plot.
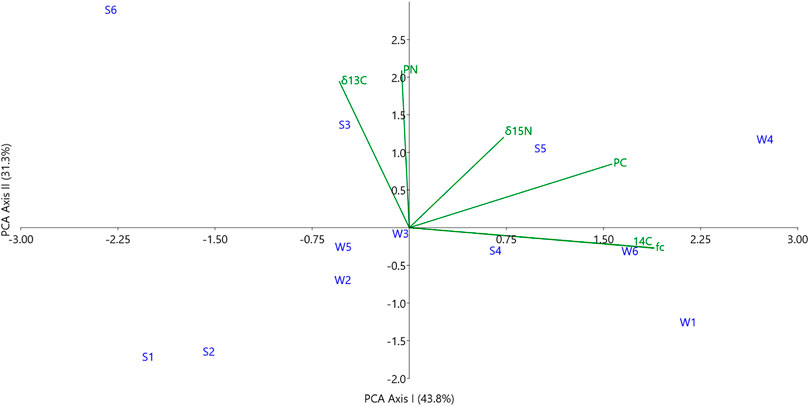
FIGURE 5. Two-dimensional Principal Component Analysis (PCA) for the 6 winter (W) and 6 spring-summer (S) samples. The input variables are the stable isotope measurements of nitrogen and carbon (δ15N and δ13C, respectively), particulate nitrogen and carbon content (PN and PC, respectively), amount of 14C expressed in a unit of percent modern carbon (pMC), and the contemporary carbon fraction fc (%). The percentages of the total variance explained by the first and second principal component are also indicated in the plot.
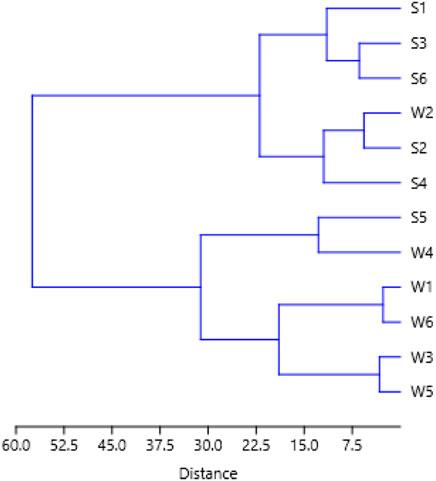
FIGURE 6. Dendrogram based on the Ward’s method for the 6 winter (W) and 6 spring-summer (S) samples. The input variables are the Ca, Fe, S, and Zn concentrations determined by PIXE using both PTFE (P) and quartz (Q) filters, in addition to the stable isotope measurements of nitrogen and carbon (δ15N and δ13C, respectively), particulate nitrogen and carbon content (PN and PC, respectively), amount of 14C expressed in a unit of percent modern carbon (pMC), and the contemporary carbon fraction fc (%).
Finally, the last ordination method applied to the whole dataset investigated in this study was the Redundancy Discriminant Analysis (RDA). With respect to the previous ordination techniques, this methodology allows defining the relationships between two groups of variables. In our case, we studied by the RDA the effect of the concentrations of the chemical elements identified by PIXE considered as predictive variables on the main parameters determined by IRMS and AMS techniques that instead represented the response variables. The results of this technique applied to our dataset are reported in Figure 7, where the analyzed samples are in blue, while the chemical element concentrations and the radiocarbon parameters are in red and in green arrows, respectively. The high values obtained for the total variance explained by the first two RDA axes (39.35 and 22.11%) proved a good performance of the used ordination method. Considering the location of the samples in the RDA triplot area, we did not find a specific clustering, neither in association with the season of the samples nor in association with the day of the week (weekday or weekend). The direction of the arrows associated with 14C and fc parameters is mainly due to the location of the W1 and W6 samples in the RDA triplot, since these two samples were characterized by a larger percentage of modern carbon, likely due to an increase of the contribution from biomass burning sources during those winter days. Considering the direction and length of the arrows associated with Zn (from both teflon and quartz filter), we can confirm their possible relation with the radiocarbon parameters 14C and fc, as also highlighted by the results from Spearman correlation analyses (Figure 3). Note also from Figure 7 that the particulate carbon content PC is strictly related to both Fe and Zn concentrations (derived from both quartz and teflon filters), likely due to the possible association of their potential sources. The high S concentration in the sample S5 (Table 2) is likely responsible for the location of both S-P and S-Q arrows near the sample S5 in the RDA triplot. Finally, considering the direction of the arrow associated with the Ca concentration from quartz filter, we identified by RDA a possible relation with the IRMS parameters denoted as PN and δ15N.
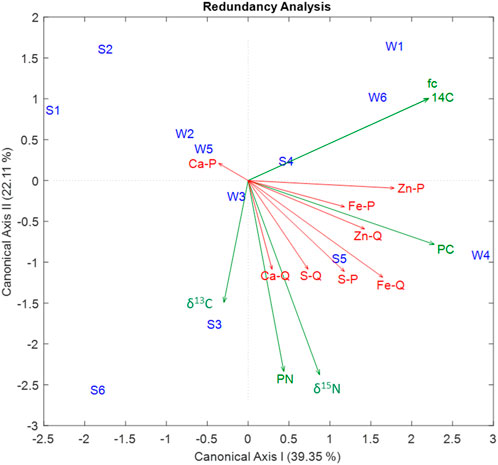
FIGURE 7. Redundancy Discriminant Analysis (RDA) triplot for the 6 winter (W) and 6 spring-summer (S) samples reported in blue. The input variables are the Ca, Fe, S, and Zn concentrations determined by PIXE using both PTFE (P) and quartz (Q) filters as predictive variables (red arrows) and the stable isotope measurements of nitrogen and carbon (δ15N and δ13C, respectively), particulate nitrogen and carbon content (PN and PC, respectively), amount of 14C expressed in a unit of percent modern carbon (pMC), and the contemporary carbon fraction fc (%) as response variables (green arrows). The total variance explained by the two RDA axes is also reported in parentheses.
Conclusion
The PIXE, IRMS, and AMS techniques performed at the CEDAD, University of Salento, were used to characterize the results obtained on both teflon and quartz PM2.5 filters collected during a 7-month monitoring campaign in Lecce (Italy).
The results from PIXE showed the presence of elements considered markers of PM2.5 anthropogenic sources (S and Zn) or natural sources (Ca and Fe). The concentrations of elements of anthropogenic origin showed a significant decrease during the weekend. By means of the IRMS, we determined δ15N values consistent with the origin of PM2.5 from anthropic combustion processes and a secondary contribution from vehicular traffic, and δ13C values generally associated with biomass combustion and vehicular traffic. Using the integrated IRMS-EA system, we also found a percentage of modern carbon in a range associated with a larger biomass-derived contribution with respect to those from fossil sources.
The parameters obtained from PIXE, IRMS, and AMS were used as input for correlation analyses and for different ordination methods. By Spearman correlation analysis, we identified a significant correlation between the elements associated with anthropogenic sources and between those related to natural sources. The parameters associated with the radiocarbon measurements (14C and fc) were significantly correlated to the Zn concentrations, which is generally related to the anthropogenic PM2.5 sources. Using the chemical concentrations from PIXE as input variables for PCA, we found winter samples with a larger variability than summer samples, due to the higher variability of the winter atmospheric conditions and meteorology. Conversely, by analyzing the PCA results using the IRMS and AMS parameters as input variables, the corresponding score plot did not indicate an effect of the seasonality on these last parameters. Regarding the RDA analysis, considering the concentrations of the chemical elements identified by PIXE as predictive variables and the main parameters determined by IRMS and AMS as response variables, we identified a possible relationship of the Zn concentration with 14C and fc and the Ca concentration from quartz filter with PN and δ15N. Therefore, the integration of more statistical and analytical methods can provide a more accurate characterization of the PM2.5 properties with respect to the results provided individually by each of these techniques.
Data availability statement
The original contributions presented in the study are included in the article/Supplementary Material, further inquiries can be directed to the corresponding author.
Author contributions
SR, SP, MF, and AB performed the measurements and analyzed the related data. SR, GQ, and LC developed the research framework design. SR wrote the first draft of the manuscript. SR and MF prepared data and completed all figures. GQ and LC coordinated and supervised the work. All co-authors contributed to the interpretation of the results and to the text and approved it for publication.
Funding
The work was partially supported by the Italian MIUR (Ministry of Education, University and Research) in the frame of the Project PER-ACTRIS-IT Enhancement of the Italian Component of the Aerosol, Clouds, and Trace Gases Research InfraStructure (PIR01_00015) and by the INFN (Istituto Nazionale Fisica Nucleare) of Italy in the framework of the projects IS-ABS (Integrated System for Aerosol and Bioaerosol Studies at the Pierre Auger Observatory) and AT-SVB (Airborne Transmission of SARS-CoV-2, Viruses, and Bacteria in workplaces). MF carried out this work with the support of a Ph.D. fellowship from Regione Puglia (FSE-2020).
Acknowledgments
The NOAA Air Resources Laboratory is kindly acknowledged for the provision of the HYSPLIT back-trajectories.
Conflict of interest
The authors declare that the research was conducted in the absence of any commercial or financial relationships that could be construed as a potential conflict of interest.
Publisher’s note
All claims expressed in this article are solely those of the authors and do not necessarily represent those of their affiliated organizations, or those of the publisher, the editors and the reviewers. Any product that may be evaluated in this article, or claim that may be made by its manufacturer, is not guaranteed or endorsed by the publisher.
Supplementary material
The Supplementary Material for this article can be found online at: https://www.frontiersin.org/articles/10.3389/fenvs.2022.971204/full#supplementary-material
References
Andersson, A., Deng, J., Du, K., Zheng, M., Yan, C., Sköld, M., et al. (2015). Regionally-varying combustion sources of the January 2013 severe haze events over eastern China. Environ. Sci. Technol. 49, 2038–2043. doi:10.1021/es503855e
Bond, T. C., Doherty, S. J., Fahey, D. W., Forster, P. M., Berntsen, T., DeAngelo, B. J., et al. (2013). Bounding the role of black carbon in the climate system: a scientific assessment. J. Geophys. Res. Atmos. 118, 5380–5552. doi:10.1002/jgrd.50171
Bonvalot, L., Tuna, T., Fagault, Y., Sylvestre, A., Mesbah, B., Wortham, H., et al. (2019). Source apportionment of carbonaceous aerosols in the vicinity of a mediterranean industrial harbor: a coupled approach based on radiocarbon and molecular tracers. Atmos. Environ. 212, 250–261. doi:10.1016/j.atmosenv.2019.04.008
Butalag, K., Calcagnile, L., Quarta, G., Maruccio, L., and D’Elia, M. (2008). PIXE analysis of obsidian tools from radiocarbon dated archaeological contexts. Nucl. Instrum. Methods Phys. Res. B 266, 2353–2357. doi:10.1016/j.nimb.2008.03.079
Calcagnile, L., Maruccio, L., Braione, E., and Quarta, G. (2018). The new gas ion source at CEDAD: improved performances and first 14C environmental applications. Radiocarbon 60, 1083–1089. doi:10.1017/rdc.2018.11
Calcagnile, L., Maruccio, L., Scrimieri, L., delle Side, D., Braione, E., D’Elia, M., et al. (2019). Development and application of facilities at the centre for applied physics, dating and diagnostics (CEDAD) at the university of Salento during the last 15 years. Nucl. Instrum. Methods Phys. Res. B 456, 252–256. doi:10.1016/j.nimb.2019.03.031
Chow, J. C. (1995). Measurement methods to determine compliance with ambient air quality standards for suspended particles. J. Air Waste Manag. Assoc. 45, 320–382. doi:10.1080/10473289.1995.10467369
Cook, P. G., and Herczeg, A. L. (Editors) (2000). Environmental tracers in subsurface hydrology (Boston, MA: Springer US).
Gelencsér, A., May, B., Simpson, D., Sánchez-Ochoa, A., Kasper-Giebl, A., Puxbaum, H., et al. (2007). Source apportionment of PM2.5 organic aerosol over Europe: primary/secondary, natural/anthropogenic, and fossil/biogenic origin. J. Geophys. Res. 112, D23S04. doi:10.1029/2006jd008094
Giorgi, F. (2006). Climate change hot-spots. Geophys. Res. Lett. 33, L08707. doi:10.1029/2006gl025734
Hallquist, M., Wenger, J. C., Baltensperger, U., Rudich, Y., Simpson, D., Claeys, M., et al. (2009). The formation, properties and impact of secondary organic aerosol: current and emerging issues. Atmos. Chem. Phys. 9, 5155–5236. doi:10.5194/acp-9-5155-2009
Hammer, O., Harper, D. A. T., and Ryan, P. D. (2001). PAST: Paleontological statistics software package for education and data analysis. Palaeontol. Electron. 4, 9.
Heal, M. R. (2014). The application of carbon-14 analyses to the source apportionment of atmospheric carbonaceous particulate matter: a review. Anal. Bioanal. Chem. 406, 81–98. doi:10.1007/s00216-013-7404-1
Hervé, M. R., Nicolè, F., and Lê Cao, K.-A. (2018). Multivariate analysis of multiple datasets: a practical guide for chemical ecology. J. Chem. Ecol. 44, 215–234. doi:10.1007/s10886-018-0932-6
Jones, D. L. (2017). Fathom Toolbox for MATLAB: Software for multivariate ecological and oceanographic data analysis. St. Petersburg, FL, USA: College of Marine Science, University of South Florida. Available online: https://www.marine.usf.edu/research/matlab-resources/.
Kaklamanos, G., Aprea, E., and Theodoridis, G. (2020). “Mass spectrometry: principles and instrumentation,” in Chemical analysis of food (London: Academic Press), 525–552.
Lelieveld, J., Evans, J. S., Fnais, M., Giannadaki, D., and Pozzer, A. (2015). The contribution of outdoor air pollution sources to premature mortality on a global scale. Nature 525, 367–371. doi:10.1038/nature15371
Lim, H.-J., and Turpin, B. J. (2002). Origins of primary and secondary organic aerosol in atlanta: results of time-resolved measurements during the atlanta supersite experiment. Environ. Sci. Technol. 36, 4489–4496. doi:10.1021/es0206487
Lim, S., Hwang, J., Lee, M., Czimczik, C. I., Xu, X., and Savarino, J. (2022). Robust evidence of 14C, 13C, and 15N analyses indicating fossil fuel sources for total carbon and ammonium in fine aerosols in seoul megacity. Environ. Sci. Technol. 56, 6894–6904. doi:10.1021/acs.est.1c03903
Major, I., Molnár, M., Futó, I., Gergely, V., Bán, S., Machon, A., et al. (2022). Detailed carbon isotope study of PM2.5 aerosols at urban background, suburban background and regional background sites in Hungary. Atmosphere 13, 716. doi:10.3390/atmos13050716
Marmur, A., Mulholland, J. A., and Russell, A. G. (2007). Optimized variable source-profile approach for source apportionment. Atmos. Environ. 41, 493–505. doi:10.1016/j.atmosenv.2006.08.028
Minguillón, M. C., Perron, N., Querol, X., Szidat, S., Fahrni, S. M., Alastuey, A., et al. (2011). Fossil versus contemporary sources of fine elemental and organic carbonaceous particulate matter during the DAURE campaign in Northeast Spain. Atmos. Chem. Phys. 11, 12067–12084. doi:10.5194/acp-11-12067-2011
Muccio, Z., and Jackson, G. P. (2009). Isotope ratio mass spectrometry. Analyst 134, 213–222. doi:10.1039/b808232d
Paliy, O., and Shankar, V. (2016). Application of multivariate statistical techniques in microbial ecology. Mol. Ecol. 25, 1032–1057. doi:10.1111/mec.13536
Park, Y.-M., Park, K.-S., Kim, H., Yu, S.-M., Noh, S., Kim, M.-S., et al. (2018). Characterizing isotopic compositions of TC-C, NO3−-N, and NH4+-N in PM2.5 in South Korea: impact of China’s winter heating. Environ. Pollut. 233, 735–744. doi:10.1016/j.envpol.2017.10.072
Perrone, M. R., Romano, S., and Orza, J. A. G. (2014). Particle optical properties at a central mediterranean site: Impact of advection routes and local meteorology. Atmos. Res. 145–146, 152–167. doi:10.1016/j.atmosres.2014.03.029
Perrone, M. R., Romano, S., and Orza, J. A. G. (2015). Columnar and ground-level aerosol optical properties: sensitivity to the transboundary pollution, daily and weekly patterns, and relationships. Environ. Sci. Pollut. Res. 22, 16570–16589. doi:10.1007/s11356-015-4850-7
Putaud, J.-P., Van Dingenen, R., Alastuey, A., Bauer, H., Birmili, W., Cyrys, J., et al. (2010). A European aerosol phenomenology – 3: Physical and chemical characteristics of particulate matter from 60 rural, urban, and kerbside sites across Europe. Atmos. Environ. 44, 1308–1320. doi:10.1016/j.atmosenv.2009.12.011
Quarta, G., Calcagnile, L., Cipriano, D., D’Elia, M., Maruccio, L., Ciceri, G., et al. (2018). AMS-14C determination of the biogenic-fossil fractions in flue gases. Radiocarbon 60, 1327–1333. doi:10.1017/rdc.2018.88
Quarta, G., Maruccio, L., Velardi, L., Paticchio, F., D’Elia, M., Perrone, M., et al. (2020). Use of a hybrid sputtering ion source for the determination of the bio-derived carbon fraction in particulate matter. J. Instrum. 15, C05025. doi:10.1088/1748-0221/15/05/c05025
Romano, S., Perrone, M. R., Pavese, G., Esposito, F., and Calvello, M. (2019). Optical properties of PM2.5 particles: results from a monitoring campaign in southeastern Italy. Atmos. Environ. 203, 35–47. doi:10.1016/j.atmosenv.2019.01.037
Romano, S., Becagli, S., Lucarelli, F., Russo, M., and Pietrogrande, M. C. (2020a). Oxidative potential sensitivity to metals, Br, P, S, and Se in PM10 samples: new insights from a monitoring campaign in southeastern Italy. Atmosphere 11, 367. doi:10.3390/atmos11040367
Romano, S., Vecchi, R., and Perrone, M. R. (2020b). Intensive optical parameters of pollution sources identified by the positive matrix factorization technique. Atmos. Res. 244, 105029. doi:10.1016/j.atmosres.2020.105029
Song, J., Zhu, M., Wei, S., Peng, P., and Ren, M. (2019). Abundance and 14C-based source assessment of carbonaceous materials in PM2.5 aerosols in Guangzhou, South China. Atmos. Pollut. Res. 10, 313–320. doi:10.1016/j.apr.2018.09.003
Sun, X., Hu, M., Guo, S., Liu, K., and Zhou, L. (2012). 14C-Based source assessment of carbonaceous aerosols at a rural site. Atmos. Environ. 50, 36–40. doi:10.1016/j.atmosenv.2012.01.008
Sun, Y., Xu, S., Zheng, D., Li, J., Tian, H., and Wang, Y. (2018). Effects of haze pollution on microbial community changes and correlation with chemical components in atmospheric particulate matter. Sci. Total Environ. 637–638, 507–516. doi:10.1016/j.scitotenv.2018.04.203
Szidat, S., Jenk, T. M., Gäggeler, H. W., Synal, H.-A., Fisseha, R., Baltensperger, U., et al. (2004). Radiocarbon (14C)-deduced biogenic and anthropogenic contributions to organic carbon (OC) of urban aerosols from Zürich, Switzerland. Atmos. Environ. 38, 4035–4044. doi:10.1016/j.atmosenv.2004.03.066
Tiwari, M., Singh, A. K., and Sinha, D. K. (2015). “Stable isotopes: tools for understanding past climatic conditions and their applications in chemostratigraphy,” in Chemostratigraphy (Amsterdam: Elsevier), 65–92. doi:10.1016/B978-0-12-419968-2.00003-0
Uchida, M., Kumata, H., Koike, Y., Tsuzuki, M., Uchida, T., Fujiwara, K., et al. (2010). Radiocarbon-based source apportionment of black carbon (BC) in PM10 aerosols from residential area of suburban Tokyo. Nucl. Instrum. Methods Phys. Res. Sect. B Beam Interact. Mat. Atoms. 268, 1120–1124. doi:10.1016/j.nimb.2009.10.114
US-EPA (2004). Protocol for applying and validating the CMB model for PM2.5 and VOC (EPA-451/R-04-001). Durham: Office of Air Quality Planning and Standards, Research Triangle Park, NC 27711.
Vlachou, A., Daellenbach, K. R., Bozzetti, C., Chazeau, B., Salazar, G. A., Szidat, S., et al. (2018). Advanced source apportionment of carbonaceous aerosols by coupling offline AMS and radiocarbon size-segregated measurements over a nearly 2-year period. Atmos. Chem. Phys. 18, 6187–6206. doi:10.5194/acp-18-6187-2018
Winiger, P., Andersson, A., Eckhardt, S., Stohl, A., Semiletov, I. P., Dudarev, O. V., et al. (2017). Siberian Arctic black carbon sources constrained by model and observation. Proc. Natl. Acad. Sci. U. S. A. 114, E1054–E1061. doi:10.1073/pnas.1613401114
Zhang, Y. L., Perron, N., Ciobanu, V. G., Zotter, P., Minguillón, M. C., Wacker, L., et al. (2012). On the isolation of OC and EC and the optimal strategy of radiocarbon-based source apportionment of carbonaceous aerosols. Atmos. Chem. Phys. 12, 10841–10856. doi:10.5194/acp-12-10841-2012
Zhang, G., Liu, J., Li, J., Li, P., Wei, N., and Xu, B. (2021). Radiocarbon isotope technique as a powerful tool in tracking anthropogenic emissions of carbonaceous air pollutants and greenhouse gases: a review. Fundam. Res. 1, 306–316. doi:10.1016/j.fmre.2021.03.007
Zheng, G., He, K., Duan, F., Cheng, Y., and Ma, Y. (2013). Measurement of humic-like substances in aerosols: a review. Environ. Pollut. 181, 301–314. doi:10.1016/j.envpol.2013.05.055
Keywords: PM2.5, PIXE, radiocarbon, isotopic markers, ordination methods
Citation: Romano S, Pichierri S, Fragola M, Buccolieri A, Quarta G and Calcagnile L (2022) Characterization of the PM2.5 aerosol fraction monitored at a suburban site in south-eastern Italy by integrating isotopic techniques and ion beam analysis. Front. Environ. Sci. 10:971204. doi: 10.3389/fenvs.2022.971204
Received: 16 June 2022; Accepted: 18 July 2022;
Published: 17 August 2022.
Edited by:
Daniele Contini, National Research Council (CNR), ItalyReviewed by:
Francesco Di Natale, University of Naples Federico II, ItalyJunwen Liu, Jinan University, China
Copyright © 2022 Romano, Pichierri, Fragola, Buccolieri, Quarta and Calcagnile. This is an open-access article distributed under the terms of the Creative Commons Attribution License (CC BY). The use, distribution or reproduction in other forums is permitted, provided the original author(s) and the copyright owner(s) are credited and that the original publication in this journal is cited, in accordance with accepted academic practice. No use, distribution or reproduction is permitted which does not comply with these terms.
*Correspondence: Salvatore Romano, c2FsdmF0b3JlLnJvbWFub0B1bmlzYWxlbnRvLml0