 Nurnadiah Zamri
 Wan Nur Amira Wan Azman
 Mohamad Ammar Pairan1
95% of researchers rate our articles as excellent or good
Learn more about the work of our research integrity team to safeguard the quality of each article we publish.
Find out more
ORIGINAL RESEARCH article
Front. Environ. Sci. , 06 January 2023
Sec. Environmental Informatics and Remote Sensing
Volume 10 - 2022 | https://doi.org/10.3389/fenvs.2022.971129
This article is part of the Research Topic Artificial Intelligence Methods for Water-Environment-Food-Energy Nexus View all 6 articles
Worldwide, water security is adversely affected by factors such as population growth, rural–urban migration, climate, hydrological conditions, over-abstraction of groundwater, and increased per-capita water use. Water security modeling is one of the key strategies to better manage water safety and develop appropriate policies to improve security. In view of the growing global demand for safe water, intelligent methods and algorithms must be developed. Therefore, this paper proposes an integrated interval type-2 Fuzzy VIseKriterijumska Optimizcija I Kompromisno Resenje (IT2FVIKOR) with unsupervised machine learning (ML). This includes IT2FVIKOR for ranking and selecting a set of alternatives. Unsupervised machine learning includes hierarchical clustering, self-organizing map, and autoencoder for clustering, silhouette analysis and elbow method to find the most optimal cluster count, and finally Adjusted Rank Index (ARI) to find the best comparison within two clusters. This proposed integrated method can be divided into a two-phase fuzzy-machine learning-based framework to select the best water security strategies and categorize the polluted area using the water datasets from the Terengganu River, one of Malaysia’s rivers. Phase 1 focuses on the IT2FVIKOR method to select five different strategies with five different criteria using five decision makers for finding the best water security strategies. Phase 2 continues the unsupervised machine learning where three different clustering algorithms, namely, hierarchical clustering, self-organizing map, and autoencoder, are used to cluster the polluted area in the Terengganu River. Silhouette analysis is applied along with the clustering algorithms to estimate the number of optimal clusters in a dataset. Then, the ARI is applied to find the best comparison within the original data with hierarchical clustering, self-organizing map, and autoencoder. Next, the elbow method is applied to double-confirm the best clusters for each clustering algorithm. Last, lists of polluted areas in each cluster are retrieved. Finally, this 2-phase fuzzy-Machine learning–based framework offers an alternative intelligent model to solve the water security problems and find the most polluted area.
Universally, water security is beneath serious weight because of a number of aspects that include rapid population growth, hydrological conditions, increased per-capita water use, rural–urban migration, pollution of water resources, over-abstraction of groundwater, and climate change and variability (GWP, 2000b; Jones et al., 2009; Vörösmarty et al., 2010; Evengard et al., 2011). Over 1.1 billion individuals need to get to a secure water supply, and 2.6 billion individuals need satisfactory sanitation (WWC, 2000; UNESCO, 2009; Onda et al., 2012). Worldwide, endeavors and resolutions to upgrade water security have been taken by numerous organizations and parties, including the World Water Forum, the Group of Eight (G8), the United Nations, and many researchers (Jones et al., 2009). These researchers have discussed water security issues in many ways and areas, for example, Chapagain et al. (2022) carried out qualified analyses of the outcomes of the indicators and interconnected the strategies, plans, and policies of the cities with the indicators of the combined framework to detect policy gaps and propose steps to enhance urban water management in the five cities. Demerdash et al. (2022) introduced a new theory for water security: the Irrigation Water Security Quality-based index, where irrigation water security was offered based on quality and quantity. In addition, they estimated the impact of water quality parameters on soil deterioration, agriculture productivity, and public health. Veettil et al. (2022) provided an outline of water security assessment by concentrating on several water security indicators and the theory of water footprint. In addition, they also examined the application of various physically based hydrological models, such as variable infiltration capacity (VIC) and Soil and Water Assessment Tool (SWAT), on water security assessment at a provincial-to-continental rainwater level separately. Castro-Pardo et al. (2022) calculated the composite index to assess water security through the application of a DEA approach. The proposed model was used to accumulate nine indicators involving the four dimensions of water security: human health and wellbeing; state of the water environment; functions and responsibility of societies; and sustainability and stability of livelihood.
Apart from these, some studies on water security issues used multi-criteria decision-making (MCDM) for further analysis, for example, Fetanat et al. (2021) expanded methodology based on two multi-criteria decision-making (MCDM) methods called linear assignment and entropy under an intuitionistic fuzzy environment to support the synthetic decision to highlight energy recovery from wastewater treatment technologies. Tu et al. (2021) developed a thorough valuation methodology for measuring the degree of regional water resource coordination (RWRC). First, they created a security–equity–efficiency (SEE) evaluation indicator system. Then, they combined VIKOR and DEMATEL methods to rank six alternatives for the RWRC of the appropriate regions. Namany et al. (2021) integrated an evaluation tool based on the AHP method and the energy, water, and food (EWF) nexus to create a decision-making scheme that guides policymakers in creating national priorities and sectorial strategies. Next, they applied their developed methodology to measure the performance of the EWF sectors in the State of Qatar. Nie et al. (2018) integrated the best–worst method (BWM), DEMATEL, and TOPSIS to construct the water sustainability evaluation and analyzed the valuation results and significant factors toward the development of water security sustainability. However, previous studies are still limited in terms of solving decision problems with conflicting criteria and determining the compromise ranking list and the compromise solution obtained with the initial (given) weights (Qin et al., 2015). Therefore, this study will examine two main research questions. The first question is raised on the most important factor contributing toward the success of water security strategies, and the second question is whether there exists a method that can solve a maximum group utility and a minimum individual regret of the opponent. In response to these problems and research questions, this study aims to carry out a better solution in visualizing the preferences from the group of decision-makers (DMs) and minimum individual DM regret as well as to measure the best strategies that contribute to the success of water security. The method used must be capable of providing all these answers and considering different preferences among DMs. One of the appropriate methods purposely used to capture different preferences among multiple strategies of decision problems is the interval type-2 VIseKriterijumska Optimizacija I Kompromisno Resenje (IT2FVIKOR).
Various authors have discussed the IT2FVIKOR method. Han et al. (2021) proposed a hybrid model combining ANP, DEMATEL, and VIKOR with type-2 fuzzy linguistic variables in considering the fuzzy uncertainty in the procedure of the safety assessment of rail transit operation (SARTO) and the interrelationship and conflict among the criteria. Wan et al. (2021) developed a combined VIKOR and trapezoidal interval type-2 fuzzy (TrIT2F) technique on the best–worst method (BMW). Then, their proposed method was exhibited with a makeshift (Fangcang) hospital selection example on COVID-19. Gul et al. (2021) improved the Fine–Kinney occupational risk assessment approach with IT2 FVIKOR to provide a useful and solid approach to the occupational health and safety risk assessment. Then, they applied their proposed method in a gun and rifle barrel external surface oxidation and coloring unit of a gun factory. Wang et al. (2019) combined the VIKOR method with IT2FS, where a new signed area function of IT2FSs was identified and the ranking score method based on the signed area function was proposed. Then, they converted the IT2 fuzzy number matrix to a ranking score value matrix and proved some theorems of the ranking score method. Then, they conducted a comparative analysis between the VIKOR method and the signed distance method to show the advantages of their proposed method. Qin and Liu (2019) defined a new distance measure for IT2FS and developed an IT2FVIKOR method based on the prospect theory. Then, they applied a numerical example on high-tech investment evaluation to illustrate the practicality and validity of the proposed method. Wu et al. (2019) proposed an integrated method based on the best–worst method (BMW) and the VIKOR technique in an interval type-2 fuzzy environment. Then, they applied green supply chain management to the proposed integrated method. Soner et al. (2017) integrated the VIKOR technique into the AHP method under an interval type-2 fuzzy environment. Then, they applied their proposed method to the hatch cover design selection problem, one of the structures of bulk carrier ships to protect cargo from external damages and prevent water ingress. Qin et al. (2015) extended the VIKOR method based on the interval type-2 environment and illustrated its applicability toward a high-tech risk evaluation case study. IT2FVIKOR has been proven to help people make decisions according to their preferences, in cases where there is more than one conflicting criterion. As per our knowledge, IT2FVIKOR has not yet been applied in any studies relating to water. However, IT2FVIKOR itself cannot meet the requirement of the growing global water security issue. The impact behind each decision on the growing global water security issue is still lacking and needs to be discussed and applied to the extended algorithms. Therefore, there is a need to develop other methods that can be integrated with IT2FVIKOR to achieve an advanced intelligent method. One of the appropriate methods suitable for the advanced intelligent method is machine learning (ML).
Machine learning (ML) is a branch of artificial intelligence (AI) that focuses on the use of big data and algorithms for predicting and classifying, clustering samples through experience and by the use of data (Tom, 1997). Two major learning in ML are supervised and unsupervised learning which are used in performing, or solving specific tasks, by learning from experiences and/or the relationships between the data. Both supervised and unsupervised learning are used in various scenarios and with several datasets. The main difference between supervised and unsupervised learning is that supervised learning requires training prelabeled inputs to predict the predetermined outputs. Supervised learning best estimates the relationship between the output and input observed in the data. On the contrary, unsupervised learning deals with unlabeled data, output, and input, and its goal is to discover relationships and patterns between the data. Therefore, supervised learning can be used to predict the classification, and unsupervised learning can be used to find the optimal classification (Dong et al., 2021). Nowadays, research in ML is in demand due to the huge amount of data and the nature of ML itself, easy and cheap computation. Many studies discussed ML in many applications. Ziyadidagen et al. (2022) analyzed the factors that could affect the risk of COVID-19 infection and death using K-means clustering and several classification models. From the K-means clustering, numerous significant attributes of the COVID-19 risk were emphasized. Dong et al. (2021) extracted 16 climatic data variables to estimate the climatic regionalization for pavement infrastructure using both unsupervised and supervised ML, including three unsupervised ML approaches, namely, factor analysis, principal component analysis (PCA), and cluster analysis, and two supervised ML approaches, namely, artificial neural network (ANN) and Fisher’s discriminant analysis. Ahmed et al. (2019) compared the supervised and unsupervised approaches to extract traffic-related tweets. They also developed a method to give the probability of level of congestion in real-time of tweets in Chennai.
ML has also been rigorously studied in many FMCDM methods, for example, Umar and Saraswat (2022) proposed a divergence measure for picture fuzzy sets and applied decision-making in ML, which were medical diagnosis, pattern recognition, and clustering using numerical illustration. Then, they justified their proposed method by assessing their results using comparative analysis. Yazici et al. (2022) identified and prioritized individual tacit knowledge criteria using ML methods and FAHP. ML methods including support vector machine (SVM), logistic regression, and artificial neural network were used to extract the variable. Their results show that the SVM and fuzzy analytic hierarchy process (FAHP) defined communication between employees and supervisors, time efficiency of employees, and innovative capability of employees as the most important tacit knowledge criteria. Then, Alazemi et al. (2022) focused on the role of internal factors in small- and medium-scale supply chains, where a three-phase fuzzy-based framework was proposed to address the product completion time problem. These three phases include supervised ML to classify the production alternatives, quantitative research, and fuzzy-based heuristics to generate production. Mohsin et al. (2022) offered a novel approach for selecting landfill sites and sustainable solid waste management (SWM) in India using integrated FAHP-SVM and FAHP-RF. Their findings provide a guideline to decision-makers (DMs) and planners for optimal landfill site selection in other cities of developing countries. Jain et al. (2021) proposed multi-attribute decision-making (MADM) with ML algorithms for employee churn (ECn) in solving the revenue and brand image of the organization. MADM methods include TOPSIS for quantifying the importance of the employees to perform their class-based categorization. ML algorithms include CatBoost for predicting class-wise ECn. Then, Nilashi et al. (2019) proposed a hybrid method for online review analysis through MCDM, text mining, and predictive learning techniques to find the relative importance of factors affecting travelers’ decision-making in selecting green hotels with spa services. ML algorithms include a self-organizing map (SOM) for cluster analysis, latent Dirichlet analysis (LDA) for analyzing textual reviews, TOPSIS for ranking hotel features, and neuro-fuzzy to reveal customer satisfaction levels. Shen and Tzeng (2016) proposed a novel multiple attribute decision-making model to resolve—from ranking/selection to improvement planning—the problems of business analytics in finance, based on the similarity with positive context (rules) and the dissimilarity with negative ones. Their proposed method combines fuzzy-rough machine learning including the dominance-based rough set approach (DRSA), VIKOR, and bipolar decision model. Due to the eligibility of ML with MCDM, our studies enhanced IT2 FVIKOR with ML to solve the water security issue.
Therefore, this paper focuses on integrating IT2FVIKOR with unsupervised ML. IT2FVIKOR has the ability to solve uncertainty issues by combining the solution into a maximum group utility and a minimum individual regret of the opponent. In addition, IT2FVIKOR would discover the best solution and a compromise solution by prioritizing important factors (Moradi et al., 2002). This includes IT2FVIKOR for ranking and selecting a set of alternatives; unsupervised ML includes hierarchical clustering, SOM, and autoencoder for clustering; silhouette analysis and elbow method to find the most optimal number of clusters; and last, Adjusted Rank Index (ARI) to find the best comparing within two clusters. Unsupervised ML, able to determine the relevancy based on data features (El Bouchefry and de Souza, 2020), has no attention to structured semantic relationships, and therefore, is suitable to be applied to heterogeneous data (Jain, 2010). This proposed integrated method can be divided into a two-phase fuzzy-ML-based framework to select the best water quality strategies and categorize the polluted area in the Terengganu River, which is one of the rivers in Malaysia. Phase 1 focuses on the IT2FVIKOR method to select five different strategies with five different criteria using five DMs for finding the best water quality strategies. Phase 2 continues the unsupervised ML, where three different clustering algorithms, namely, hierarchical clustering, SOM, and autoencoder, are used to cluster the polluted area in the Terengganu River. Silhouette analysis is applied along with the clustering algorithms to estimate the number of optimal clusters in a dataset. Then, the ARI is applied to find the best comparison within the original data with hierarchical clustering, SOM, and autoencoder. Next, the elbow method is applied to double-confirm the best clusters for each clustering algorithm. Last, lists of polluted areas in each cluster are retrieved. Finally, this two-phase fuzzy-ML-based framework can be concluded as the best water security strategies to be applied to the most polluted area. The rest of this paper is organized as follows: Section 2 describes the methodology framework including the concepts of IT2FVIKOR procedures; the unsupervised ML procedures including hierarchical clustering, autoencoder, and SOM; and silhouette analysis and ARI. Section 3 presents an illustrative example to demonstrate the feasibility and consistency of the integrated IT2FVIKOR with ML algorithms. Section 4 presents the conclusion.
The conceptual framework is illustrated in Figure 1, which shows the entire fundamental process involved in the study. Generally, the conceptual framework can be divided into two different phases. Phase 1 focuses only on the MCDM method, which is IT2FVIKOR with step-by-step flows. Phase 2 demonstrates the ML part consisting of all the preprocessing steps and unsupervised techniques. The details of each process are described in each subsection.
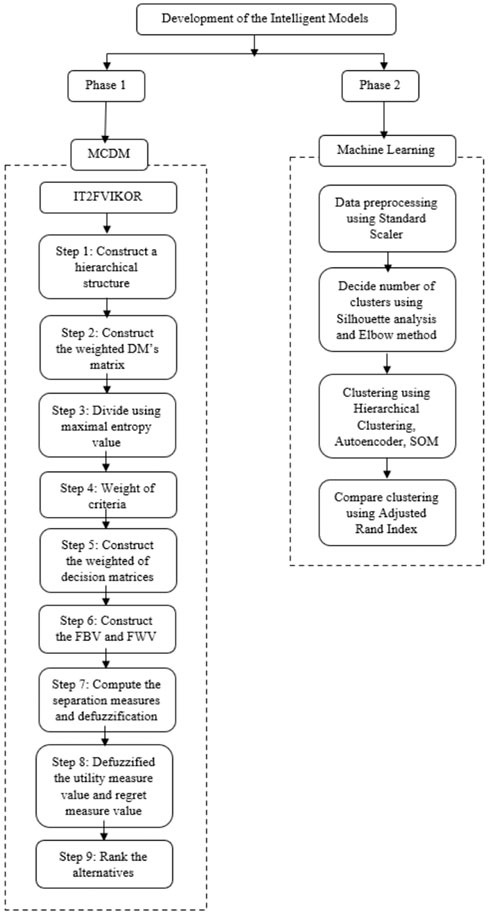
FIGURE 1. Conceptual framework.
The IT2FVIKOR, with an equitable linguistic scale and Z-Numbers method, is developed to achieve a higher rational, systematic decision-making process to discover the best solution and a compromise solution that considers both sides of the scale. Then, entropy weight method is used for weighting values to greatly reduce the decision-making burden in the subjective weighting process and achieves a rather consistent weighting outcome. The IT2FVIKOR procedure is explained step-by-step as follows:
Assume that there is a finite set X of alternatives, where
Step 1: Construction of a hierarchical diagram of the IT2FMCDM problem.
We construct the decision matrix Yp of the pth DM and the average decision matrix
where
Step 2: Construction of the weighted DM matrix.
The proposed entropy weight method based on IT2FSs is defined as follows:
Let us assign
Thus.
where
Step 3: Divide using maximal entropy value.
Then, all the entropy values are divided by using the maximal entropy value, and the value of ij h is used to represent the outcomes of the maximal entropy value. Therefore, it can be defined as follows:
Then, the decision matrix, D, can be expressed as follows:
Step 4: Weight of criteria.
The weight of criteria is calculated by using the fuzzy entropy weight-based IT2FS formula. The Wj is used to present the outcome of the weight value of criteria j. Thus, it can be defined as follows:
where
Step 5: Construct the weighted decision matrices.
where
Step 6: Construct the fuzzy best value (FBV) and fuzzy worst value (FWV).
Choose the FBV and FWV values using the following equations:
where
Step 7: Compute the separation measures and defuzzification.
Evaluate the following values,
where
Step 8: Defuzzify the utility measure value (
Step 9: Rank the alternatives.
Calculate the following values,
where
Then,
where
Next,
where
v
Last,
Unsupervised machine learning is a type of algorithm that learns patterns from unlabeled data. Through mimicry, the machine is forced to build the same patterns and characteristic representation from the important mode of learning in each situation. Some of the most used algorithms in unsupervised learning include clustering, anomaly detection, and approaches for learning latent variable models. This study only focuses on clustering algorithms with two comparison methods. The details of each algorithm are explained in the next subsection.
Ward studied hierarchical clustering techniques based on minimizing the ‘loss of information’ from joining two groups (Ward, 1963). This method is usually implemented with a loss of information taken to be an increase in an error sum of squares criterion (ESS). Thus, the ESS is defined as follows:
where
At first, each cluster comprises a single item. At each step in the analysis, the union of every possible pair of clusters is considered, and the two clusters whose combination results in the smallest increase in ESS (a minimum loss of information) are joined. When all the clusters are combined in a single group of
An autoencoder is an unsupervised feed-forward multi-layer neural network where the desired output is the input itself (Silberer and Lapata, 2014; Zhou and Paffenroth, 2017). The autoencoder is used to discover clusters of similar instances in an unlabeled dataset and consists of two parts (Delgado, 2019):
Encoder
Decoder
In this training, we need to determine
where
Moreover, all the layers used rectified linear unit (ReLU) activation function because it is easier to train and often achieves better performance. The optimizer selected to train the neural network is Adam, and the metric that is going to be minimized is the mean squared error (MSE) for loss function, which can be described as follows:
where
The self-organizing map (SOM) is a prominent unsupervised neural network, considered a 2D mapping of the data group (Kohonen, 1984). In other words, the SOM converts a non-linear projection of n-dimensional multivariate data onto a low-dimensional display. The SOM net is made up of a number of nodes usually organized in a rectangular or hexagonal grid. Each neuron in the SOM array is linked to the input vector
where
The weight vector
where
where
Silhouette is used to evaluate how well clustering results are clearly separated. In order to construct a silhouette, we only need two things: the partition and collection of all proximities between objects. For each object
Silhouette analysis can be used for two purposes: 1) to check the validity of the obtained clustering solution and 2) to use along with a clustering algorithm to estimate the number of clusters in a dataset.
Adjusted Rank Index (ARI) is the best-performing method for comparing two partitions. The ARI obtains a value of unity when the two partitions perfectly agree (in the current situation, when two nodes are connected to the same set of other nodes) and a value of zero when there is only chance agreement between the partitions. At face value, while the ARI might be known to outperform other methods of partition agreement, it still suffers from the problem of establishing an arbitrary threshold to decide if a pair of nodes should be linked or remain unlinked.
Fortunately, we can take advantage of a clever proof given by Warrens (2008) that demonstrates that the ARI is equivalent to Cohen’s K (1960) when there are two partitions, and the cluster labels are known a priori. Both of those conditions are met as the two partitions are defined by the edge sets of nodes
In this application, the ARI gives each potential link a score between -1 and 1, where a score greater than 0 indicates that the probability of a link being there is greater than random chance. Using 0 as a defined cutoff value to defect links is an inherent benefit of ARI over other methods where the cutoff must be determined ahead of time.
This section successfully discusses the method formulation involving step-by-step systematic procedures of the IT2FVIKOR. Then, it follows with the unsupervised machine learning algorithms. Later, the next section discusses the evaluation of these algorithms with real application.
This section relies on MCDM which is IT2FVIKOR and unsupervised ML algorithms, hierarchical clustering, autoencoder, and SOM. The schematic diagram of the proposed method is shown in (Figure 2). In phase 1, we used IT2FVIKOR to discover the best water security strategies using the data in the form of linguistic variables collected from DMs. All the human and non-human factors that are normally linked with water security strategies are considered for the best ranking. Then, in phase 2, using the data from the Department of Environment, Malaysia, we applied three different clustering algorithms along with silhouette analysis to obtain a list of clusters and the best optimal number of clusters. The ARI is used to compare the extent of agreement between the assignment of clusters for different algorithms. This method calculates the extent of agreement between two sets of groupings and outputs a representative score between 1 and −1. The elbow method is applied to double-confirm the best clusters for each clustering algorithm. Last, lists of polluted areas in each cluster are retrieved.
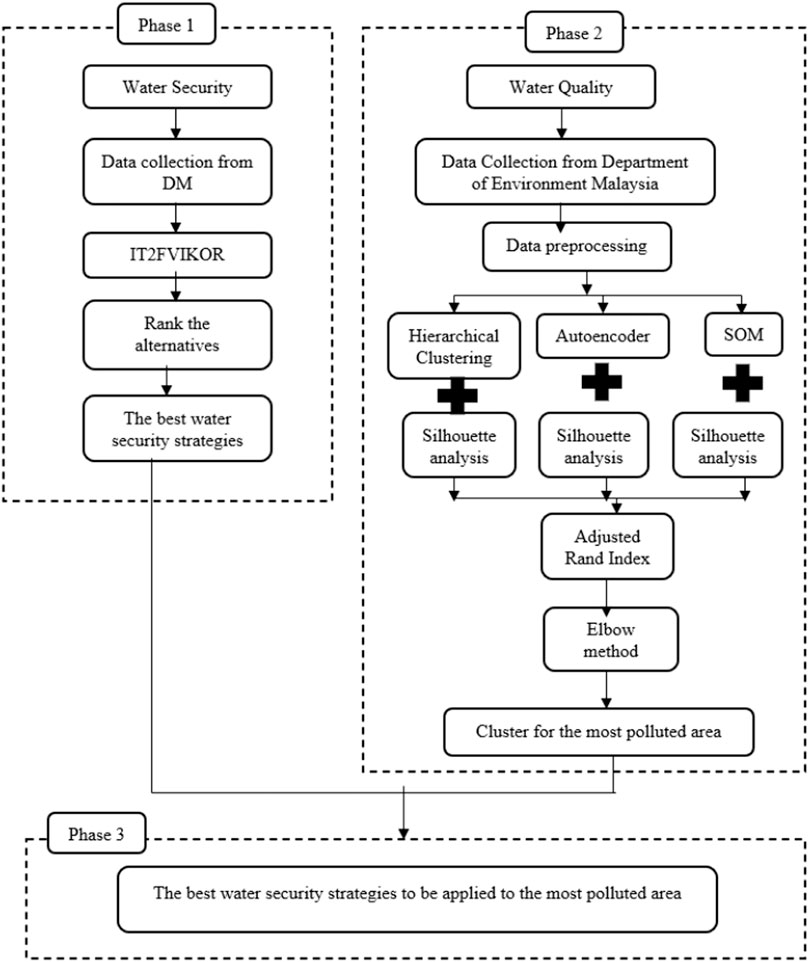
FIGURE 2. A process of integrated IT2FVIKOR with machine learning to the real application.
A real application for searching the best strategies to enhance water supply security is used to illustrate the procedures and feasibility of the IT2FVIKOR. Six alternatives
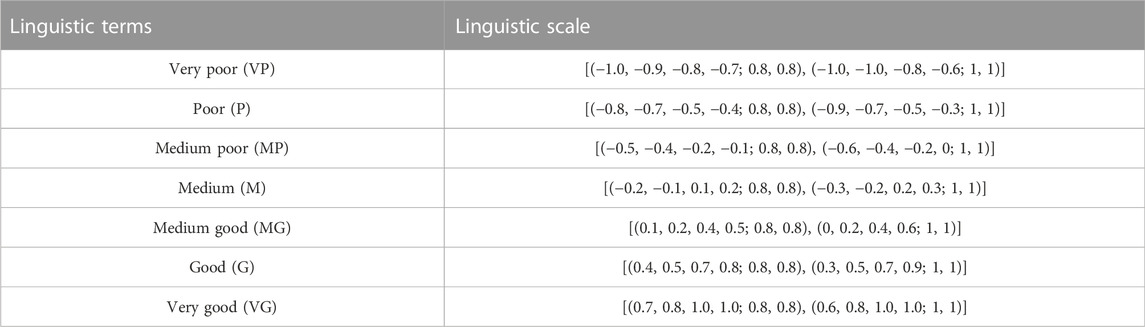
TABLE 1. Linguistic scale of restriction for the extended IT2FVIKOR.
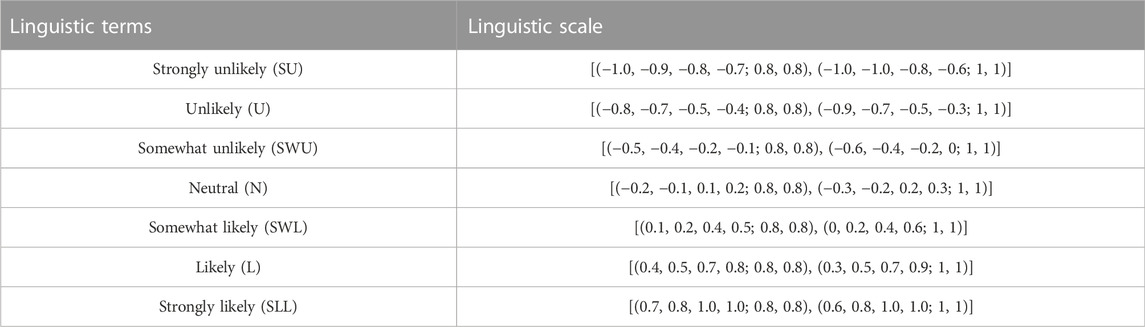
TABLE 2. Linguistic scale of reliability for the extended IT2FVIKOR.
Next, the computational procedure is summarized as follows:
Step 1: Construction of a hierarchical structure of weight factors associated with the strategies to enhance water supply security.
The hierarchical structure of evaluating the best strategies to enhance water supply security in Malaysia is given in Figure 3.
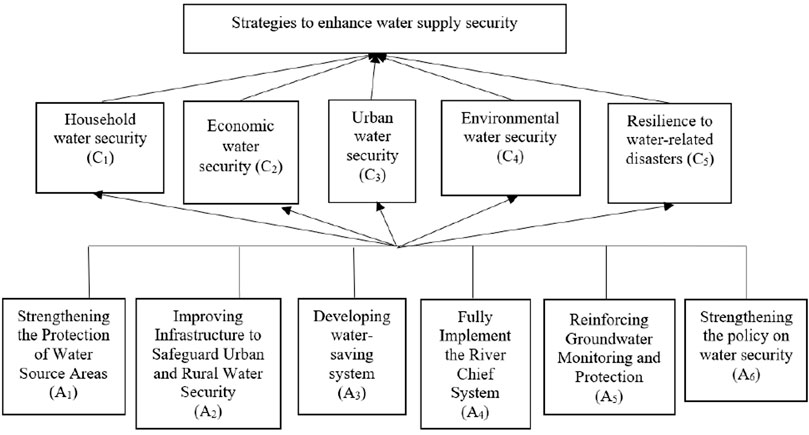
FIGURE 3. Water security decision attributes hierarchy.
The comparison results involve six strategies as the alternatives and five criteria based on water supply security. The rating of each alternative for each criterion is presented by DMs.
The data that consider negative and positive sides with restriction and reliability and its conversion (using Table 1 and Table 2) are referred in order to construct a matrix of attributes. Therefore, let us take an example of calculating the
(VG, L) = ((0.7, 0.8, 1.0, 1.0; 0.8, 0.8), (0.6, 0.8, 1.0, 1.0; 1, 1)),
((0.4, 0.5, 0.7, 0.8; 0.8, 0.8), (0.3, 0.5, 0.7, 0.9; 1, 1))
(G, SWL) = ((0.4, 0.5, 0.7, 0.8; 0.8, 0.8), (0.3, 0.5, 0.7, 0.9; 1, 1)),
((0.1, 0.2, 0.4, 0.5; 0.8, 0.8), (0, 0.2, 0.4, 0.6; 1, 1))
(VG, SLL) = ((0.7, 0.8, 1.0, 1.0; 0.8, 0.8), (0.6, 0.8, 1.0, 1.0; 1, 1)),
((0.7, 0.8, 1.0, 1.0; 0.8, 0.8), (0.6, 0.8, 1.0, 1.0; 1, 1))
(VG, SLL) = ((0.7, 0.8, 1.0, 1.0; 0.8, 0.8), (0.6, 0.8, 1.0, 1.0; 1, 1)),
((0.7, 0.8, 1.0, 1.0; 0.8, 0.8), (0.6, 0.8, 1.0, 1.0; 1, 1))
(VG, SLL) = ((0.7, 0.8, 1.0, 1.0; 0.8, 0.8), (0.6, 0.8, 1.0, 1.0; 1, 1)),
((0.7, 0.8, 1.0, 1.0; 0.8, 0.8), (0.6, 0.8, 1.0, 1.0; 1, 1))
Then, the average for (VG, L), (G, SWL), (VG, SLL), (VG, SLL), and (VG, SLL) is
((0.64, 0.74, 0.94, 0.96; 0.8, 0.8) (0.54, 0.74, 0.94, 0.98; 1, 1)).
((0.52, 0.62, 0.82, 0.86; 0.8, 0.8) (0.42, 0.62, 0.82, 0.9; 1, 1)).
Apply the same calculation as
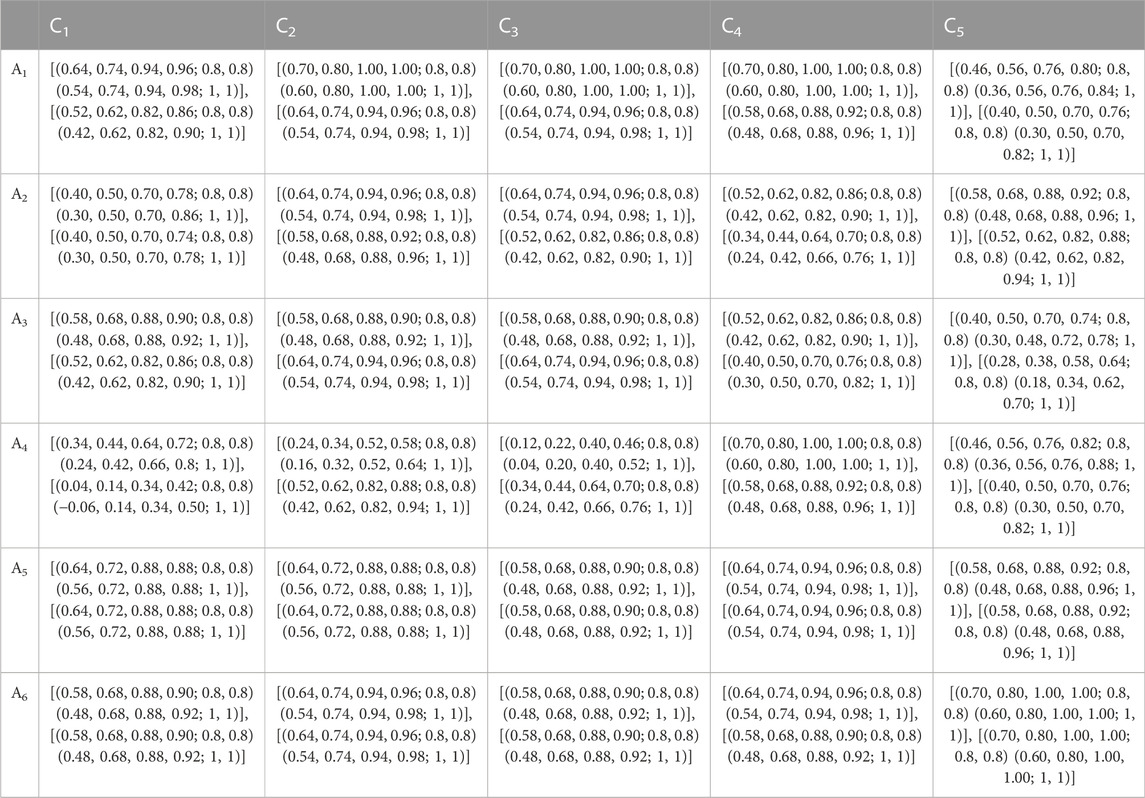
TABLE 3. Judgement matrix.
Step 2: Construct the weighted DM matrix.
Use the fuzzy entropy with IT2FS formulas (Eq. 2) to calculate each of the entropy values in the decision matrix. Therefore, the entropy value for
Using a similar calculation, the entropy value for other attributes is calculated and listed in Table 4.
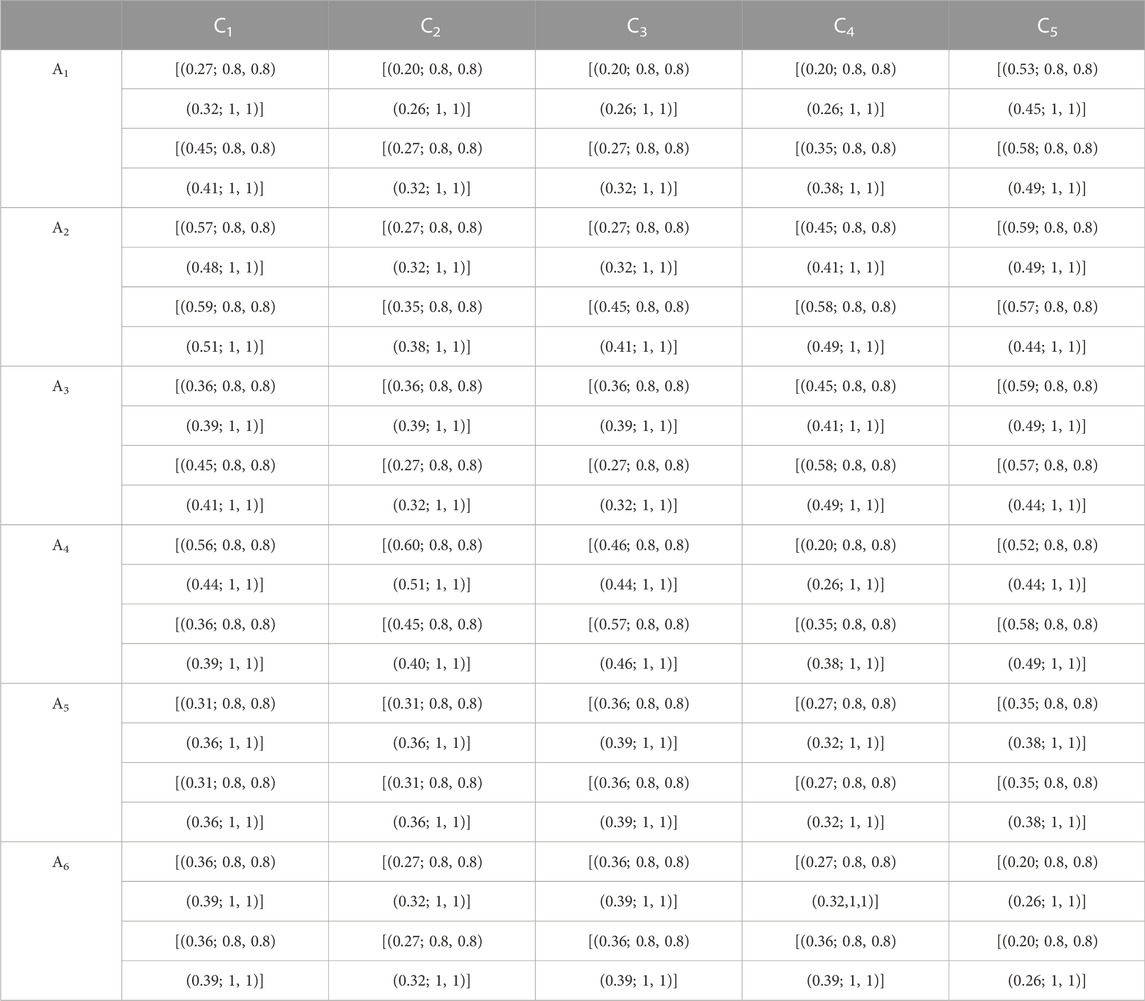
TABLE 4. IT2 fuzzy entropy.
Step 3: Divide using the maximal entropy value.
All the entropy values are divided by using the maximal entropy value followed by Eq. 3.
Let us take
max
Thus,
Using the same calculation, the maximal entropy value is shown (Table 5) as follows:
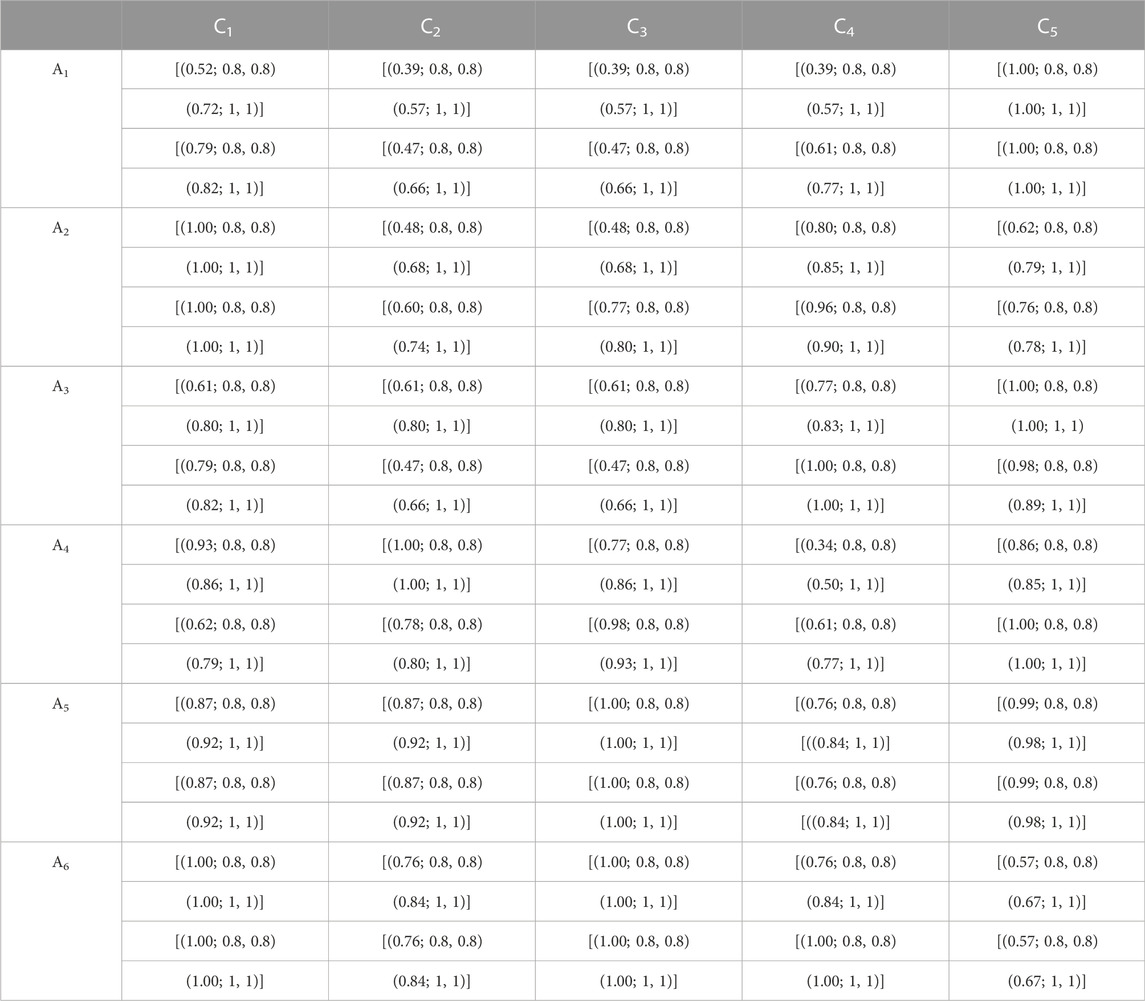
TABLE 5. Maximal entropy value.
Step 4: Weight of criteria.
Next, calculate the weight of the criteria by using the weight formula from Eqs. 5, 6. The whole entropy-based weights are listed as follows:
Step 5: Construct the weighted decision matrices.
The weighted DM matrix with respect to aggregated matrix comparison of each criterion and alternatives is constructed by using Eq. 7.
For example, let the value of the weighted matrix for
Thus, the remaining values of weighted DM’s matrix are shown (Table 6) as follows:
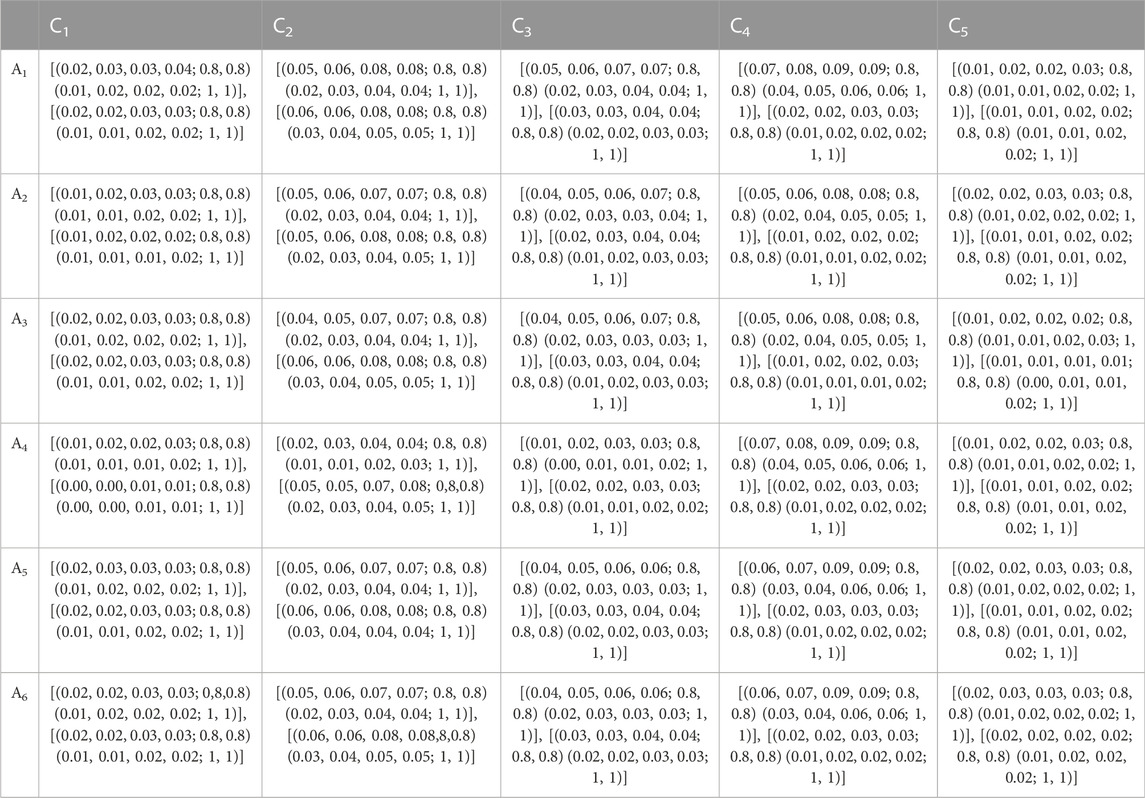
TABLE 6. Weighted decision matrix.
Step 6: Construct the fuzzy best value (FBV) and fuzzy worst value (FWV).
Values for FBV and FWV are chosen using Eq. 8 and combined (Table 7) as follows:
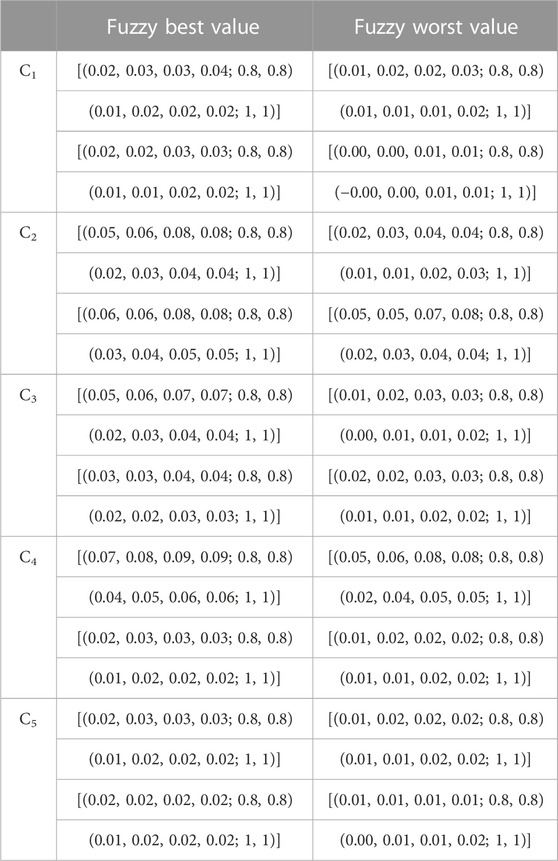
TABLE 7. Fuzzy best value and fuzzy worst value.
Step 7: Compute the separation measures and defuzzification.
The utility measure
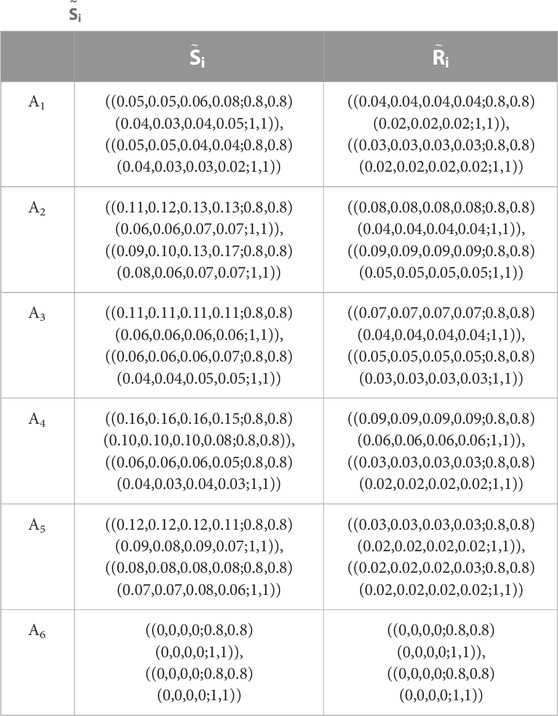
TABLE 8.
Step 8: Defuzzification of the utility measure value (
This defuzzification step is needed to further proceed with the next calculation in Step 9. Therefore, each utility measure value (
Thus, the remaining defuzzification results for
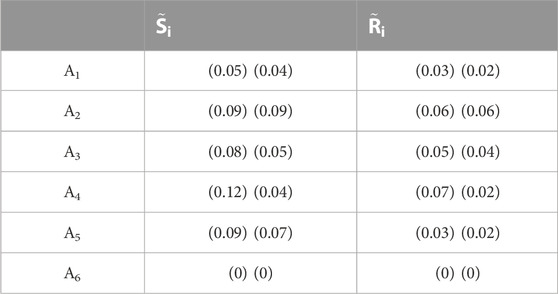
TABLE 9. Defuzzified values of
Step 9: Rank the alternatives.
Here, we listed all the values for 1) the maximum group of utility
The final indexes for both
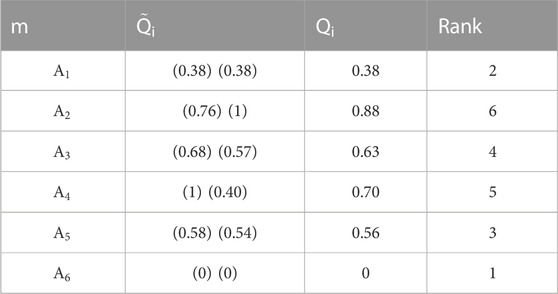
TABLE 10. Rating of
Thus, after taking into account the five criteria, six alternatives, and the opinion from the five DMs, a single measurement for the best strategies to enhance water supply security in Malaysia is obtained. The results showed that the first rank is strengthening the policy on water security at 0, followed by strengthening the protection of water source areas, reinforcing groundwater monitoring and protection, developing a water-saving system, and fully implementing the river chief system. Improving infrastructure to safeguard urban and rural water security is ranked last. This ranking proved that the IT2FVIKOR method can carry out a better solution in visualizing the preferences from the group of DMs and can measure the best strategies that contribute to the success of water security. Next, this study was further continued with the identification of the polluted areas to implement the water security strategies. Usually, studies on IT2FVIKOR only focus on the analysis of various available choices in certain situations or research areas to find the most preferred alternatives (our target or objectives) and present them in ranking order. If the results from IT2FVIKOR can be addressed for a specific polluted area, it will bring huge benefits to public health, economic growth, and environmental sustainability, and at the same time reduce disaster risk. The identification of specific polluted areas is a very important issue and needs intelligent techniques that are more convincing. Therefore, this paper offers further investigation on IT2FVIKOR problems with integrated ML techniques.
This section focuses on continuing the investigation on river water problems from the previous section and selecting a set of polluted areas based on the Terengganu River dataset to be implemented with the results of the water security strategies from Section 4. This section includes the description of the research location in Subsection 3.2.1, preprocessing of the datasets in Subsection 3.2.2, and applying the machine learning algorithms which includes three different unsupervised learning in Subsection 3.2.3.
The Terengganu River originating from the Terengganu state, one of the states in Peninsular Malaysia, is chosen as the main research location for this study. This river flows through the Kenyir Dam (Empangan Tasik Kenyir) located in Hulu Terengganu and ends in Kuala Terengganu (downstream part) toward the South China Sea. This river basin is situated between a latitude of 4°40′N-5°20′N and a longitude of 102°30′E-103°09′E in the North Eastern coastal region of Peninsular Malaysia. There are sixteen main tributaries of the Terengganu River Basin, with a total catchment area of about 5,000 km2 (11, 46, 47) (Wahab et al., 2019). The largest basin among the sixteen basins is the Nerus River Basin. All rivers pass through different socio-economic activity zones such as aquacultures, agricultural, commercial industries, farming, urban and rural settlements, tourism, reserves, and forests (Taman Negara). This study involves 14 main sampling stations with 24 water quality parameters, including 405 water samples. These 405 water samples were taken from all around the Terengganu River Basins, whereas the 24 water quality parameters include dissolved oxygen (DO), biochemical oxygen demand (BOD), chemical oxygen demand (COD), suspended solids (SS), pH, ammonia nitrates (NH3-N), temperature (TEMP), nitrogen nitrates (NO3), chloride (CI), phosphate (PO4), arsenic (As), Mercury (Hg), cadmium (Cd), chromium (Cr), lead (Pb), zinc (Zn), calcium (Ca), iron (Fe), potassium (K), sodium (Na), oganesson (OG), surfactant (MBAS), E-coli, and total coliform. Detailed description of the research location is summarized in Figure 4.
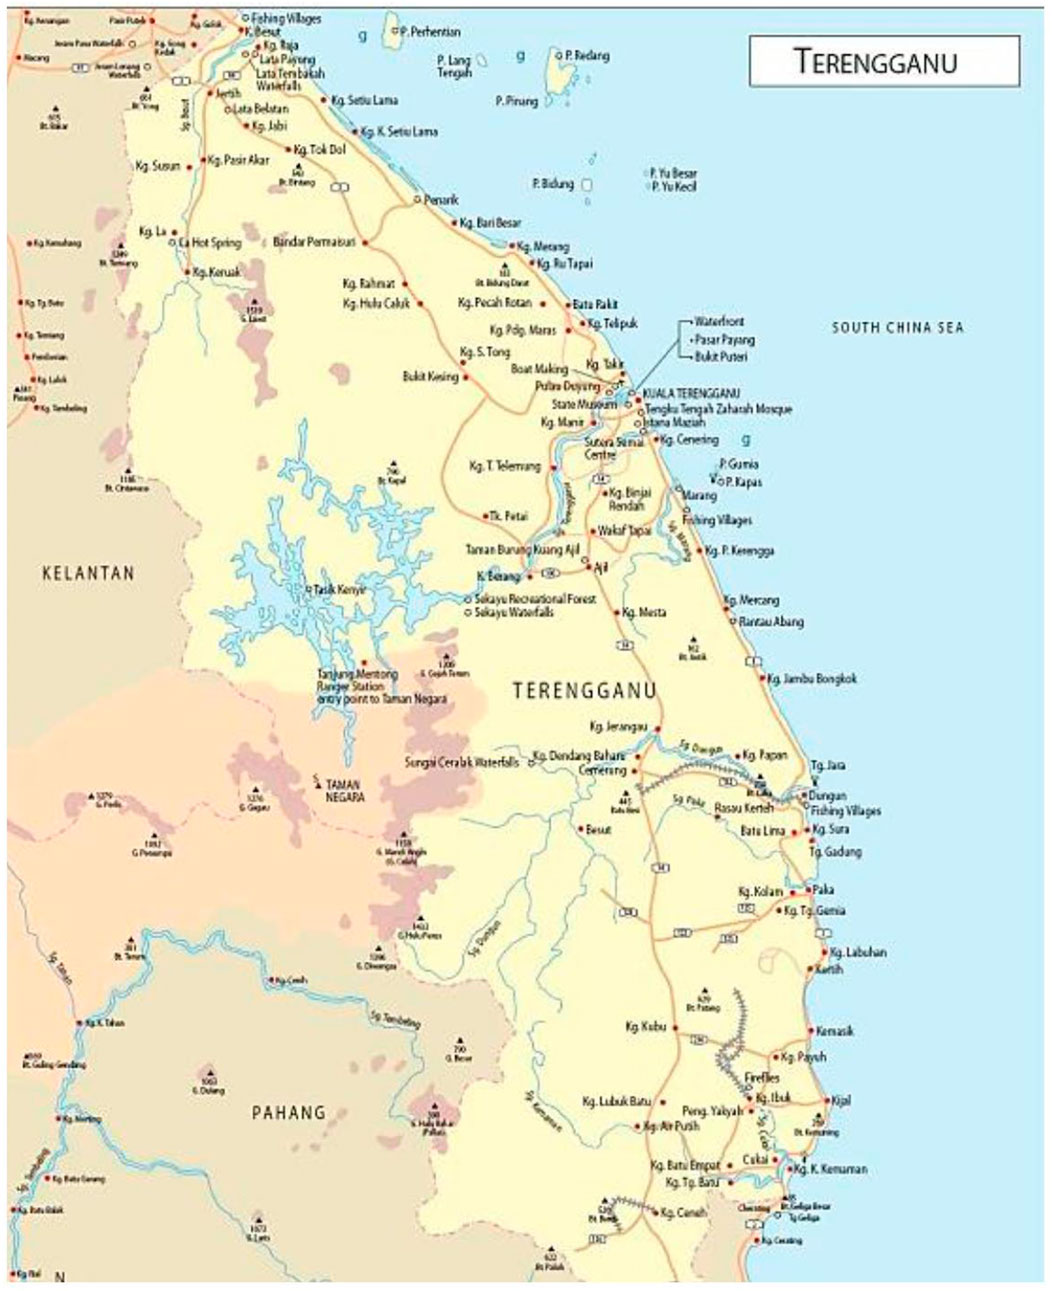
FIGURE 4. Terengganu river map (Source: https://uniqorne.wordpress.com/2009/05/16/uniquely-marang/).
The discovery of novel groupings within a dataset requires unsupervised methods. This study used unsupervised ML, which does not require class labels associated with pre-defined groups to allocate targets to. This unsupervised ML can be achieved through data clustering. Before applying the clustering algorithms, these datasets went through a process called preprocessing. The 24 water quality parameters have a variety of data types with different scales. Direct usage of data without preprocessing leads to poor performance of the learning methods. In this study, we used the StandardScaler method to standardize all the parameters. The StandardScaler is used to standardize a feature by subtracting the mean and then scaling to unit variance. Unit variance means dividing all the values by the standard deviation.
All the algorithms are executed using the Python programming language. ML algorithms and preprocessing modules are executed using scikit-learn libraries (Pedregosa et al., 2011; Komer et al., 2014). Meanwhile, all the images are created using Matplotlib modules (Hunter, 2007).
The purpose of this investigation is to identify clusters of polluted areas using the Terengganu River data. Our investigation is extended to the IT2FVIKOR, which discovers the best water security strategy and applies it to the polluted area clusters. After data preprocessing, the discovery of novel groupings within a dataset requires unsupervised algorithms. These do not require class labels associated with pre-defined groups to allocate items to. This can be achieved through data clustering. In this study, we focus on three different clustering algorithms which are hierarchical clustering, autoencoder, and SOMs. These three methods are the most popular unsupervised ML techniques that can solve different types of applications.
Hierarchical clustering methods are the simplest and most fundamental methods and famously play an important role in statistical data analysis (Johnson, 1967). They are relatively fast and easy to understand and implement (Zhu et al., 2022). The autoencoder has the ability to reduce the dimension of the input in a hierarchical way, leading to high-quality reconstructions of data (Tewari et al., 2017; Zhao et al., 2017). SOMs are frequently used to reveal complex correlations between samples that can be conveyed by a single map. It simplifies the analysis and enables multi-variate exploratory comparisons between samples via direct visual separation (Wongravee et al., 2020). Next, K-means was run in each of the clustering algorithms in line with the silhouette analysis to find the optimal number of clusters. The silhouette method measures the average distance between the data points of a cluster’s members compared to those of alternative clusters (Rousseeuw, 1987). This silhouette method is measured differently for each clustering method. In this analysis, we set the range of clusters as [2, 3, 4, … , 10]. The details are explained as follows.
Using the preprocessing data, we carried out hierarchical clustering to visualize the intrinsic clusters in the Terengganu River data and determine which areas are polluted in which clusters. The algorithm of hierarchical clustering works as follows. Initially, the algorithm considers each data point belonging to its own cluster. In this case, clusters are the polluted areas. At each step, the algorithm merges the most appropriate pair of clusters based on their level of pollution. The iterative merging process continues until there is only one cluster. The appropriateness of a pair merging is decided by a criterion. Hierarchical clustering has many variants which differ from one another in the merge criterion employed. For this hierarchical clustering, we used the Ward method. According to the framework, one can use an objective function of searching for the most polluted area that reflects the chosen criterion for selecting the pair of polluted area clusters for merging. The pair which leads to the maximal value for the objective function is selected for merging at each step. Ward suggested using the total within-cluster sum of squared errors (TWSSE) as an objective function.
Initially, as each data point is considered belonging to its own polluted area cluster, the cluster mean point coincides with the data point of the cluster for each cluster. So, the TWSSE at this stage is 0. The TWSSE increases at each subsequent step when two polluted area clusters are merged, leading to the minimum increase in the TWSSE, for actual merging. Figure 5 shows the hierarchical maps for 405 water samples. These 405 water samples are well-separated into three groups (based on their different colors). For the best number of clusters, we next run K-means with silhouette analysis.
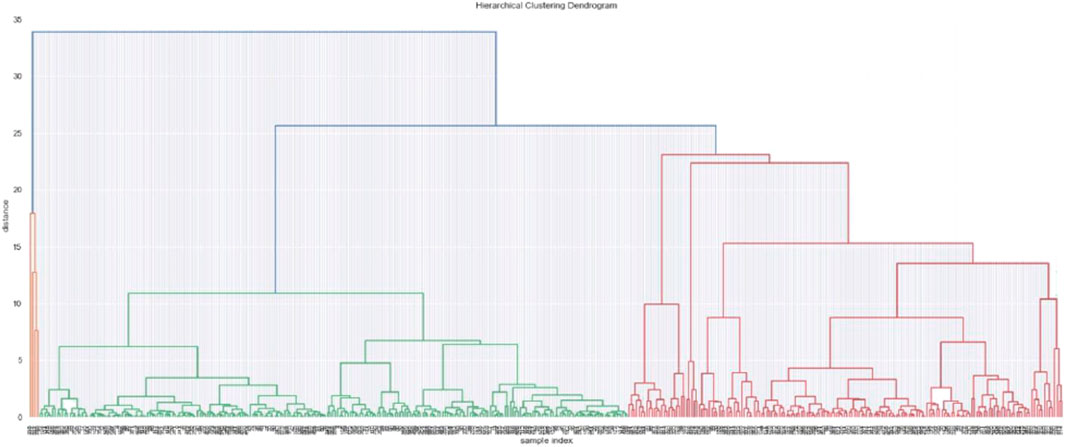
FIGURE 5. Hierarchical maps.
Then, K-means was set to run ten times setting k = 10 to get ten clusters. For each k, the clustering solution which has the maximum average silhouette analysis was selected. From among these ten clustering, the one with the maximum average silhouette analysis was taken as the final clustering solution. Based on Table 11 and Figure 6, silhouette analysis suggested two clusters for polluted areas with hierarchical clustering with 0.5349.

TABLE 11.
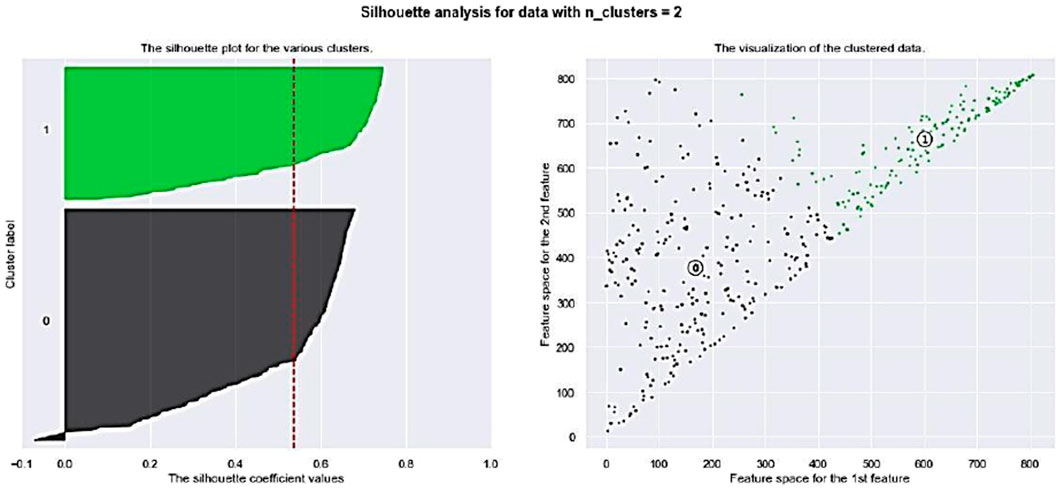
FIGURE 6. Silhouette with n_clusters = 2 for Hierarchical clustering.
Kohonen self-organizing maps (SOMs) are a type of unsupervised ANN (Kohonen, 1984). SOMs work by using a 2D grid of map units, which are each represented by a prototype vector, and are connected to their neighboring units by the neighborhood relation (Vesanto and Alhoniemi, 2000). The map is built up iteratively, so, for each sample which is a polluted area, the distance between the input vector (water quality parameters) and each of these prototype vectors is computed to identify the best matching unit (BMU). Then, the BMU and its neighboring units are adjusted to be closer to the input vector. The resulting grid of map units includes the samples assigned to them. When there is a high number of these map units (MUs), clustering can be performed on the MUs themselves (Vesanto and Alhoniemi, 2000). As the samples are mapped to MUs, the clustering of the samples can be extracted from this. The optimal number of clusters was identified as 4 (Figure 7), covering all 405 water samples.
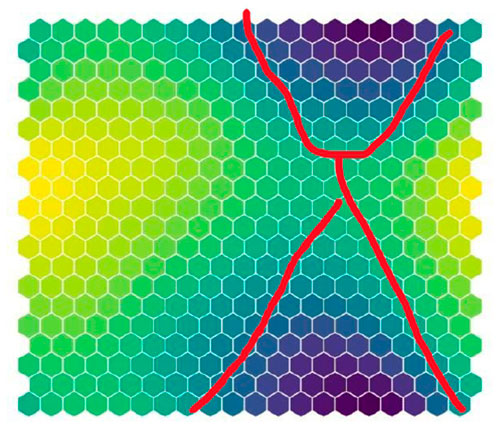
FIGURE 7. Visualization of SOM.
Then, K-means was set to run ten times, setting k = 10 to get ten clusters. For each k, the clustering solution which has the maximum average silhouette analysis was selected. From among these ten clustering, the one with the maximum average silhouette analysis was taken as the final clustering solution. Based on Figure 8, silhouette analysis suggested four clusters for polluted areas with SOM of 0.3971.
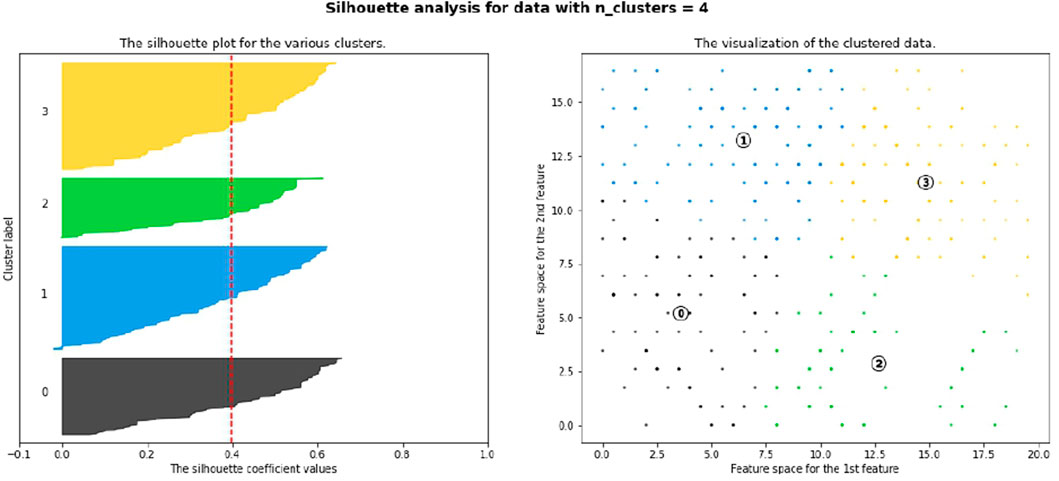
FIGURE 8. Silhouette with n_clusters = 4 for SOM.
Autoencoders are another form of ANN, operating in a three-layer structure. The first layer consists of the input data which undergo an encoding step. Thus, as where the original set of features is converted into a smaller set, called a latent feature representation of the dataset, there is necessarily data loss in this process, followed by a decoding step which converts this reduced feature set back into a dataset with the same number of features as the original, the reconstructed layer. By training the network to minimize the data loss between the input and reconstructed layers, the maximum information can be encapsulated in this latent feature set. Once the autoencoder has been trained on a subset of the dataset, it can be used to convert the full dataset into its latent features. The results of this feature extraction can then be clustered. These latent features are non-linear combinations of the original measurement, so they cannot be used to make inferences about them. The optimal clustering of a dataset divides it into groups that maximize the similarity within the clusters, while minimizing the similarity between them (Vesanto and Alhoniemi, 2000).
Then, K-means is set to run ten times, setting k = 10 to get ten clusters. For each k, the clustering solution which has the maximum average silhouette analysis is selected. From among these ten clustering, the one with the maximum average silhouette analysis is taken as the final clustering solution. Based on Figure 9, silhouette analysis suggested two clusters for polluted areas with autoencoder with 0.8578.
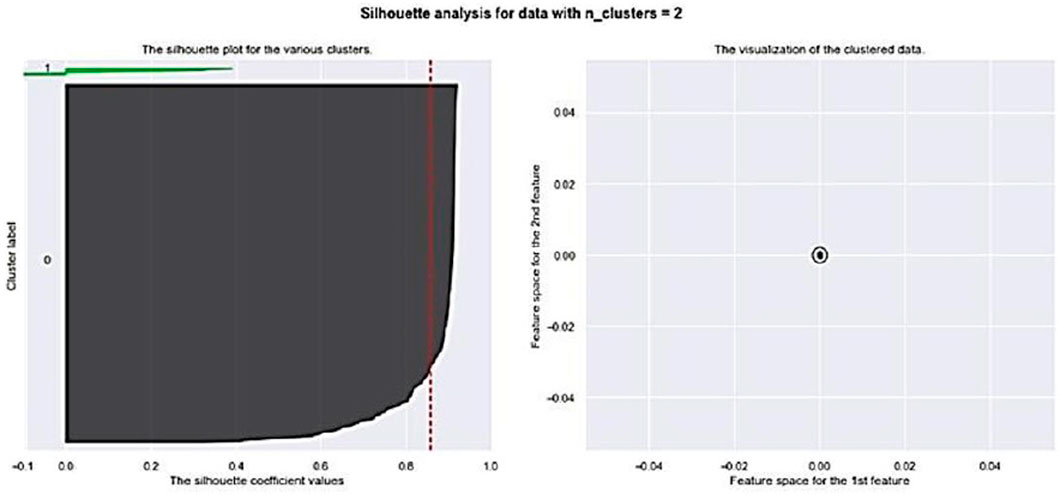
FIGURE 9. Silhouette with n_clusters = 2 for Autoencoder.
The original Terengganu River dataset proposedly divided this water polluted area into three different clusters which were clean, slightly polluted, and polluted, based on the Water Quality Index (WQI) analysis. This original data cluster information is used for the performance analysis. Therefore, an external cluster validity index is employed for assessing the quality of the clustering analysis. Specifically, we used the ARI. The ARI is a commonly used index proposed by Hubert and Arabie (1985). This method calculates the extent of agreement between two sets of groupings and outputs a representative score between 1 and −1. On this scale, 1 is identical, with 0 being the equivalent of a random association (Gates and Ahn, 2017). The highest achievable ARI score is 1. This score is achieved when the cluster membership computed by the clustering algorithm is the same as the true agreement of the clustering result with the true cluster memberships. Negative scores indicate against clustering.
Although silhouette analysis achieved a high index with two clusters for hierarchical clustering, four clusters for SOM and two clusters for autoencoder, this study suggested running the ARI for six different numbers of clusters for all the algorithms. These six clusters for the algorithms include hierarchical clustering with two clusters, hierarchical clustering with three clusters, SOM with three clusters, SOM with four clusters, autoencoder with two clusters, and autoencoder with three clusters. We chose six different number clusters due to suggested clusters from the original data.
The ARI scores show that (original data and hierarchical clustering with two clusters: 0.0370) is lower than between (original data and hierarchical clustering with three clusters: 0.3147). Next, (original data and autoencoder with two clusters: 0.0793) is lower than between (original data and autoencoder with three clusters 0.4094). Last, (original data and SOM with three clusters: 0.0950) are higher than between (original data and SOM with four clusters: 0.0359). These results are also illustrated in Figure 10.
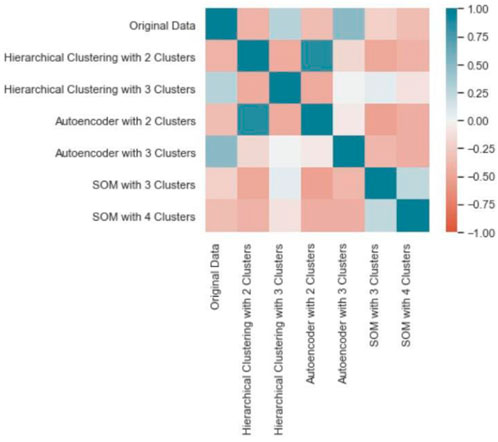
FIGURE 10. Adjusted rand index for all clusters.
Based on the observed samples (water polluted area) and features (water quality parameters), we would expect our algorithms to be equivalent with the original data. Comparing these algorithms with different numbers of clusters with the original data, our results are contradicted with the silhouette analysis’ results. Water polluted area samples in hierarchical clustering with three clusters, autoencoder with three clusters, and SOM with three clusters are more similar with the water polluted area samples from the original data.
Determining the optimal cluster number is always a difficult part, especially for a dataset with different types of parameters. In addition, estimating the potential optimal cluster number for the analyzed dataset is a fundamental issue in clustering algorithms. Therefore, to double-confirm the best clusters for each method (based on our ARI results), the elbow method is used. The elbow method (part of the silhouette analysis) can determine the number of clusters in a data set. This method consists of plotting the explained variation as a function of the number of clusters and picking the elbow of the curve as the number of clusters to use. Based on the subplot of elbow in Figure 11, we know that the estimated potential optimal cluster number obtained by the elbow method for each algorithm is three, which is consistent with the real cluster number from the original data and in line with the ARI results for all the algorithms. Figure 11 suggests that the optimal number of clusters for the Terengganu River dataset is three for each clustering algorithm. This result seems in line with that of the original Terengganu River dataset that suggested three different clusters for polluted areas, which are clean, slightly polluted, and polluted.
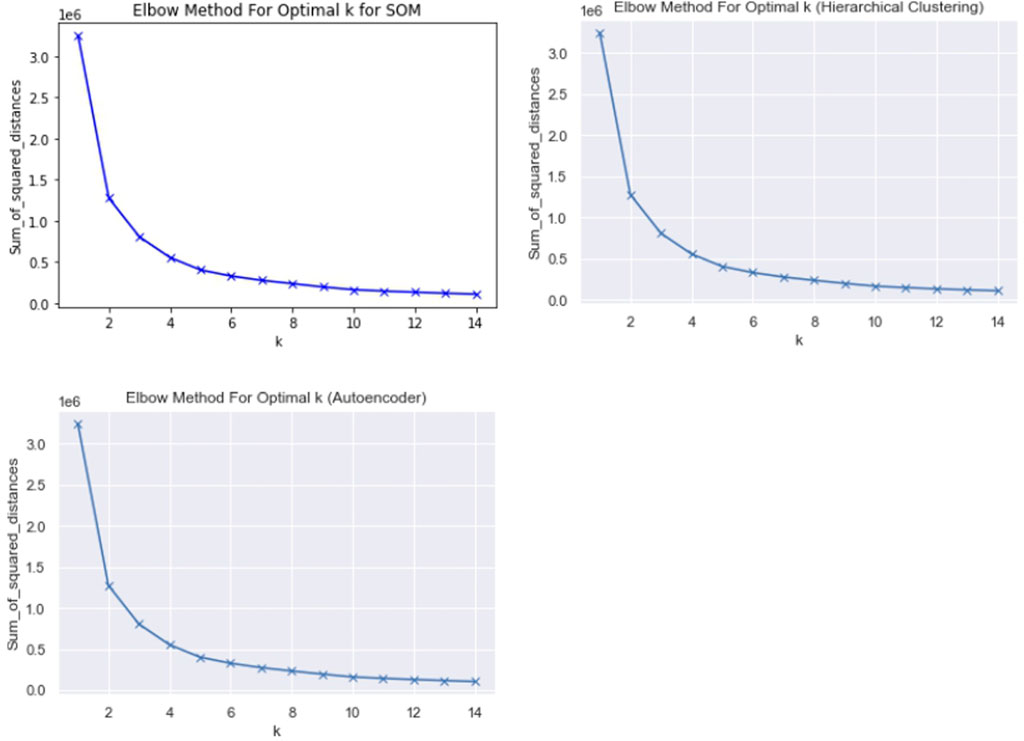
FIGURE 11. Optimal k using Elbow method.
Last, the proportion of samples with the final presence of summary water polluted area identification is plotted in Figure 12. It shows that the original data are of 303 water samples in cluster 1, 101 water samples in cluster 2, and 11 water samples in cluster 3. Hierarchical clustering has 236 water samples in cluster 1, 174 water samples in cluster 2, and four water samples in cluster 3. The autoencoder has 356 water samples in cluster 1, 56 water samples in cluster 2, and four water samples in cluster 3. Last, SOM has 152 water samples for cluster 1, 147 water samples for cluster 2, and 116 water samples for cluster 3. Thus, cluster 1 can be stated as clean, cluster 2 as slightly polluted, and cluster 3 as polluted.
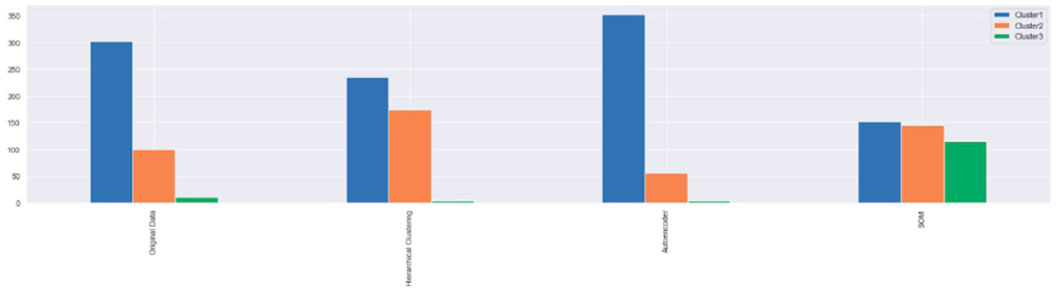
FIGURE 12. Proportion for each samples in each algorithms.
Therefore, these three ML algorithms (hierarchical clustering, autoencoder, and SOM) can become the alternative algorithms to offer extensions to further solve decision-making problems. Previous studies on MCDM usually focused on the analysis of various available choices in certain situations or research areas to find the most preferred alternatives (our target or objectives) and present them in ranking order. This paper offers further investigation on the MCDM problems with the integrated ML techniques.
The main objective of this study is to develop an intelligent model for finding the best strategies for water security. The intelligent model includes integrating the IT2FVIKOR method with ML algorithms. IT2FVIKOR can capture different preferences among DMs and multiple strategies for decision problems. However, IT2FVIKOR itself only focuses on ranking and selecting from a set of alternatives only. Due to that, unsupervised ML was introduced to further analyze and solve the decision problems. This paper presented a two-phase fuzzy-ML–based framework, where in phase 1, we carried out experiments on solving the water security problems in Malaysia using IT2FVIKOR to evaluate six different strategies to find the best ways to enhance water supply security in Malaysia toward the five main criteria. It was found that strengthening the protection of water source areas is the best strategy for water security, reinforcing groundwater monitoring and protection in the second place, developing a water-saving system in the third place, and fully implementing the river chief system in the fourth place. Improving infrastructure to safeguard urban and rural water security was ranked last. Further steps after retrieving the ranking and selecting the best alternatives were continued in the second phase.
Phase 2 continued with the unsupervised ML, where three different clustering algorithms, namely, hierarchical clustering, SOM, and autoencoder, were used to cluster the polluted area in the Terengganu River. Silhouette analysis was applied along with the clustering algorithms to estimate the number of optimal clusters in a dataset. Silhouette analysis suggested two clusters for polluted areas with hierarchical clustering with 0.5349, four clusters for polluted areas with SOM with 0.3971, and two clusters for polluted areas with autoencoder with 0.8578. Then, the ARI was applied to find the best comparison within original data with hierarchical clustering, SOM, and autoencoder. The ARI scores show that (original data and hierarchical clustering with two clusters: 0.0370) was lower than between (original data and hierarchical clustering with three clusters: 0.3147). Next, (original data and autoencoder with two clusters: 0.0793) was lower than between (original data and autoencoder with three clusters 0.4094). Last, (original data and SOM with three clusters: 0.0950) were higher than between (original data and SOM with four clusters: 0.0359). Based on the observed samples (water polluted area) and features (water quality parameters), we would expect our algorithms to be equivalent with the original data. Comparing these algorithms with different numbers of clusters with the original data, our results contradicted the silhouette analysis’ results.
Thus, the elbow method was applied to double-confirm the best clusters for each clustering algorithm. The elbow method suggested that water-polluted area samples in hierarchical clustering with three clusters, autoencoder with three clusters, and SOM with three clusters were more similar to the water-polluted area samples from the original data. This result seems in line with that of the original Terengganu River dataset that suggested three different clusters for polluted areas which were clean, slightly polluted, and polluted. Last, lists of polluted areas in each cluster were retrieved. It shows that the original data are of 303 water samples in cluster 1, 101 water samples in cluster 2, and 11 water samples in cluster 3. Hierarchical clustering has 236 water samples in cluster 1, 174 water samples in cluster 2, and four water samples in cluster 3. Autoencoder has 356 water samples in cluster 1, 56 water samples in cluster 2, and four water samples in cluster 3. Last, SOM has 152 water samples for cluster 1, 147 water samples for cluster 2, and 116 water samples for cluster 3. It can be concluded that cluster 1 can be stated as clean, cluster 2 as slightly polluted, and cluster 3 as polluted. Finally, the two-phase fuzzy-ML-based framework can be concluded as the best water security strategies to be applied to the most polluted area. We can also conclude that integrated IT2FVIKOR with unsupervised ML offers a new alternative to solving decision-making problems. For future work, we aim to integrate steps in IT2FVIKOR with ML to reach higher levels of uncertainty in the decision-making system. In addition, we also aim to integrate steps in IT2FVIKOR with ML using a large group of DM opinions. Moreover, it is suggested that it might be possible to closely look into different unsupervised ML techniques, develop a better technique that can retrieve better clustering, retrieve the best number of optimal clusters, reduce the noise or unnecessary data, and later improve the generalizability of the model.
The raw data supporting the conclusions of this article will be made available by the authors, upon reasonable request.
NZ was the grant leader, who designed and conducted the study. WA and MP collected and analyzed data. SA conducted the study and reviewed the analysis. MG reviewed the programming and analysis. All authors were involved in writing and reviewing the paper and had final approval of the submitted and published versions.
This study was funded by the Malaysian Ministry of Higher Education (FRGS-RACER: RACER/1/2019/STG06/UNISZA//).
The authors would like to extend gratitude to the Department of Environment, Malaysia, for the permission to conduct this study. The authors appreciate and especially thank the experts from the Department of Environment, Malaysia, for their valuable contribution to this study. The authors also thank the Ministry of Higher Education (MOHE) of Malaysia for supporting this research FRGS-RACER: RACER/1/2019/STG06/UNISZA//).
The authors declare that the research was conducted in the absence of any commercial or financial relationships that could be construed as a potential conflict of interest.
All claims expressed in this article are solely those of the authors and do not necessarily represent those of their affiliated organizations, or those of the publisher, the editors, and the reviewers. Any product that may be evaluated in this article, or claim that may be made by its manufacturer, is not guaranteed or endorsed by the publisher.
Ahmed, M. F., Vanajakshi, L., and Suriyanarayanan, R. (2019). Real-time traffic congestion information from tweets using supervised and unsupervised machine learning techniques. Transp. Dev. Econ. 5, 20. doi:10.1007/s40890-019-0088-2
Alazemi, F. K. A. O. H., Ariffin, M. K. A. M., Mustapha, F., and Supeni, E. E. (2022). A new Fuzzy TOPSIS-Based Machine Learning framework for minimizing completion time in supply chains. Int. J. Fuzzy Syst.
Castro-Pardo, M. D., Martínez, P. F., and Zabaleta, A. P. (2022). An initial assessment of water security in Europe using a DEA approach. Sustain. Technol. Entrepreneursh. 1, 100002. doi:10.1016/j.stae.2022.100002
Chapagain, K., Aboelnga, H. T., Babel, M. S., Ribbe, L., Shinde, V. R., Sharma, D., et al. (2022). Urban water security: A comparative assessment and policy analysis of five cities in diverse developing countries of asia. Environ. Dev. 43, 100713. doi:10.1016/j.envdev.2022.100713
Cohen, J. (1960). A coefficient of agreement for nominal scales. Educ. Psychol. Meas. 20 (1), 37–46. doi:10.1177/001316446002000104
Delgado, P. (2019). Development of a deep learning based attack detection system for smart grids. Polytechnic De Madrid.
Demerdash, D. E., Omar, M. E. D., El-Din, M. N., El-Badry, H., Aly, E., and El-Molla, D. A. (2022). Development of a quality-based irrigation water security index. Ain Shams Eng. J. 13, 101735. doi:10.1016/j.asej.2022.101735
Dong, Q., Chen, X., Dong, S., and Zhang, J. (2021). Classification of pavement climatic regions through unsupervised and supervised machine learnings. J. Infrastruct. Preserv. Resil. 2 (5), 5–15. doi:10.1186/s43065-021-00020-7
El Bouchefry, K., and de Souza, R. S. (2020). “Chapter 12 - learning in big data: Introduction to machine learning,” in Knowledge discovery in big data from astronomy and Earth observation. Editors P. Skoda, ˇ, and F. Adam (Elsevier), 225.
Evengard, B., Berner, J., Brubaker, M., Mulvard, G., and Revich, B. (2011). Climate change and water security with a focus on the Arctic. Glob. Health Action 4, 8449–8454. doi:10.3402/gha.v4i0.8449
Fetanat, A., Tayebi, M., and Mofid, H. (2021). Water-energy-food security nexus based selection of energy recovery from wastewater treatment technologies: An extended decision making framework under intuitionistic fuzzy environment. Sustain. Energy Technol. Assessments 43, 100937. doi:10.1016/j.seta.2020.100937
Gates, A. J., and Ahn, Y-Y. (2017). The impact of random models on clustering similarity. J. Mach. Learn. Res.
Gul, M., Mete, S., Serin, F., and Celik, E. (2021). “Fine–kinney-based occupational risk assessment using interval type-2 fuzzy VIKOR,” in Fine–kinney-based fuzzy multi-criteria occupational risk assessment (Cham: Studies in Fuzziness and Soft Computing Springer), Vol. 398.
Han, S., Wang, W., and Liu, X. (2021). A new type-2 fuzzy multi-criteria hybrid method for rail transit operation safety assessment. Appl. Soft Comput. 113, 107927. Part A. doi:10.1016/j.asoc.2021.107927
Hoffmann, M. (2005). Numerical control of Kohonen neural network for scattered data approximation. Numer. Algor. 39, 175–186. doi:10.1007/s11075-004-3628-7
Hubert, L., and Arabic, P. (1985). Comparing partitions. J. Classif. 2, 193–218. doi:10.1007/bf01908075
Hunter, J. D. (2007). Matplotlib: A 2D graphics environment. Comput. Sci. Eng. 9 (3), 90–95. doi:10.1109/mcse.2007.55
Jain, A. (2010). Data clustering: 50 years beyond K-means. Pattern Recognit. Lett. 31, 651–666. doi:10.1016/j.patrec.2009.09.011
Jain, N., Tomar, A., and Jana, P. K. (2021). A novel scheme for employee churn problem using multi-attribute decision making approach and machine learning. J. Intell. Inf. Syst. 56, 279–302. doi:10.1007/s10844-020-00614-9
Johnson, S. C. (1967). Hierarchical clustering schemes. Psychometrika 43 (1), 241–254. doi:10.1007/bf02289588
Jones, J. A. A., Vardianian, T. G., and Hakopian, C. (2009). Threats to global water security: Population growth, terrorism, climate change or communication. Netherlands: Springer.
Komer, B., Bergstra, J., and Eliasmith, C. (2014). “Hyperopt-sklearn: Automatic hyperparameter configuration for scikit-learn,” in Proceedings of the 13th Python in science conference (SCIPY), 33
Liu, S., Ouyang, H., and Peng, F. (2008). Spatial data mining and visualization based on self-organizing map. J. Commun. Comput. 5 (12), 55.
Mohsin, M., Ali, S. A., Shamim, S. K., and Ahmad, A. (2022). A GIS-based novel approach for suitable sanitary landfill site selection using integrated fuzzy analytic hierarchy process and machine learning algorithms. Environ. Sci. Pollut. Res. 29, 31511–31540. doi:10.1007/s11356-021-17961-x
Moradi, J., Ghorbanzad, Y., and Beig, M. (2002). Identifying and prioritizing innovation criteria of projects in science and technology parks using fuzzy VIKOR. Manag. Sci. Lett. 2 (2), 587
Namany, S., Govindan, R., Martino, M. D., Pistikopoulos, E. N., Linke, P., Avraamidou, S., et al. (2021). An energy-water-food nexus-based decision-making framework to guide national priorities in Qatar. Sustain. Cities Soc. 75, 103342. doi:10.1016/j.scs.2021.103342
Nie, R-x., Tian, Z-p., Wang, J-q., Zhang, H-y., and Wang, T-l. (2018). Water security sustainability evaluation: Applying a multistage decision support framework in industrial region. J. Clean. Prod. 196, 1681–1704. doi:10.1016/j.jclepro.2018.06.144
Nilashi, M., Mardani, A., Liao, H., Ahmadi, H., Manaf, A. A., and Almukadi, W. (2019). A hybrid method with TOPSIS and machine learning techniques for sustainable development of green hotels considering online reviews. Sustainability 11, 6013. doi:10.3390/su11216013
Onda, K., LoBuglio, J., and Bartram, J. (2012). Global access to safe water: Accounting for water quality and the resulting impact on MDG progress. Int. J. Environ. Res. Public Health 9, 880–894. doi:10.3390/ijerph9030880
Pedregosa, F., Varoquaux, G., Gramfort, A., Michel, V., Thirion, B., Grisel, O., et al. (2011). Scikit-learn: Machine learning in python. J. Mach. Learn. Res. 12, 2825
Qin, J., and Liu, X. (2019). “An integrated interval type-2 fuzzy decision making based on VIKOR and prospect theory,” in Type-2 fuzzy decision-making theories, methodologies and applications. Uncertainty and operations research (Singapore: Springer).
Qin, J., Liu, X., and Pedrycz, W. (2015). An extended VIKOR method based on prospect theory for multiple attribute decision making under interval type-2 fuzzy environment. Knowledge-Based Syst. 86, 116–130. doi:10.1016/j.knosys.2015.05.025
Richard, A. J., and Dean, W. W. (2002). Applied multivariate statistical analysis. London: Prenticee Hall, 265.
Rousseeuw, P. J. (1987). Silhouettes: A graphical aid to the interpretation and validation of cluster analysis. J. Comput. Appl. Math. 20, 53–65. doi:10.1016/0377-0427(87)90125-7
Shen, K-Y., and Tzeng, G-H. (2016). Contextual improvement planning by fuzzy-rough machine learning: A novel bipolar approach for business analytics. Int. J. Fuzzy Syst. 18 (6), 940–955. doi:10.1007/s40815-016-0215-8
Silberer, C., and Lapata, M. (2014). Learning grounded meaning representations with autoencoders, 721.
Soner, O., Celik, E., and Akyuz, E. (2017). Application of AHP and VIKOR methods under interval type 2 fuzzy environment in maritime transportation. Ocean. Eng. 129, 107–116. doi:10.1016/j.oceaneng.2016.11.010
Steinley, D. (2004). Properties of the hubert-arable adjusted Rand index. Psychol. Methods 9 (3), 386–396. doi:10.1037/1082-989x.9.3.386
Tewari, A., Zollhofer, M., Kim, H., Garrido, P., Bernard, F., and Perez, P. (2017). “Mofa: Model-based deep convolutional face autoencoder for unsupervised monocular reconstruction,” in Proceedings of the IEEE international conference on computer vision workshops, 1274.
Tu, Y., Wang, H., Zhou, X., Shen, W., and Lev, B. (2021). Comprehensive evaluation of security, equity, and efficiency on regional water resources coordination using a hybrid multi-criteria decision-making method with different hesitant fuzzy linguistic term sets. J. Clean. Prod. 310, 127447. doi:10.1016/j.jclepro.2021.127447
Umar, A., and Saraswat, R. N. (2022). Decision-making in machine learning using novel picture fuzzy divergence measure. Neural Comput. Applic. 34 (34), 457–475. doi:10.1007/s00521-021-06353-4
Veettil, A. V., Mishra, A. K., and Green, T. R. (2022). Explaining water security indicators using hydrologic and agricultural systems models. J. Hydrology 607, 127463. doi:10.1016/j.jhydrol.2022.127463
Vesanto, J., and Alhoniemi, E. (2000). Clustering of the self-organizing map. IEEE Trans. Neural Netw. 11, 586–600. doi:10.1109/72.846731
Vörösmarty, C. J., McIntyre, P. B., Gessner, M. O., Dudgeon, D., Prusevich, A., Green, P., et al. (2010). Global threats to human water security and river biodiversity. Nature 467, 555–561. doi:10.1038/nature09440
Wan, S. P., Chen, Z-H., and Dong, J-Y. (2021). An integrated interval type-2 fuzzy technique for democratic–autocratic multi-criteria decision making. Knowledge-Based Syst. 214, 106735. doi:10.1016/j.knosys.2020.106735
Wang, H., Pan, X., and He, S. (2019). A new interval type-2 fuzzy VIKOR method for multi-attribute decision making. Int. J. Fuzzy Syst. 21 (1), 145–156. doi:10.1007/s40815-018-0527-y
Ward, J. H. (1963). Hierarchical grouping to optimize an objective function. J. Am. Stat. Assoc. 58 (301), 236–244. doi:10.1080/01621459.1963.10500845
Warrens, M. J. (2008). On the equivalence of Cohen’s kappa and the Hubert-Arabie adjusted Rand index. J. Classif. 25 (2), 177–183. doi:10.1007/s00357-008-9023-7
Wongravee, K., Ishigaki, M., and Ozaki, Y. (2020). “Chemometrics as a green analytical tool,” in Challenges in green analytical chemistry, 277
Wu, Q., Zhoua, L., Chena, Y., Chena, Y., and Chen, H. (2019). An integrated approach to green supplier selection based on the interval type-2 fuzzy best-worst and extended VIKOR methods. Inf. Sci. 502, 394–417. doi:10.1016/j.ins.2019.06.049
Yazici, I., Beyca, O. F., Gurcan, O. F., Zaim, H., Delen, D., and Zaim, S. (2022). A comparative analysis of machine learning techniques and fuzzy analytic hierarchy process to determine the tacit knowledge criteria. Ann. Oper. Res. 308, 753–776. doi:10.1007/s10479-020-03697-3
Zhao, F., Feng, J., Zhao, J., Yang, W., and Yan, S. (2017). Robust lstm-autoencoders for face de-occlusion in the wild. IEEE Trans. Image Process. 27 (2), 778–790. doi:10.1109/tip.2017.2771408
Zhu, Y., Ting, K. M., Jin, Y., and Angelova, M. (2022). Hierarchical clustering that takes advantage of both density-peak and density-connectivity. Inf. Syst. 103, 101871. doi:10.1016/j.is.2021.101871
Keywords: water security, water pollution, IT2FVIKOR, hierarchical clustering, autoencoder, self-organizing map
Citation: Zamri N, Azman WNAW, Pairan MA, Abas SS and Gao M (2023) An analysis of finding the best strategies of water security for water source areas using an integrated IT2FVIKOR with machine learning. Front. Environ. Sci. 10:971129. doi: 10.3389/fenvs.2022.971129
Received: 16 June 2022; Accepted: 09 November 2022;
Published: 06 January 2023.
Edited by:
Shiping Wen, University of Technology Sydney, AustraliaReviewed by:
Anlu Zhang, Huazhong Agricultural University, ChinaCopyright © 2023 Zamri, Azman, Pairan, Abas and Gao. This is an open-access article distributed under the terms of the Creative Commons Attribution License (CC BY). The use, distribution or reproduction in other forums is permitted, provided the original author(s) and the copyright owner(s) are credited and that the original publication in this journal is cited, in accordance with accepted academic practice. No use, distribution or reproduction is permitted which does not comply with these terms.
*Correspondence: Nurnadiah Zamri, bmFkaWFoemFtcmlAdW5pc3phLmVkdS5teQ==
Disclaimer: All claims expressed in this article are solely those of the authors and do not necessarily represent those of their affiliated organizations, or those of the publisher, the editors and the reviewers. Any product that may be evaluated in this article or claim that may be made by its manufacturer is not guaranteed or endorsed by the publisher.
Research integrity at Frontiers
Learn more about the work of our research integrity team to safeguard the quality of each article we publish.