 Han Hu
 Zhanglu Tan1
 Ze Wang
94% of researchers rate our articles as excellent or good
Learn more about the work of our research integrity team to safeguard the quality of each article we publish.
Find out more
ORIGINAL RESEARCH article
Front. Environ. Sci., 13 October 2022
Sec. Atmosphere and Climate
Volume 10 - 2022 | https://doi.org/10.3389/fenvs.2022.970267
Cross-regional air pollutant spillovers aggravate air pollution in China. To mitigate air pollution, identifying and monitoring air pollution spreaders (APS) is a vital strategy that helps locate the source of air pollution and guides the Joint Prevention and Control of Air Pollution. In this paper, we define an APS as a city with a high spillover impact (CHSI) of air pollution and propose a transfer entropy network to investigate the APS from a multi-timescale analysis perspective. Taking the time series of PM2.5 concentration of 358 Chinese cities from 1 January 2015 to 31 December 2020 as the sample, they are decomposed into short, medium, and long timescales, corresponding to an average period of 12, 111, and 530 days, respectively. Then, we use transfer entropy networks to analyze APS’s spatial distribution and temporal variation patterns on each timescale. The results demonstrate that air pollution spillover widely exists in Chinese cities, and the short-term air pollution spillover dominates all spillovers. The CHSIs form large agglomeration areas in Central and East China on short and medium timescales, while the results of the undecomposed data show a more discrete distribution. In addition, the cities’ air pollution spillover impact is usually high in winter and spring and low in summer. Moreover, the spillover impacts of half of the cities have a lead-lag relationship between short and medium timescales. All results suggest that combining short-term controls and longer-term strategies helps China mitigate air pollution and develop sustainably.
Chinese cities have recently suffered from severe air pollution (Fan et al., 2021), which threatens human health and limits the cities’ sustainable development (Zhao et al., 2019). A city’s air pollution not only has local effects but can also spill to adjacent locations as it goes airborne, which is known as air pollution spillover (Li L. et al., 2017; Liao et al., 2020). In extreme cases, air pollutants transported from other cities may be more than generated locally in a city (Zeng et al., 2019). For example, in Beijing, approximately 55% of heavy haze pollution episodes in winter are caused by other cities’ pollution (Jiang et al., 2015). In the Ordos, about 77% of PM2.5 pollutant is transported long-range from other cities (Khuzestani et al., 2017). Besides China, cities in other countries also suffer from air pollution spillover, such as in Gothenburg, Sweden, regional transport contributes to 48% of PM2.5 levels (Molnár et al., 2017). Therefore, it is urgent to mitigate air pollutants spillover.
Identifying and managing the source cities of air pollutants is an effective strategy to mitigate air pollution spillover, which has received great concern. There are two typical streams of research. The first stream of research focuses on single air pollution event in specific areas (Hu et al., 2014; Fellini et al., 2019; Zhang H. et al., 2021). They identify the source cities of air pollutants by analyzing the transport process. However, the air pollution transport process is complex and variable and may be influenced by many unknown determinants with time-varying mechanisms (Li H. et al., 2019), making the case studies have limitations to be applied to guide air pollution management across regions. Therefore, conducting a more holistic and comprehensive analysis of air pollution spillover is essential. The second stream of research, investigating the intercity transport of air pollutants, partially solved this problem by tracking air masses’ trajectory or the pollutants’ chemical composition (Sun et al., 2017). For example, Hu et al. (2014) used the HYSPLIT model to detect air pollution sources in two regions in China, the North China Plain and the Yangtze River Delta. Other researchers used regional chemical models to simulate air pollutant transport in the Beijing-Tianjin-Hebei region (Chang et al., 2018) and Nanjing (Zhang H. et al., 2021) and located the air pollution sources. Such studies can accurately capture the complex physical and chemical processes of air pollutants transformation; however, they may cost tremendous computation resources, leading to limitations in long periods and globalized areas analysis (Chen and Taylor, 2018). Therefore, it is necessary to analyze the air pollution spillover using a flexible method. To fill these two gaps, this paper introduces the complex network theory and the sliding window method to analyze air pollution spillover and its time-varying feature to find the source cities of air pollutants in the whole region of China.
The complex network theory has recently been widely adopted to study inter-regional air pollution spillovers (Zhang D. et al., 2020; Yu et al., 2021; Zhang Q. et al., 2021). From the complex network perspective, the cities are regarded as nodes, and the air pollutant spillovers between cities are regarded as edges; thus, the cities in the whole region of China can be linked to form a network capturing the direct and indirect interaction of air pollutants comprehensively (Carmona-Cabezas et al., 2019). Building the network provides a convenient way to study the possible paths of air pollutant spillovers (Wang et al., 2021). For example, Du et al. (2021) analyzed the network’s average distance and density to unveil the pattern of the air pollution transport process in Northeast China. More importantly, analyzing the network’s topological properties helps to quantify the influence of air pollution spillover. Defining a city with a high spillover impact (CHSI) of air pollution as an air pollution spreader (APS), it can be regarded as the source city of air pollutants (Wang et al., 2020; Ying et al., 2022). Wang et al. (2021) used PageRank to identify key cities in terms of both air pollution outputs and inputs. Carmona-Cabezas et al. (2019) described tropospheric O3 dynamics using the degree centrality and the betweenness centrality. These studies provide effective and flexible methods for identifying air pollution spreaders. However, there are still recurrent air pollution events outbreaks (Li Z. et al., 2017; Wu et al., 2021). This motivates us to provide a deeper analysis of the air pollution spreaders from a multi-timescale perspective.
To study the air pollution spreaders, most of the related research relies on air pollutants’ concentration data. Such data contain rich information on various time-frequency because air pollution’s determinants are complex (Liu et al., 2017). Specifically, the seasonal effects of natural conditions such as wind and inverse temperature can determine the seasonal fluctuations in air pollutant concentrations (Wu et al., 2021). Industrial and population activity can influence the long-term trend of pollutant concentrations (Liu et al., 2017; Wu et al., 2021). Moreover, Feng et al. (2020) found that long-term factors determine the PM10 concentration levels, and short-term factors determine the differences in pollution concentration from one location to another. It can be seen that air pollution spillover may have distinct features on a multi-timescale; only exploring air pollution spillover using the original data may miss valuable information (Wei and Meng, 2018). Recently, this issue has been receiving increasing attention. For example, Li H. et al. (2019) explored air pollution spillovers in the Beijing-Tianjin-Hebei region from a multi-timescale perspective, providing management recommendations on different timescales. However, identifying the air pollution spreaders from a multi-timescale perspective is less studied. Therefore, this paper investigates the air pollution spreaders in the whole region of China from a multi-timescale perspective by conjointly using the complex network theory and the sliding window method. This helps comprehensively analyze the source cities of air pollutants and helps make targeted prevention to improve sustainable development.
In this study, we use the daily PM2.5 time series of 358 Chinese cities from 2015 to 2020 for analysis since PM2.5 is a primary air pollutant in China (Zhang M. et al., 2020; Zhu et al., 2020). We first decompose the original PM2.5 time series into different timescales; then build networks for each timescale by investigating air pollution spillovers among the time series to identify the air pollution spreaders. Specifically, to decompose the original PM2.5 time series, we use the Complete Ensemble Empirical Mode Decomposition with the Adaptive Noise (CEEMDAN) method (Torres et al., 2011). It is an accurate decomposition algorithm based on the famous Empirical Mode Decomposition (EMD) method (Huang et al., 1998). CEEMDAN solves the pattern mixing problem of EMD to get better decomposition results and is proven to work in analyzing air pollutants (Jiang et al., 2021; Rahimpour et al., 2021). Moreover, it does not have to preset any parameter and can adaptively decompose the PM2.5 time series compared with other methods such as Wavelet Decomposition (WD) (Liu et al., 2020), Variational Mode Decomposition (VMD) (Liu et al., 2018), Seasonal-trend Decomposition Procedure Based on Loess (STL) (Jin et al., 2019), etc. Then, to investigate air pollution spillovers among the time series, we use the transfer entropy method (Schreiber, 2000). It is an information theory-based method that flexibly deals with the asymmetric and nonlinear dependencies between time series without requiring strict assumptions and model parameter estimation (Barnett and Bossomaier, 2012; Dimpfl and Peter, 2019), compared to the traditional statistical and econometric methods such as the Bayesian model (Zhu et al., 2016), the Granger causality test (Zheng et al., 2018; Zhang D. et al., 2020), and the GARCH model (Yu et al., 2021). Recently, the transfer entropy method has been applied to the air pollutant dataset and is verified to be feasible and has enormous potential to quantify the direction and extent of PM2.5 spillovers between cities (He and Luo, 2020; Zhai et al., 2020; Seong, 2021; Zhang Q. et al., 2021).
In summary, the motivation of this paper is to provide a holistic and comprehensive analysis of the source cities of air pollutants in a flexible way from a multi-timescale perspective. This paper investigates the agglomeration characteristics and time-varying patterns of air pollution spillover on different timescales and identifies the air pollution spreaders as the source cities of air pollutants, which helps make targeted management strategies from different timescales to achieve environmental-economic sustainable development. The main contributions of this study are as follows. 1) We identified the most significant source cities of air pollutants across China that worsen regional air quality on multiple timescales. Compared with other literature, we comprehensively analyze the causes of their formation and their main driving factors on multiple timescales. 2) We found spatial clustering characteristics and time-varying patterns of APS on multiple timescales, which helps develop a sustainable multi-regional management strategy. 3) The multi-timescale analytical framework we proposed can be used in other air emissions, and we provide the most effective network-based indicators for identifying the APS at a city level on different timescales.
This paper takes 358 cities in China as the sample. They belong to 31 of 34 provincial-level administrative regions in China, which cover the vast majority of the country. We classify the 358 cities by geographic location and provincial administrative district, and their correspondence is listed in Supplementary Table S1 of Supplementary Appendix 1. To help understand, we draw a color map of the 358 cities according to their average PM2.5 concentrations from 2015 to 2020, as shown in Figure 1. In Figure 1, many Chinese cities have shown severe air pollution problems in recent years. Due to their large geographical span, these cities possess vastly different geographical and climatic characteristics, which motivates us to study the spatial variation of their air pollution spillover using a flexible method from a multi-timescale perspective.
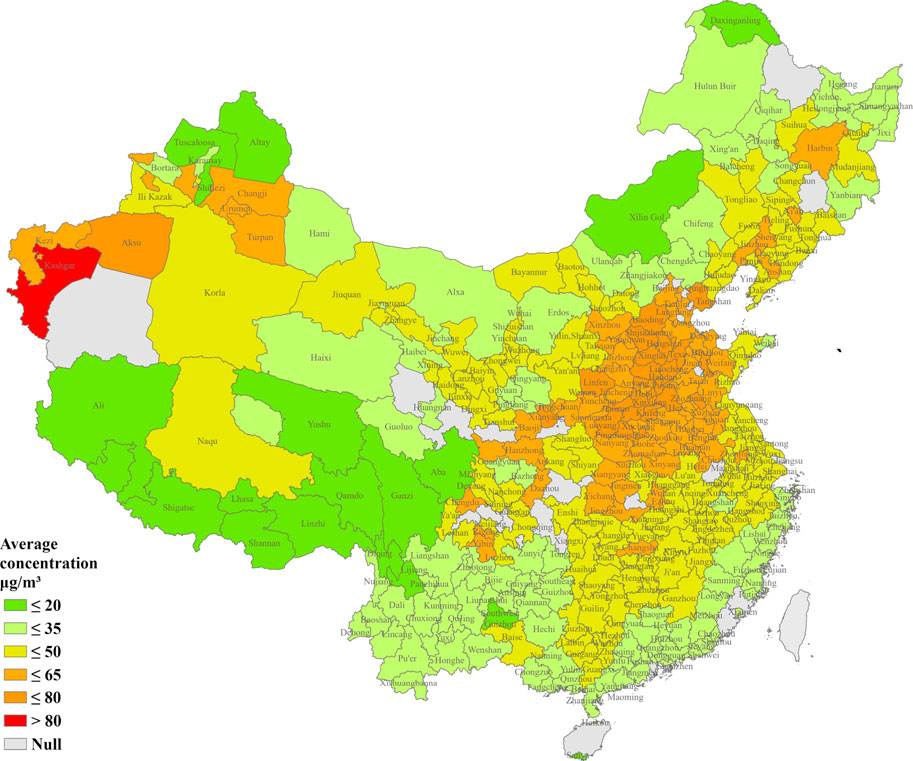
FIGURE 1. The study area. The 358 cities are colored according to their average PM2.5 concentrations from 2015 to 2020, as shown in the legend. The gray areas are the cities that do not include in our research.
This study uses the daily PM2.5 data for 358 municipalities, prefectures, and counties (hereafter referred to as cities) in China from 1 January 2015 to 31 December 2020 (in a total of 2192 days). The data are open access ground monitoring data from the National Urban Air Quality Real-Time Release Platform of the China Environmental Monitoring Station.
Furthermore, we analyzed other determinants of air pollution to test the validity of the research. The determinants are from two aspects, i.e., socio-economic characteristics and natural factors. For the socio-economic characteristics, we selected the number of industrial enterprises (NIE), the highway freight volume (HFV), and the population density (PD). In terms of natural factors, we selected the relief degree of the land surface (RDLS) and the area of administrative area (AAR). The NIE, HFV, PD, and AAR data are annual statistics from 2015 to 2019, collected from the Statistical Yearbook of Chinese Cities and published by the Chinese government. The data of the RDLS was derived from the study of Feng et al. (2007).
CEEMDAN (complete ensemble empirical mode decomposition with adaptive noise) method, developed by Torres et al. (2011), is an adaptive decomposition method. It avoids both the mode mixing of EMD and the residual white noise of EEMD. Given a time series
(a) An adaptive white noise data is added to
(b)
(c) The adaptive white noise sequence is added again to the remaining component
(d) The remaining component is loop processed as in step (c) until it can no longer be decomposed further by the EMD method. Eventually,
The sample entropy (SE) developed by Richman and Moorman (2000) can quantify the complexity of a time series. The larger the SE, the higher the complexity and frequency of the time series, which can help us classify IMFs. The simplified formula for SE is as follows.
where
The transfer entropy (TE) method developed by Schreiber (2000) can flexibly and effectively quantify the air pollution spillover between two cities. Furthermore, to avoid spurious correlations caused by finite samples effect (Kantz and Schürmann, 1996), we calculate the effective transfer entropy (ETE) (Marschinski and Kantz, 2002) based on TE method. TE and ETE are introduced as follows.
In Eq. 8,
Based on the TE method, the ETE method shuffles the time series
The complex network method can draw the overall picture of air pollution spillovers between all cities. The cities are regarded as nodes, denoted as set
Furthermore, network indicators can characterize the importance of cities in the SNAP. For a complete comparison, seven network indicators were selected to quantify the influence of cities in SNAP from different aspects. Among the seven indicators, five static centrality indicators capture PM2.5 spillovers between cities. They are out-degree (OD), weighted out-degree (WOD), betweenness centrality (BC), closeness centrality (CLN), and cluster coefficient (CC). Besides, two recursive centrality indicators consider the random walk process of PM2.5 spillovers. They are eigenvector centrality (EV) and PageRank (PR). Detailed descriptions and formulations of the indicators can refer to Supplementary Appendix 2 and the related studies (Li Y. et al., 2019; Wang et al., 2020).
We developed a multi-timescale analytical framework to identify the APS and explore their spatial distribution and evolution. The entirety of the process is divided into six steps. First, to distinguish local components with different frequencies, the original time series of PM2.5 is decomposed into different numbers of components adaptively by the CEEMDAN method. Second, to unify the timescales of every city, we cluster these components into three timescales, i.e., short-term, medium-term, and long-term, using the sample entropy and the K-means method. Third, to explore the evolution of APS, we use the sliding window approach to divide the complete time series on each timescale into multiple sample segments. Fourth, we use the effective transfer entropy to quantify the air pollution spillover between all cities, including the direction and extent of the spillovers. Fifth, to draw the overall picture of air pollution spillovers between cities in China, we use the complex network method to construct the spillover network of air pollution (SNAP) for all cities in every sliding window. Finally, we use seven network indicators to identify key cities in the SNAP, which are APSs. On this basis, we explore the spatial distribution and evolution of APS from various timescales. Detailed processes are listed in Supplementary Appendix 2.
Using the above approaches, we obtained 70 SNAPs on the short, medium, long, and original timescales (in a total of 280 networks). In this section, we first analyze the differences in the overall properties of SNAPs on different timescales. Then, we test the validity of the method and investigate the most effective indicator for identifying the air pollution spreader on each timescale. Finally, we empirically analyze the air pollution spreader from the spatial and temporal dimensions.
To perform the multi-timescale analysis, we decomposed the time series of PM2.5 concentration for every city into short-term, medium-term, and long-term components, corresponding to an average period of 12, 111, and 530 days, respectively. It should be noted that the “timescale” in this study represents the period of one fluctuation of the PM2.5 concentration but not the time PM2.5 takes to transfer from one city to another. Taking the PM2.5 concentration time series in Beijing as an example, its decomposition results are shown in Supplementary Appendix 3 (Supplementary Figure S3). We find that the short-term components usually cover relatively high concentrations of air pollutants over a short period, caused by severe local pollution incidents or a lot of air pollutants transferred from other regions. The medium-term components can reflect the seasonal fluctuation of PM2.5. The long-term components are the equilibrium trend of PM2.5, caused by driving factors with long-term influence, such as industrial structure and the population (Liu et al., 2017; Wu et al., 2021).
To understand the overall picture of air pollution spillover between all cities, we calculate four overall structural properties of every SNAP, i.e., node number, edge number, assortativity coefficient, and average distance. They reflect the overall situation of air pollution spillover in 358 Chinese cities from different aspects. Specifically, node number and edge number reflect the number of cities participating in the spillover network. The assortativity coefficient reflects the connection preferences between cities with different degrees. The average distance reflects the average length of transport routes of PM2.5 in the SNAP. The results are shown in Figure 2.
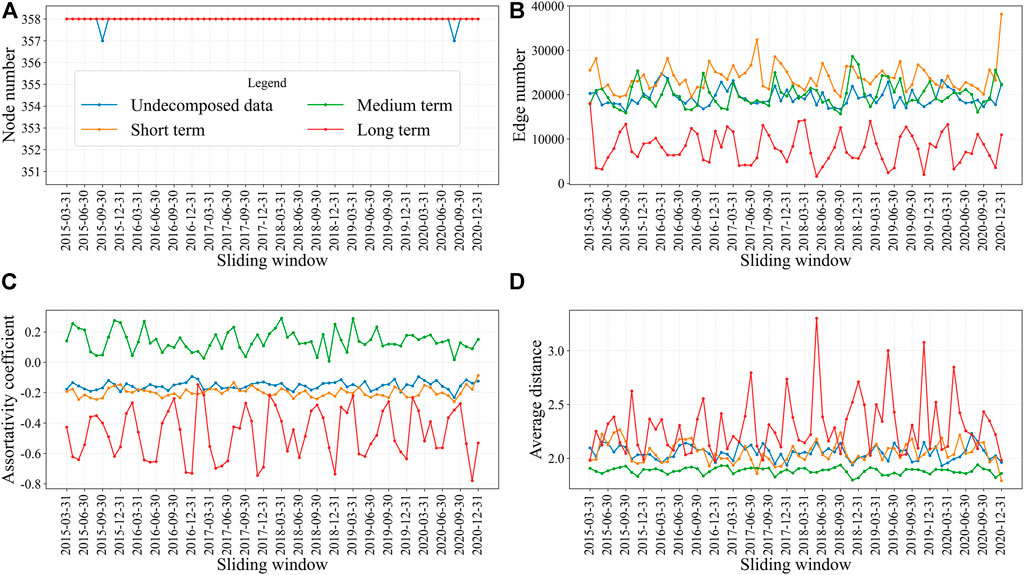
FIGURE 2. The overall properties of SNAPs on multiple timescales. Panels (A–D) represent the evolution of the node number, the edge number, the assortativity coefficient, and the average distance, respectively. In each panel, the X-axis represents the sliding window, and the Y-axis represents each indicator’s value. The four timescales, i.e., the undecomposed data, short-term, medium-term, and long-term, correspond to blue, yellow, green, and red lines, respectively.
The lines of the node number and the edge number show that there are almost no independent cities in any SNAP, which means inter-city PM2.5 spillovers exist nationwide and persistently (Li L. et al., 2017; Liao et al., 2020). Therefore, multi-regional collaborative management is a necessary way to optimize regional air quality. In addition, the overall situations of the spillovers vary significantly on different timescales. Specifically, the long-term SNAPs have a longer average distance and the least edges due to the diffusion of air pollutants attenuating with distance (Su et al., 2009). The short-term SNAPs have the most edges, which means the short-term air pollution spillover dominates all spillovers. This is because heavy air pollution can greatly promote the spillover of air pollutants, while heavy air pollution can only be maintained for a short period due to anthropogenic control and natural dissipation, so more spillovers can be observed on the short timescale rather than on other timescales. Besides, the short-term SNAPs have a shorter average distance (about two), which indicates that although there are more spillovers in the short timescale, the range of its influence is usually limited to about two cities due to the unsustainability of short-term heavy air pollution (Su et al., 2009). The negative assortativity indicates that many cities with a small spillover passively accept air pollutants transferred from cities with a high spillover. The different results on different timescales arise from the different time-frequency information, indicating the necessity of multi-timescale studies. Notably, the properties of the undecomposed data seem to be a mix of the results on the other three timescales, which is because the undecomposed time series of PM2.5 concentration contains rich but mixed information with different frequencies (Jin et al., 2020). Furthermore, the overall properties of SNAPs show an unstable periodicity. Therefore, it is necessary to further analyze the temporal variation pattern of the city’s air pollution spillover.
As found above, the SNAPs have different characteristics on different timescales. To accurately identify the source cities of air pollution across China, finding the most valid method of measuring the spillover impact of cities on different timescales is necessary. Previous studies have found that many natural and anthropogenic factors determine spillovers of air pollutants (Liu et al., 2017; Zhou et al., 2021). These driver factors can help verify whether the results derived from this study are relatively reasonable. Among them, we select six important factors as a proxy for reasonable criteria for judging which of the seven indicators introduced in Section 2.3.4 can efficiently measure the spillover impact of cities. A brief introduction of the six factors is given below.
Six determinants were selected from two aspects, i.e., socio-economic characteristics and natural factors. In terms of socio-economic characteristics, we selected the number of industrial enterprises (NIE), the highway freight volume (HFV), and the population density (PD) because industry (Zhang et al., 2013), traffic (Lang et al., 2021), and residential life (Zhu et al., 2019) are the three primary sources of air pollution. In terms of natural factors, we selected the relief degree of the land surface (RDLS) and the area of administrative area (AAR). The RDLS represents topographic features. The topography has an important influence on meteorological characteristics such as wind speed, temperature, and humidity in a region (Herfindahl and Kneese, 2015), and the air mass movement it modulates is an essential factor affecting the accumulation and diffusion of air pollutants (Zhao et al., 2018; Wang et al., 2019). The AAR reflects the absorption capacity of air pollutants in a region. A larger regional area reduces the likelihood that local air pollutants will spread to other regions (Su et al., 2009). Considering that the pollutant concentration levels also impact air pollution spillover, we also use the PM2.5 concentration as a criterion.
To test the validity of the seven network indicators, we conducted cross-sectional linear regression for seven network indicators and six determinants on each timescale to test the correlation. The correlations between PM2.5, RDLS, and network indicators were detected in each sliding window to get more accurate results. Since NIE, HFV, PD, and AAR data are annual, we test the correlation between these annual data and the annual mean value of seven network indicators. We calculated the mean correlation coefficient (MCC) and the mean absolute correlation coefficient (MACC) for all of these indicators in each cross-section to measure the performance of the network indicators. The more significant the MCC is, the more effective the method is. Moreover, the more significant both the MCC and MACC are, the more robust the method is. The test results are listed in a table with four panels, as shown in Table 1.
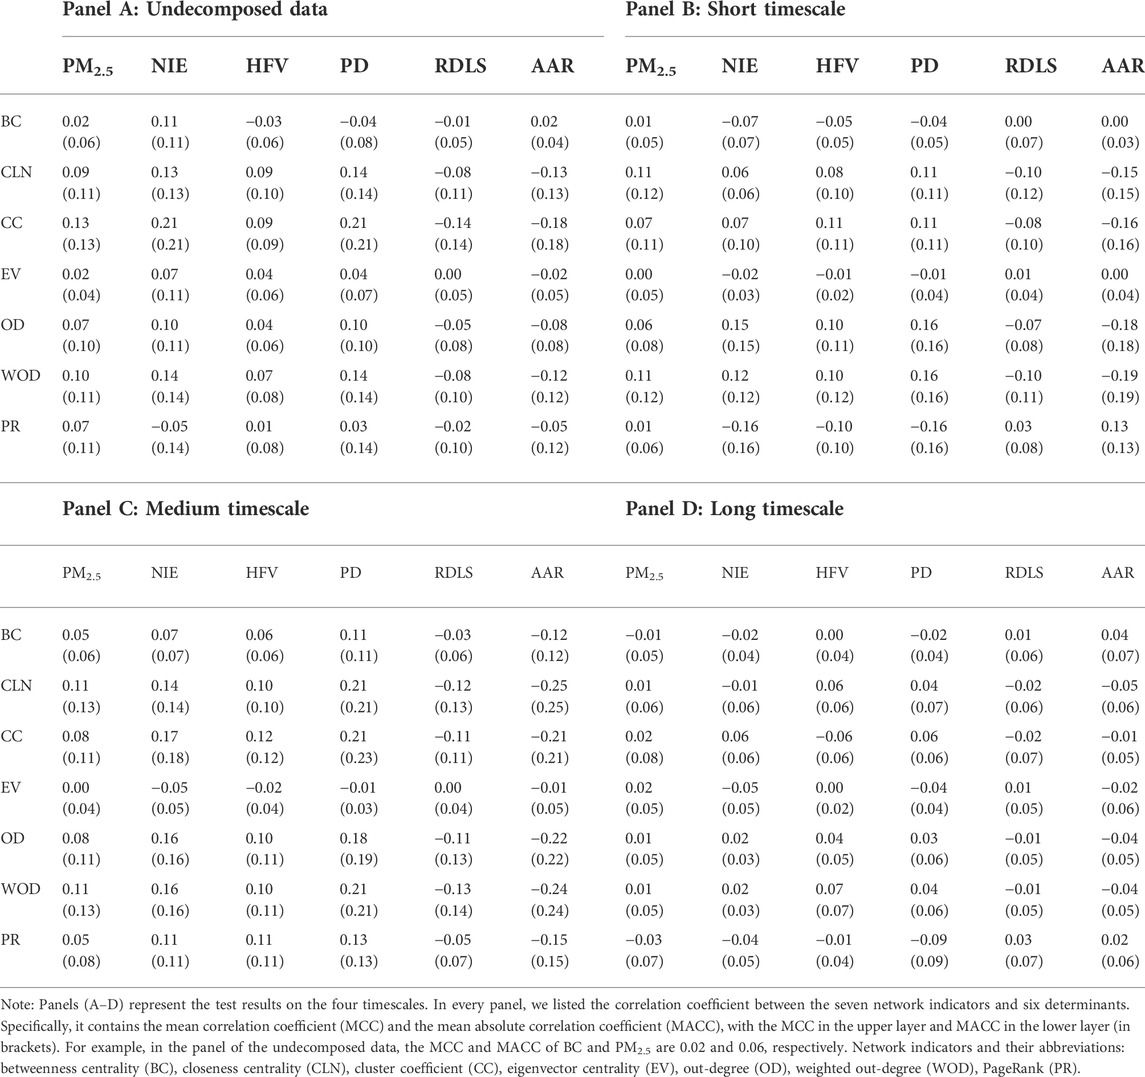
TABLE 1. Correlation coefficient matrix of network indicators and determinants on multiple timescales.
When judging the validity of the network indicators, we focus on the significant correlations in Table 1. The most effective network indicators for measuring the city’s spillover impact differ on different timescales. Specifically, the network indicators that correlate most with all determinants are CC, WOD, and WOD on the undecomposed-data timescale, short timescale, and medium timescale, respectively. Thus, we take them as the proxy for the city’s spillover impact. Unfortunately, there is no appropriate proxy on the long timescale because all the correlations between network indicators and determinants are too weak (less than 0.1).
One reason for the superior performance of CC and WOD is that they measure the local and direct influence of nodes in the network, which fits the fact that the diffusion of air pollutants attenuates with distance (Su et al., 2009). Moreover, the cities’ spillover impacts cannot be effectively reflected on the long timescale may be because the long-term components of pollutants concentration have slower fluctuations and smaller amplitudes, which indicates that they contain so little useful information that it is not easily detectable.
In addition, on any timescale, the cities’ spillover impacts were positively correlated with PM2.5, the number of industrial enterprises (NIE), the highway freight volume (HFV), and the population density (PD). In contrast, they were negatively correlated with the relief degree of the land surface (RDLS) and the area of administrative area (AAR). It means a high terrain and a large area of a region limit the spillover of air pollutants (Su et al., 2009; Zhao et al., 2018), while industry (Zhang et al., 2013), population (Zhu et al., 2019), and traffic (Lang et al., 2021) promote the spillover, which was in line with existing literature. Specifically, NIE and PD are the most important factors affecting the cities’ spillover impacts on the undecomposed-data timescale, which is consistent with the study of Zhu et al. (2019). On short and medium timescales, the most important factor determining a city’s spillover impact is AAR, followed by PD and NIE, and their correlations are more significant on the medium timescale than on the short timescale. It should be noted that because the purpose of this section is to verify the validity of the methodology in this study, we only selected several representative determinants related to the external influence of urban air pollution. Therefore, there may still be more important determinants that are not discussed here, and a detailed analysis of the drivers of air pollutants concentrations on different timescales will be carried out in future work.
In geospatial, locations with similar characteristics may occur in clusters, exhibiting spatial dependence. To analyze the spatial distribution characteristics of the APSs on multiple timescales, we plot the hotspot maps of all cities based on the proxies for cities’ spillover impacts (SI) according to Section 3.2, as shown in Figure 3.
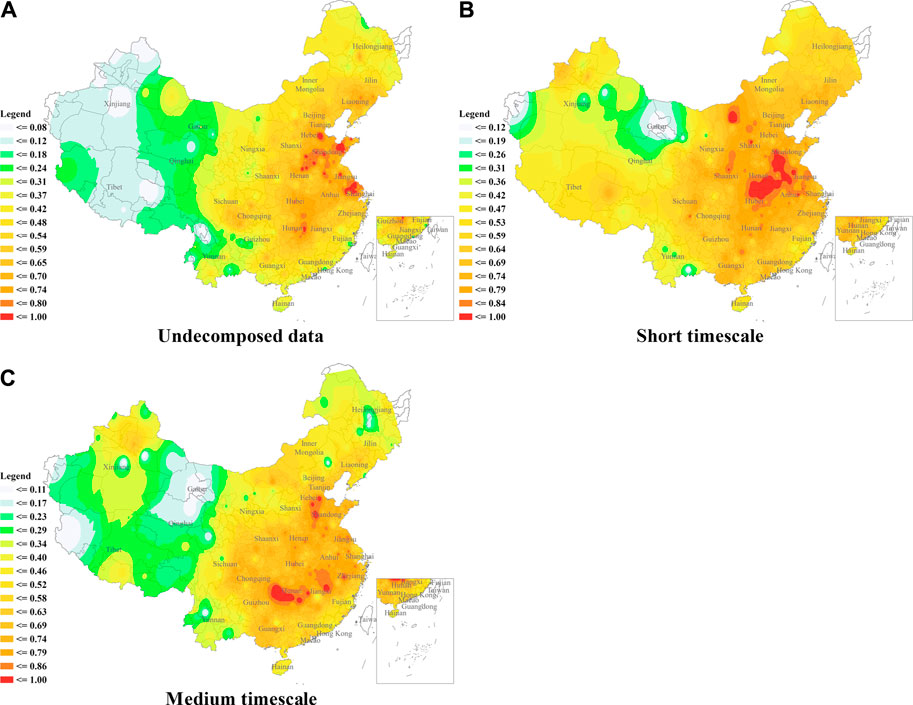
FIGURE 3. The hotspot maps of spillover impact (SI) of air pollution. All cities’ SIs on each timescale are drawn as a hotspot map. Panels (A–C) are the results of the undecomposed data, the short timescale, and the medium timescale, respectively, where we use CC, WOD, and WOD as proxies for SI values of cities, respectively. The value of each city is the average value of SI across all windows for the city. To better display the discrete point objects in the map, we apply an inverse distance weighting method to interpolate the SI values spatially. The values are normalized to a range of 0–1. We divide the SI values into 15 segments using the Jenks natural breaks classification method and set a different color for each segment, with regions having a large SI represented in red and a small SI in green.
In Figure 3, each red-shaded area can be regarded as an APS. They vary by timescale. Moreover, they have agglomeration characteristics, demonstrating spatial dependence for APSs. In other words, cities surrounding the APS may also have higher spillover impact, forming agglomerations of the APS. This is because the adjacent areas usually share similar industrial characteristics, geomorphology, and climates. The agglomerations of APSs differ on the three timescales, which are described in detail below.
The APSs identified on the undecomposed data cover many important cities in urban agglomerations, such as the Beijing-Tianjin-Hebei (BTH), the Central Plains (CP), the Shandong Peninsula (SP), the Yangtze River Delta (YRD), and the Middle Reaches of the Yangtze River (MRYR), the classification of the cities is listed in Supplementary Appendix 1. The top 10 cities with the greatest spillover impacts are Zhuzhou, Suzhou, Cangzhou, Jintan, Jiaozhou, Jiangyin, Nantong, Zhengzhou, Yantai, and Anyang. They are mainly in Jiangsu, Shandong, and Henan provinces. On the short timescale, the APSs are mainly in the CP and the Hohhot-Baotou-Ordos (HBO) urban agglomeration, and the top 10 cities with the greatest spillover impacts are Baotou, Jining, Zhumadian, Taiyuan, Xiangyang, Luohe, Wuhu, Suizhou, Suzhou, and Liaocheng. On the medium timescale, the APSs are mainly in the MRYR and BTH urban agglomerations, and the top 10 cities with the greatest spillover impacts are Xiangxi, Fuzhou, Liaocheng, Shaoyang, Huaihua, Cangzhou, Pingxiang, Hengyang, Quzhou, and Hengshui. They are mainly in Hunan province and adjacent areas of Hebei and Shandong.
The APSs show a discrete distribution on the undecomposed data and do not form large-scale agglomerations. In contrast, they show obvious urban agglomerations on short and medium timescales, indicating that the short and medium timescales can better reveal spatial dependencies, which can help find regions requiring the Joint Prevention and Control of Air Pollution (JPCAP). In addition, we find that almost all the APSs have high economic and industrial levels and large populations on any timescale, which is in line with the macroscopic laws between air pollution and economic activities (Yan et al., 2022).
On the one hand, cities with close economic ties are more likely to form agglomerations of APSs. On the other hand, the APSs agglomerations differ from the urban agglomerations divided by economic ties. Taking the BTH region as an example, Chengde and Zhangjiakou exchange less air pollution with other cities because of the Yanshan Mountains and Taihang Mountains, and thus they do not belong to the APS agglomeration. Therefore, to mitigate air pollution more effectively, the government should conduct the JPCAP based on the urban agglomerations formed by APSs rather than urban agglomerations divided by economic ties.
The changes (appearance and disappearance) of APS agglomerations on different timescales can reflect potential information, as illustrated by the following four points.
First, a few APSs show a scattered distribution around the CP urban agglomeration on the undecomposed and the medium timescale. However, many APSs appear and form particularly large-scale agglomerations around the CP urban agglomeration on the short timescale, which indicates serious air pollution spillovers exist within the area (Xiong et al., 2018). Therefore, governments involved in these agglomerations should pay more attention to preventing short-lived heavy pollution episodes, considering that it results from the short timescales.
Second, some of the cities in Inner Mongolia, Shaanxi, and Shanxi provinces were identified as APSs on the short timescale. It is because these areas are China’s main coal-producing regions and locations of heavy industry.
Third, it should be noted that cities surrounding Beijing and Shanghai have lower spillover impacts on the short timescale than the undecomposed data. Beijing (in BTH) and Shanghai (in YRD) are the two most important cities in China, and they are prior areas for the JPCAP set by the central government. This result confirms the positive effects of air pollution prevention and control in these cities on the short timescale. Regrettably, the air pollution spillovers in these cities are still serious on the medium timescale. It demonstrates that the JPCAP in these regions is in a “task-driven” collaborative mode, and the effect is unsustainable. Existing studies have also confirmed this (Wei and Meng, 2018). Therefore, in addition to short-term actions, longer-lasting solutions are also essential, such as reducing the proportion of heavy industry in the APS agglomerations and avoiding excessive population density by maintaining moderate urbanization. It should be reminded that the results are derived over a 6-year period overall, which does not mean that short-term air pollution spillovers will not occur in the above-mentioned areas. Therefore, it is necessary to maintain a timely control of heavy pollution episodes.
Fourth, many cities in Hunan province are identified as APSs on the medium timescale, such as Xiangxi, Huaihua, Shaoyang, and Hengyang, forming a large-scale aggregation. It is because cold air masses from the north are blocked by the mountains surrounding Hunan in winter (Dai et al., 2019), which leads to the accumulation of air pollutants, causing these cities to become APSs on the medium (about a season) timescale. Therefore, to reduce the cost of comprehensive air pollution management, the Hunan provincial government should adjust the spatial layout of their heavy industries within the province while minimizing the emission intensity of upwind cities in winter, according to the unique topographic and climatic characteristics in the area.
Although the air pollution transports are complex, we try to explore the frequent patterns of air pollutant spillover in this section. We plotted heatmaps of cities’ spillover impacts on three timescales, as shown in Figure 4.
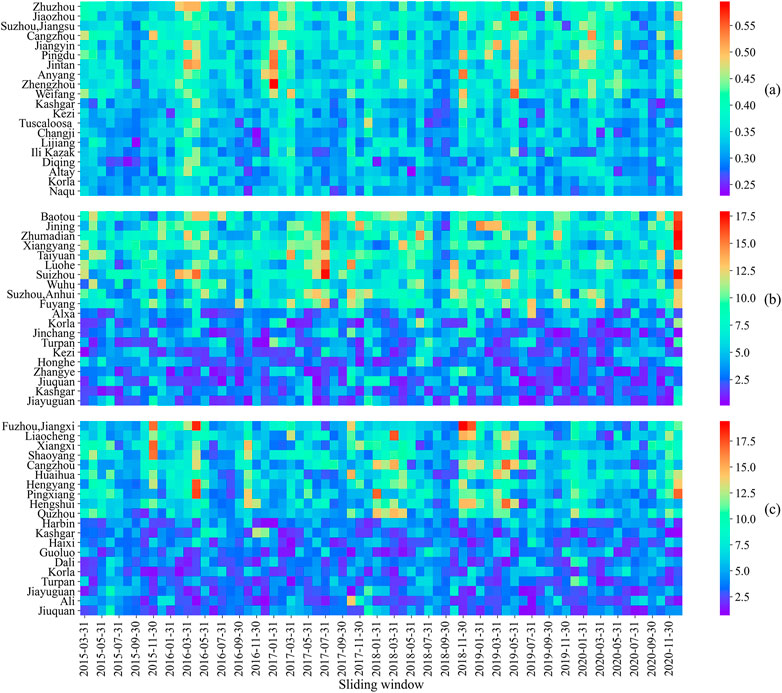
FIGURE 4. Heatmaps of cities’ spillover impacts. Panels (A–C) represent the results of the undecomposed data, the short term, and the medium term, respectively. The X-axis represents the sliding window, and the Y-axis is the city. Only 20 representative cities are presented in each panel, where the ten most influential cities are on the top half of each panel, and the ten least influential cities are on the bottom half of each panel. The full-size and high-resolution figure was placed in Appendix 4, and interested readers can zoom in for more details.
In every panel of Figure 4, the top half is redder, and the bottom half is bluer, indicating that the spillover impact varies by city because different cities have different pollution levels and natural conditions. Moreover, this contrast is pronounced at any time in the short term. Nevertheless, in the medium term, this contrast is more pronounced in winter and spring but weaker in summer. This may be because medium-term air pollution spillovers are more affected by seasons, while short-term spillovers are more affected by stochastic influences, such as air pollution outbreaks or sudden windy weather.
In addition, the temporal variation of air pollution spillover has a periodicity. Specifically, on the original timescale [in panel (a)], the air pollution spillover is more significant in winter and spring and weaker in summer, which is consistent with the pattern of PM2.5 concentrations (Wu et al., 2021), as the amount of air pollutants is fundamental for the air pollution spillover from a city to surrounding areas. However, in the short and medium term [in panels (b) and (c)], in contrast to cities with high spillover impact, the cities with low spillover impact do not show a pronounced periodicity. It may be because the cities with low spillover impact have lower air pollution levels; thus, fewer pollutants can be transported, and they can maintain few air pollution spillovers even if natural conditions such as meteorology change over time. In the short term, the periodicity of air pollution spillovers is not very stable and shows a high degree of stochasticity on the top half of panel (b). Especially in the summer of 2017, the top 10 CHSIs showed significant air pollution spillover because of the massive and intense dust and sand weather that occurred in Northwest and North China from May 3 to May 5. The strongest winds during the event reached 75 km/h. The winds swept up dust particles, causing heavy air pollution and transfer of air pollutants across regions, making the cities through which the winds passed highlighted in the heatmap corresponding to the short term. Similarly, in the medium term, some unstable periodicity is observed in the top half of the panel. The inter-city air pollution spillover is a complex system; therefore, the inter-city air pollution spillover contains chaotic features, which is one of the reasons for the unstable periodicity.
Furthermore, to understand the difference in the spillover impact on different timescales, we calculated the Kendall correlation coefficient of the city rankings between the short and medium timescales, and the result was 0.45. It indicates that the spillover impacts on the two timescales have similarities as well as large differences. To further detect the relationships between the two timescales, we examined the lead-lag relationship of spillover impacts on short and medium timescales for each city by using the Granger Causality. The results are shown in Figure 5.
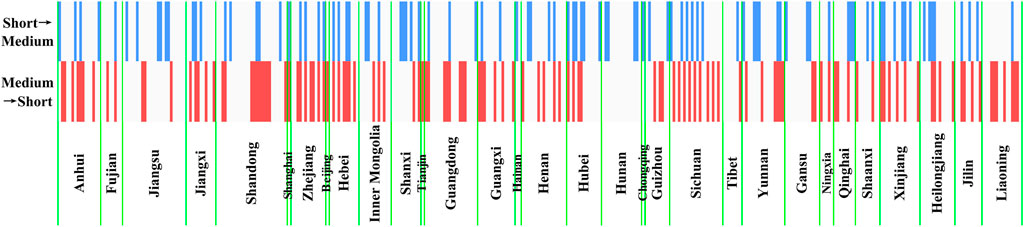
FIGURE 5. Lead-lag relationships in the Sis between the short and medium timescale for 358 Chinese cities in 31 provinces. The X-axis is the province where the city is located, and the Y-axis is the lead-lag relationship between the two timescales. Specifically, the top bar code represents that the short-term spillover impacts are ahead of the medium-term spillover impacts, and the bottom bar code represents that the medium-term spillover impacts are ahead of the short-term spillover impacts. A blue or red narrow bar is displayed if there is a lead-lag relationship, and a light gray narrow bar is displayed if there is no lead-lag relationship. The thick color bars are formed by the narrow bars of multiple cities next to each other. The green line is used to separate the cities of different provinces.
Figure 5 shows a lead-lag relationship between the spillover impacts on short and medium timescales for 180 cities (a total of 358 cities). They are relatively evenly distributed across all cities, and the medium-term spillover impact has more influence on the short-term spillover impact. It indicates that the medium-term spillover impacts may be the leading indicators of the short-term spillover impacts for some cities, which can help us identify potential problems. It can be explained by an example: a city’s air quality was good most of the time, and only 1-2 occasional air pollution spillovers occurred per month, which was not considered a problem from the short-term perspective. But from the medium-term perspective, air pollution spillover occurred monthly, which was a sign of hidden problems. In addition, the short-term spillover impacts are ahead of the medium-term spillover impacts for some of the cities, such as Shijiazhuang, which indicates that severe pollution outbreaks may frequently occur in these cities (Yao et al., 2021), and due to the lack of timely control, they form longer-term problems. In summary, these lead-lag relationships contribute to identifying the potential managerial problems of air pollution in the regions, which helps better prevent air pollution.
This study uses transfer entropy networks to analyze the air pollution spreaders in the whole of China over 6 years from a multi-timescale perspective. We identify the air pollution spreaders (APS) across China on different timescales and further analyze their spatial distribution and temporal variation patterns, which can assist the government in developing targeted short-term controls and longer-term strategies for multi-regional air pollution control. The main conclusions are as follows.
First, air pollution spillovers occur in almost all Chinese cities. Especially short-term air pollution spillovers dominate all spillovers. In addition, the medium-term spillovers are also significant, but the spillover is weak from the perspective of long-term fluctuations of air pollutant concentrations.
Second, the APSs identified are mainly in central and eastern China. Moreover, the cities with close economic ties are more likely to form agglomerations of APSs. However, it should be noted that the APS agglomerations differ from the urban agglomerations divided by economic ties. Specifically, the APSs are mainly in the CP urban agglomeration (on the short timescale) and the MRYR and BTH urban agglomerations (on the medium timescale). In contrast, the APSs on the undecomposed data were scattered in eastern and central China.
Third, the cities’ spillover impacts exhibit periodicity in the short and medium term, usually high in winter and spring and low in summer. These patterns are generally significant only for cities with high air pollution levels. More importantly, the spillover impacts of half of the 358 cities show a lead-lag relationship on the short and medium timescale. The effect of JPCAP is unsustainable for many regions. Although positive results from timely control have been confirmed in the short term, significant air pollution spillovers still occur frequently in the medium term.
Fourth, the best network indicator for identifying the APS in the complex network varies by the timescales. Specifically, the weighted out-degree is best on the short and medium timescales, the clustering coefficient suits the undecomposed data, and there is no suitable indicator on the long timescale.
According to the above results, this paper provides two main policy recommendations to assist the government in mitigating multi-regional air pollution more effectively. 1) Collaborative management across cities is necessary for improving regional air quality since air pollution spillovers occur in almost all Chinese cities. Moreover, the government should pay more attention to the urban agglomerations formed by the APSs rather than the urban agglomerations divided by economic ties because they do not exactly overlap. 2) Due to the short-term air pollution spillover dominating all spillovers and the results affirming the effectiveness of timely control in the short term, the timely control of heavy pollution episodes in source cities should be maintained by the government. In addition, adopting longer-term management strategies can help further prevent air pollution and meet air quality standards because medium-term spillovers still occur frequently.
Finally, although we obtained the results on different timescales, there are still many unknown mechanisms about them due to few related studies, and we expect to fill these gaps in future studies. In addition, the multi-timescale analytical framework we proposed can also apply to other diffusible atmospheric emissions (such as SO2, NOx, and CO2).
Publicly available datasets were analyzed in this study. This data can be found here: the National Urban Air Quality Real-Time Release Platform of the China Environmental Monitoring Station (https://air.cnemc.cn:18007/).
HH: Conceptualization, methodology, writing–original draft, writing–review and editing, software, visualization, validation, formal analysis, investigation, data curation. ZT: Funding acquisition, writing–review and editing, supervision. CL: Resources, supervision. ZW: Conceptualization, methodology, software, writing–review and editing. XC: Investigation, data curation. XW: Resources, data curation. ZY: Resources, data curation. SZ: Visualization, data curation.
National Natural Science Foundation of China under (Grant No. 61471362); China Postdoctoral Science Foundation (Grant No. 2020M680435).
The authors would like to thank the School of Management of China University of Mining and Technology (Beijing) and ZT for supporting this research project. Besides, the authors thank Zehong Hu for his valuable comments.
The authors declare that the research was conducted in the absence of any commercial or financial relationships that could be construed as a potential conflict of interest.
All claims expressed in this article are solely those of the authors and do not necessarily represent those of their affiliated organizations, or those of the publisher, the editors and the reviewers. Any product that may be evaluated in this article, or claim that may be made by its manufacturer, is not guaranteed or endorsed by the publisher.
The Supplementary Material for this article can be found online at: https://www.frontiersin.org/articles/10.3389/fenvs.2022.970267/full#supplementary-material
Barnett, L., and Bossomaier, T. (2012). Transfer entropy as a log-likelihood ratio. Phys. Rev. Lett. 109 (13), 138105. doi:10.1103/PhysRevLett.109.138105
Carmona-Cabezas, R., Gómez-Gómez, J., Ariza-Villaverde, A. B., de Ravé, E. G., and Jiménez-Hornero, F. J. (2019). Can complex networks describe the urban and rural tropospheric O3 dynamics? Chemosphere 230, 59–66. doi:10.1016/j.chemosphere.2019.05.057
Chang, X., Wang, S., Zhao, B., Cai, S., and Hao, J. (2018). Assessment of inter-city transport of particulate matter in the Beijing–Tianjin–Hebei region. Atmos. Chem. Phys. 18 (7), 4843–4858. doi:10.5194/acp-18-4843-2018
Chen, Q., and Taylor, D. (2018). Transboundary atmospheric pollution in southeast asia: Current methods, limitations and future developments. Crit. Rev. Environ. Sci. Technol. 48 (16-18), 997–1029. doi:10.1080/10643389.2018.1493337
Dai, C., Huang, S., Peng, H., Yi, K., Zhou, Y., and Qin, P. (2019). Particulate pollution status and its characteristics during 2015–2016 in Hunan, China. Atmos. Pollut. Res. 10 (3), 739–748. doi:10.1016/j.apr.2018.12.001
Dimpfl, T., and Peter, F. J. (2019). Group transfer entropy with an application to cryptocurrencies. Phys. A Stat. Mech. its Appl. 516, 543–551. doi:10.1016/j.physa.2018.10.048
Du, M., Liu, W., and Hao, Y. (2021). Spatial correlation of air pollution and its causes in Northeast China. Int. J. Environ. Res. Public Health 18 (20), 10619. doi:10.3390/ijerph182010619
Duan, J., Wang, P., Ma, W., Tian, X., Fang, S., Cheng, Y., et al. (2021). Short-term wind power forecasting using the hybrid model of improved variational mode decomposition and Correntropy Long Short-term memory neural network. Energy 214, 118980. doi:10.1016/j.energy.2020.118980
Fan, H., Zhao, C., Yang, Y., and Yang, X. (2021). Spatio-temporal variations of the PM2.5/PM10 ratios and its application to air pollution type classification in China. Front. Environ. Sci. 9, 692440. doi:10.3389/fenvs.2021.692440
Fellini, S., Salizzoni, P., Soulhac, L., and Ridolfi, L. (2019). Propagation of toxic substances in the urban atmosphere: A complex network perspective. Atmos. Environ. 198, 291–301. doi:10.1016/j.atmosenv.2018.10.062
Feng, X., Shen, J., Yang, H., Wang, K., Wang, Q., and Zhou, Z. (2020). Time–frequency analysis of particulate matter (PM10) concentration in dry bulk ports using the hilbert–huang transform. Int. J. Environ. Res. Public Health 17 (16), 5754. doi:10.3390/ijerph17165754
Feng, Z., Tang, Y., Yang, Y., and Zhang, D. (2007). The relief degree of land surface in China and its correlation with population distribution. Acta Geogr. Sin. 62 (10), 1073–1082. (in Chinese).
He, H., and Luo, F. (2020). Study of LSTM air quality index prediction based on forecasting timeliness IOP conference series: Earth and environmental science. IOP Conf. Ser. Earth Environ. Sci. 446 (3), 032113. doi:10.1088/1755-1315/446/3/032113
Herfindahl, O. C., and Kneese, A. V. (2015). Quality of the environment: An economic approach to some problems in using land, water, and air. London: Routledge.
Hlinka, J., Hartman, D., Vejmelka, M., Runge, J., Marwan, N., Kurths, J., et al. (2013). Reliability of inference of directed climate networks using conditional mutual information. Entropy 15 (6), 2023–2045. doi:10.3390/e15062023
Hu, J., Wang, Y., Ying, Q., and Zhang, H. (2014). Spatial and temporal variability of PM2.5 and PM10 over the north China Plain and the Yangtze River Delta, China. Atmos. Environ. 95, 598–609. doi:10.1016/j.atmosenv.2014.07.019
Huang, N. E., Shen, Z., Long, S. R., Wu, M. C., Shih, H. H., Zheng, Q., et al. (1998). The empirical mode decomposition and the Hilbert spectrum for nonlinear and non-stationary time series analysis. Proc. R. Soc. Lond. A 454, 903–995. doi:10.1098/rspa.1998.0193
Jiang, C., Wang, H., Zhao, T., Li, T., and Che, H. (2015). Modeling study of PM2.5 pollutant transport across cities in China's Jing–Jin–Ji region during a severe haze episode in December 2013. Atmos. Chem. Phys. 15 (10), 5803–5814. doi:10.5194/acp-15-5803-2015
Jiang, F., Zhang, C., Sun, S., and Sun, J. (2021). Forecasting hourly PM2.5 based on deep temporal convolutional neural network and decomposition method. Appl. Soft Comput. 113, 107988. doi:10.1016/j.asoc.2021.107988
Jin, X. B., Yang, N. X., Wang, X. Y., Bai, Y. T., Su, T. L., and Kong, J. L. (2020). Deep hybrid model based on EMD with classification by frequency characteristics for long-term air quality prediction. Mathematics 8 (2), 214. doi:10.3390/math8020214
Jin, X., Yang, N., Wang, X., Bai, Y., Su, T., and Kong, J. (2019). Integrated predictor based on decomposition mechanism for PM2.5 long-term prediction. Appl. Sci. 9 (21), 4533. doi:10.3390/app9214533
Kantz, H., and Schürmann, T. (1996). Enlarged scaling ranges for the KS‐entropy and the information dimension. Chaos. 6 (2), 167–171. doi:10.1063/1.166161
Khuzestani, R. B., Schauer, J. J., Wei, Y., Zhang, L., Cai, T., Zhang, Y., et al. (2017). Quantification of the sources of long-range transport of PM2.5 pollution in the Ordos region, Inner Mongolia, China. Environ. Pollut. 229, 1019–1031. doi:10.1016/j.envpol.2017.07.093
Lang, J., Liang, X., Li, S., Zhou, Y., Chen, D., Zhang, Y., et al. (2021). Understanding the impact of vehicular emissions on air pollution from the perspective of regional transport: A case study of the beijing-tianjin-hebei region in China. Sci. Total Environ. 785, 147304. doi:10.1016/j.scitotenv.2021.147304
Li, H., Qi, Y., Li, C., and Liu, X. (2019). Routes and clustering features of PM2.5 spillover within the Jing-Jin-Ji region at multiple timescales identified using complex network-based methods. J. Clean. Prod. 209, 1195–1205. doi:10.1016/j.jclepro.2018.10.284
Li, L., Liu, Y., and Wang, Y. (2017). Monitoring an air pollution episode in shenzhen by combining MODIS satellite images and the HYSPLIT model IOP conference series: Earth and environmental science. IOP Conf. Ser. Earth Environ. Sci. 74 (1), 012010. doi:10.1088/1755-1315/74/1/012010
Li, Y., Cai, W., Li, Y., and Du, X. (2019). Key node ranking in complex networks: A novel entropy and mutual information-based approach. Entropy 22 (1), 52. doi:10.3390/e22010052
Li, Z., Sun, Z., Shao, X., Liao, X., Zhang, X., Xiong, Y., et al. (2017). Using Morlet wavelet analysis to analyze multiple time scale periodically in PM2.5 in Beijing. China Environ. Sci. 37 (2), 407–415. (in Chinese).
Liao, S., Wang, D., Liang, Z., Xia, C., Guo, H., and Zhao, W. (2020). Spatial spillover effect and sources of city-level haze pollution in China: A case study of guangdong provinces. Pol. J. Environ. Stud. 29 (5), 3213–3223. doi:10.15244/pjoes/113466
Liu, H., Fang, C., Zhang, X., Wang, Z., Bao, C., and Li, F. (2017). The effect of natural and anthropogenic factors on haze pollution in Chinese cities: A spatial econometrics approach. J. Clean. Prod. 165, 323–333. doi:10.1016/j.jclepro.2017.07.127
Liu, H., Yin, S., Chen, C., and Duan, Z. (2020). Data multi-scale decomposition strategies for air pollution forecasting: A comprehensive review. J. Clean. Prod. 277, 124023. doi:10.1016/j.jclepro.2020.124023
Liu, T., Luo, Z., Huang, J., and Yan, S. (2018). A comparative study of four kinds of adaptive decomposition algorithms and their applications. Sensors 18 (7), 2120. doi:10.3390/s18072120
Marschinski, R., and Kantz, H. (2002). Analysing the information flow between financial time series. Eur. Phys. J. B 30 (2), 275–281. doi:10.1140/epjb/e2002-00379-2
Molnár, P., Tang, L., Sjöberg, K., and Wichmann, J. (2017). Long-range transport clusters and positive matrix factorization source apportionment for investigating transboundary PM2.5 in Gothenburg, Sweden. Environ. Sci. Process. Impacts 19 (10), 1270–1277. doi:10.1039/C7EM00122C
Rahimpour, A., Amanollahi, J., and Tzanis, C. G. (2021). Air quality data series estimation based on machine learning approaches for urban environments. Air Qual. Atmos. Health 14 (2), 191–201. doi:10.1007/s11869-020-00925-4
Richman, J. S., and Moorman, J. R. (2000). Physiological time-series analysis using approximate entropy and sample entropy. Am. J. Physiology-Heart Circulatory Physiology 278, H2039–H2049. doi:10.1152/ajpheart.2000.278.6.H2039
Schreiber, T. (2000). Measuring information transfer. Phys. Rev. Lett. 85 (2), 461–464. doi:10.1103/PhysRevLett.85.461
Seong, N. (2021). Deep spatiotemporal attention network for fine particle matter 2.5 concentration prediction with causality analysis. IEEE Access 9, 73230–73239. doi:10.1109/ACCESS.2021.3080828
Su, J. G., Jerrett, M., and Beckerman, B. (2009). A distance-decay variable selection strategy for land use regression modeling of ambient air pollution exposures. Sci. total Environ. 407 (12), 3890–3898. doi:10.1016/j.scitotenv.2009.01.061
Sun, J., Huang, L., Liao, H., Li, J., and Hu, J. (2017). Impacts of regional transport on particulate matter pollution in China: A review of methods and results. Curr. Pollut. Rep. 3 (3), 182–191. doi:10.1007/s40726-017-0065-5
Torres, M. E., Colominas, M. A., Schlotthauer, G., and Flandrin, P. (2011). “A complete ensemble empirical mode decomposition with adaptive noise,” in 2011 IEEE international conference on acoustics, speech and signal processing (ICASSP) (IEEE), 4144–4147. doi:10.1109/ICASSP.2011.5947265
Wang, X. C., Klemeš, J. J., Dong, X., Fan, W., Xu, Z., Wang, Y., et al. (2019). Air pollution terrain nexus: A review considering energy generation and consumption. Renew. Sustain. Energy Rev. 105, 71–85. doi:10.1016/j.rser.2019.01.049
Wang, X., Wang, Q., Duan, Y., and Huang, K. (2021). Complex network analysis of PM2.5 transport in the Yangtze river Delta region, China. Stoch. Environ. Res. Risk Assess. 35 (12), 2645–2658. doi:10.1007/s00477-021-02056-3
Wang, Z., Gao, X., An, H., Tang, R., and Sun, Q. (2020). Identifying influential energy stocks based on spillover network. Int. Rev. Financial Analysis 68, 101277. doi:10.1016/j.irfa.2018.11.004
Wei, N., and Meng, Q. G. (2018). Mechanism and institutional logic of cross-regional collaborative governance of air pollution—based on the cooperative practice of jing-jin-ji region. China Soft Sci. 10, 79–92. (in Chinese).
Wu, Q., and Lin, H. (2019). Daily urban air quality index forecasting based on variational mode decomposition, sample entropy and LSTM neural network. Sustain. Cities Soc. 50, 101657. doi:10.1016/j.scs.2019.101657
Wu, X., He, S., Guo, J., and Sun, W. (2021). A multi-scale periodic study of PM2.5 concentration in the Yangtze River Delta of China based on empirical mode decomposition-wavelet analysis. J. Clean. Prod. 281, 124853. doi:10.1016/j.jclepro.2020.124853
Xiong, L., De Jong, M., Wang, F., Cheng, B., and Yu, C. (2018). Spatial spillover effects of environmental pollution in China’s central plains urban agglomeration. Sustainability 10 (4), 994. doi:10.3390/su10040994
Yan, D., Ren, X., Zhang, W., Li, Y., and Miao, Y. (2022). Exploring the real contribution of socioeconomic variation to urban PM2.5 pollution: New evidence from spatial heteroscedasticity. Sci. Total Environ. 806, 150929. doi:10.1016/j.scitotenv.2021.150929
Yao, S., Zhang, H. Y., Wang, X. Q., and Yang, S. S. (2021). Air pollution characteristics and quantitative evaluation of multi-scale transport in the beijing-tianjin-hebei region in january, 2016. Environ. Sci. 42 (2), 534–545. doi:10.13227/j.hjkx.202006042
Ying, N., Duan, W., Zhao, Z., and Fan, J. (2022). Complex networks analysis of PM2.5: Transport and clustering. Earth Syst. Dyn. Discuss. 13, 1–18. doi:10.5194/esd-2022-9
Yu, B., Fang, W., Huang, S., Liu, S., Qi, Y., and Han, X. (2021). Spatial and seasonal characteristics of air pollution spillover in China. Sustainability 13 (21), 12272. doi:10.3390/su132112272
Zeng, M., Du, J., and Zhang, W. (2019). Spatial-temporal effects of PM2.5 on health burden: Evidence from China. Int. J. Environ. Res. Public Health 16 (23), 4695. doi:10.3390/ijerph16234695
Zhai, Y., Ding, X., Jin, X., and Zhao, L. (2020). Adaptive LSSVM based iterative prediction method for NOx concentration prediction in coal-fired power plant considering system delay. Appl. Soft Comput. 89, 106070. doi:10.1016/j.asoc.2020.106070
Zhang, D., Lu, Y., and Tian, Y. (2020). Spatial association effect of haze pollution in Cheng-Yu urban agglomeration. Sci. Rep. 10 (1), 9753. doi:10.1038/s41598-020-66665-8
Zhang, H., Tang, K., Feng, W., Yan, X., Liao, H., and Li, N. (2021). Impact of short-term emission control measures on air quality in nanjing during the Jiangsu development summit. Front. Environ. Sci. 9, 693513. doi:10.3389/fenvs.2021.693513
Zhang, M., Sun, X., and Wang, W. (2020). Study on the effect of environmental regulations and industrial structure on haze pollution in China from the dual perspective of independence and linkage. J. Clean. Prod. 256, 120748. doi:10.1016/j.jclepro.2020.120748
Zhang, Q., Zhu, Y., Xu, D., Yuan, J., Wang, Z., Li, Y., et al. (2021). Interaction of interregional O3 pollution using complex network analysis. PeerJ 9, e12095. doi:10.7717/peerj.12095
Zhang, R., Jing, J., Tao, J., Hsu, S. C., Wang, G., Cao, J., et al. (2013). Chemical characterization and source apportionment of PM2.5 in beijing: Seasonal perspective. Atmos. Chem. Phys. 13 (14), 7053–7074. doi:10.5194/acp-13-7053-2013
Zhao, B., Wang, S., Ding, D., Wu, W., Chang, X., Wang, J., et al. (2019). Nonlinear relationships between air pollutant emissions and PM2.5-related health impacts in the Beijing-Tianjin-Hebei region. Sci. Total Environ. 661, 375–385. doi:10.1016/j.scitotenv.2019.01.169
Zhao, S., Yu, Y., Yin, D., Qin, D., He, J., and Dong, L. (2018). Spatial patterns and temporal variations of six criteria air pollutants during 2015 to 2017 in the city clusters of Sichuan Basin, China. Sci. total Environ. 624, 540–557. doi:10.1016/j.scitotenv.2017.12.172
Zheng, Z., Xu, G., Yang, Y., Wang, Y., and Li, Q. (2018). Statistical characteristics and the urban spillover effect of haze pollution in the circum-Beijing region. Atmos. Pollut. Res. 9 (6), 1062–1071. doi:10.1016/j.apr.2018.04.004
Zhou, H., Jiang, M., Huang, Y., and Wang, Q. (2021). Directional spatial spillover effects and driving factors of haze pollution in North China Plain. Resour. Conservation Recycl. 169, 105475. doi:10.1016/j.resconrec.2021.105475
Zhu, B. Z., Jiang, M. X., Zhang, S. F., and Jin, Y. (2020). Resource and environment economic complex system: Models and applications. Beijing: Science Press.
Zhu, J. Y., Zheng, Y., Yi, X., and Li, V. O. (2016). “A Gaussian Bayesian model to identify spatio-temporal causalities for air pollution based on urban big data,” in 2016 IEEE Conference on Computer Communications Workshops (INFOCOM WKSHPS) (IEEE), 3–8. doi:10.1109/INFCOMW.2016.7562036
Keywords: air pollution spillover, multi-timescale analysis, CEEMDAN, effective transfer entropy, complex network
Citation: Hu H, Tan Z, Liu C, Wang Z, Cai X, Wang X, Ye Z and Zheng S (2022) Multi-timescale analysis of air pollution spreaders in Chinese cities based on a transfer entropy network. Front. Environ. Sci. 10:970267. doi: 10.3389/fenvs.2022.970267
Received: 15 June 2022; Accepted: 29 September 2022;
Published: 13 October 2022.
Edited by:
Bin Zhao, Tsinghua University, ChinaCopyright © 2022 Hu, Tan, Liu, Wang, Cai, Wang, Ye and Zheng. This is an open-access article distributed under the terms of the Creative Commons Attribution License (CC BY). The use, distribution or reproduction in other forums is permitted, provided the original author(s) and the copyright owner(s) are credited and that the original publication in this journal is cited, in accordance with accepted academic practice. No use, distribution or reproduction is permitted which does not comply with these terms.
*Correspondence: Ze Wang, emFjaF93YW5nQGJudS5lZHUuY24=
Disclaimer: All claims expressed in this article are solely those of the authors and do not necessarily represent those of their affiliated organizations, or those of the publisher, the editors and the reviewers. Any product that may be evaluated in this article or claim that may be made by its manufacturer is not guaranteed or endorsed by the publisher.
Research integrity at Frontiers
Learn more about the work of our research integrity team to safeguard the quality of each article we publish.