 Yang Wang
 Siyue Li
 Xiang Tan
 Quanfa Zhang
94% of researchers rate our articles as excellent or good
Learn more about the work of our research integrity team to safeguard the quality of each article we publish.
Find out more
ORIGINAL RESEARCH article
Front. Environ. Sci., 20 September 2022
Sec. Conservation and Restoration Ecology
Volume 10 - 2022 | https://doi.org/10.3389/fenvs.2022.969980
This article is part of the Research TopicBiodiversity Conservation and Ecological Function Restoration in Freshwater EcosystemsView all 16 articles
Land use and seasonal changes in environmental conditions influence biological communities and their trophic interactions in riverine ecosystems. However, how land use and the seasonality of environmental conditions jointly influence the food web structure of riverine ecosystems remains unclear. Here, we conducted a comparative study on basal resources, macroinvertebrates, and fish at woodland and urban sites to explore the combined effects of land use and environmental conditions during spring, autumn, and winter on the food web structure of a subtropical river in China. We used δ13C and δ15N to trace consumers’ diets and calculate community-level metrics within food webs. At woodland sites, we found that allochthonous sources contributed significantly more to consumers’ diets in the high flow season (53%) than in the low flow season (around 30%), but allochthonous sources contributed less than 30% at urban sites. The seasonal flooding facilitated the acquisition of terrestrial sources at woodland sites, while the impervious surface cover at urban sites cut off the influx of terrestrial inputs. The isotopic niche space of basal resources at both woodland and urban sites was significantly higher in the high flow season. However, the isotopic niche space of consumers at urban sites was not significantly different between seasons. Trophic length, niche width, and trophic redundancy showed no seasonal differences at urban sites, but trophic length increased significantly during the high flow season at woodland sites. Our temporal food web study at urban and woodland rivers illustrated the combined effects of land use and seasonal environmental conditions on the food web structure, and highlighted the role of allochthonous carbon in supporting biological communities and the importance of lateral and longitudinal connectivity in river ecosystems.
Food web structure within aquatic food webs is a composite of the enormous diversity of species and their trophic interactions (Belgrano et al., 2005), during which energy flow and nutrient cycling occurs. Changes in food web structure can often reflect the alterations in structure and function within natural river ecosystems (Thompson et al., 2012; Fitzgerald et al., 2017; Fugère et al., 2018). Riverine ecosystems have a high level of spatial and temporal heterogeneity with interactive pathways along four dimensions: longitudinal, lateral, vertical, and temporal (Ward, 1989). Thus, riverine ecosystems are subject to numerous environmental alterations (Allan, 2004; Roach and Winemiller, 2015; Brett et al., 2017). A better understanding of how environmental changes affect the energy flows and trophic interactions is essential in aquatic science and has implications for the sustainable management of riverine ecosystems (Wilson et al., 2016; Brett et al., 2017). Stable isotopes have been widely used to estimate community-level metrics, such as isotopic niche, niche width, trophic diversity, and trophic redundancy (Layman et al., 2007; Newsome et al., 2007; Abrantes et al., 2014; Rader et al., 2017). These metrics can provide us with an overview of food web structure properties over a relatively long period (Layman et al., 2012; Jabot et al., 2017), which reflects the response of food web structure when facing environmental changes (Alp and Cucherousset, 2022).
Land uses are major threats to biological communities, as has been observed by their effects on food web structures (Foley Jonathan et al., 2005; Cazzolla Gatti, 2016; Reid et al., 2019). For example, Hette-Tronquart et al. (2018) investigated community-level metrics at sites with contrasting land uses in the Seine River in France and found that urbanization at the local scale affected fish community composition. Price et al. (2019) found that in Zagreb (Croatia), macroinvertebrates in urbanized streams had lower trophic redundancy than counterparts in woodland and agricultural streams. Wang et al. (2021) suggested that food web structure alterations in subtropical streams in the Han River should be attributed to the availability of basal resources across land uses. Among the different land uses, urbanization is the prevalent land use type throughout the world (Paul and Meyer, 2001; Booth et al., 2016). The structure and function of riverine ecosystems can be profoundly influenced by urbanization, even when the urban area is a low percentage of total catchment area. Urbanization effects on riverine ecosystems can be physical (e.g., increased impervious surface cover or decreased shading), chemical (e.g., increased sewage water discharge or other contaminants inputs), and biological (e.g., altered primary production or species diversity) (Paul and Meyer, 2001; Valle Junior et al., 2015). For example, the impervious surface cover can increase water discharge and surface runoff, resulting in increased nutrient inputs and turbidity, thereby degrading water quality in the river channel and decreasing the diversity of aquatic organisms (Paul and Meyer, 2001; Allan, 2004). Additionally, riparian deforestation due to urbanization can reduce the shaded area of the river surface and increase water temperature, which further affects the primary production of river ecosystems, leaf decomposition in the riparian zone, the life history of aquatic consumers (Allan, 2004), and ultimately alters the food web structure within riverine ecosystems (Calizza et al., 2012; Parreira de Castro et al., 2016; El-Sabaawi, 2018; Jackson et al., 2020).
The seasonality in environmental conditions also plays a vital role in influencing the food web structure in riverine ecosystems because there are differences in abiotic (e.g., temperature, precipitation, and light) and biotic (e.g., migration, growth, and reproduction) factors in the different seasons (Jardine et al., 2012a; McMeans et al., 2015; Fernandes and McMeans, 2019; Gibert, 2019). Among those factors, hydrological regimes (e.g., precipitation) can regulate the water discharge among the seasons in river ecosystems (McMeans et al., 2015). The flood pulse concept (FPC) suggests that, in river ecosystems, when the water level increases in the high-flow season, consumers will have more access to terrestrial nutrients in the aquatic and terrestrial transition zone through lateral connectivity (Junk et al., 1989; Jardine et al., 2012a). Thus, the water discharge among the seasons can alter the amount and sources of nutrients available to consumers, and thus change the relative importance of carbon sources that support consumer growth and diversity in rivers (Jardine et al., 2012b; Pease et al., 2020). This change can ultimately alter the food web structure in riverine ecosystems due to the availability of basal resources (Wang et al., 2021). For example, Roach and Winemiller (2015) found that algae contributed more to macroinvertebrates and fish biomass following low-flow periods, and terrestrial plants contributed more following high-flow pulses. Zheng et al. (2018) suggested that allochthonous carbon had an advantage over autochthonous carbon in supporting aquatic food webs in the Irtysh River because allochthonous carbon can subsidize aquatic invertebrates specialized in terrestrial carbon sources and fish consumers during the frozen period.
Recently, the effects of land use on food web structure in rivers have been studied (Hette-Tronquart et al., 2018; Price et al., 2019; Wang et al., 2021). However, there is one critical limitation to these studies in that they failed to recognize the temporal dimension of riverine ecosystems with only a one-time sampling “snapshot” of food web dynamics (McMeans et al., 2015; Hette-Tronquart et al., 2018; Price et al., 2019; Wang et al., 2021). For example, samples were taken only once in July and August in the Orge River (Hette-Tronquart et al., 2018), in early April and May in the Zagreb region of Croatia (Price et al., 2019), and in June in the Han River of China (Wang et al., 2021). Even though several studies have assessed the impact of the seasonality of environmental conditions on the trophic diversity and the relative importance of carbon sources that support fish assemblages in rivers (Jardine et al., 2012b; Pease et al., 2020; Bokhutlo et al., 2021), these studies did not take land use into account. To our knowledge, how land use and seasonality jointly influence the food web structure of riverine ecosystems remains unclear.
Given previous studies on the response of food web structure to either land use or seasonality in river ecosystems, we hypothesized that the impact of urbanization on the food web structure would be exacerbated by the different seasonal hydrological regimes as follows: 1) terrestrial inputs in urbanized rivers would dramatically increase and contribute much more to consumers’ diets during the high flow season than aquatic sources; 2) increased terrestrial inputs in urbanized rivers would significantly expand the niche space (or trophic diversity) of basal resources and aquatic consumers; 3) autochthonous sources in urbanized rivers would dominate again when terrestrial inputs decreased during the low flow season. We aimed to shed light on how riverine food webs are structured in spatial and temporal dimensions under changes in environmental conditions.
Laoguan River (E110°17′-111°50′ and N32°55′-34°01′) (Figure 1) is a tributary of the Dan River, which drains into the Yangtze River. The drainage area has a subtropical monsoon climate. The average annual precipitation is approximately 830 mm, and much of the precipitation occurs from July to October (the high flow season) (Li et al., 2017; Yuan et al., 2017). The average annual temperature is approximately 15°C, with a maximum of 31°C in summer and a minimum of −5°C in winter. The river stretch is more than 150 km with an area of around 2,000 km2. The river channel can be as wide as 30 m with numerous rapids and deep pools. The river network covers a gradient of human disturbances as the river flows from mountainous regions that are less affected by human activities to two counties with nearly 1 million residents (Xixia and Xichuan County).
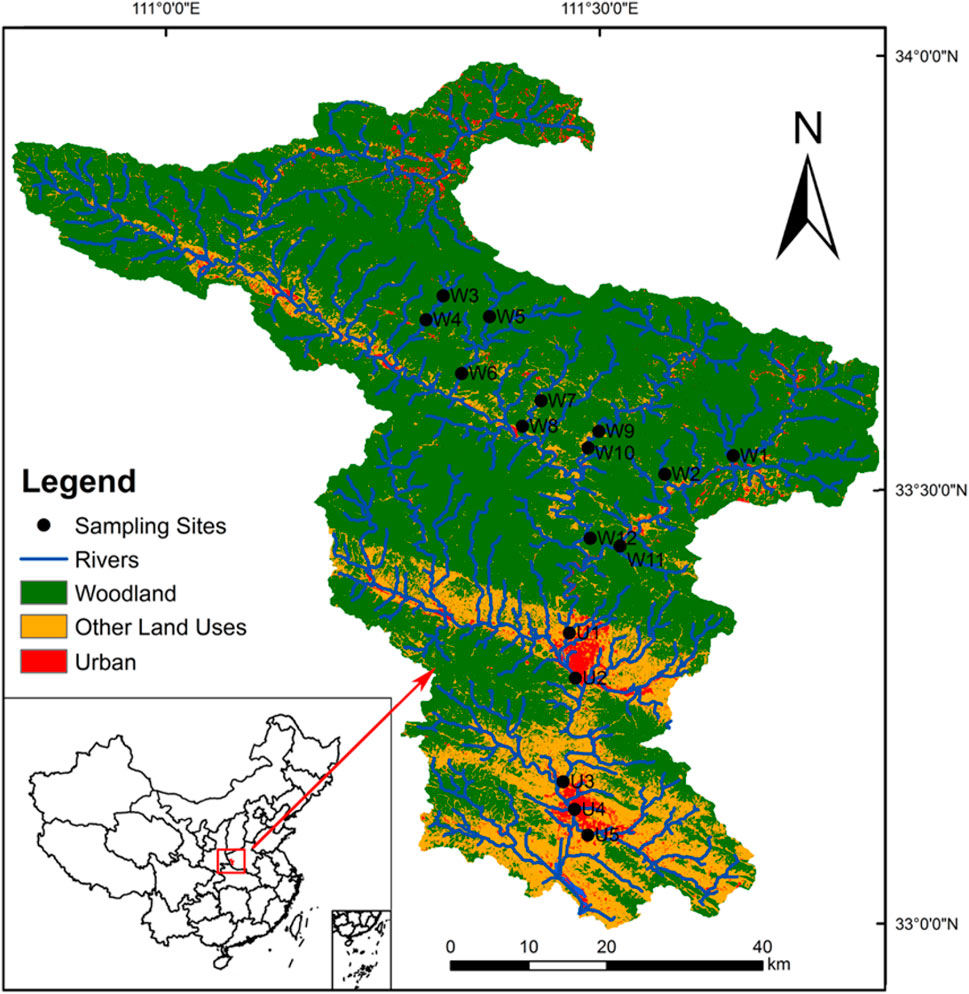
FIGURE 1. Locations of the sampling sites in the Laoguan River.
Land use types were derived from Landsat Thematic Mapper imagery with ArcGIS10.0 and ENVI 4.8. Each sample site was defined as the respective land use at the reach scale (which we defined as a 2 km rectangle buffer zone upstream with a 500 m wide strip) when the percentage of a certain land cover exceeded 40% (Wang et al., 2021).
Woodland sites were characterized by dense riparian vegetation and sparse in-stream vegetation in spring (Figure 2A). The riparian vegetation was dominated by either tussock, shrubs, or trees (e.g., Salix babylonica). The in-stream vegetation was dominated by submerged plants (e.g., Myriophyllum verticillatum or Potamogeton crispus). The stream substrate was mainly cobbles and pebbles. There were massive leaf litter inputs during the high flow season (Figure 2B). In winter, the water level and the leaf litter inputs decreased substantially (Figure 2C).
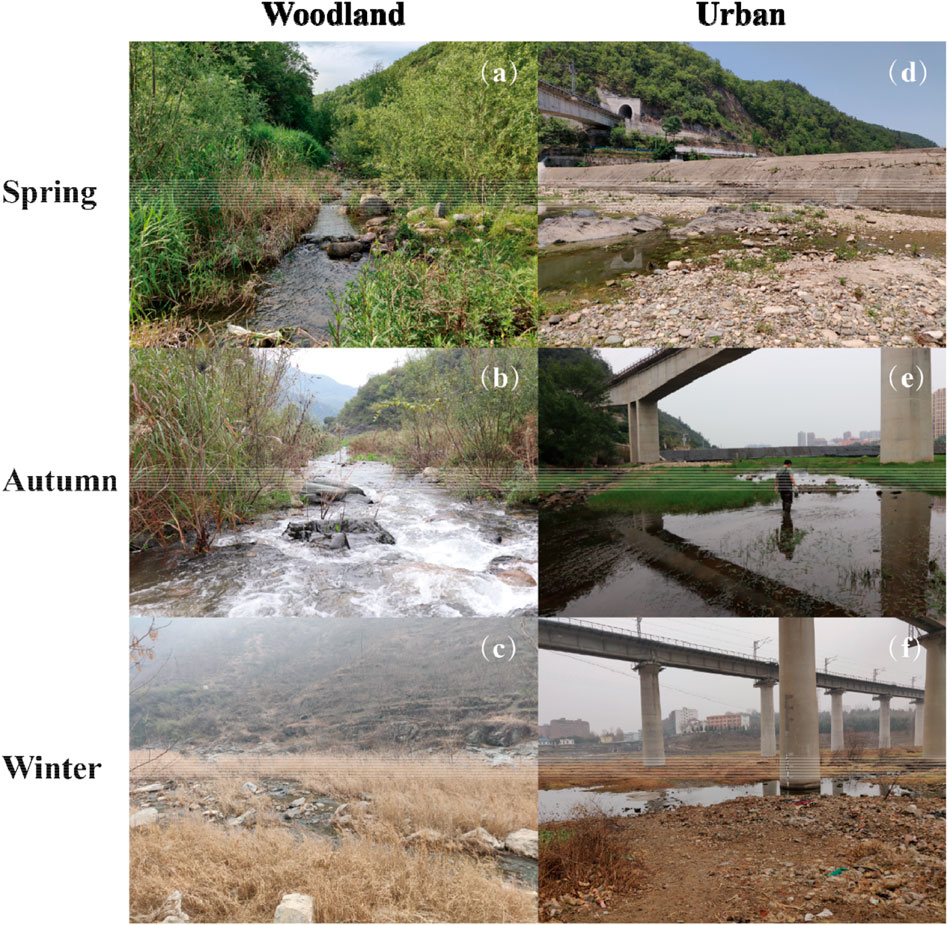
FIGURE 2. Landscapes of a woodland site in (A) spring, (B) autumn, and (C) winter, and an urban site in (D) spring, (E) autumn, and (F) winter of our study area.
Urban sites were characterized by impervious surface cover (e.g., levees) along the riverbanks where ornamental trees were sparsely planted. There were several railroad and highway bridges crossing the stream. In-stream vegetation was densely distributed with submerged or free free-floating plants (e.g., Potamogeton sp. and Salvinia natans). The stream substrate was either pebbles or sand and silt.
We chose seventeen sampling sites along the stream with two distinct land use types (urban and woodland) at the reach scale (Figure 2). Those sites were wadable, which allowed for a comprehensive investigation of food web components including basal resources and consumers at higher trophic levels. There were twelve woodland sites and five urban sites with an increment distance of more than 2 km. We conducted three sampling campaigns in early June during baseflow season (spring) in 2019, early October at the end of the high flow season (autumn) in 2020, and January during the low flow season (winter) in 2021.
Water temperature (°C), pH, dissolved oxygen concentrations (DO) (mg/L), conductivity (μS/cm), nitrate-N (mg/L), and ammonia-N (mg/L) were measured using YSI 6620 (Yellow Springs, OH, United States) in the field. Water velocity (m/s) was measured using a velocity meter (Global Water, FP201, United States). All the water samples were stored at 4°C before the laboratory analysis. At the laboratory, sub samples were filtered with a GF/F glass microfiber filter (Whatman, 0.7 μm pore size) to measure the total dissolved carbon (TDC, mg/L), total dissolved nitrogen (TDN, mg/L) (Elementar, Vario TOC cube, Germany), and total dissolved phosphorus (TDP, mg/L) (ThermoFisher, X Series 2, United States).
Components in the riverine food webs including basal resources (primary producers and other carbon sources) and consumers (macroinvertebrates and fish), were collected at each site. Basal resources differed in amount and types among the seasons and included autochthonous carbon sources, such as filamentous algae (present at several sites), epilithic algae, aquatic macrophytes, fine benthic organic matter (FBOM), and seston, and there were allochthonous carbon sources, including terrestrial insects, terrestrial vegetation, and leaf litter.
Macroinvertebrates were classified into five functional feeding groups (FFGS), which were predators, scrapers, filter-collectors, gatherer-collectors, and shredders (Morse et al., 1994). The sampling method for each food web component was described in detail in the supporting information. A total of 2,353 samples (replicate samples included) at 17 sites in spring, autumn, and winter were collected. For fish, there were 20 species (149 samples) in spring, 28 species (199 samples) in autumn, and 19 species (285 samples) in winter. For macroinvertebrates, there were 70 species (179 samples) in spring, 45 species (356 samples) in autumn, and 39 species (319 samples) in winter (Supplementary Tables S2, S3). For basal resources, there were 231 samples in spring, 398 samples in autumn, and 237 samples in winter.
To identify trophic interactions and infer energy flows, we used carbon and nitrogen stable isotopes to estimate the assimilated fraction of consumers’ diets (Fry, 2006; Boecklen et al., 2011; Nielsen et al., 2018). Samples were oven-dried at 60°C for 48 h before being ground into a fine powder before analyzing their isotopic compositions. Carbon and nitrogen stable isotopes were analyzed using the Isotope Ratio Mass Spectrometer (ThermoFisher, Delta V advantage, Germany) and calculated as [(Rsample/Rstandard)-1] ×1,000‰, where R is the ratio of heavy to light isotope. The isotopic standards are PeeDee belemnite limestone for carbon and atmospheric air for nitrogen (Fry, 2006).
To improve the accuracy of mixing models for tracing consumers’ diets, we aggregated basal resources with similar δ13C isotopic signatures and originality into one group (Nielsen et al., 2018). Basal resources were pooled into three groups: terrestrial sources (leaf litter, terrestrial insects, and vegetation), aquatic macrophytes (submerged and emergent macrophytes), and lower aquatic sources (epilithic algae, filamentous algae, seston, and FBOM). Terrestrial sources were referred to as allochthonous sources while aquatic macrophytes and lower aquatic sources were referred to as autochthonous sources. Macroinvertebrates were pooled into four FFGS, which were predators, collectors (filter-collectors and gatherer-collectors), scrapers, and shredders. According to McCutchan et al. (2003), trophic enrichment factors (TEFs) for the basal resources-macroinvertebrates mixing model were 0.4 ± 0.28‰ (δ13C) and 2.2 ± 0.3‰ (δ15N), and the TEFs for the macroinvertebrates-fish mixing model were 0.6 ± 0.16‰ (δ13C) and 2.4 ± 0.22‰ (δ15N). We applied lipid corrections to consumers in the diet tracing analysis based on the C/N ratio in fish (<4) and macroinvertebrates (>4) measured in the Isotope Ratio Mass Spectrometer (Logan et al., 2008).
Community-level metrics, also known as Layman metrics (Layman et al., 2007), included 1) δ15N range (NR), which represented the vertical structure within a food web (trophic length) calculated using the distance between two species with the most enriched and depleted δ15N values; 2) δ13C range (CR), which represented the niche width at the base of a food web calculated as the distance between two species with the most enriched and most depleted δ13C values; 3) total area (TA), which represented the convex hull area encompassed by all species in δ13C–δ15N bi-plot space; 4) mean Euclidean distance of each species to centroid (CD), which represented the average degree of trophic diversity; 5) mean nearest neighbor distance (MNND), which represented the mean Euclidean distances to each species’ nearest neighbor in bi-plot space and the overall density of species packing; and 6) standard deviations of mean nearest neighbor distance (SDNND), which represented the evenness of species packing. Those six metrics were calculated at each site.
If more species performed the same trophic function, MNND would be smaller and indicate higher trophic redundancy. If there were more species sharing similar ecological traits, SDNND would be smaller and indicate more evenly distributed trophic niches (Layman et al., 2007). The isotopic variations of the standard ellipse area corrected for the small sample size (SEAc) of basal resources, macroinvertebrates, and fish were also calculated at each site.
Analysis of variance (ANOVA) was performed to analyze the differences in physical and chemical parameters, isotopic values, and community-level metrics among seasons at a significance level of p < 0.05. Relationships among the physical and chemical parameters and community-level metrics were tested using Pearson’s correlation with statistical significance at p < 0.05. Principal component analysis (PCA) was carried out to explore the key physical and chemical characteristics in relation to land uses and seasons. Statistical analyses were carried out in SPSS 24.0 software and R 3.6.1 (R Core Team, 2019). Diet tracing in consumers was conducted using the simmr package (updated SIAR package) (Parnell, 2019). The community metrics were calculated using the SIBER package which employed Gaussian likelihood and fit the mixing model to the data via Markov chain Monte Carlo (MCMC) (Jackson et al., 2011).
At woodland sites, water temperature (F2,32 = 170.433, p < 0.01), water velocity (F2,32 = 3.924, p = 0.03), conductivity (F2,32 = 11.56, p < 0.01), pH (F2,32 = 59.655, p < 0.01), TDC (F2,32 = 9.966, p < 0.01), TDN (F2,32 = 24.515, p < 0.01), TDP (F2,32 = 3.508, p < 0.05), DO (F2,32 = 52.012, p < 0.01), ammonia-N (F2,32 = 45.74, p < 0.01), and nitrate-N (F2,32 = 29.35, p < 0.01) significantly differed among seasons (Table 1).
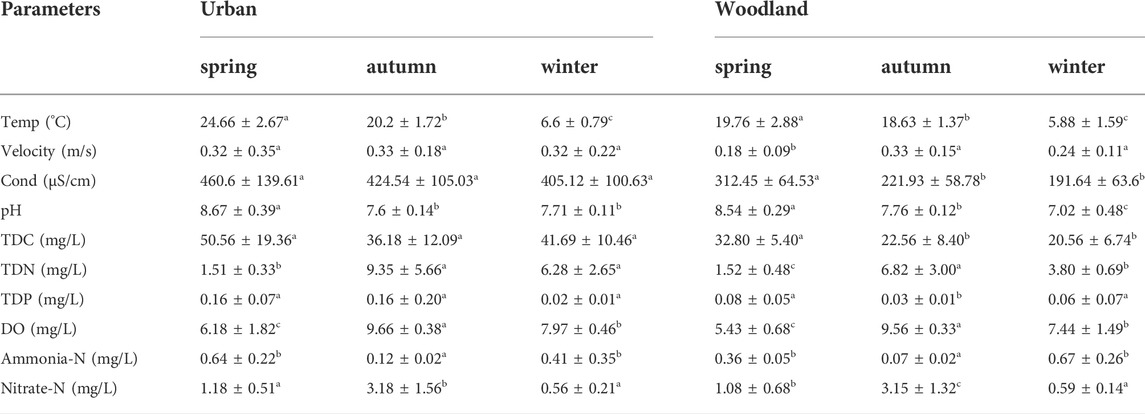
TABLE 1. Physical and chemical parameters at woodland and urban sites in spring, autumn, and winter. Temp and Cond are abbreviations for water temperature and conductivity.
At urban sites, water temperature (F2,12 = 124.237, p < 0.01), pH (F2,12 = 27.786, p < 0.01), TDN (F2,12 = 5.973, p < 0.01), DO (F2,12 = 12.406, p < 0.01), and ammonia-N (F2,12 = 5.965, p < 0.01), nitrate-N (F2,12 = 10.301, p < 0.01) showed significant differences. There was no significant change in water velocity (F2,12 = 0.001, p = 0.999), conductivity (F2,12 = 0.292, p = 0.752), TDC (F2,12 = 1.253, p = 0.32), or TDP (F2,12 = 2.354, p = 0.137).
At woodland sites, there were significant differences in δ13C and δ15N in fish (F2,630 = 41.746, p < 0.01; F2,630 = 103.05, p < 0.01), macroinvertebrates (F2,851 = 67.633, p < 0.01; F2,851 = 18.099, p < 0.01), lower aquatic sources (F2,432 = 4.562, p = 0.01; F2,432 = 129.988, p < 0.01), aquatic macrophytes (F2,137 = 20.818, p < 0.01; F2,137 = 18.05, p < 0.01), and terrestrial sources (F2,288 = 17.303, p < 0.01; F2,288 = 45.184, p < 0.01) (Table 2). Fish and macroinvertebrates had decreasing δ13C values from spring (-22.63 ± 2.11‰ and −24.02 ± 2.97‰), autumn (-24.29 ± 2.07‰ and −26.10 ± 3.83‰), to winter (−25.36 ± 3.77‰ and −28.28 ± 4.64‰), and higher δ15N values in autumn (12.43 ± 3.54‰ and 9.00 ± 3.54‰) than spring (9.21 ± 2.67‰ and 6.81 ± 2.77‰) and winter (8.33 ± 3.10‰ and 7.54 ± 5.69‰). δ13C values for terrestrial sources (−26.66 ± 3.84‰), aquatic macrophytes (−22.33 ± 4.34‰), and lower aquatic sources (−25.22 ± 2.89‰) were highest in spring, and δ15N values for terrestrial sources (10.85 ± 4.79‰), aquatic macrophytes (11.91 ± 4.06‰), and lower aquatic sources (18.44 ± 8.26‰) were highest in autumn.
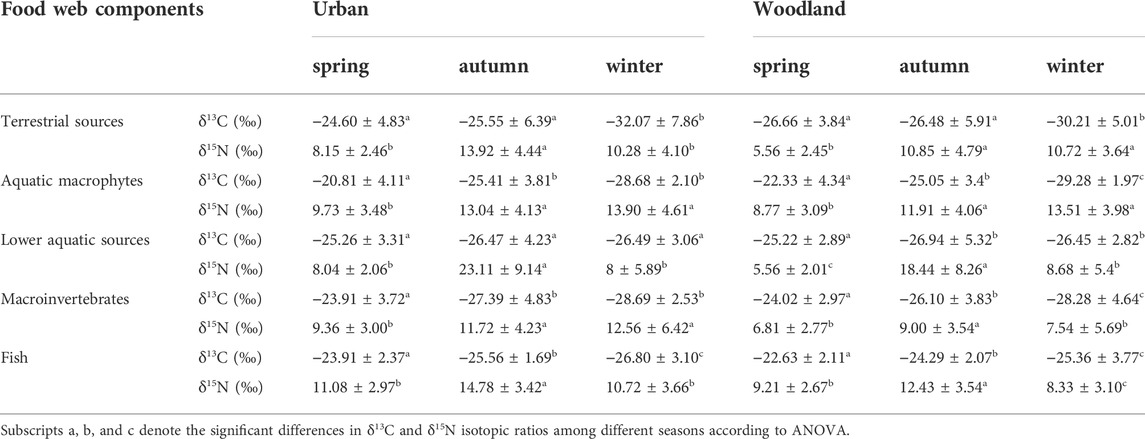
TABLE 2. Mean ± SD of δ13C and δ15N isotope ratios of basal resources, macroinvertebrates, and fish at urban and woodland sites in spring, autumn, and winter.
At urban sites, δ13C and δ15N had significant seasonal differences for fish (F2,199 = 20.296, p < 0.01; F2,199 = 21.699, p < 0.01), macroinvertebrates (F2,189 = 17.913, p < 0.01; F2,189 = 4.464, p < 0.05), aquatic macrophytes (F2,67 = 20.04, p < 0.01; F2,67 = 7.5, p < 0.01), and terrestrial sources (F2,62 = 7.557, p < 0.01; F2,62 = 10.66, p < 0.01). For lower aquatic sources, the δ15N values differed among the seasons (F2,111 = 57.91, p < 0.01), but δ13C values were not significantly different (F2,111 = 1.026, p = 0.362) (Table 2). Fish and macroinvertebrates had highest δ13C values (−23.91 ± 2.37‰ and −23.91 ± 3.72‰, respectively) in spring and highest δ15N values (14.78 ± 3.42‰ and 11.72 ± 4.23‰, respectively) in autumn. Terrestrial sources and aquatic macrophytes had the lowest δ13C values (−32.07 ± 7.86‰ and −28.68 ± 2.1‰, respectively) in winter and the lowest δ15N values (8.15 ± 2.46‰ and 9.73 ± 3.48‰, respectively) in spring. Lower aquatic sources had the highest δ13C values (−25.26 ± 3.31‰) in spring and the highest δ15N values (23.11 ± 9.14‰) in autumn.
At woodland sites, the relative contribution of terrestrial sources (F2,31 = 3.948, p = 0.03), aquatic macrophytes (F2,31 = 4.527, p = 0.019), and lower aquatic sources (F2,31 = 16.471, p < 0.01) to macroinvertebrate diets was significantly different among the seasons. In the autumn high flow season, terrestrial sources constituted 53% of the macroinvertebrate diet, which was significantly higher than in spring (36%) and winter (33%). At urban sites, the relative contribution of terrestrial sources (F2,12 = 1.942, p = 0.186), aquatic macrophytes (F2,12 = 1.146, p = 0.35), and lower aquatic sources (F2,12 = 2.646, p = 0.112) to macroinvertebrate diets was not significantly different among the seasons, and the relative contribution of terrestrial sources was around 20% throughout the year. Aquatic macrophytes constituted most of the macroinvertebrate diet in autumn, while lower aquatic sources constituted most of the diet in spring and winter (Figure 3A).
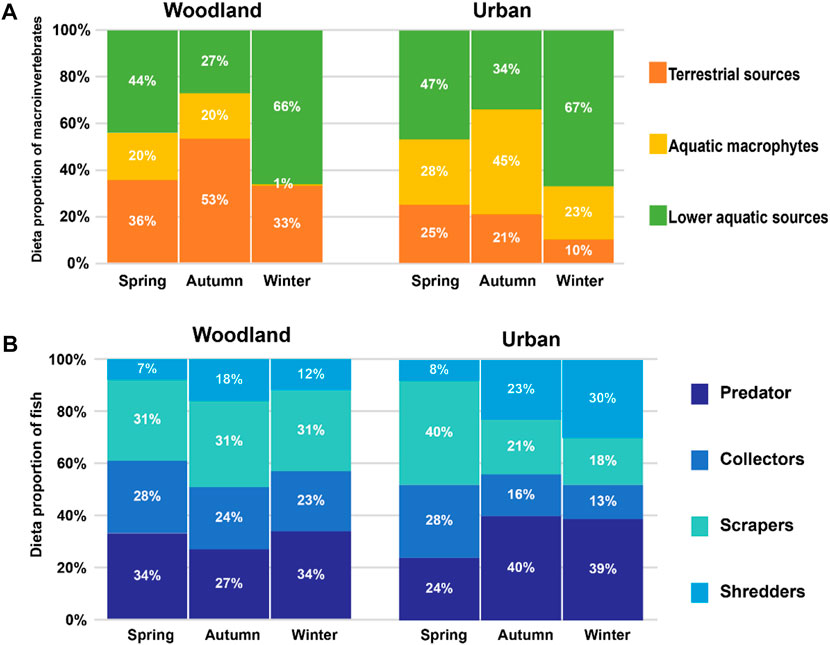
FIGURE 3. The proportions of dietary sources for (A) macroinvertebrates and (B) fish at woodland and urban sites in spring, autumn, and winter.
The proportion of predators (F2,31 = 0.403, p = 0.672; F2,11 = 0.481, p = 0.63), collectors (F2,31 = 0.182, p = 0.835; F2,11 = 1.418, p = 0.283), scrapers (F2,31 = 0.001, p = 0.999; F2,11 = 1.969, p = 0.186), and shredders (F2,31 = 1.172, p = 0.323; F2,11 = 1.424, p = 0.286) in fish diet at woodland and urban sites was not significantly different among seasons. At woodland sites, scrapers (31%) and collectors (∼24%) constituted more to the diets of fish than shredders (∼15%) throughout the year. At urban sites, scrapers (40%) and collectors (28%) constituted most of the diet in spring compared to predators (24%) and shredders (8%), but scrapers and collectors constituted less (<40%) than predators and shredders in autumn and winter (Figure 3B).
At woodland sites, the niche space (SEAc) of basal resources increased significantly from the spring to the winter and reached the maximum in autumn (F2,29 = 66.52, p < 0.01). The niche space (SEAc) of macroinvertebrates showed a slightly different trend which increased significantly from spring to autumn and winter (F2,29 = 10.85, p < 0.01). The niche space (SEAc) of fish was higher in autumn and winter than in spring (F2,29 = 5.84, p < 0.01) (Figure 4). There were no significant differences in niche width (CR) (F2,29 = 1.841, p = 0.177), TA (F2,29 = 2.584, p = 0.093), CD (F2,29 = 1.227, p = 0.308), trophic redundancy (MNND) (F2,29 = 2.023, p = 0.151) or SDNND (F2,29 = 1.302, p = 0.287), but there was a significant difference in NR among seasons (F2,29 = 8.951, p < 0.01). NR was significantly higher in autumn compared to spring and winter (Table 3).
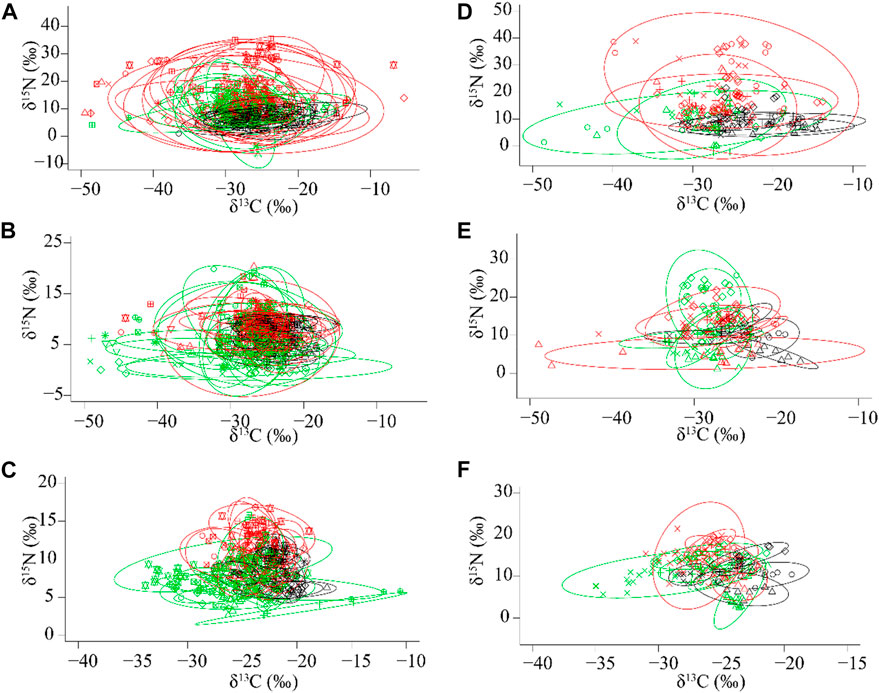
FIGURE 4. The isotopic variances illustrated by standard ellipse area (SEAc, ‰2) for (A) basal resources, (B) macroinvertebrates, (C) fish at woodland sites, and (D) basal resources, (E) macroinvertebrates, (F) fish at urban sites. Black, red, and green ellipses and symbols represented spring, autumn, and winter, respectively.
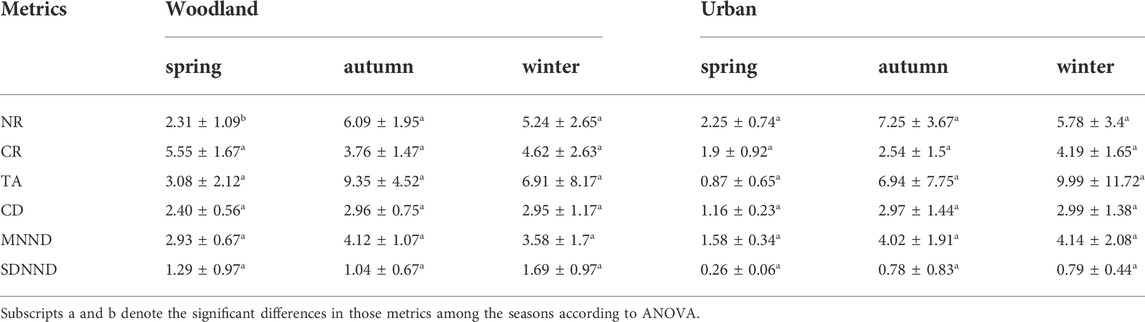
TABLE 3. The community-level metrics at woodland and urban sites in spring, autumn, and winter.
At urban sites, the niche space (SEAc) of basal resources showed significant differences among the seasons (F2,12 = 10.39, p < 0.01) and was higher in autumn and winter than in spring. Nevertheless, SEAc of macroinvertebrates (F2,12 = 1.99, p = 0.18) and fish (F2,12 = 0.78, p = 0.48) showed no significant differences among seasons (Figure 4). There were no significant differences in NR (F2,12 = 3.475, p = 0.064), CR (F2,12 = 3.231, p = 0.075), TA (F2,12 = 1.393, p = 0.286), CD (F2,12 = 3.679, p = 0.057), MNND (F2,12 = 3.403, p = 0.067) or SDNND (F2,12 = 1.498, p = 0.263) among the seasons (Table 3).
Since there were no significant seasonal differences in the food web metrics at urban sites, we only analyzed the correlations between water quality parameters represented by the principal component 1 (PC1) and food web metrics at woodland sites. PC1 explained 36.6% of the variation in the physical and chemical parameters, and TDC and TDN were the strongest positive and negative contributors to the PC1 axis, respectively (Figure 5; Supplementary Table S1). PC1 was negatively correlated with the SEAc of fish, macroinvertebrates, and basal resources (Table 4).
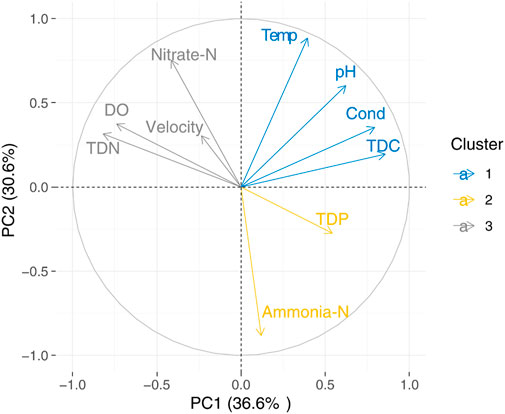
FIGURE 5. Principal component analysis of water quality parameters at woodland sites in spring, autumn, and winter. Temp and Cond are water temperature and conductivity, respectively.
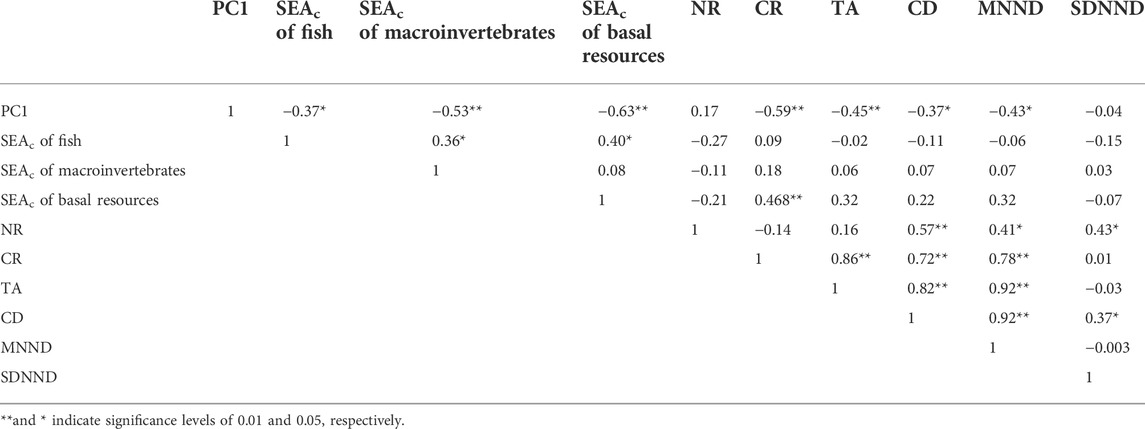
TABLE 4. Pearson correlation coefficients between water quality parameters represented by the principal component 1 (PC1) and food web metrics at woodland sites.
Factors that influence the carbon fixation of primary producers, such as water temperature, eutrophication, pH, or the dissolved CO2, can be important determinants of their δ13C values (Finlay, 2001; Chappuis et al., 2017). Lower water temperature in winter could inhibit the respiration of primary producers, which would excrete less 12C (Finlay and Kendall, 2007; Kendall et al., 2008). A decrease in the productivity of primary producers would cause them to sequester less 13C-enriched CO2 during carbon fixation (Chappuis et al., 2017; Guiry, 2019), and ultimately contribute to the lower δ13C values in aquatic macrophytes.
In spring, dissolved CO2 was absent at pH greater than 8, and became available when pH was between 7 and 8 in autumn and winter (Table 1; Chappuis et al., 2017). When there was ample dissolved CO2 available for photosynthesis, the δ13C values of aquatic macrophytes decreased when the TDC decreased from spring to autumn and winter (Supplementary Tables S1, S2). In our study area, more than 70% of the runoff was concentrated from July to October (Li et al., 2017; Yuan et al., 2017). Urbanization, together with the increased runoff during the high flow season, could bring more pollutants from the uplands to the river channel, which was reflected in the increased δ15N values within food webs (Paul and Meyer, 2001; Loomer et al., 2015; Guiry, 2019; Allan et al., 2021). Therefore, in autumn (the high flow season), δ15N values of lower aquatic sources, including seston and FBOM, increased significantly compared to spring, but then decreased significantly when the runoff was low with fewer nutrients inputs in winter (Table 2). The δ15N values of aquatic macrophytes increased from spring to autumn and winter at both urban and woodland sites, where 15N may accumulate throughout the seasons which could be due to their strategic macrophyte absorption (Chappuis et al., 2017).
Together with residential activities, hydrological regimes among seasons could influence the isotopic compositions of basal resources as well as consumers by altering the water temperature, water discharge, nutrient transport (especially those that are terrestrial-derived), and primary productivity (Bunn et al., 2003; Warry et al., 2016; Guiry, 2019). The differences in consumers’ isotopic compositions among seasons were consistent with those of basal resources, which has implications for the bottom-up control of energy flow (Table 2; Shurin et al., 2012). The isotopic compositions of aquatic organisms provide an excellent indicator not only for the presence of human-induced disturbances, but isotopic compositions can also give information about the effects of seasonal environmental factors on the ecology of important species at each trophic level.
In stream ecology, how aquatic organisms at different trophic levels utilize allochthonous and autochthonous energy has been an important area of research (Paine, 1980; Brett et al., 2017; Twining et al., 2019). Determining the relative importance of autochthonous and allochthonous energy sources can improve our understanding of how energy flows within riverine food webs are affected by anthropogenic activities and/or the seasonality of environmental conditions (Brett et al., 2017). As suggested by the flood pulse concept (FPC), hydrologic alterations in the aquatic and terrestrial transition zone could determine the connectivity between river channels and the floodplains, which was observed to be the main factor in the exchange of water, nutrients, sediments, and biota between aquatic and terrestrial ecosystems (Junk et al., 1989; Bartels et al., 2012).
Allochthonous carbon sources, including terrestrial vegetation, insects, and leaf litter, are the primary carbon sources within riverine food webs (Zeug and Winemiller, 2008; Pingram et al., 2012; Moreira-Turcq et al., 2013; Hayden et al., 2016). As a source of nutrients, their supply plays a key role in affecting aquatic food webs by supporting consumers, such as important fish species (Roach, 2013) or aquatic invertebrates specialized in terrestrial carbon sources (Zheng et al., 2018). Accordingly, we anticipated that in the low flow or baseflow season, autochthonous carbon sources contributed the most to consumers, while allochthonous carbon would contribute the most during the high flow season (Wang et al., 2021). Therefore, it was not surprising that the relative contribution of terrestrial sources to macroinvertebrates at woodland sites was higher than allochthonous sources in autumn at the end of the high flow season by more than 50%, while terrestrial sources contributed around 30% in spring and winter during baseflow and low flow (Figure 3A).
However, at urban sites, allochthonous carbon contributed much less (around 20%) to macroinvertebrate diets than autochthonous carbon in autumn (Figure 3A). In urbanized rivers, the impervious surface cover, such as dams, weirs, or levees, fragment longitudinal (upstream to downstream) and lateral (river to floodplain) connectivity (Grill et al., 2019; Tickner et al., 2020). The impervious surface cover is the main contributor to the loss of connectivity because they usually alter the water flow which usually travels longitudinally and laterally (Humphries et al., 2014; Jones et al., 2019). Our results could be attributed to the riverbank being concreted at urban sites, which is a common practice globally (Figure 2E; Boggs and Sun, 2011; Valle Junior et al., 2015; Shen et al., 2021). Unlike woodland sites, the river channel was disconnected from the floodplain at urban sites, the terrestrial sources in the high flow season were not fully available to consumers, and thus terrestrial sources contributed much less than autochthonous carbon throughout the year. Our results indicated the combined effects of the impervious surface cover at urban rivers and increased water discharges in high flow season on the relative importance of allochthonous and autochthonous carbon to consumers.
Whether allochthonous carbon is readily consumed depends on the capacity of aquatic consumers to modify their diets and synthesize the new biomass in consumers (Brett et al., 2017). As allochthonous DOC (dissolved organic matter) moved from upstream to downstream, it would be dissected and degraded via the microbial loop and then readily bioavailable to consumers (Brett et al., 2012; Roach, 2013; Baldwin et al., 2016). Those bioavailable carbons that originated from allochthonous carbon could be deposited in the sediment as FBOM or floated in the water column as seston. Technically, allochthonous carbon means sources transported from elsewhere into a particular system (Lau et al., 2009; Brett et al., 2017), but we put seston and FBOM into the category of autochthonous carbon (lower aquatic sources) simply because we sampled them within the river channel, so lower aquatic sources contributed more than 60% to consumers and became the main subsidies at urban sites in the following low flow season (Figure 3A).
When there were fewer terrestrial inputs at urban sites in high flow season, terrestrial nutrients obtained at woodland sites in high flow season can be transported to urban sites downstream via a longitudinal connection (Vannote et al., 1980; Humphries et al., 2014; Ye et al., 2017) and be transformed into aquatic carbon sources at urban sites in the next base flow and low-flow seasons. Therefore, high levels of lateral and longitudinal connectivity along the river networks provided significant opportunities for the exchange and transport of nutrients throughout the high and low flow seasons.
How land use and seasonality together influence the food web structure can also be reflected in community-level metrics. Those metrics reflected how the energy flowed to higher trophic levels within the riverine food webs throughout the year. A similar niche width (CR, δ13C range) within riverine food webs among seasons indicated that multiple basal resources with varying δ13C values were available to consumers (Wang et al., 2021). The availability of multiple basal resources could also account for a similar trophic diversity (TA and CD) and trophic redundancy (MNND) within riverine food webs among seasons at both woodland and urban sites (Wang et al., 2021).
At woodland sites, the highest niche space (SEAc, standard ellipse area) of basal resources in autumn proved that the allochthonous carbon was the main subsidy during the high flow season, which could have increased trophic length (NR, δ15N range) in autumn. When a massive amount of terrestrial carbon was transported into river channels in a short period via increased discharge during the high flow season, the significantly increased niche space (SEAc) of basal resources during the high flow season could, in turn, lead to the increased niche space (SEAc) of consumers. When the high flow season ended, much fewer terrestrial nutrient inputs led to decreased niche space (SEAc) of basal resources in winter, reaching a level close to that of the spring. We confidently suggest that seasonal dynamics of terrestrial subsidies due to the seasonal flooding were the main contributor to the dramatically altered isotopic niche of basal resources. The stable isotopes of consumers often reflect their diets over a long period (Nielsen et al., 2018). The niche space (SEAc) of macroinvertebrates reached a peak in winter, which indicated their dietary preferences for lower aquatic sources in winter when there was much less primary production and terrestrial inputs. This peak further indicated that lower aquatic sources, especially dissolved organic matter, originated from terrestrial inputs during the high flow season and continued to support the growth of those aquatic insects in winter. Compared to macroinvertebrates, the niche space (SEAc) of fish were similar in autumn and winter, which indicated that they have a capacity to buffer the disturbances from the massive terrestrial inputs due to their feeding strategies (Price et al., 2019; Wang et al., 2021). The seasonal dynamics of niche space illustrated how the energy flowed in natural riverine ecosystems. Increased water flows during the high flow season resulted in periodic exchanges of nutrients between river channels and floodplains, and ultimately altering the food web structure in riverine ecosystems.
However, it was a different scenario at urban sites. Communities of consumers at urban sites were less affected during the high flow season, as indicated by the niche space (SEAc) of consumers, which showed no differences among seasons although the niche space (SEAc) of basal resources was highest in autumn. In the high flow season, when river channels were disconnected from their floodplains at urban sites, the restriction of water flow could not only reduce the terrestrial nutrient inputs (e.g., terrestrial vegetation) but also potential pollution inputs in the riparian zone, which could significantly alter the niche space (SEAc) of basal resources (as shown at woodland sites), the δ15N values of consumers (Loomer et al., 2015; Price et al., 2019), and the niche space (SEAc) of consumers.
Our results suggested that the loss of lateral connectivity could cut off excessive terrestrial inputs at urban sites, and consumers’ niche space (SEAc) was much less affected compared to woodland sites. Also, the combined effects of impervious surface cover in urban areas and altered hydrological regimes due to increased water discharge on the food web structure were represented by those community-level metrics.
It should not be ignored that longitudinal connectivity is essential for the transport of terrestrial carbon sources from upstream woodland sites to downstream urban sites. In our study area, there was one small dam at an urban site (Figure 2D) located in Xixia County, and the dam failed to cut off the water flows longitudinally during the high flow season. Given the role of allochthonous carbon in supporting biological communities in riverine ecosystems, it does not necessarily mean that we should tear down the impervious surface cover in urbanized areas to diminish the impact of urbanization on decreased terrestrial inputs. Alternative measures could be taken in urban areas, such as safeguarding and restoring the longitudinal connectivity, and informing balanced watershed management for the food web structure in urban areas (Auerbach et al., 2014; Reid et al., 2019).
Based on the diet tracing analysis via stable isotopes, a qualitative description of how hydrological regimes among seasons altered the relative contribution of allochthonous and autochthonous carbon to consumers can be applied to natural riverine ecosystems as well as those in urban areas. Niche space (represented by δ13C and δ15N) occupied by basal resources at both woodland and urban sites was significantly higher in the high flow season. Unlike woodland sites, the impervious surface cover at urban sites disconnects river channels from their floodplains and can cut off the influx of terrestrial carbon sources during the high flow season. This disconnection can cause a lack of seasonal differences in the niche space occupied by aquatic consumers at urban sites.
During the high flow season, increased water discharge can facilitate the acquisition of terrestrial carbon sources for consumers at woodland sites via the lateral connectivity between the river channel and the riparian zone. The terrestrial carbon sources transported downstream can continue to subsidize consumers at downstream urban sites during the low flow season following the high flow season. Our temporal food web study provided a better understanding of the energy transfer and nutrient transport among seasons at urban and woodland rivers and illustrated the combined effects of urbanization and the seasonality in environmental conditions on food web structure in riverine ecosystems. Our findings highlighted the role of allochthonous carbon sources in supporting biological communities and the importance of lateral and longitudinal connectivity in river ecosystems. Such advances in our understanding is critically important for river restoration and management that aims to better protect riverine biodiversity from intensive urbanization along the river network.
The original contributions presented in the study are included in the article/Supplementary Material, further inquiries can be directed to the corresponding authors.
Conceptualization, YW; methodology, YW; software, YW; validation, YW; formal analysis, YW; investigation. YW; resources, YW; data curation, YW; writing—original draft preparation, YW; writing—review and editing, XT, SL, QZ; visualization, YW; supervision, XT, QZ; project administration, XT, QZ; funding acquisition, QZ. All authors have read and agreed to the published version of the manuscript.
This study was financially supported by the National Natural Science Foundation of China (NSFC grant no. 31720103905, 32030069).
We are grateful to Junwei Wei and Ke Zhang from Wuhan Botanical Garden, Chinese Academy of Sciences, Yintao Jia, Kang Chen, Zhengfei Li, Yihao Ge, Zhenyuan Liu, Yang Liu, Ren Zhu, Yihang Jiang, Miss. Yuhan Liu, Miss. Bing Li from the Institute of Hydrobiology, Chinese Academy of Sciences, for their assistance in the field and taxonomy in the lab. We are also grateful to Hongran Li and Miss. Yuxi Tu for their help in GIS plotting. We also thank Russell Doughty for editing this manuscript.
The authors declare that the research was conducted in the absence of any commercial or financial relationships that could be construed as a potential conflict of interest.
All claims expressed in this article are solely those of the authors and do not necessarily represent those of their affiliated organizations, or those of the publisher, the editors and the reviewers. Any product that may be evaluated in this article, or claim that may be made by its manufacturer, is not guaranteed or endorsed by the publisher.
The Supplementary Material for this article can be found online at: https://www.frontiersin.org/articles/10.3389/fenvs.2022.969980/full#supplementary-material
Abrantes, K. G., Barnett, A., Bouillon, S., and Irschick, D. (2014). Stable isotope-based community metrics as a tool to identify patterns in food web structure in east African estuaries. Funct. Ecol. 28, 270–282. doi:10.1111/1365-2435.12155
Allan, J. D. (2004). Landscapes and riverscapes: The influence of land use on stream ecosystems. Annu. Rev. Ecol. Evol. Syst. 35, 257–284. doi:10.1146/annurev.ecolsys.35.120202.110122
Allan, J. D., Castillo, M. M., and Capps, K. A. (2021). Stream ecology: Structure and function of running waters. New York: Springer Cham. doi:10.1007/978-3-030-61286-3
Alp, M., and Cucherousset, J. (2022). Food webs speak of human impact: Using stable isotope-based tools to measure ecological consequences of environmental change. Food Webs 30, e00218. doi:10.1016/j.fooweb.2021.e00218
Auerbach, D., Deisenroth, D., McShane, R., McCluney, K., and Poff, N. (2014). Beyond the concrete: Accounting for ecosystem services from free-flowing rivers. Ecosyst. Serv. 10, 1–5. doi:10.1016/j.ecoser.2014.07.005
Baldwin, D. S., Colloff, M. J., Mitrovic, S. M., Bond, N. R., and Wolfenden, B. (2016). Restoring dissolved organic carbon subsidies from floodplains to lowland river food webs: A role for environmental flows? Mar. Freshw. Res. 67, 1387–1399. doi:10.1071/MF15382
Bartels, P., Cucherousset, J., Steger, K., Eklöv, P., Tranvik, L., and Hillebrand, H. (2012). Reciprocal subsidies between freshwater and terrestrial ecosystems structure consumer resource dynamics. Ecology 93, 1173–1182. doi:10.1890/11-1210.1
Belgrano, A., Scharler, U. M., Dunne, J. A., and Ulanowicz, R. E. (2005). Aquatic food webs: An ecosystem approach. New York: Oxford University Press. doi:10.1093/acprof:oso/9780198564836.001.0001
Boecklen, W. J., Yarnes, C. T., Cook, B. A., and James, A. C. (2011). On the use of stable isotopes in trophic ecology. Annu. Rev. Ecol. Evol. Syst. 42, 411–440. doi:10.1146/annurev-ecolsys-102209-144726
Boggs, J. L., and Sun, G. (2011). Urbanization alters watershed hydrology in the Piedmont of North Carolina. Ecohydrology 4, 256–264. doi:10.1002/eco.198
Bokhutlo, T., Keppeler, F. W., and Winemiller, K. O. (2021). Seasonal hydrology influences energy channels in food webs of rivers in the lower Okavango Delta. Environ. Biol. Fishes 104, 1303–1319. doi:10.1007/s10641-021-01156-x
Booth, D. B., Roy, A. H., Smith, B., and Capps, K. A. (2016). Global perspectives on the urban stream syndrome. Freshw. Sci. 35, 412–420. doi:10.1086/684940
Brett, M. T., Arhonditsis, G. B., Chandra, S., and Kainz, M. J. (2012). Mass flux calculations show strong allochthonous support of freshwater zooplankton production is unlikely. PLoS ONE 7, e39508. doi:10.1371/journal.pone.0039508
Brett, M. T., Bunn, S. E., Chandra, S., Galloway, A. W. E., Guo, F., Kainz, M. J., et al. (2017). How important are terrestrial organic carbon inputs for secondary production in freshwater ecosystems? Freshw. Biol. 62, 833–853. doi:10.1111/fwb.12909
Bunn, S. E., Davies, P. M., and Winning, M. (2003). Sources of organic carbon supporting the food web of an arid zone floodplain river. Freshw. Biol. 48, 619–635. doi:10.1046/j.1365-2427.2003.01031.x
Calizza, E., Costantini, M. L., Rossi, D., Carlino, P., and Rossi, L. (2012). Effects of disturbance on an urban river food web. Freshw. Biol. 57, 2613–2628. doi:10.1111/fwb.12033
Cazzolla Gatti, R. (2016). Freshwater biodiversity: A review of local and global threats. Int. J. Environ. Stud. 73, 887–904. doi:10.1080/00207233.2016.1204133
Chappuis, E., Seriñá, V., Martí, E., Ballesteros, E., and Gacia, E. (2017). Decrypting stable-isotope (δ13C and δ15N) variability in aquatic plants. Freshw. Biol. 62, 1807–1818. doi:10.1111/fwb.12996
El-Sabaawi, R. (2018). Trophic structure in a rapidly urbanizing planet. Funct. Ecol. 32, 1718–1728. doi:10.1111/1365-2435.13114
Fernandes, T., and McMeans, B. C. (2019). Coping with the cold: Energy storage strategies for surviving winter in freshwater fish. Ecography 42, 2037–2052. doi:10.1111/ecog.04386
Finlay, J. C., and Kendall, C. (2007). “Stable isotope tracing of temporal and spatial variability in organic matter sources to freshwater ecosystems,” in Stable isotopes in ecology and environmental science. Editors R. Michener, and K. Lajtha (Hoboken, NJ: Blackwell Publishing), 283–333. doi:10.1002/9780470691854.ch10
Finlay, J. C. (2001). Stable-carbon-isotope ratios of river biota: Implications for energy flow in lotic food webs. Ecology 82, 1052–1064. doi:10.1890/0012-9658(2001)082[1052:SCIROR]2.0.CO;2
Fitzgerald, D. B., Winemiller, K. O., Sabaj Pérez, M. H., and Sousa, L. M. (2017). Using trophic structure to reveal patterns of trait-based community assembly across niche dimensions. Funct. Ecol. 31, 1135–1144. doi:10.1111/1365-2435.12838
Foley Jonathan, A., DeFries, R., Asner Gregory, P., Barford, C., Bonan, G., Carpenter Stephen, R., et al. (2005). Global consequences of land use. Science 309, 570–574. doi:10.1126/science.1111772
Fugère, V., Mehner, T., and Chapman, L. J. (2018). Impacts of deforestation-induced warming on the metabolism, growth and trophic interactions of an afrotropical stream fish. Funct. Ecol. 32, 1343–1357. doi:10.1111/1365-2435.13065
Gibert, J. P. (2019). Temperature directly and indirectly influences food web structure. Sci. Rep. 9, 5312. doi:10.1038/s41598-019-41783-0
Grill, G., Lehner, B., Thieme, M., Geenen, B., Tickner, D., Antonelli, F., et al. (2019). Mapping the world’s free-flowing rivers. Nature 569, 215–221. doi:10.1038/s41586-019-1111-9
Guiry, E. (2019). Complexities of stable carbon and nitrogen isotope biogeochemistry in ancient freshwater ecosystems: Implications for the study of past subsistence and environmental change. Front. Ecol. Evol. 7, 313. doi:10.3389/fevo.2019.00313
Hayden, B., McWilliam-Hughes, S. M., and Cunjak, R. A. (2016). Evidence for limited trophic transfer of allochthonous energy in temperate river food webs. Freshw. Sci. 35, 544–558. doi:10.1086/686001
Hette-Tronquart, N., Oberdorff, T., Tales, E., Zahm, A., and Belliard, J. (2018). Biological impacts of local vs. regional land use on a small tributary of the Seine River (France): insights from a food web approach based on stable isotopes 25, 23583–23594. doi:10.1007/s11356-017-8771-5
Humphries, P., Keckeis, H., and Finlayson, B. (2014). the river wave concept: Integrating river ecosystem models. Bioscience 64, 870–882. doi:10.1093/biosci/biu130
Jabot, F., Giraldo, C., Lefebvre, S., and Dubois, S. (2017). Are food web structures well represented in isotopic spaces? Funct. Ecol. 31, 1975–1984. doi:10.1111/1365-2435.12895
Jackson, A. L., Inger, R., Parnell, A. C., and Bearhop, S. (2011). Comparing isotopic niche widths among and within communities: SIBER - stable isotope bayesian ellipses in R. J. Anim. Ecol. 80, 595–602. doi:10.1111/j.1365-2656.2011.01806.x
Jackson, M. C., Fourie, H. E., Dalu, T., Woodford, D. J., Wasserman, R. J., Zengeya, T. A., et al. (2020). Food web properties vary with climate and land use in South African streams. Funct. Ecol. 34, 1653–1665. doi:10.1111/1365-2435.13601
Jardine, T. D., Pettit, N. E., Warfe, D. M., Pusey, B. J., Ward, D. P., Douglas, M. M., et al. (2012a). Consumer–resource coupling in wet–dry tropical rivers. J. Anim. Ecol. 81, 310–322. doi:10.1111/j.1365-2656.2011.01925.x
Jardine, T. D., Pusey, B. J., Hamilton, S. K., Pettit, N. E., Davies, P. M., Douglas, M. M., et al. (2012b). Fish mediate high food web connectivity in the lower reaches of a tropical floodplain river. Oecologia 168, 829–838. doi:10.1007/s00442-011-2148-0
Jones, J., Börger, L., Tummers, J., Jones, P., Lucas, M., Kerr, J., et al. (2019). A comprehensive assessment of stream fragmentation in Great Britain. Sci. Total Environ. 673, 756–762. doi:10.1016/j.scitotenv.2019.04.125
Junk, W. J., Bayley, P. B., and Sparks, R. E. (1989). The flood pulse concept in river-floodplain systems. Can. Spec. Publ. Fish. Aquat. Sci. 106, 110–127.
Kendall, C., Elliott, E. M., and Wankel, S. D. (2008). “Tracing anthropogenic inputs of nitrogen to ecosystems,” in Stable isotopes in ecology and environmental science. Editors R. Michener, and K. Lajtha (Hoboken, NJ: Blackwell Publishing), 375–449. doi:10.1002/9780470691854.ch12
Lau, D. C. P., Leung, K. M. Y., and Dudgeon, D. (2009). What does stable isotope analysis reveal about trophic relationships and the relative importance of allochthonous and autochthonous resources in tropical streams? A synthetic study from Hong Kong. Freshw. Biol. 54, 127–141. doi:10.1111/j.1365-2427.2008.02099.x
Layman, C. A., Arrington, D. A., Montaña, C. G., and Post, D. M. (2007). Can stable isotope ratios provide for community-wide measures of trophic structure? Ecology 88, 42–48. doi:10.1890/0012-9658(2007)88[42:CSIRPF]2.0.CO;2
Layman, C. A., Araujo, M. S., Boucek, R., Hammerschlag-Peyer, C. M., Harrison, E., Jud, Z. R., et al. (2012). Applying stable isotopes to examine food-web structure: An overview of analytical tools. Biol. Rev. 87, 545–562. doi:10.1111/j.1469-185X.2011.00208.x
Li, S., Ye, C., and Zhang, Q. (2017). 11-Year change in water chemistry of large freshwater Reservoir Danjiangkou, China. J. Hydrol. X. 551, 508–517. doi:10.1016/j.jhydrol.2017.05.058
Logan, J. M., Jardine, T. D., Miller, T. J., Bunn, S. E., Cunjak, R. A., and Lutcavage, M. E. (2008). Lipid corrections in carbon and nitrogen stable isotope analyses: Comparison of chemical extraction and modelling methods. J. Anim. Ecol. 77, 838–846. doi:10.1111/j.1365-2656.2008.01394.x
Loomer, H. A., Oakes, K. D., Schiff, S. L., Taylor, W. D., and Servos, M. R. (2015). Use of stable isotopes to trace municipal wastewater effluents into food webs within a highly developed river system. River Res. Appl. 31, 1093–1100. doi:10.1002/rra.2826
McCutchan, J. H., Lewis, W. M., Kendall, C., and McGrath, C. C. (2003). Variation in trophic shift for stable isotope ratios of carbon, nitrogen, and sulfur. Oikos 102, 378–390. doi:10.1034/j.1600-0706.2003.12098.x
McMeans, B. C., McCann, K. S., Humphries, M., Rooney, N., and Fisk, A. T. (2015). Food web structure in temporally-forced ecosystems. Trends Ecol. Evol. 30, 662–672. doi:10.1016/j.tree.2015.09.001
Moreira-Turcq, P., Bonnet, M.-P., Amorim, M., Bernardes, M., Lagane, C., Maurice, L., et al. (2013). Seasonal variability in concentration, composition, age, and fluxes of particulate organic carbon exchanged between the floodplain and Amazon River. Glob. Biogeochem. Cycles 27, 119–130. doi:10.1002/gbc.20022
Morse, J. C., Yang, L., and Tian, L. (1994). Aquatic insects of China useful for monitoring water quality. Nanjing: Hohai University Press.
Newsome, S. D., Martinez del Rio, C., Bearhop, S., and Phillips, D. L. (2007). A niche for isotopic ecology. Front. Ecol. Environ. 5, 429–436. doi:10.1890/060150.1
Nielsen, J. M., Clare, E. L., Hayden, B., Brett, M. T., and Kratina, P. (2018). Diet tracing in ecology: Method comparison and selection. Methods Ecol. Evol. 9, 278–291. doi:10.1111/2041-210X.12869
Paine, R. T. (1980). Food webs: Linkage, interaction strength and community infrastructure. J. Anim. Ecol. 49, 666–685. doi:10.2307/4220
Parnell, A. (2019). Simmr: A stable isotope mixing model. R package version 0.4.6.9000. Available at: https://CRAN.R-project.org/package=simmr.
Parreira de Castro, D. M., Reis de Carvalho, D., Pompeu Pdos, S., Moreira, M. Z., Nardoto, G. B., and Callisto, M. (2016). Land use influences niche size and the assimilation of resources by benthic macroinvertebrates in tropical headwater streams. PLoS ONE 11, e0150527. doi:10.1371/journal.pone.0150527
Paul, M. J., and Meyer, J. L. (2001). Streams in the urban landscape. Annu. Rev. Ecol. Syst. 32, 333–365. doi:10.1146/annurev.ecolsys.32.081501.114040
Pease, A. A., Soria‐Barreto, M., González‐Díaz, A. A., and Rodiles‐Hernández, R. (2020). Seasonal variation in trophic diversity and relative importance of basal resources supporting tropical river fish assemblages in Chiapas, Mexico. Trans. Am. Fish. Soc. 149, 753–769. doi:10.1002/tafs.10269
Pingram, M. A., Collier, K. J., Hamilton, D. P., David, B. O., and Hicks, B. J. (2012). Carbon sources supporting large river food webs: A review of ecological theories and evidence from stable isotopes. Freshw. Rev. 5, 85–103. doi:10.1608/frj-5.2.476
Price, E. L., Sertić Perić, M., Romero, G. Q., and Kratina, P. (2019). Land use alters trophic redundancy and resource flow through stream food webs. J. Anim. Ecol. 88, 677–689. doi:10.1111/1365-2656.12955
R Core Team (2019). R: A language and environment for statistical computing. (Vienna: R Foundation for Statistical Computing).
Rader, J. A., Newsome, S. D., Sabat, P., Chesser, R. T., Dillon, M. E., and Martinez Del Rio, C. (2017). Isotopic niches support the resource breadth hypothesis. J. Anim. Ecol. 86, 405–413. doi:10.1111/1365-2656.12629
Reid, A. J., Carlson, A. K., Creed, I. F., Eliason, E. J., Gell, P. A., Johnson, P. T. J., et al. (2019). Emerging threats and persistent conservation challenges for freshwater biodiversity. Biol. Rev. 94, 849–873. doi:10.1111/brv.12480
Roach, K. A. (2013). Environmental factors affecting incorporation of terrestrial material into large river food webs. Freshw. Sci. 32, 283–298. doi:10.1899/12-063.1
Roach, K. A., and Winemiller, K. O. (2015). Hydrologic regime and turbidity influence entrance of terrestrial material into river food webs. Can. J. Fish. Aquat. Sci. 72, 1099–1112. doi:10.1139/cjfas-2014-0459
Shen, Z., Rosenheim, B. E., Törnqvist, T. E., and Lang, A. (2021). Engineered continental-scale rivers can drive changes in the carbon cycle. AGU Adv. 2, e2020AV000273. doi:10.1029/2020AV000273
Shurin, J. B., Clasen, J. L., Greig, H. S., Kratina, P., and Thompson, P. L. (2012). Warming shifts top-down and bottom-up control of pond food web structure and function. Phil. Trans. R. Soc. B 367, 3008–3017. doi:10.1098/rstb.2012.0243
Thompson, R. M., Brose, U., Dunne, J. A., Hall, R. O., Hladyz, S., Kitching, R. L., et al. (2012). Food webs: Reconciling the structure and function of biodiversity. Trends Ecol. Evol. 27, 689–697. doi:10.1016/j.tree.2012.08.005
Tickner, D., Opperman, J. J., Abell, R., Acreman, M., Arthington, A. H., Bunn, S. E., et al. (2020). Bending the curve of global freshwater biodiversity loss: An emergency recovery plan. Bioscience 70, 330–342. doi:10.1093/biosci/biaa002
Twining, C. W., Brenna, J. T., Lawrence, P., Winkler, D. W., Flecker, A. S., and Hairston, N. G. (2019). Aquatic and terrestrial resources are not nutritionally reciprocal for consumers. Funct. Ecol. 33, 2042–2052. doi:10.1111/1365-2435.13401
Valle Junior, R. F., Varandas, S. G. P., Pacheco, F. A. L., Pereira, V. R., Santos, C. F., Cortes, R. M. V., et al. (2015). Impacts of land use conflicts on riverine ecosystems. Land use policy 43, 48–62. doi:10.1016/j.landusepol.2014.10.015
Vannote, R. L., Minshall, G. W., Cummins, K. W., Sedell, J. R., and Cushing, C. E. (1980). The river continuum concept. Can. J. Fish. Aquat. Sci. 37, 130–137. doi:10.1139/f80-017
Wang, Y., Jia, Y., Li, Z., Tao, J., Lin, L., Chen, K., et al. (2021). Trophic structure in response to land use in subtropical streams. Ecol. Indic. 127, 107746. doi:10.1016/j.ecolind.2021.107746
Ward, J. V. (1989). The four-dimensional nature of lotic ecosystems. J. North Am. Benthol. Soc. 8, 2–8. doi:10.2307/1467397
Warry, F. Y., Reich, P., Cook, P. L. M., Mac Nally, R., Thomson, J. R., and Woodland, R. J. (2016). Nitrogen loads influence trophic organization of estuarine fish assemblages. Funct. Ecol. 30, 1723–1733. doi:10.1111/1365-2435.12647
Wilson, H., Raymond, P., Saiers, J., Sobczak, W., and Xu, N. (2016). Increases in humic and bioavailable dissolved organic matter in a forested New England headwater stream with increasing discharge. Mar. Freshw. Res. 67, 1279–1292. doi:10.1071/MF15286
Ye, F., Guo, W., Shi, Z., Jia, G., and Wei, G. (2017). Seasonal dynamics of particulate organic matter and its response to flooding in the Pearl River Estuary, China, revealed by stable isotope (δ13C and δ15N) analyses. J. Geophys. Res. Oceans 122, 6835–6856. doi:10.1002/2017JC012931
Yuan, J., Li, S., Han, X., Chen, Q., Cheng, X., and Zhang, Q. (2017). Characterization and source identification of nitrogen in a riverine system of monsoon-climate region, China. Sci. Total Environ. 592, 608–615. doi:10.1016/j.scitotenv.2017.03.042
Zeug, S. C., and Winemiller, K. O. (2008). Evidence supporting the importance of terrestrial carbon in a large-river food web. Ecology 89, 1733–1743. doi:10.1890/07-1064.1
Keywords: stable isotopes, urbanization, diet tracing, trophic interaction, river wave concept
Citation: Wang Y, Li S, Tan X and Zhang Q (2022) The combined effects of land use and seasonal environmental factors on stream food web structure. Front. Environ. Sci. 10:969980. doi: 10.3389/fenvs.2022.969980
Received: 16 June 2022; Accepted: 31 August 2022;
Published: 20 September 2022.
Edited by:
Naicheng Wu, Ningbo University, ChinaCopyright © 2022 Wang, Li, Tan and Zhang. This is an open-access article distributed under the terms of the Creative Commons Attribution License (CC BY). The use, distribution or reproduction in other forums is permitted, provided the original author(s) and the copyright owner(s) are credited and that the original publication in this journal is cited, in accordance with accepted academic practice. No use, distribution or reproduction is permitted which does not comply with these terms.
*Correspondence: Xiang Tan, eHRhbkB3YmdjYXMuY24=; Quanfa Zhang, cXpoYW5nQHdiZ2Nhcy5jbg==
Disclaimer: All claims expressed in this article are solely those of the authors and do not necessarily represent those of their affiliated organizations, or those of the publisher, the editors and the reviewers. Any product that may be evaluated in this article or claim that may be made by its manufacturer is not guaranteed or endorsed by the publisher.
Research integrity at Frontiers
Learn more about the work of our research integrity team to safeguard the quality of each article we publish.