 Xiaomeng Shen
 Haoxiang Zhao
 Jingyue Yu
 Zhicheng Wan
 Taiyi He
 Jiawei Liu
95% of researchers rate our articles as excellent or good
Learn more about the work of our research integrity team to safeguard the quality of each article we publish.
Find out more
ORIGINAL RESEARCH article
Front. Environ. Sci. , 12 September 2022
Sec. Environmental Economics and Management
Volume 10 - 2022 | https://doi.org/10.3389/fenvs.2022.969878
This article is part of the Research Topic Accentuating the Effects of Digital Circular Economy Transformations on Environmental Sustainability View all 25 articles
The rapid development of information and communication technologies has brought the concept of digital economy into the limelight. Data elements have played a more important role in economic production. As an environmentally friendly economic model, the data factor-driven economy, compared to the traditional one, has low energy consumption and less pollution emissions. Hence, the effect of digital economy development on ecological performance is worth exploring. We measured the digital economy index and the ecological performance index for 30 provinces in China. Furthermore, the relationship between the two was analyzed with the help of a dynamic spatial Durbin model. The results showed the following: 1) closely related to the regional economic foundation, the development level of the digital economy showed obvious spatial characteristics that were high in the eastern region and low in the western region in China. 2) Over time, the pattern of ecological performance in China has changed markedly, showing a high level in the south and a low level in the north. 3) The digital economy showed a significant promoting effect on ecological performance, with a strong externality in space that could have a spillover effect on the surrounding areas. 4) The effect of the digital economy on ecological performance had a significant positive effect, although it lagged behind over time. In addition, the effect has regional heterogeneity and was more obvious in developed regions. Based on these findings, we recommend that the role of ICT in economic activity be strengthened in some developed regions. However, in some developing regions, a balance needs to be struck between digitalization and environmental benefits. At the same time, developed regions should be encouraged to realize economic collaboration with developing regions, with the help of data elements in an effort to narrow the regional gap.
After the industrial revolution, the process of global industrialization and urbanization has been accelerating, and the economy has developed rapidly. However, the reason behind the rapid development of the economy is the huge demand for resources. The overexploitation of resources, especially fossil fuel resources, has exacerbated the problem of resource shortages and the deterioration of the ecological environment (Wu et al., 2020; Wang et al., 2022c; Yang et al., 2022a). Currently, grassland degradation and soil erosion are becoming more serious, bringing great negative effects on people’s production and life, as are land desertification and other problems. Moreover, excessive energy consumption has caused large emissions of greenhouse gases and has led to the emergence of global extreme climate phenomena. Increasingly frequent natural disasters continue to threaten human settlements and reduce the resilience of cities day-by-day (Yang et al., 2021; Ge et al., 2022; You et al., 2022). Hence, it is necessary to explore the relationship between economic development and the ecological environment to seek future development directions.
Some studies have shown that the improvement of environmental regulation and technical level is conducive to sustainable development and ecological performance. The former can reduce pollution emissions during production to ensure the quality of the ecological environment, and the latter can drive energy efficiency to reduce the consumption of resources (Lorenzoni et al., 2007; Zhu et al., 2014; Zhang et al., 2019; Zhou et al., 2020). More specifically, environmental regulation can effectively prevent economic activities from deteriorating the current ecological situation, which contributes to ecological restoration. Technological advances can improve energy efficiency and reduce pollutant emissions. During this evolution, the same economic output would have consumed fewer resources due to advances in production technology. However, improving the quality of the environment is never such a simple matter. It is a complex system. For developing countries still with a low level of industrialization, including China, simple and rough environmental regulation in such a stage may have a negative influence on industrial agglomeration. This could bring the pollution shelter effect (Copeland and Taylor, 1994; Biswas et al., 2012); that is, as an external constraint on economic activities, the environment will break the production balance of manufacturers in the existing factors of production. In this case, manufacturers have no choice but to adjust their production strategies to face environmental regulation, resulting in an increase in their production cost (Gollop and Roberts, 1983; Gollop and Roberts, 1983). As a result, enterprises have to seek technological breakthroughs to reduce costs.
Although technological progress is more important for these developing countries, not all technological advances can reduce pollution emissions (Adha et al., 2002; Acemoglu et al., 2012; Anasuya and Narayan, 2022). A new clean technical element is increasingly urgently needed to improve ecological performance and realize the transformation to green and sustainable development. Since the beginning of the 20th century, computer science has been developed continuously, and communication technology has become increasingly mature. Blockchain, artificial intelligence, cloud computing, and the Internet of Things have promoted the transformation of economic development models (Wang et al., 2022b). The digital economy is a new economic form born in this process. As shown in Figure 1, the global trade volume on ICT services has maintained steady growth since 2006. Particularly in Asia, the trade volume increased from $221.37 billion in 2006 to $2010.50 billion in 2019. The trade scale among Africa and Oceania has increased by more than 100% as well (the growth rate of Africa is 105.76% and that of Oceania is 149.69%). This showed that the effect of the digital economy on the global economy was great and obvious.
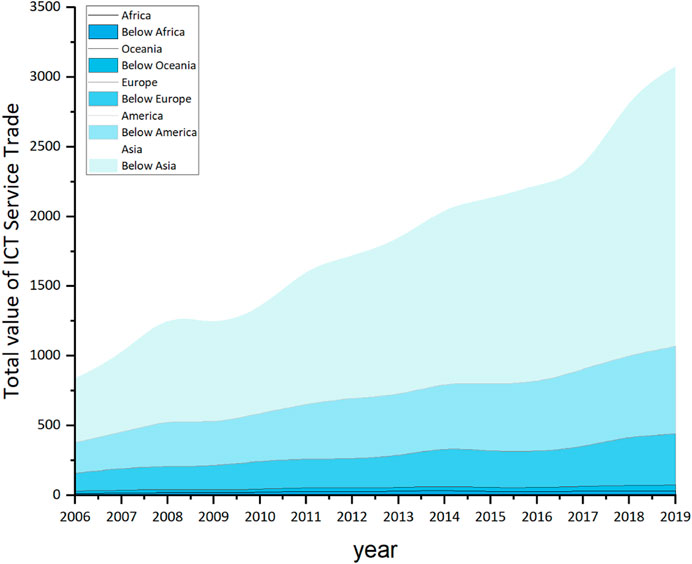
FIGURE 1. 2006–2019 trade volume on ICT services in different regions of the world. Note: source from the United Nations Conference on Trade and Development Statistics (UNCTAD stat). Unit: billion USD.
With information and communication technology, the digital economy takes data or information as key production factors, regulating a series of economic activities such as production or consumption (Miao, 2021). Although data resources are a relatively virtual resource compared to traditional resources such as water and fossil fuel, they can be copied and shared conveniently. Hence, its marginal utility continuously increases while the marginal cost is almost zero. Clearly, data resources are a kind of low cost, high-return factor of production. When data elements participate in economic activities, they can have huge effects on the traditional economic growth style that has high energy consumption and high pollution (Ding et al., 2021). In the digital drive mode, manufacturers are able to use fewer natural resources to generate greater economic benefits and less pollution. This can alleviate the deterioration of the ecological environment and the shortage of resources to a certain extent. Undoubtedly, the digital economy can now be regarded as an important medium to adjust the contradiction between economic development and the ecological environment.
After the entrance of the digital economy into people’s vision, the relationship between the digital economy and the ecological environment has become the focus of scholars. Zhou et al. (2021) pointed out that the digital economy has improved the energy consumption structure by optimizing the industrial structure, thus curbing air pollution. This effect was more obvious in developed areas (Zhou et al., 2021). The conclusion of Wu et al. (2022) was similar, and they found that this result could be applied to surrounding regions as well (Wu et al., 2021). Some studies revealed that the digital economy could also promote the level of green innovation in cities to improve cleaner production technology (Wang et al., 2022d; Fang et al., 2022; Wang et al., 2022a). However, some different conclusions have been put forward that the development of the digital economy is not beneficial to the ecological environment in all regions. In those areas that have not yet reached the environmental Kuznets curve (EKC) inflection point, the development of the digital economy has unexpectedly stimulated the demand for electricity in the short term, thus increasing the consumption of fossil fuel resources (Haldar and Sethi (2022); Adha et al., 2022).
In summary, most of the current studies have aimed to investigate the influence of the digital economy on energy consumption and environmental pollution. However, few studies have been concerned about the relationship between the digital economy and ecological performance. In fact, resource constraints and environmental protection are two major issues faced by the Chinese government at the same time (Lan et al., 2012). Energy consumption is related to China’s economic growth, while pollution control is related to China’s ecological environment (Shakib et al., 2022). Obviously, especially for China, which has not completed the industrialization process, this is a complex problem (Wang et al., 2022; Wang et al., 2022c). Thus, based on the studies mentioned earlier, this article focused on the dynamic spatial relationship between the digital economy and ecological performance. The following work was carried out: 1) a set of evaluation systems of the digital economy was designed, and then the development level of the digital economy in 30 provinces in China during the period 2013–2019 was quantified. 2) The super-SBM model was used to calculate the ecological performance level of various regions in China from 2013 to 2019. 3) The spatial distribution patterns of the digital economy and ecological performance were summarized. 4) Based on the obtained results, the spatial influence of the digital economy on ecological performance was finally examined.
The contribution of this study was mainly reflected in the following aspects: 1) this study designed a set of index systems to evaluate the digital economy from the three dimensions of digital industrialization, industrial digitalization, and information facilities, providing a set of scientific calculation methods for related research. 2) The investigation of the influence of the digital economy on ecological performance, combined with the discussion of its spatial spillover effect from the perspective of spatial economics, confirmed the role of the digital economy in building an environmentally friendly society. 3) According to the level of economic development, China was divided into eastern regions and central and western regions for discussion. In fact, this was also in line with the actual situation of most developing countries: not all regions had a good digital economy foundation. The results of the heterogeneity analysis also provided empirical evidence for many other developing countries.
The article is structured as follows: the relevant literature, theoretical analysis, and hypotheses are given in Section 2. In Section 3, the measurement system of the digital economy index and ecological performance index was constructed, and the results were calculated. The construction of the regression model and the data sources are displayed in Section 4. The role of the digital economy on ecological performance is empirically tested in Section 5, with the discussion of the time lag, regional heterogeneity, and endogeneity. Further discussion, conclusions, and policy recommendations are given in Sections 6, 7.
The concept of the digital economy was first proposed by Don (2022). At that time, he used it to refer to the various new economic relationships that emerged after the advent of Internet technology. Since then, with the development of Internet technology, the digital economy has gradually attracted widespread attention from the academic community. Lane (1999) pointed out that the widespread growth of e-commerce, new competitive strategies, and changes in organizational structure were precisely caused by the digital economy. Driven by the combination of information, computing, and communication, the digital economy was considered to have a great influence on the Internet industry.
However, some scholars believe that the essence of the digital economy is digital trade in goods and services and view it as a new economic model derived from the traditional economic model, Teo (2001); Kim (2006) gave a broader definition: the economic development model is driven by information and communication technology. He pointed out that the digital economy could effectively improve the organizational form of enterprises and the cooperation efficiency of various departments (Balcerzak and Pietrzak, 2017). In addition, Mentsiev et al. (2019) thought that the digital economy was a commercial and trade activity based on the Internet. E-commerce is a representative form of the digital economy. Most scholars believe that the digital economy has benefited from the development of information technology. It could promote production and consumption through the replication and sharing of data elements; Li et al. (2021); Li and Liu (2021); Miao (2021) proposed that the digital economy was a collection of industrial digitization and digital industrialization, including the transformation and upgrading of traditional industries by data elements and new industries derived from digital technology (Miao, 2021). In addition, studies have shown that the digital economy has a significant positive impact on environmental quality, sustainable economic development, and the health of the population (Lange et al., 2020; Wu et al., 2022; Wang et al., 2022d).
With increasingly serious environmental problems, people have attempted to use fewer resources to produce more profits. “Ecological performance” is often used to measure the relationship between resources and benefits to evaluate the use efficiency of natural resources. The concept of “ecological performance” was first proposed by Bruce and Rupert (1983). They aimed to create a more reasonable evaluation index system and calculation model to measure the benefits produced by the use of natural resources. For a long time, many scholars all over the world have had a heated discussion on this concept that used four ecological performance indicators to quantify the influence of the use of natural resources on the ecological environment (Whitford et al., 2001). Mickwitz et al. (2006) proposed that ecological performance, as a ratio between economic benefits and resource consumption, could be used to detect the changes in ecological situations in a region (Mickwitz et al., 2006).
With the deepening of research in this field, the index selection and calculation method of ecological performance have been gradually improved using the superefficient data envelopment analysis (DEA) model to measure the ecological performance of Chinese cities. The results showed that there was an N-shaped relationship between resource consumption and ecological performance (Bai et al., 2017; Biswas and Farzanegan, 2012). Estimated ecological performance from different perspectives and measured resource use efficiency in the context of urban development (Chen et al., 2020; Copeland and Taylor, 1994). To calculate the ecological performance, China’s ecological footprint was taken as the sample. Using the empirical method of a dynamic panel regression model, they revealed that the improvement of resource utilization efficiency would have a positive effect on ecological performance (Dong et al., 2020). Although the selection of ecological performance evaluation indicators in the existing results was different, the research methods and models were relatively similar.
Research on the digital economy and ecological performance by scholars in various fields can be divided into two areas, the effects of the digital economy on resource saving and the digital economy on pollution reduction. On the one hand, it is argued that the development of the digital economy has increased the level of production technology, which has led to a reduction in energy consumption. Specifically, the digitalization of production processes enables manufacturers to better manage consumables including energy and production materials. Computer science and technology can help planning departments allocate these resources more rationally and avoid waste in production activities. In addition to the production sector, digital technology can also affect the distribution sector. With the help of Internet technology, the efficiency of logistics has been greatly improved. Transactions between buyers and sellers have become much easier. This has stimulated market consumption to a large extent. Unlike traditional distribution and sales activities, the data element acts as the medium for completing these transactions, and its costs are almost negligible. In other words, the resources previously spent on this part of the consumption have been saved. At the same time, digitalization has highlighted the role of communication technology in economic activity. Some unnecessary commuting and gatherings are replaced by electronic communication, reducing the energy consumption of economic collaboration activities. This shows that the development of the digital economy can be effective in saving resources and improving energy efficiency (Zhong et al., 2021).
Another aspect is the mechanism of the impact of the digital economy on pollution reduction. From the production side, the development of the digital economy can effectively alleviate the problem of information asymmetry. This has led to greater mobility of technological factors and promoted cooperation and innovation in production technology (Jaffe et al., 2002; Yang et al., 2022b). This means that manufacturers will be more productive and the pollution emissions from the production process will be reduced. Specifically, manufacturers can use platforms such as the Internet to quickly exchange technical issues, form stable cooperation, and expand the added value of their goods. According to the Porter hypothesis, manufacturers can invest this capital in research and development. This will lead to more improved and cleaner production techniques (Wang et al., 2022e). Similarly, in the process of digitalization, environmental regulation has given rise to many new forms. For example, with the help of Internet of Things (IoT) technology, it is possible to monitor the situation regarding the generation and treatment of pollutants in real time. The production department can use its feedback to adjust the scale of production. This technology can also be used in the collection and analysis of environmental monitoring data, using cloud computing to quickly access environmental pollution data in the area (Chen et al., 2022). On this basis, the environmental quality and pollutant emissions are analyzed. This helps the government curb the excessive emissions of some enterprises in a timely manner. We speculate that the development of the digital economy can curb pollution emissions.
Figure 2 shows the possible impact of the digital economy on ecological performance more clearly. Therefore, we believe that the digital economy is closely related to both resource conservation and ecological quality and propose H1 in this regard: The digital economy can effectively improve ecological performance.
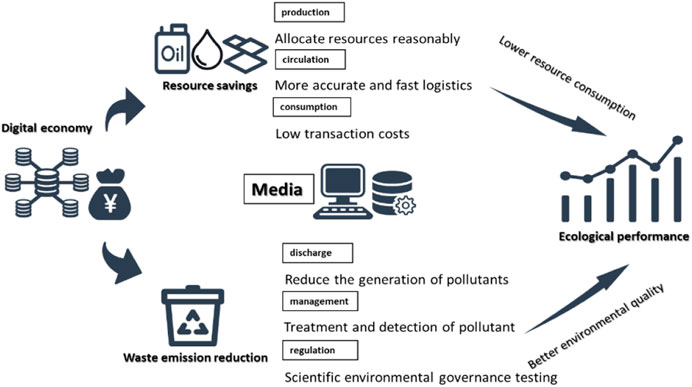
FIGURE 2. Mechanisms of the digital economy to ecological performance.
There is a significant feature in data elements, that is, strong liquidity. When different production departments work together, data elements can be transferred with little time, thus improving the efficiency of information exchange. As shown in Figure 2, another key point is that the transmission of data elements is not limited by geographical distance. The digital economy forms spatial spillovers through three channels. The first channel is the use effect. For example, the digital economy can drive the construction of information and communication service facilities in surrounding areas (Shahnazi and Dehghan Shabani, 2019). The second channel relates with derivatives of the digital economy that have an effect on relevant developments in various regions. These effects are known as substitution effects, which replace physical goods with virtual goods. Virtual mobile, e-commerce, e-government, e-shopping, remote work, e-banking, e-commerce, virtual education, and virtual conferencing are all alternative forms (Jorgenson 2001; Toffel and Horvath 2004; Schmidt and Kløverpris 2009). The last channel is cost-effective. The cost of data transmission, processing, computing, and storage continues to decline as digital technologies continuously evolve (Goldfarb and Tucker, 2019). Therefore, driven by the digital economy, the possibility of data elements being transferred to other regions is also greatly increased.
As shown in Figure 3, as the level of production cooperation improves, interregional cooperation becomes the mainstream form of regional economic development. Projects such as natural gas transmission from west to east China, the West–East electricity transmission project and the South-to-North Water Diversion are typical cases of cross-border cooperation in resources.
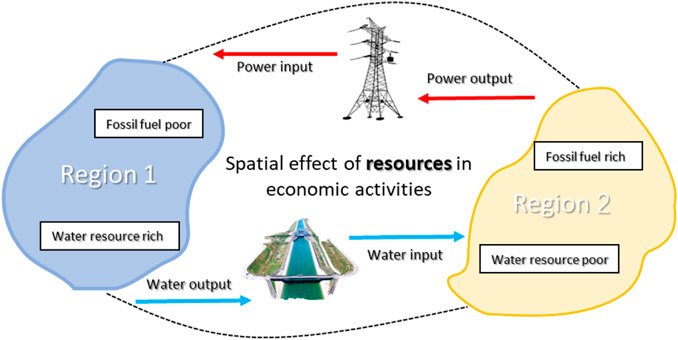
FIGURE 3. Spatial effect mechanism of resource consumption.
However, the difference in the technological level and resource distribution among regions causes a certain gap in the industrial structure and economic development level. Consequently, regional economic cooperation has also brought some unexpected environmental problems. Most intuitively, the wastewater generated by the upstream plant is likely to cause diffuse pollution to other areas downstream. Undoubtedly, it increases the sewage treatment cost in the downstream area. In addition, some factories have been relocated to the edge of the city under the consideration of the cost of environmental restoration. Their exhaust gas may diffuse with the atmosphere and eventually form cross-border pollution with other pollutants in the air (so called the spatial agglomeration effect of environmental pollution) (Sun et al., 2020; Sun et al., 2022). Figure 4 depicts the spatial effects of environmental pollution.
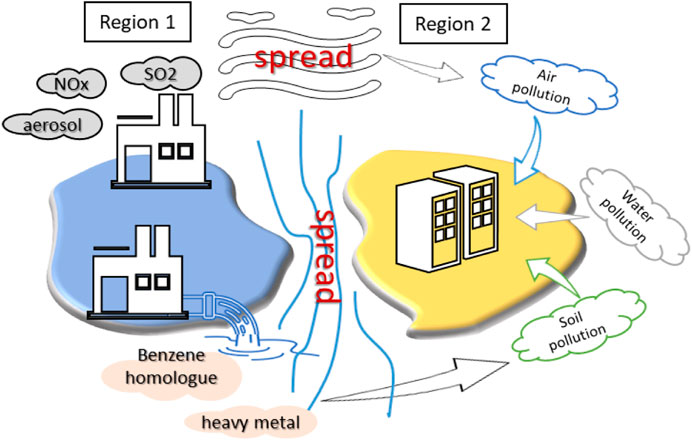
FIGURE 4. Spatial effects of environmental pollution.
Similarly, we propose H2: there is a spatial spillover effect of the digital economy on ecological performance.
At present, several indicators have been proposed to measure the development of the digital economy. Li et al. (2021), referring to the standards issued by the Ministry of Industry and Information Technology of China and Tencent Research Institute, constructed a set of evaluation systems from three levels: digital talent, digital infrastructure, and digital industry value (Li et al., 2021). In addition, some indicators that consider the development level of the Internet and digital finance have also been put forward in several studies. However, there is no widely used indicator to measure the development of the digital economy. Consequently, a scientific, objective, and comprehensive digital economy index measurement system was certainly needed. Based on these studies, the digital economy was divided into three parts: “information infrastructure,” “digital industrialization level,” and “industrial digitization level.”
Among the three parts, the information infrastructure is viewed as the basis of the development of the digital economy. It mainly included the length of optical cable lines, the number of mobile Internet users, and the number of 4G users. These selected indicators could objectively reflect the scale of demand for information and communication services and the activity of the digital economy in the region. The development of industries such as e-commerce, software business, and software products, formed by using information technology, is the performance of digital industrialization. Hence, indices such as the number and sales of e-commerce enterprises, software business income, software product income, and the total assets of the electronic information manufacturing industry were taken into consideration here. For the last part, industrial digitization refers to the utilization level of digital technology by enterprises. The expenditures on technology introduction, technology improvement, computers per 100 people, and websites per 100 enterprises were selected to quantify the level of digitization in this part. The specific indicators are shown in Table 1, and the relatively objective entropy method was selected for the determination of weight (Li et al., 2021).
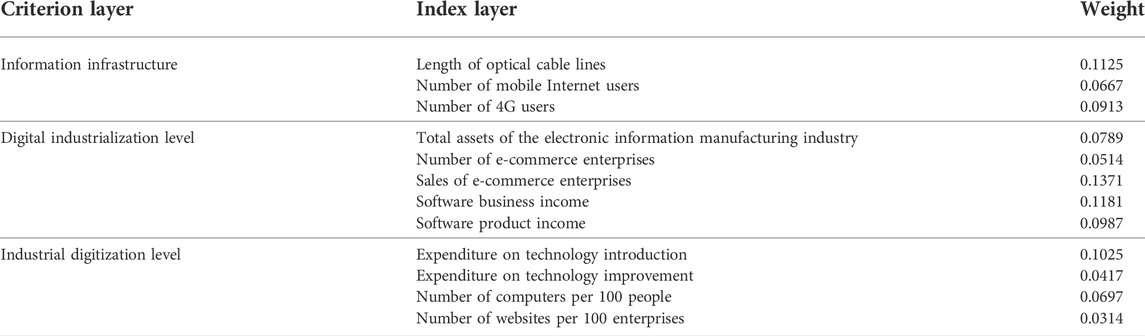
TABLE 1. Digital economy index system.
The specific calculation for the entropy method is as follows:
Calculate the characteristic proportion degree in the ith year under the jth index:
Calculate the entropy of the jth index:
Coefficient of difference calculation:
Determine the weight of evaluation index:
Three representative years: 2013, 2016, and 2019 were chosen in this article (Figure 5):

FIGURE 5. Digital economy index of each province for 2013 (A), 2016 (B), and 2019 (C).
The results of the digital economy index calculation show that there are significant spatial differences in the development of the digital economy across provinces, with significant local clustering characteristics, such as the Yangtze River Delta region and the Pearl River Delta region. The Yangtze River Delta and Pearl River Delta regions are mostly in the red zone, which indicates a high level of digital economy development in these regions. However, the western (north-western) region is in the blue zone, where the level of digital economy development is relatively low, especially in Xinjiang and Qinghai provinces. In terms of time, the overall differences in the development of the digital economy in the provinces have narrowed, and in terms of the speed of development, the central region is the fastest, followed by the western region, with a gradual convergence of characteristics between regions. It is worth noting that the level of digital economy development in each region has grown in tandem with economic development. By 2019, the blue areas decreased while the orange areas continued to increase, which indicates a gradual increase in the level of digital economy development in these regions. Some regions, Beijing, Shanghai, and Guangdong, still maintain a high level of digital economy development. Overall, China’s digital economy is gradually showing relative spatial stability, and there are some ups and downs in the development of the digital economy in some regions. However, overall, the development of the digital economy is gradually improving in all provinces.
There are a number of approaches to measuring ecological performance, and we have compared these approaches, as shown in Table 2:

TABLE 2. Relevant measurement methods of ecological performance.
In the current study, the calculation of the eco-performance index can be broadly divided into two categories, the ratio method and the input‒output model method (Dyckhoff and Allen, 2001; Dahlström and Ekins, 2005). In contrast, scholars prefer input‒output modeling approaches, such as DEA, to evaluate ecological performance (Ge et al., 2022). There are two traditional forms of DEA models, CCR and BCC, which are unable to measure the full range of undesirable output. Compared to traditional DEA models, the SBM model has the advantage of successfully addressing the neglect of slack variables in the process of efficiency evaluation by radial models. The SBM model is a model that allows both desirable output and undesirable output to be considered. However, the result of the SBM model cannot be greater than 1. As a result, Anderson and Petersen (1993) integrated a new model, the super efficiency model (DEA-SEM), based on a modification of the traditional DEA model. In this method, the efficiency value can be greater than one to better distinguish its efficiency. The Super-SBM model is a combination of the super efficiency and SBM models. Among these submodels, the Super-SBM method considers both undesirable output and super efficiency and is considered a more appropriate method. Therefore, a set of measurement systems of ecological performance was built based on the Super-SBM method, according to researchers (Dong et al., 2020; Ge et al., 2022). The inputs, desirable and undesirable outputs used here are given in Table 3. The specific calculation for the DEA-SBM model is as follows:
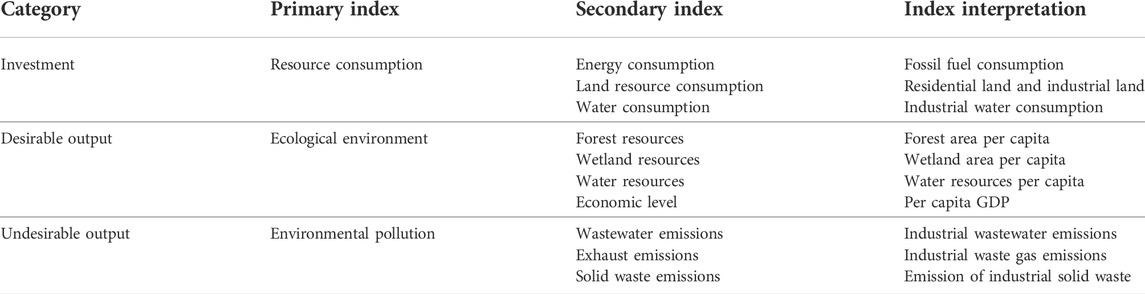
TABLE 3. Ecological performance index calculation system.
Suppose there is a set, D (DMU), composed of n decision units, with three sets of vectors defined as
Then, there are matrices
where
Then the super efficiency SBM model with undesirable outputs is constructed as follows:
If the result is less than 1, it means efficiency regression. If the result is greater than 1, efficiency is progressive.
Among the input indicators, the consumption of three major resources is mainly energy consumption, land resource consumption, and water resource consumption. In terms of expected output, we use the three indicators of forest resources, water resources and wetland resources to measure them. However, to better describe the synergistic relationship between these resources and the economy, we have included per capita GDP on the original basis to reflect the effect of resource consumption on the economy (Sun and Loh, 2019; Sun et al., 2020). In addition, in the unexpected output, we use the three indicators of industrial wastewater, industrial waste gas, and industrial waste (Wang et al., 2020; Wu and Zhang, 2021). Similarly, we select three representative years: 2013, 2016, and 2019 (Figure 6).
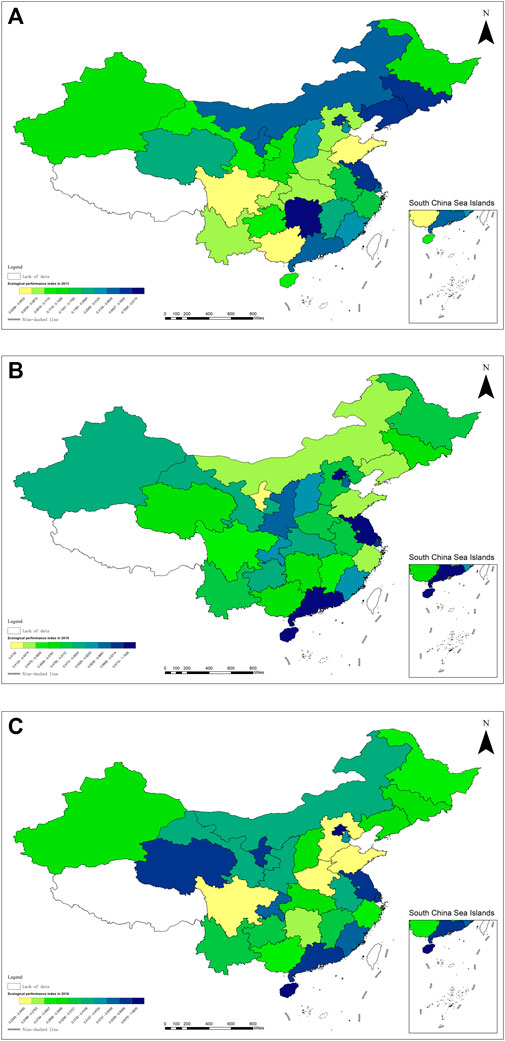
FIGURE 6. Ecological performance index of each province for 2013 (A), 2016 (B), and 2019 (C).
To investigate the effect of the digital economy on ecological performance, a benchmark regression model was constructed, with the following equation:
where i is the individual, t is the time, ep represents the ecological performance, and lnde stands for the natural logarithm of the digital economy index. Cit is a series of control variables that may affect ecological performance except for the digital economy.
According to Hypothesis 2 (H2 in Section 2.4), the digital economy may have spatial spillover effects on the ecological performance of surrounding areas due to its strong spatial externalities. However, traditional econometric models mainly consider analyzing the effects of independent variables on themselves and do not consider spatial interaction effects, which may lead to estimation errors (Moshiri and Cameron, 2000). It is therefore necessary to develop a spatial model. In spatial econometrics, common models are the spatial error model (SEM), the spatial lagged model (SLM), and the spatial Durbin model (SDM) (Wu et al., 2021; Liu et al., 2022). In these models, SEM is unable to account for spatial spillover effects (Yildirim and Mert Kantar, 2020). Whereas the direct effect of SLM is equal to the spillover effect, and the coefficient estimates may be biased. The SDM, on the other hand, not only provides a more comprehensive measure but also takes into account the bias of the model estimates at the same time. More importantly, it considers both the spillover effects of the independent variables on the dependent variables in the surrounding area and reveals the impact that the independent variables in the surrounding area have on their own dependent variables (Tang et al., 2022). However, spatial econometric models are not without their limitations. For example, there is a high degree of subjectivity, and the choice of spatial matrix depends entirely on the author. In particular, the economic matrix, with regard to the choice of economic variables within it, determines the distances of each geographical unit (unlike the neighborhood matrix and the geographical distance matrix). The distances of the economic matrix are variable, which makes it difficult to derive a general pattern of results and makes it necessary to take more factors into account in the interpretation of the results. Nevertheless, SDM is still the most widely used model. Hence, Eq. 2 could be given based on SDM to investigate the spatial spillover effect of the digital economy on ecological performance.
In addition to the variables mentioned in Section 4.1, ρ,
To ensure the accuracy of the results, it is necessary to select the appropriate spatial weight matrix before spatial regression analysis. In this study, three common matrices, the geographical adjacency matrix, inverse-distance weight matrix, and economic distance weight matrix, were chosen. The geographic adjacency matrix was used for regression estimation, and the inverse-distance weight matrix was introduced because resource consumption and environmental pollution might form diffusion or agglomeration effects in space. Ultimately, since there might be a large correlation between the development level of the digital economy and the level of the regional economy, the economic distance weight matrix was taken into consideration as well.
In different matrices,
(1) In the ground adjacency matrix (W1), spatial correlation is related to the existence of a common edge. If space adjacent regions i and j have a common border, then
(2) In the inverse-distance weight matrix (W2), the spatial correlation decreases with increasing distance.
where dij is the geographic distance between region i and region j.
(3) In the economic distance weight matrix (W3), the closer the economic level of the two regions is, the greater the spatial correlation is, and vice versa. Its equation is as follows:
where Ei and Ej are the per capita GDP of region i and region j, respectively.
Other factors that might affect ecological performance were also considered here:
a) Urbanization rate (UR): the urbanization process itself may lead to a large amount of resource consumption demand. However, it can also promote the development of industrialization and realize cleaner industrial production (Sadorsky, 2013) to improve environmental quality. The proportion of the urban population in the total population was introduced to measure UR.
b) Degree of openness (DO): opening to the outside world can attract some advanced energy-saving and emission reduction technologies for more “green production” (He (2006)) (Jie, 2007), which may have a positive effect on ecological performance. DO was measured by the logarithm of local FDI.
c) Industrial structure (IS): the industrial sector is the most important source of pollution emissions. Consequently, the greater the ratio of the secondary industry in the structure is, the greater the pollution emission is (Shao et al., 2011), and ecological performance will decrease. IS was measured by the ratio of industrial added value to GDP.
d) Innovation degree (ID): invention patents can reflect the level of production technology and then reflect the efficiency of resource utilization (Zhou et al., 2021), which would have a positive effect on ecological performance. The logarithm of the number of patent licenses was selected to measure the level of ID.
e) Per capita GDP (PCG): digital technology innovation would enhance the progress of ecological performance and be related to the level of economic development. As a result, the logarithm of per capita GDP was taken into account (Shao et al., 2011) to evaluate the degree of PCG.
Under the constraints of data availability, to ensure the reliability, accuracy, and results, this study was based on a balanced panel dataset of 30 provinces in mainland China observed over 2013–2019. The statistical data were derived from China’s authoritative database, including CSMAR and ESTDA. The missing data were supplied through the China Environmental Yearbook and China Statistical Yearbook. The descriptive statistics of each variable are shown in Table 4.
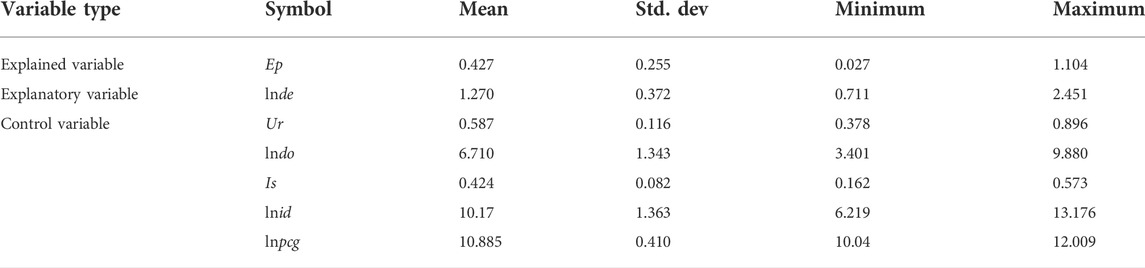
TABLE 4. Descriptive statistics of each variable.
Before spatial regression, the test of the spatial correlation is necessary. Spatial statistical analysis of the Moran index was mainly adopted in this article. The global Moran index (Moran’s I) can describe the overall spatial correlation of variables, which is between −1 and 1. When the result is greater than 0, it means a positive correlation, and vice versa. Table 5 shows the results of the global Moran index of lnde and ep, which were all positive. Except for 2019’s ep in W3 (passing the significance test at the 10% level), the lnde and ep in the three spatial weight adjacency matrices all passed the significance test at the 5% level. This indicated that there was a positive correlation between the digital economy and ecological performance in space. To more intuitively show the spatial relationship between the samples, we drew Moran scatter plots in 2013, 2016, and 2019 under the W2 matrix, as shown in Figure 7.
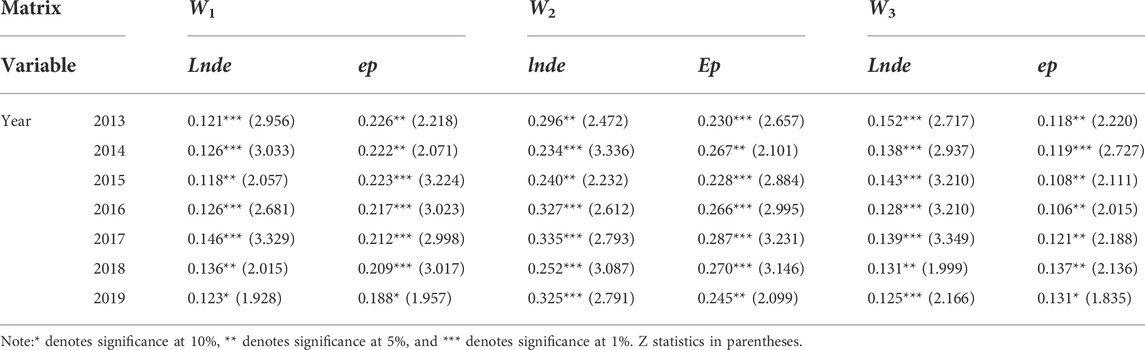
TABLE 5. Global Moran index of digital economy and ecological performance (2013–2019).
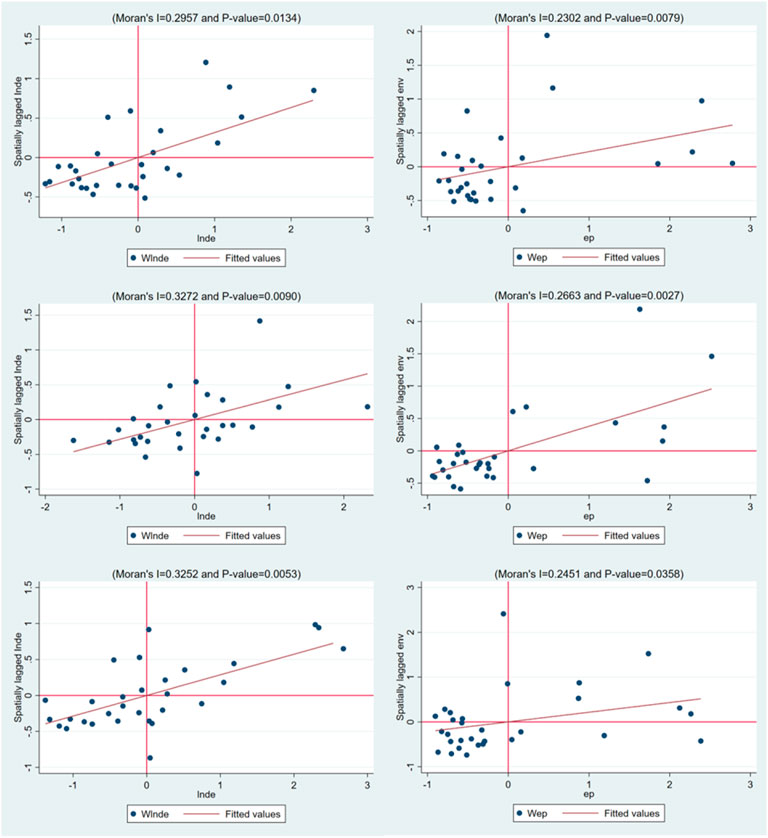
FIGURE 7. Moran scatter of ep and lnde in 2013, 2016, and 2019. Note: the variable on the left is the digital economy, and the variable on the right is ecological performance. From top to bottom, the years of each picture are 2013, 2016, and 2019.
As a comprehensive spatial econometric model, SDM can obtain a more refined spatial spillover relationship between variables through total effect decomposition, which is conducive to the accurate analysis of the actual situation. The LM test was adopted to judge whether the panel data are applicable to SDM, and the results rejected the original hypothesis at the 1% level. Furthermore, the results of the Wald test showed that SDM could not be simplified to SEM and SLM. Column (1) in Table 6 displays the regression results of the basic econometric model, and its measurement results were used to analyze H1. Columns (2)–(4) show the regression results of the SDM combined with three spatial weight matrices. Similarly, its measurement results were used to discuss H2.
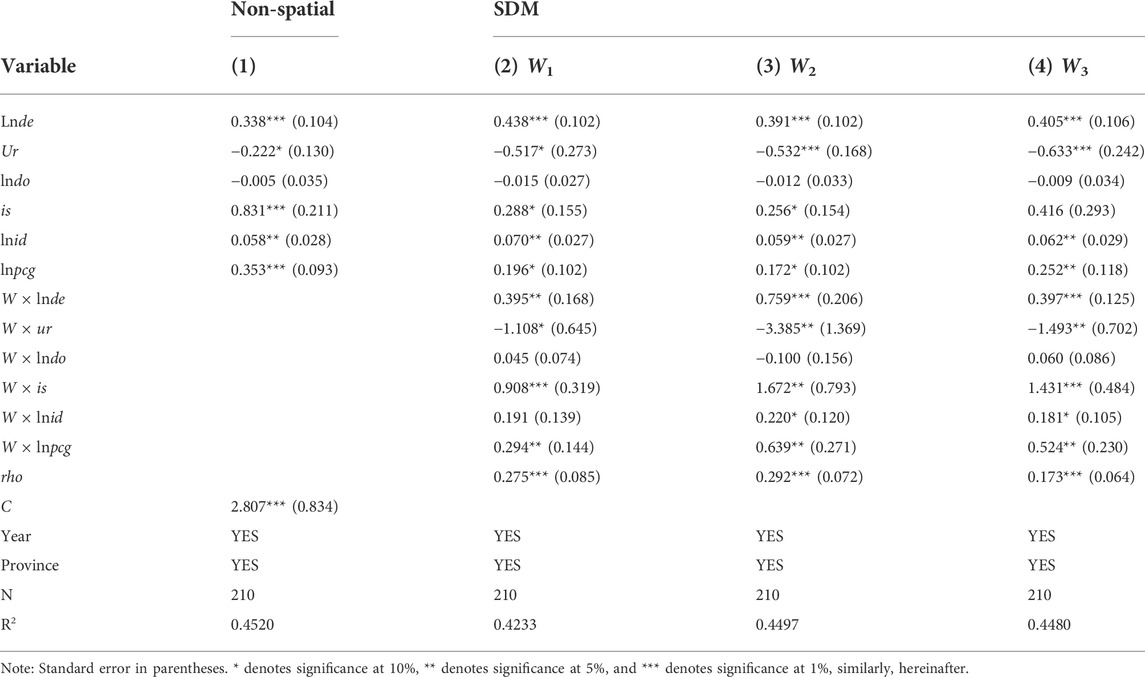
TABLE 6. Regression results.
Based on the aforementioned results, first, regardless of whether spatial effects were considered, the influence coefficient of the digital economy on ecological performance was positive and significant at the 1% level. Among them, the regression coefficient considering the spatial effect was higher. This showed that some real effects would be ignored without considering the spatial correlation of the digital economy, and the positive effect of the digital economy on ecological performance would consequently be underestimated. From the regression results of the three different matrices, the regression coefficient is approximately 0.4, which indicates that the estimation result is relatively robust. This suggests that the development of the digital economy can improve the level of ecological performance. This also means that the digital economy can offer higher environmental benefits in exchange for lower energy costs.
Second, from the perspective of the spatial spillover effect, the development of the digital economy could promote the development of local ecological performance in both geographically and economically adjacent areas. This showed that the digital economy had very strong and positive externalities. According to the regression coefficient, one of the geographic distance matrices was highest, showing that the spatial transmission of this effect depended more on geographical distance. This indicated that the digital economy and ecological performance were more relevant in the geographical matrix, which was in line with the results in Table 4. Therefore, the spillover effects of the digital economy continue to diminish as distance decays. This could well explain the apparent disparity between the eastern and central-western regions. This shows that the digital economy still has one of the characteristics of economic activity, the agglomeration effect.
Finally, in terms of the results of the control variables, UR had a significant negative effect on ecological performance in models (1)–(4). This showed that the growth of the urban population stimulated regional resource consumption and intensified pollution emissions. It also had a significant spillover effect in space. In contrast, almost all ISs, IDs, and PCGs had significant positive effects with a forward overflow in space as well. In addition, the degree of DO did not pass the significance test, so we would not discuss it further.
Since the spatial Durbin model takes into account the explained variables and explanatory variables in different geographical units, it will produce a spatial lag and cause some errors in the estimation results. We need to decompose the regression coefficient into direct effects, indirect effects, and total effects (Li et al., 2016) (Shahnazi and Dehghan Shabani, 2019). Table 7 shows the effect decomposition results of core variables under three matrices.
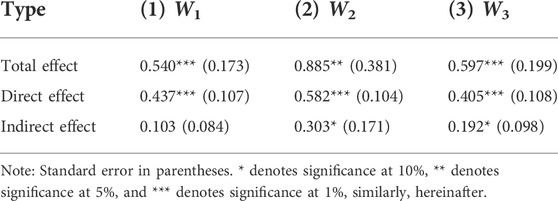
TABLE 7. Estimated results of total, direct, and indirect effects.
The results from Table 7 demonstrated that the digital economy actually had a significant direct effect on ecological performance. In the three matrices, both the total effect and the direct effect showed positive and significant results, while the significance of the indirect effect was relatively poor. The coefficient of the direct effect was significantly higher than that of the indirect effect, which indicated that the digital economy had a greater effect on itself. Meanwhile, it could be found that the direct effects of results obtained by decomposition and its coefficients were not equivalent. This might be caused by the existence of feedback between regions due to the correlation of the digital economy.
The previous section verified that the digital economy had a positive impact on ecological performance. As an informal economy, the digital economy has a continuous impact on ecological performance. Considering the lag in the construction of digital economy infrastructure and the upgrading of communication technology services, it was necessary to further analyze whether the influence of the digital economy on ecological performance lagged behind. Referring to the work of Li et al. (2016), a dynamic Durbin model was built for the lag of the digital economy in 1 phase, followed by regression (Li and Wu, 2016). Table 8 shows the regression results.
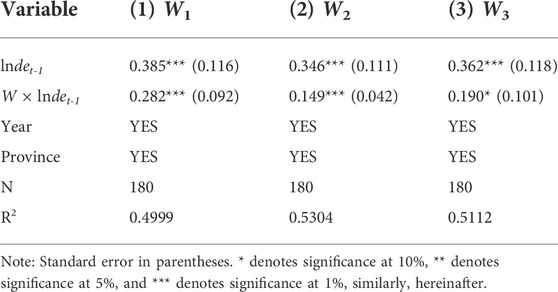
TABLE 8. Regression results of the lag effect.
According to Table 8, the positive effect of the digital economy on ecological performance was significant and lagged behind. This conclusion was applicable to all three spatial matrices, indicating that the estimation results were robust. Similarly, it was also true in the spatial spillover effect, that is, the positive effect of the digital economy on the ecological performance of surrounding areas also lagged behind. The development of the digital economy is closely related to the progress of Internet technology and the development of the information and communication industry. However, the research and development of Internet technology requires a certain process. Similarly, the growth of the scale of the information and communication industry is relatively slow. Therefore, the digital economy itself has strong development inertia. At least, from the samples from 2013 to 2019, the positive effect of the rapid development of the digital economy on the development of an environmentally friendly society was obvious.
Like most developing countries in the world, China’s development also had very obvious regional characteristics. In China, the development of coastal areas was better than that of inland areas. Correspondingly, the development of the digital economy was highly correlated with the regional economic level, which could be proven by the results in Figure 5 that some regions with a high index were distributed in eastern China. Thus, it was important to discuss the heterogeneity of the digital economy on ecological performance in different regions. In this section, the heterogeneity between developed and developing regions in the same region is further examined, with a comparison between more developed eastern regions and less developed central and western regions. The eastern region included ten provinces, including Hebei, Beijing, and Tianjin, while the central and western regions included 20 provinces other than Tibet. The statistical caliber of Taiwan, Hong Kong, and Macao was different from that of other provinces, and there was a large lack of data in Tibet, so they were not discussed in the heterogeneity analysis.
As shown in Table 9, the regression coefficient of the digital economy was significantly positive in both the eastern region and the central and western regions. However, the coefficients of the eastern region were slightly higher than those of the central and western regions, which indicated that the digital economy had a higher marginal contribution to ecological performance in regions with a higher level of economic development. This illustrated that the positive role of the digital economy in promoting ecological performance was more obvious in developed regions. From the perspective of the spatial spillover effect, the coefficient and significance of the eastern region were also better than those of the central and western regions. This suggests that in areas where the digital economy is less developed, their impact on ecological performance is limited. The digital economy is unable to create agglomeration effects to reduce resource consumption or curb pollution emissions. This also reflects the heterogeneity of the digital economy on the regional ecological environment. Only when the development of the digital economy reaches a certain threshold it will be able to exert a positive effect on ecological performance.
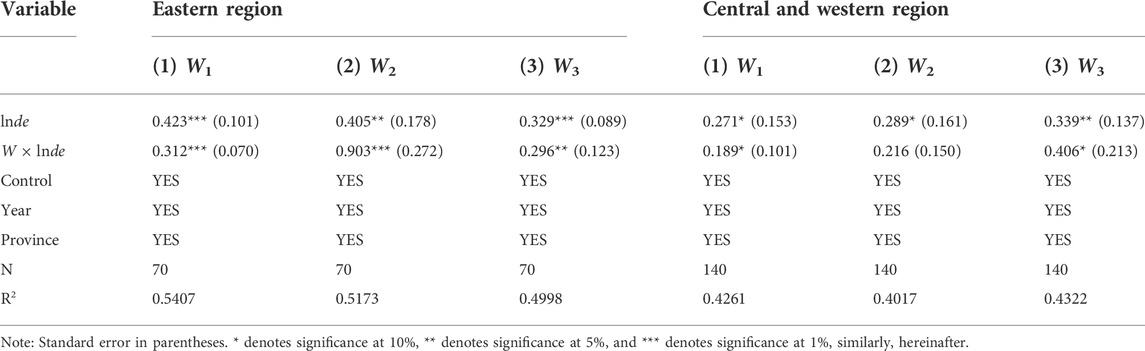
TABLE 9. Regression results of the lag effect.
To solve the possible endogenous problems in the model, appropriate instrumental variables were required for the core explanatory variable, namely, the digital economy. The instrumental variables needed to meet the exogenous and correlation requirements at the same time. Based on the practice of Zhou et al. (2021), the logarithm of post and telecommunications business volume (lnpt) were selected as the explanatory variable and instrumental variable of the digital economy (Andersen and Petersen, 1993). On the one hand, the post and telecommunications business could reflect the local information and communication infrastructure level. On the other hand, the influence of the use of traditional telecommunications tools, such as fixed-line telephones, on economic development should meet the exclusivity. With the continuous development of the digital economy, the frequency of traditional communication showed a downward trend, which could be regarded as a suitable tool variable. Considering that the robustness test is to examine the rationality of the core explanatory variables, the spatial effect was excluded from the consideration. The results are given in Table 10.
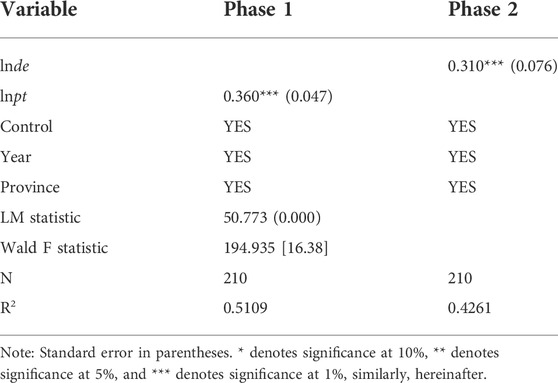
TABLE 10. 2SLS test results.
For the test of the null hypothesis of insufficient identification of instrumental variables, the LM statistic p value was 0, which rejected the null hypothesis. Meanwhile, in the Wald test, the F statistic was 194.935, indicating that there was no problem with weak instrumental variables. The coefficient and significance did not change significantly after considering endogeneity, showing that the effect of the digital economy on ecological performance was still robust.
Obviously, the results we obtained are very similar to many related studies, again all proving that the digital economy (or ICT, Internet, etc.) is an environmentally friendly economy (Ren et al. (2021); Wang et al., 2022) (Gollop and Roberts, 1983; Zhou et al., 2020; Wang et al., 2022a). However, our results also differ in some interesting ways from some related studies, most notably from the EKC curve, which suggests that economic development and environmental pollution should follow an “inverted U-shape.” Therefore, further discussion of this study is needed. In this study, ecological performance is not the same as environmental pollution or resource consumption. It combines considerations of both. As the calculation process of the Super-SBM model is a black box, it is not possible to specify the reasons for the changes in the ecological performance index. It is clear from the SBM data that all expected outputs gradually increase. In this case, if resource consumption decreases while environmental pollution increases, it is clear that ecological performance decreases. However, if resource consumption and environmental pollution are reduced at the same time, changes in ecological performance will be determined by production technology factors, and the digital economy is a new type of factor in this category. The different relationships between ecological performance and economic development derived from this study are therefore justified because ecological performance and environmental pollution are measured in different ways.
Indeed, the measurement of the digital economy is likewise a possible limitation in the study. As it is a novel concept, much of the data were missing until 2013. We are unable to judge the impact of the digital economy on ecological performance prior to 2013. In addition, although we divided the different samples in our heterogeneity test, we came to different conclusions. However, it is important to note that these regions are in reality fully bordered, meaning that the spillover benefits of the digital economy in the east also affect the central region. Therefore, we may be overestimating the positive effect of the digital economy on ecological performance in developing regions.
In this study, we measured the level of the digital economy and the level of ecological performance in 30 Chinese provinces. We found that, overall, China’s eastern regions have higher levels of digital economy development, which is in line with the true picture of China’s economic development. Unlike the digital economy, the level of ecological performance increased more in the southern regions of China over the period from 2013 to 2019. In 2019, ecological performance was high in the southern regions and low in the northern regions. Furthermore, we analyzed the impact of the digital economy on ecological performance. We found that the digital economy has a positive effect on ecological performance overall and has a strong spatial externality. This finding holds for changing the geographical weight matrix, which indicates that the results are generalizable. Dynamically, the positive effect of the digital economy on ecological performance has a lag, suggesting that the digital economy has certain inertia of influence on ecological performance. By region, this result is better in the eastern region (higher regression coefficient). In contrast, it is relatively weaker in the central and western regions.
The aforementioned results suggest that the digital economy played an important role in improving energy efficiency and reducing pollution during the period 2013–2019. With the rapid flow of data elements, a strong network effect can be created, thus contributing to the improvement of the ecological performance of the surrounding areas. The higher level of development of the digital economy in the eastern region has a more significant impact on ecological performance. This provides strong empirical evidence for the potential of the digital economy in the central and western regions. In other words, when the digital economy in the western region rises to a certain level, the improvement in ecological performance will also be more pronounced.
From the aforementioned results and analysis, we offer the following policy recommendations: 1) for regions with a more developed digital economy, the digitization process needs to be realized as soon as possible to transform the traditional economic model into a new digital economic model. Specifically, the government should focus on the role that e-commerce, especially cross-border e-commerce, plays in trade. Subsidies should be provided to relevant enterprises according to existing policies to reduce the pressure on their development. At the same time, the government needs to breakdown some rigid policies to provide a better trade environment for enterprises. In addition, the government can facilitate the digital transformation of enterprises through different standards of environmental regulation. For companies involved in the data and information industry, the standards are relaxed. For some traditional enterprises, the standards are maintained intact or can even be raised. This can be a good way to exploit the positive effects of the digital economy on the ecological environment and thus improve the environmental quality of the region (Abbass et al., 2022). 2) However, for some regions where the development of the digital economy is relatively weak, it is necessary to balance the relationship between digital transformation and economic production. Until a certain level of economic production is reached, the marginal benefits of digitalization on ecological performance are not high; therefore, a large number of factors of production should not be invested in the digital transformation process. Local governments need to make judgments in this decision-making process in the context of the actual situation. This is because the energy consumption resulting from the digital economy can easily cause ecological pressure overload. Therefore, prior to a full digital transformation, pilot developments can be carried out in regions with a relatively good economic base. For these regions, the most direct way is to directly import mature enterprises and technologies from developed eastern regions (Shakib et al., 2022). 3) The last point is that the digital economy has strong spatial externalities, which suggests that the development of the digital economy in developed regions can have a driving effect on neighboring regions. Considering the extremely low cost of data factors, some economic collaboration between different regions can be achieved through the digital economy, thus effectively reducing the cost of building a digital economy in less developed regions. In addition, governments in all regions should be aware of the spillover effects of pollution. When faced with some pollution that may cause spillover, joint efforts should be made to combat it as much as possible. In the process of gradually narrowing the regional digital economy gap, it is also important to prevent harm to the ecological environment of the surrounding areas (Murshed et al., 2022).
The raw data supporting the conclusion of this article will be made available by the authors, without undue reservation.
XS, HZ, and JY contributed to the work equally, and should be regarded as co-first authors. All authors contributed to the study conception and design. All authors commented on previous versions of the manuscript. All authors read and approved the final manuscript. 1. XS is responsible for overall conception and article writing 2. HZ is responsible for calculation of the regression model and article writing 3. JY is responsible for results analysis and article writing 4. ZW is responsible for data collection and language quality assurance 5. TH is responsible for literature collection 6. JL is responsible for improvement and calculation of the DEA model.
This study received financial support from the science and technology research project of Henan province (Grant No. 222102240071), Henan philosophy and social science planning project (Grant No. 2021BFX034), and Key scientific research projects of universities in Henan province (Grant No. 22B630015).
The authors declare that the research was conducted in the absence of any commercial or financial relationships that could be construed as a potential conflict of interest.
All claims expressed in this article are solely those of the authors and do not necessarily represent those of their affiliated organizations, or those of the publisher, the editors, and the reviewers. Any product that may be evaluated in this article, or claim that may be made by its manufacturer, is not guaranteed or endorsed by the publisher.
Abbass, K., Qasim, M. Z., Song, H., Murshed, M., Mahmood, H., and Younis, I. (2022). A review of the global climate change impacts, adaptation, and sustainable mitigation measures. Environ. Sci. Pollut. Res. 29, 42539–42559. doi:10.1007/s11356-022-19718-6
Acemoglu, D., Aghion, P., Bursztyn, L., and Hemous, D. (2012). The environment and directed technical change. Am. Econ. Rev. 102, 131–166. doi:10.1257/aer.102.1.131
Adha, R., Hong, C.-Y., Agrawal, S., and Li, L.-H. (2022). ICT, carbon emissions, climate change, and energy demand nexus: The potential benefit of digitalization in Taiwan. Energy & Environ. doi:10.1177/0958305X221093458
Anasuya, H., and Narayan, S. (2022). Environmental effects of Information and Communication Technology - exploring the roles of renewable energy, innovation, trade and financial development. Renew. Sustain. Energy Rev. 153, 111754. doi:10.1016/j.rser.2021.111754
Andersen, P., and Petersen, N. C. (1993). A procedure for ranking efficient units in data envelopment analysis. Manag. Sci. 39 (10), 1261–1264. doi:10.1287/mnsc.39.10.1261
Bai, Y. P., Deng, X. Z., Jiang, S. J., Zhang, Q., and Wang, Z. (2017). Exploring the relationship between urbanization and urban eco-efficiency: Evidence from prefecture-level cities in China. J. Clean. Prod. 195, 1487–1496. doi:10.1016/j.jclepro.2017.11.115
Balcerzak, P. A., and Pietrzak, B. M. (2017). Digital economy in visegrad countries. Multiple-Criteria decision analysis at regional level in the years 2012 and 2015. J. Compet. 9 (2), 5–18. doi:10.7441/joc.2017.02.01
Biswas, A. K., Farzanegan, M. R., and Thum, M. (2012). Pollution, shadow economy and corruption: Theory and evidence. Ecol. Econ. 75, 114–125. doi:10.1016/j.ecolecon.2012.01.007
Bruce, K. F., and Rupert, F. (1983). Ecological performance standards for land development. Biol. Conserv. 26 (3), 193–213. doi:10.1016/0006-3207(83)90073-3
Chen, F., Wang, M., and Pu, Z. (2022). The impact of technological innovation on air pollution: Firm-level evidence from China. Technol. Forecast. Soc. Change 177, 121521. doi:10.1016/j.techfore.2022.121521
Chen, P., Xie, R., and Lu, M. (2020). Resource conservation" or "environmental friendliness": how do urban clusters affect total-factor ecological performance in China? Int. J. Environ. Res. Public Health 17 (12), 4361. doi:10.3390/ijerph17124361
Copeland, B. R., and Taylor, M. S. (1994). North-south trade and the environment. Q. J. Econ. 109 (3), 755–787. doi:10.2307/2118421
Dahlström, K., and Ekins, P. (2005). Eco-efficiency trends in the UK steel and aluminum industries. J. Industrial Ecol. 9 (4), 171–188. doi:10.1162/108819805775247954
Ding, C., Liu, C., Zheng, C., and Li, F. (2021). Digital economy, technological innovation and high-quality economic development: Based on spatial effect and mediation effect. Sustainability 14 (1), 216. doi:10.3390/su14010216
Don, T. (1997). The digital economy: Promise and peril in the age of networked intelligence. New York: McGraw-Hill Companies, 156–168. ISBN:9780070633421.
Dong, F., Zhang, Y. Q., and Zhang, X. Y. (2020). Applying a data envelopment analysis game cross-efficiency model to examining regional ecological efficiency: Evidence from China. J. Clean. Prod. 267, 122031. doi:10.1016/j.jclepro.2020.122031
Dyckhoff, H., and Allen, K. (2001). Measuring ecological efficiency with data envelopment analysis (DEA). Eur. J. Operational Res. 132 (2), 312–325. doi:10.1016/s0377-2217(00)00154-5
Fang, Z., Razzaq, A., Mohsin, M., and Irfan, M. (2022). Spatial spillovers and threshold effects of internet development and entrepreneurship on green innovation efficiency in China. Technol. Soc. 68, 101844. doi:10.1016/j.techsoc.2021.101844
Ge, L., Zhao, H., Yang, J., Yu, J., and He, T. (2022). Green finance, technological progress and ecological performance - evidence from 30 provinces in China. Environ. Sci. Pollut. Res. Int. doi:10.1007/s11356-022-20501-w
Goldfarb, A., and Tucker, C. (2019). Digital economics. J. Econ. Literature 57 (1), 3–43. doi:10.1257/jel.20171452
Gollop, F. M., and Roberts, M. J. (1983). Environmental regulations and productivity growth: The case of fossil-fueled electric power generation. J. political Econ. 91 (4), 654–674. doi:10.1086/261170
Haldar, A., and Sethi, N. (2022). Environmental effects of Information and Communication Technology-Exploring the roles of renewable energy, innovation, trade and financial development. Renewable and Sustainable Energy Reviews 153, 111754. doi:10.1016/j.rser.2021.111754
Jaffe, A. B., Newell, R. G., and Stavins, R. N. (2002). Environmental policy and technological change. Environ. Resour. Econ. (Dordr). 22 (1-2), 41–70. doi:10.1023/A:1015519401088
He, J. (2006). Pollution haven hypothesis and environmental impacts of foreign direct investment: The case of industrial emission of sulfur dioxide (SO2) in Chineseprovinces. Ecol. Econ. 60 (1), 228–245. doi:10.1016/j.ecolecon.2005.12.008
Jie, H. E. (2007). Pollution haven hypothesis and environmental impacts of foreign direct investment: The case of industrial emission of sulfur dioxide (so2) in Chinese provinces. Ecol. Econ. 60 (1), 228–245. doi:10.1016/j.ecolecon.2005.12.008
Jorgenson, D. (2001). Information technology and the US economy. Am. Econ. Rev. 91 (1), 1–32. doi:10.1257/aer.91.1.1
Kim, J. (2006). Infrastructure of the digital economy: Some empirical findings with the case of korea. Technol. Forecast. Soc. Change 73 (4), 377–389. doi:10.1016/j.techfore.2004.09.003
Lan, J., Kakinaka, M., and Huang, X. (2012). Foreign direct investment, human capital and environmental pollution in China. Environ. Resour. Econ. (Dordr). 51, 255–275. doi:10.1007/s10640-011-9498-2
Lane, N. (1999). Advancing the digital economy into the 21st century. Inf. Syst. Front. 1 (3), 317–320. doi:10.1023/A:1010010630396
Lange, S., Pohl, J., and Santarius, T. (2020). Digitalization and energy consumption. Does ICT reduce energy demand? Ecol. Econ. 176, 106760. doi:10.1016/j.ecolecon.2020.106760
Lee, H. S. (2021). An integrated model for SBM and Super-SBM DEA models. J. Operational Res. Soc. 72 (5), 1174–1182. doi:10.1080/01605682.2020.1755900
Li, B., and Wu, S. (2017). Effects of local and civil environmental regulation on green total factor productivity in China: A spatial Durbin econometric analysis. J. Clean. Prod. 153, 342–353. doi:10.1016/j.jclepro.2016.10.042
Li, Z., Li, N., and Wen, H. (2021). Digital economy and environmental quality: Evidence from 217 cities in China. Sustainability 13 (14), 8058. MDPI AG. Retrieved from. doi:10.3390/su13148058
Li, Z., and Liu, Y. (2021). Research on the spatial distribution pattern and influencing factors of digital economy development in China. IEEE Access 9, 63094–63106. doi:10.1109/ACCESS.2021.3075249
Liu, J., Li, X., and Zhong, S. (2022). Does innovation efficiency promote energy consumption intensity? New evidence from China. Energy Rep. 8, 426–436. doi:10.1016/j.egyr.2022.05.096
Lorenzoni, I., Nicholson-Cole, S., and Whitmarsh, L. (2007). Barriers perceived to engaging with climate change among the UK public and their policy implications. Glob. Environ. Change 17 (3-4), 445–459. doi:10.1016/j.gloenvcha.2007.01.004
Mentsiev, A. U., Guzueva, E. R., Yunaeva, S. M., Engel, M. V., and Abubakarov, M. V. (2019). Blockchain as a technology for the transition to a new digital economy. J. Phys. Conf. Ser. 1399, 033113. doi:10.1088/1742-6596/1399/3/033113
Miao, Z. (2021). Digital economy value chain: Concept, model structure, and mechanism. Appl. Econ. 53 (2), 4342–4357. doi:10.1080/00036846.2021.1899121
Mickwitz, P., Melanen, M., Rosenström, U., and Seppälä, J. (2006). Regional eco-efficiency indicators – A participatory approach. J. Clean. Prod. 14 (18), 1603–1611. doi:10.1016/j.jclepro.2005.05.025
Moshiri, S., and Cameron, N. (2000). Neural network versus econometric models in forecasting inflation. J. Forecast. 19 (3), 201–217. doi:10.1002/(sici)1099-131x(200004)19:3<201:aid-for753>3.0.co;2-4
Murshed, M., Khan, S., and Rahman, A. A. (2022). Roadmap for achieving energy sustainability in Sub-Saharan Africa: The mediating role of energy use efficiency. Energy Rep. 8, 4535–4552. doi:10.1016/j.egyr.2022.03.138
Remer, D. S., and Nieto, A. P. (1995). A compendium and comparison of 25 project evaluation techniques. Part 2: Ratio, payback, and accounting methods. Int. J. Prod. Econ. 42 (2), 101–129. doi:10.1016/0925-5273(95)00105-0
Ren, S., Hao, Y., Xu, L., Wu, H., and Ba, N. (2021). Digitalization and energy: How does internet development affect China's energy consumption?. Energy Econ. 98, 105220. doi:10.1016/j.eneco.2021.105220
Sadorsky, P. (2013). Do urbanization and industrialization affect energy intensity in developing countries? Energy Econ. 37, 52–59. doi:10.1016/j.eneco.2013.01.009
Schmidt, A., and Kløverpris, N. H. (2009). Environmental impacts from digital solutions as an alternative to conventional paper-based solutions. Lyngb: FORCE Technology.
Shahnazi, R., and Dehghan Shabani, Z. (2019). The effects of spatial spillover information and communications technology on carbon dioxide emissions in Iran. Environ. Sci. Pollut. Res. 26, 24198–24212. doi:10.1007/s11356-019-05636-7
Shakib, M., Yumei, H., Rauf, A., Alam, M., Murshed, M., and Mahmood, H. (2022). Revisiting the energy-economy-environment relationships for attaining environmental sustainability: Evidence from belt and road initiative countries. Environ. Sci. Pollut. Res. 29 (3), 3808–3825. doi:10.1007/s11356-021-15860-9
Shao, S., Yang, L., Yu, M., and Yu, M. (2011). Estimation, characteristics, and determinants of energy-related industrial CO2 emissions in Shanghai (China), 1994–2009. Energy Policy 39 (10), 6476–6494. doi:10.1016/j.enpol.2011.07.049
Sun, X., Loh, L., Chen, Z., and Zhou, X. (2020). Factor price distortion and ecological efficiency: The role of institutional quality. Environ. Sci. Pollut. Res. 27, 5293–5304. doi:10.1007/s11356-019-07147-x
Sun, X., and Loh, L. (2019). Sustainability governance in China: An analysis of regional ecological efficiency. Sustainability 11 (7), 1958. doi:10.3390/su11071958
Sun, X. X., Chen, Z. W., Shi, T. T., Yang, G. Q., and Yang, X. Y. (2022). Influence of digital economy on industrial wastewater discharge: Evidence from 281 Chinese prefecture-level cities. J. Water Clim. Chang. 13 (2), 593–606. doi:10.2166/wcc.2021.447
Tang, Y., Wu, S., and Chen, S. (2022). Evaluating the influence of environmental R&D on the SO2 intensity in China: Evidence from dynamic spatial Durbin model analysis. Econ. Research-Ekonomska Istraživanja, 1–20. doi:10.1080/1331677X.2022.2094438
Teo, T. S. H. (2001). Understanding the digital economy: Data, tools, and research. Asia Pac. J. Manag. 18 (1), 553–555. doi:10.1023/A:1012879426983
Toffel, M. W., and Horvath, A. (2004). Environmental implications of wireless technologies: News delivery and business meetings. Environ. Sci. Technol. 38 (11), 2961–2970. doi:10.1021/es035035o
Tone, K. (2001). A slacks-based measure of efficiency in data envelopment analysis. Eur. J. operational Res. 130 (3), 498–509. doi:10.1016/s0377-2217(99)00407-5
Wang, J., Wang, W., Ran, Q., Irfan, M., Ren, S., Yang, X., et al. (2022). Analysis of the mechanism of the impact of internet development on green economic growth: Evidence from 269 prefecture cities in China. Environ. Sci. Pollut. Res. 29 (7), 9990–10004. doi:10.1007/s11356-021-16381-1
Wang, P., Han, W., Rizvi, S. K. A., and Naqvi, B. (2022). Is digital adoption the way forward to curb energy poverty? Technol. Forecast. Soc. Change 180, 121722. doi:10.1016/j.techfore.2022.121722
Wang, S. H., Zhao, D. Q., and Chen, H. X. (2020). Government corruption, resource misallocation, and ecological efficiency. Energy Econ. 85, 104573. doi:10.1016/j.eneco.2019.104573
Wang, W., He, T., and Li, Z. (2022). Digital inclusive finance, economic growth and innovative development. Kybernet es. doi:10.1108/K-09-2021-0866
Wang, W, Lin, J., He, T., Zhao, H., and Zhao, X. (2022) Coupling coordination analysis of green finance and industrial technology innovation: A case study of zhejiang province in China. Front. Environ. 10:958311. doi:10.3389/fenvs.2022.958311
Wang, X., Sun, X., Zhang, H., and Xue, C. (2022). Digital economy development and urban green innovation CA-pability: Based on panel data of 274 prefecture-level cities in China. Sustainability 14 (5), 2921. doi:10.3390/su14052921
Whitford, V., Ennos, A. R., and Handley, J. F. (2001)., 57. UK, 91–103. doi:10.1016/s0169-2046(01)00192-x“City form and natural process”indicators for the ecological performance of urban areas and their application to Merseyside, UKLandsc. Urban Plan.2
Wu, H. T., Ba, N., Ren, S. Y., Xu, L., Chai, J., Irfan, M., et al. (2022). The impact of internet development on the health of Chinese residents: Transmission mechanisms and empirical tests. Socio-Economic Plan. Sci. 81, 101178. doi:10.1016/j.seps.2021.101178
Wu, H., Xu, L., Ren, S., Hao, Y., and Yan, G. (2020). How do energy consumption and environmental regulation affect carbon emissions in China? New evidence from a dynamic threshold panel model. Resour. Policy 67, 101678. doi:10.1016/j.resourpol.2020.101678
Wu, H., Xue, Y., Hao, Y., and Ren, S. (2021). How does internet development affect energy-saving and emission reduction? Evidence from China. Energy Econ. 103, 105577. doi:10.1016/j.eneco.2021.105577
Wu, S., and Zhang, K. (2021). Influence of urbanization and foreign direct investment on carbon emission efficiency: Evidence from urban clusters in the Yangtze River economic belt. Sustainability 13 (5), 2722. doi:10.3390/su13052722
Yang, X., Su, X., Ran, Q., Ren, S., Chen, B., Wang, W., et al. (2022). Assessing the impact of energy internet and energy misallocation on carbon emissions: New insights from China. Environ. Sci. Pollut. Res. 29 (16), 23436–23460. doi:10.1007/s11356-021-17217-8
Yang, X., Wang, W., Su, X., Ren, S., Ran, Q., Wang, J., et al. (2022). Analysis of the influence of land finance on haze pollution: An empirical study based on 269 prefecture-level cities in China. Growth Change. doi:10.1111/grow.12638
Yang, X., Wang, W., Wu, H., Wang, J., Ran, Q., and Ren, S. (2021). The impact of the new energy demonstration city policy on the green total factor productivity of resource-based cities: Empirical evidence from a quasi-natural experiment in China. J. Environ. Plan. Manag., 1–34. doi:10.1080/09640568.2021.1988529
Yildirim, V., and Mert Kantar, Y. (2020). Robust estimation approach for spatial error model. J. Stat. Comput. Simul. 90 (9), 1618–1638. doi:10.1080/00949655.2020.1740223
You, X., Sun, Y., and Liu, J. (2022). Evolution and analysis of urban resilience and its influencing factors: A case study of jiangsu province, China. Nat. Hazards, 1–32. doi:10.1007/s11069-022-05368-x
Zhang, K., Xu, D., and Li, S. (2019). The impact of environmental regulation on environmental pollution in China: An empirical study based on the synergistic effect of industrial agglomeration. Environ. Sci. Pollut. Res. 26 (25), 25775–25788. doi:10.1007/s11356-019-05854-z
Zhong, X., Xie, R., Chen, P., and Ke, K. (2021). Internet development and environmental quality—evidence from the development of Chinese cities. Sustainability 13 (20), 11308. doi:10.3390/su132011308
Zhou, H., Qu, S., Wu, Z., and Ji, Y. (2020). A study of environmental regulation, technological innovation, and energy consumption in China based on spatial econometric models and panel threshold models. Environ. Sci. Pollut. Res. 27, 37894–37910. doi:10.1007/s11356-020-09793-y
Zhou, J., Lan, H., Zhao, C., and Zhou, J. (2021). Haze pollution levels, spatial spillover influence, and impacts of the digital economy: Empirical evidence from China. Sustainability 13 (16), 9076. doi:10.3390/su13169076
Keywords: digital economy, ecological performance, spatial Durbin model, spatial spillover effect, sustainable development, green economy, ICT, electronic information industry
Citation: Shen X, Zhao H, Yu J, Wan Z, He T and Liu J (2022) Digital economy and ecological performance: Evidence from a spatial panel data in China. Front. Environ. Sci. 10:969878. doi: 10.3389/fenvs.2022.969878
Received: 15 June 2022; Accepted: 16 August 2022;
Published: 12 September 2022.
Edited by:
Larisa Ivascu, Politehnica University of Timișoara, RomaniaCopyright © 2022 Shen, Zhao, Yu, Wan, He and Liu. This is an open-access article distributed under the terms of the Creative Commons Attribution License (CC BY). The use, distribution or reproduction in other forums is permitted, provided the original author(s) and the copyright owner(s) are credited and that the original publication in this journal is cited, in accordance with accepted academic practice. No use, distribution or reproduction is permitted which does not comply with these terms.
*Correspondence: Haoxiang Zhao, aHhfemhhbzExN0B5ZWFoLm5ldA==; Jiawei Liu, MTgzNjExMzY2NzVAMTYzLmNvbQ==
†These authors have contributed equally to this work and share first authorship
Disclaimer: All claims expressed in this article are solely those of the authors and do not necessarily represent those of their affiliated organizations, or those of the publisher, the editors and the reviewers. Any product that may be evaluated in this article or claim that may be made by its manufacturer is not guaranteed or endorsed by the publisher.
Research integrity at Frontiers
Learn more about the work of our research integrity team to safeguard the quality of each article we publish.