 Li Li1
 Wenbo Zhu2Junjie Liu3
 Li Zhang4
 Lianqi Zhu2*Liyuan Wang2Chaonan Chen2Naveed Ahmed5Sher Bahadur Gurung6
- 1School of Government, Beijing Normal University, Beijing, China
- 2College of Geography and Environmental Science, Henan University, Kaifeng, China
- 3State Key Laboratory of Resources and Environmental Information System, Institute of Geographic Sciences and Natural Resources Research, CAS, Beijing, China
- 4College of Water Science, Beijing Normal University, Beijing, China
- 5Department of Civil Engineering, FAST-National University of Computer and Emerging Sciences, Islamabad, Pakistan
- 6Central Department of Geography, Tribhuvan University, Kirtipur, Nepal
China is one of the world’s most seriously affected regions by water and soil erosion. Soil erosion is a major cause and an important component of land degradation, which has a negative impact on ecological protection and sustainable socioeconomic development. Rainfall erosivity (RE) is one of the key parameters to assess the degree of soil erosion. Quantifying the content of RE and the formation mechanism is important to accurately measure the degree of soil erosion and provide a theoretical basis for soil erosion management. Here, this study analyzed the spatial and temporal characteristics of RE and their driving mechanisms in the Qinba Mountains from 1970 to 2017 using a daily rainfall model. Furthermore, geographical detector methods were used to quantitatively identify the dominant factors affecting RE and the dominant factors affecting RE on different topographic reliefs. The results showed that the RE between 1970 and 2017 averaged 4,197.85 MJ mm hm−2 h−1 a−1, with a mutation coefficient of 0.16. The spatial distribution of RE is high in the southeast and low in the northwest, and the mean annual RE declines with the increase in latitude in longitude and increases with the reduction in longitude in latitude. In addition, precipitation and temperature are the main factors affecting the spatial distribution of RE. Among these, precipitation can explain about 97% of the RE and temperature can explain about 65% of the RE. These findings should be essential for managing soil and water loss in the North–South Transition Zone, China.
1 Introduction
Soil erosion causes the degeneration of land resources, and rainfall is one of the primary dynamic factors of soil erosion (Alewell et al., 2019; Diodato et al., 2021). Rainfall erosivity (RE), which is the potential ability of rainfall to cause soil erosion, is a crucial indicator for predicting soil erosion (Teng et al., 2018; Romshoo et al., 2021; Sun et al., 2021). It can represent the comprehensive influence of rainfall on soil erosion and rainfall intensity, rainfall kinetic energy, and rainfall duration (Martínez-Mena et al., 2020). To identify the potential threat of soil erosion, improve soil erosion prediction, and conduct soil with a water conservation plan against the backdrop of global climate change, RE is essential to achieve an accurate assessment of the potential effects of rainfall on soil erosion (Huang et al., 2019). At present, RE has been widely applied in soil erosion prediction models as the Universal Soil Loss Equation (USLE) (Wischmeier and Smith, 1978) and the Revised Universal Soil Loss Equation (RUSLE) (Renard et al., 1997).
Quantitative research on the degree of RE and change mechanisms has become popular in recent years (Diodato et al., 2013; Bezak et al., 2021). Chinese scholars (Zhang et al., 2008; Chen et al., 2018; Yin et al., 2022) have increasingly conducted studies on RE through various mathematical models. Among them, the daily rainfall erosivity model established by Zhang et al. (2002, 2003) has been the most extensively utilized in China, mainly because the daily rainfall data can be easily accessed and handled, which overcomes the difficulty of obtaining rainfall kinetic energy data (Deng et al., 2019). Therefore, given the daily precipitation data of meteorological stations, the rainfall erosivity models on different timescales (time, day, month, season, and year) are successively established (Vaezi et al., 2017a). Those models are applied to different spatial scales, namely, region, province, mountains, and watershed (Muhire et al., 2015; Yang and Lu, 2015; Dissanayake et al., 2019; Keesstra et al., 2019; Duan et al., 2020).
In recent years, the assessment of RE has been extensively conducted worldwide (Kiani-Harchegani et al., 2019). A study carried out by Singh and Singh (2020) indicated remarkable year-to-year, seasonal, and monthly variations in the average annual RE and erosivity density over the western Himalayan catchment in India during 1971–2015. Panagos et al. (2016) discovered that the intra-annual variability of RE has been high in Greece in the past 30 years. RE was three times less erosive during the warm seasons than during the cold seasons. Similarly, significant differences in RE were detected during the wet and dry seasons in Ethiopia (Nyssen et al., 2005) and the Colombian Andes (Hoyos et al., 2005). Besides, Peter et al., (2013) analyzed long-term trends in summer rainfall events using a long-term (1937–2007) high resolution images (≤5 min) and found a steeper linear trend in RE. With the TRMM multi-satellite precipitation data, Anton et al. (2010) observed that RE was the highest in the northern area of Madagascar and along the west coast of Africa and that the intensity of annual RE and RE in the summer and autumn in the south was more significant than in the north (Gu et al., 2016). By contrast, a decrease in RE from east to west was discovered, with the highest in the northeastern area and the lowest in the northern parts of Brazil (Oliveira et al., 2013). The studies mentioned earlier have been conducted on RE on national, continental, and provincial scales, but with colossal differences in terms of topography, climate, soil, hydrology, and land-use practices. To resolve this problem, RE and erosivity density assessment in time and space is required in typical regions with climate transition.
China is one of the world’s most seriously affected regions by water and soil erosion. The water erosion area covers about 164.88 × 10⁴ km2, accounting for 17.53% of the national area (Ministry of Water Resources of the People's Republic of China, 2002). Many scholars have researched RE in China and much remarkable research have been published. For example, the annual rainfall and annual RE decreased in the Chinese Loess Plateau from 1956 to 2008 (Xin et al., 2011). Liu et al. (2008) noticed that most hydrological stations in the Yellow River Basin showed a decreasing trend, with only two stations displaying an increasing trend. Yin et al. (2015) developed models to calculate the RE based on commonly available precipitation data and improved the model’s accuracy and calculation. The RE of the eastern water erosion impacted regions of China that were analyzed based on daily precipitation data, which displayed that RE was high in the east and low in the west (Xie et al., 2016). Recently, the RE in China’s Jiangsu has been more serious in the winter and summer (Huang et al., 2019). In addition, Yang and Lu (2015) found that during the period 1961–2012, the average annual erosion rate in the arid zone of China showed an increasing trend, while in the dryland semi-humid zone there was a decreasing trend. Nevertheless, there are fewer studies of RE in the transition regions of North and South China. Wei et al. (2019) estimated the RE in the Qinba Mountains through 63 meteorological stations, finding an apparent temporal distribution trend. Cheng et al. (2017) studied the RE of Southern Shaanxi over the past 55 years, which indicated that the average RE had increased from the north to south for many years and that the variation coefficient in winter was relatively large. Wang et al. (2019) analyzed soil nutrient loss patterns under different rainfall intensities in Henan Province through an indoor artificial rainfall experiment, which showed that in the same type of soil, nutrient loss, runoff and sediment yield increased accordingly with increasing rainfall intensity. Through the analysis of RE in the Hubei province, Zhang et al. (2014) found that RE has shown an increasing trend since 1978, with the main cycle of change of 2–3a, and that the spatial pattern has decreased from southeast to northwest mountainous areas. In summary, existing researchers have analyzed changes in RE in local areas such as the Daba Mountains, Southern Shaanxi, and Henan province. However, the Qinba Mountains belong to a complete north–south geographical transition unit from the Daba mountains in the south to the Qinling Mountains, meaning that those studies lack the analysis of RE of this complete regional unit, especially the analysis of the influence of climate factors and environmental factors on the temporal and spatial distribution of RE. Hence, it is urgent to study the spatial–temporal differences of RE based on daily precipitation data in the Qinling–Daba mountains from the aspects of topography, longitude, and latitude. Therefore, the overall objectives of this study are 1) to estimate the annual rainfall and rainfall erosivity based on daily precipitation from 118 meteorological stations from 1970 to 2017, 2) to detect the trend in spatial distribution and variations in rainfall and rainfall erosivity, and 3) to analyze the spatial differentiation characteristics of RE in longitude and latitude and the driving factors of RE in different topographic reliefs. The results will provide suggestions for curbing soil erosion and improving the ecological environment in the region.
2 Data and methodology
2.1 Study area
The Qinba Mountains (102°24′–112°40′E, 30°43′–35°29′N), as China’s North–South Transition Zone, are located in the central region of China, connecting the Tibetan Plateau region to the eastern plains and the Yangtze River Basin to the Yellow River Basin. It covers six provinces and cities, which include Hubei, Henan, Chongqing, Shaanxi, Gansu, and Sichuan, with an area of 3 km2 × 105 km2. The region’s topography consists mainly of hills, basins, valleys, and plains. Most of the plains and hills are distributed in the eastern part, with an average of about 400 m. The western part is mainly a high-altitude area, and the average elevation is about 1,600 m. The terrain shows a distribution pattern of being high in the east and low in the west. The study area is characterized by diverse climatic types and significant vertical changes, such as a north subtropical maritime climate, subtropical warm temperate transitional monsoon climate, and warm temperate continental monsoon climate. The Qinba Mountains are an essential ecological function area for biodiversity and water conservation, with an average annual precipitation of 450–1,300 mm.
2.2 Data
Following the European evaluation standards for climate data, this study collected daily precipitation (1970–2017) and temperature data (2000–2017) at 118 meteorological stations from China’s meteorological data–sharing service network (http://cdc.nmic.cn/). Those stations with missing data of more than 30 days were removed, and those with missing data of less than 30 days were interpolated with the relevant adjacent stations to ensure consistency and completeness of the precipitation data (Wang et al., 2021). Snow was not considered when calculating the process of RE because it does not directly impact soil erosion (Yin et al., 2015). The meteorological stations are shown in Figure 1. A digital elevation model at 30 m resolution is derived from the United States Geological Survey website (https://earthexplorer.usgs.gov/). The elevation of the Qinba Mountains ranges from 13 to 5,528 m, with large differences in topography, uneven rainfall distribution, and significant soil erosion. MODIS data are collected from the 16-day MOD13Q1 products with a resolution of 250 m synthesized by the National Aeronautics and Space Administration (NASA), and the data were preprocessed by the MODIS Reprojection Tool (MRT) to extract normalized difference vegetation index (NDVI) from 2000 to 2017. The maximum-value composite (MVC) was used to obtain the monthly average NDVI in the study area (Meng et al., 2020; Yang et al., 2021).
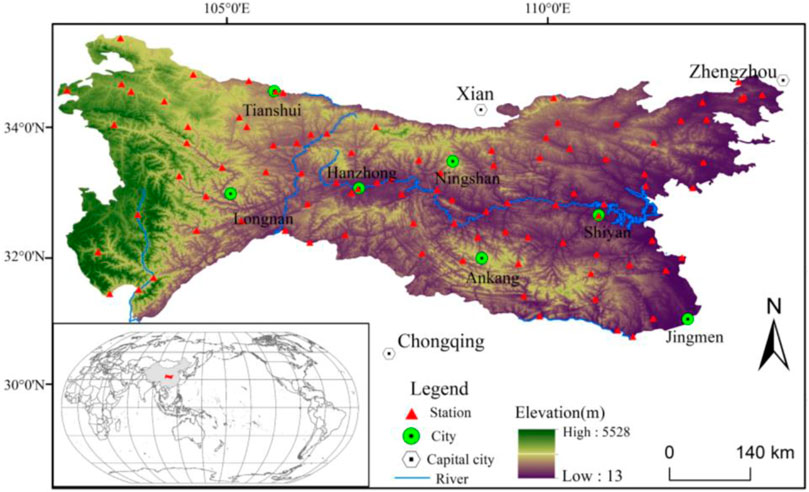
FIGURE 1. Distribution map of Qinba Mountains meteorological stations.
2.3 Methodology
2.3.1 Calculation of rainfall erosivity
The Richardson daily rainfall erosivity estimation model modified by Zhang et al. (2002) was applied to calculate RE, which reads
In the abovementioned equation,
where Pd12 (mm) refers to the daily average precipitation greater than 12 mm and Py12 (mm) refers to the average annual precipitation above or equal to 12 mm per day.
The RE of each half a month of each year is calculated using Eqs 1–3. The monthly rainfall, annual rainfall erosivity (ARE), and average annual rainfall erosivity (AARE) can be obtained by summarizing.
2.3.2 Spatial–temporal characteristics analysis method
Trend analysis, mutation analysis, and periodic analysis were employed to analyze the changes in RE on the timescale. The Mann-Kendall method (M-K) was applied to calculate the Z-value of statistics, and the changing trend in RE was analyzed and discovered through the positive and negative Z-values (Kendall, 1948; Alashan 2020; Wang 2020). The M-K test has been widely applied to detect sudden changes in values in long time series of climate data. The climate data are large and span long periods of time. Therefore, we normally regard years as the basic unit for research and analysis (Sa’adi et al., 2019; Machiwal et al., 2019). If z is above 0, the sequence will show an upward trend, and if z is below 0, it will display a downward trend. For example, if |z| is greater than or equal to 1.96, the mutation points of the time series of RE will be identified by the standardized cumulative anomaly, and the rank test method will be applied to further accurately test the mutation points. When the statistic |U| is below 1.96, the mutation points identified by standardized cumulative anomaly will be excluded. Wavelet analysis was employed to analyze the periodic change of RE. We spatially interpolated the precipitation and RE using a semi-covariance function and co-kriging interpolation. As to the co-kriging interpolation, we introduced elevation data as an auxiliary variable and the resolution was 2 km (Xiao et al., 2018; Belkhiri et al., 2020). The cross-verification method is the use of points around each measured point to predict the real value, and it compares the predicted value with the real value (Sharma et al., 2022). The accuracy of the co-kriging interpolation results was assessed by mean relative error (MRE), mean absolute error (MAE), and root mean square error (RMSE), and the smaller the value is, the higher the accuracy becomes (Qi et al., 2020).
2.3.3 Topographic relief
Topographic relief (m) refers to the height difference between the highest and lowest points within a particular area (Shiraishi et al., 2020). In this study, the mean–variable point methods were applied to calculate the optimal statistical unit (18 × 18) of topographic relief in the Qinba Mountains, which is the optimal statistical window for neighborhood analysis to obtain the topographic relief.
where
2.3.4 Geographical detector method
The geographical detector method developed by Wang and Xu (2017) was used to conduct factor detection and analysis of RE and calculate the degree of influence of various environmental factors on RE in the region. The calculation equation is as follows:
In this equation,
3 Results
3.1 Dynamic variation characteristics of rainfall erosivity
3.1.1 Interannual variation of rainfall erosivity
The AARE of the Qinba Mountains from 1970 to 2017 was 4,197.85 MJ mm hm−2 h−1 a−1, showing a slight variation with a mutation coefficient of 0.16. As illustrated in Figure 2A, the overall trend in RE is fluctuating, displaying a three-stage change characteristic of increasing first, then decreasing, and finally increasing. In the first stage (1970–1984), the RE showed a rising trend of fluctuation, and it then gradually decreased in the second stage (1984–1995). During the third stage of 1995–2017, the RE fluctuated from 3,157.31 to 3,954.75 MJ mm hm−2 h−1 a−1. According to Figure 3, the wavelet analysis was introduced to conduct periodic analysis of RE. It was found that RE presented a periodic change of 5–10 years.

FIGURE 2. Trend analysis of RE (A) and precipitation (B) in Qinba Mountains.
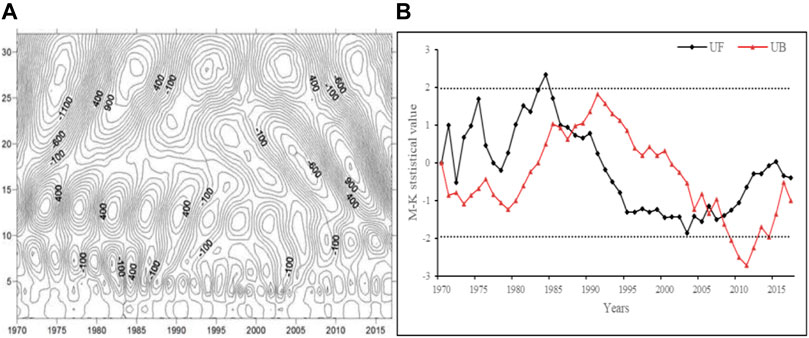
FIGURE 3. Wavelet analysis of RE (A) and M-K test (B) in Qinba Mountains.
The variation trend of annual precipitation (Figure 2B) is consistent with annual RE (Figure 2A). During the past 50 years, the maximum precipitation was 1,046.98 mm in 1983, and the maximum RE was 5,264.11 MJ mm hm−2 h−1a−1 in 1980. The lowest precipitation was 560.76 mm in 1997, and the minimum RE was 3,157.31 MJ mm hm−2 h−1a−1 in 1995. The results demonstrated that the maximum precipitation did not coincide with the occurrence time of the maximum RE, and the maximum value of RE was 3 years earlier, and the minimum value was 2 years earlier, compared with precipitation. The maximum and minimum precipitation values differed by 1.86 times, but the maximum and minimum values of RE differed by 1.66 times, meaning that the variation range of precipitation is more extensive than RE. The variation coefficient of annual RE (0.16) was higher than that of the annual precipitation (0.12), illustrating that the interannual change of RE was more significant than the interannual change of precipitation. Figure 3 indicates that the amplitude changes of UF and UB are similar, suggesting a fluctuation trend of first increasing, then decreasing, and again increasing. The positive series (UF) represented a fluctuation trend from 1970 to 1983, a slow decline from 1983 to 2003, and a gradual rise from 2004 to 2017. The reverse series (UB) showed a declining trend from 1970 to 1979, a rising trend from 1980 to 1991, and an ascending trend from 1992 to 2017. The change in UB was more intense. UF and UB, respectively, had an intersection point between 1988 and 1989, 2006 and 2007, and 2007 and 2008. The positive sequence (UF) exceeded the critical value of 1.96 in 1984, and the inverse sequence (UB) went beyond the critical value of −1.96 in 2009 because the mutation point in 2007 and 2008 was the closest to 2010 and displayed a trend of significant decline, which further indicates that RE mutations in the Qinba mountains had occurred in 2008.
3.1.2 Variation of seasonal rainfall erosivity
Considering the seasonal differences of precipitation, spring, summer, autumn, and winter are correspondingly divided into March–May, June–August, September–November, and December–February. As shown in Figure 4, RE slumps in spring and summer and soars in autumn, and the changes in winter are small and can be ignored. From 1970 to 2017, in spring, the average RE was 243.20 MJ mm hm−2 h−1 a−1, accounting for 5.79% of the annual average RE, and the average RE decreased by 9.16 MJ mm−2 h−1 a−1 per 10a, with a Z-value of −2.60, showing a significant decreasing trend. In summer, the average RE was 1,660.73 MJ mm hm−2 h−1 a−1, accounting for 39.56%, and the changing trend was first decreasing, then increasing, and again decreasing. In 1999, the maximum values of RE appeared in spring. The variation law of autumn annual RE was similar to that of interannual RE, which was 2,044.84 MJ mm hm−2 h−1 a−1, accounting for 48.71% of the annual average RE. The average RE increased by 217.65 MJ mm hm−2 h−1 a−1 per 10a, exhibiting a significant increasing trend (z = 1.36). In winter, since snowfall did not directly affect soil erosion, snow is not considered in the calculation of winter RE. As a result, the proportion of average RE was relatively small (5.94%).
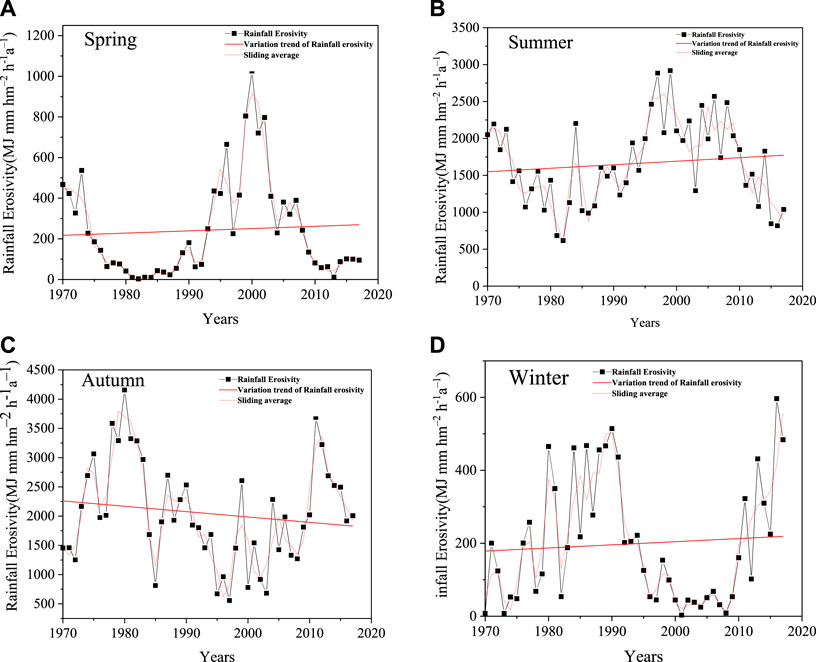
FIGURE 4. Variation trend of Spring (A), Summer (B), Autumn (C) and Winter (D) in Qinba Mountains.
3.2 Spatial analysis of rainfall erosivity
3.2.1 Spatial distribution analysis
Based on the ArcGIS 10.3 platform, semi-covariance functions and kriging interpolation were examined to interpolate the average annual rainfall erosivity (AARE) and average annual precipitation (AAP) in the Qinba Mountains from 1970 to 2017. The semi-covariance function shows that the AARE is a spherical model, and AAP is a Gaussian model. The accuracy of the kriging interpolation was verified through the cross-verification method, and the results showed that MAE and RMSE were less than 1, demonstrating the credibility of the AARE and AAP interpolation results. As illustrated in Figure 5A, the spatial distribution characteristics of AARE were high in the southeast and low in the northwest, which was consistent with the distribution rule of AAP (Figure 5B). The AAP gradually dropped from above the average precipitation line of 800 mm in the southeast to below the average precipitation line of 200 mm in the northwest, and the AARE dropped from above the average RE line of 9,000 MJ mm hm−2 h−1 a−1 in the southeast to below the average RE line of 3,000 MJ mm hm−2 h−1 a−1 in the northwest. The distribution center and the high value of the AARE were consistent and distributed in the southeast. The high-value distribution center of AAP was consistent with the AARE, which was distributed in the southeastern part. The low value was distributed in the northwestern part, but the distribution area of AARE was more widespread.
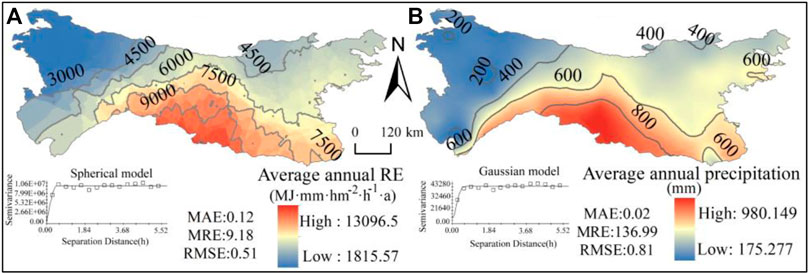
FIGURE 5. Spatial distribution of AARE (A) and AAR (B) in Qinba Mountains.
3.2.2 Analysis of spatial variation trend of rainfall erosivity
To further analyze the trend of the annual RE changes, the statistical Mann-Kendall Z-value and coefficient of variation (Cv) of 118 weather stations from 1970 to 2017 were calculated. Meanwhile, semi-covariance functions and kriging interpolation were applied for interpolation. The Mann-Kendall Z-value is more suitable for the linear model, and Cv fits the spherical model more. The cross-verification results display that the MAE is 0.001 and RMSE is 1.02 in the Mann-Kendall Z-value and that the MAE is 0.08 and RMSE is 0.14 in the Cv (Figure 6).
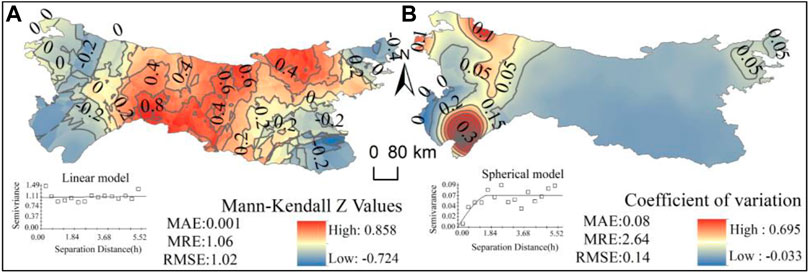
FIGURE 6. Spatial distribution of Mann-Kendall Z-value (A) and coefficient of variation (B) of rainfall erosivity in Qinba Mountains.
As Figure 6A demonstrates, there are pronounced regional differences in the distribution of the RE coefficient. The spatial distribution characteristics are high in the middle and low in the surrounding region, showing that in the central region, the RE was increased and that water conservation measures should be implemented to prevent further soil erosion in the central region (Muhire et al., 2015). RE was declining around the study area boundary, but most of them failed to pass the significance test (|Z| was below 1.96). Figure 6B also illustrates that the variation coefficient of RE was relatively stable (Cv was below 0.2), showing a distribution pattern of being high in the west and low in the east. Located in a high-altitude area, the terrain in the western region is complex, and the coefficient of variation was relatively large. Also, the annual rainfall was unstable, and the interannual RE varied greatly. The variation coefficient decreased from west to east in the Qinba Mountains, indicating that the precipitation tended to be stable from west to east, and the interannual variation of RE gradually decreased, mainly caused by the dual influence of topography and climate.
3.2.3 Variations in longitude and latitude of rainfall erosivity
Four lines of latitude and longitude (32.67°N, 33.96°N, 107.05°E, and 108°E) were selected to analyze the trends in the AARE of the Qinba Mountains in the longitudinal and latitudinal directions. Figure 7 indicates a trend of increasing and then decreasing, with increasing longitude at different latitudes, and the trend line displays a sharper increase at 33.96°N than at 32.67°N. The highest value of AARE (9,085.31 MJ mm hm−2 h−1 a−1) at 32.67°N appears at 108.41°E, while the highest value (5,750.45 MJ mm hm−2 h−1 a−1) at 33.96°N appears at 107.96°E, with a difference of 1.57 times and a deviation of 0.45°E. Meanwhile, both 32.67°N and 33.96°N indicate that RE is more noticeable in areas with flatter topography, mainly due to the flatter topography being influenced by the monsoonal climate with abundant rainfall (northern hemisphere). The AARE tends to drop with increasing latitude at 107.05°E and 110.52°E (Figure 8). The highest value is 9,593.04 MJ mm hm−2 h−1 a−1 and the lowest is 4,245.61 MJ mm hm−2 h−1 a−1 at 107.05°E, with a decrease of 2.26 times. At 110.52°E, the highest (8,022.83 MJ mm hm−2 h−1 a−1) and the lowest (4090.49 MJ mm hm−2 h−1 a−1) values of RE are decreased by 1.96 times. Compared with 110.52°E, the decreasing trend of AARE is more apparent at 107.05°E.
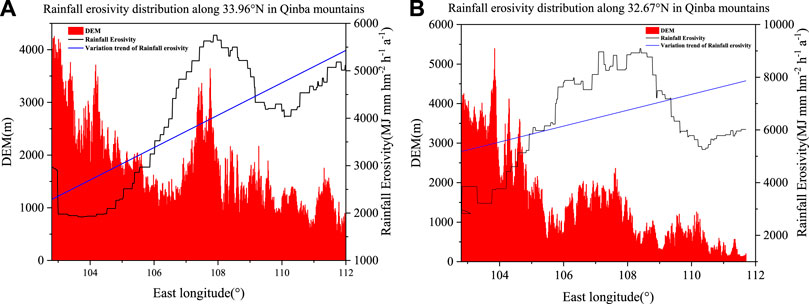
FIGURE 7. Distribution of RE along 32.67°N (A) and 33.96°N (B).
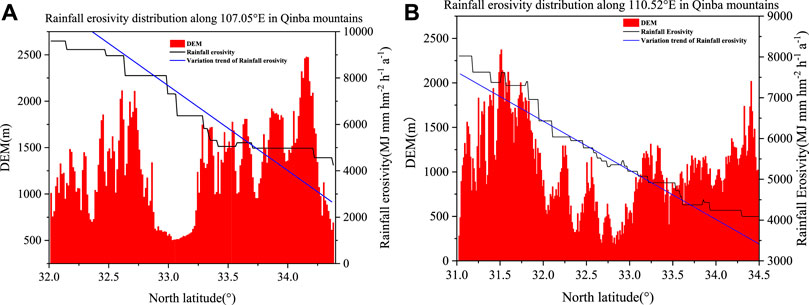
FIGURE 8. Distribution of RE along 107.05°E (A) and 110.52°E (B).
3.3 Spatial differentiation of rainfall erosivity on topographic relief
3.3.1 Analysis of topographic relief features of Qinba Mountains
Based on the research by Shiraishi et al. (2020) and considering the complex geomorphic features of the Qinba Mountains, the topographic relief (m) was divided into four categories: micro-topography (below or equal to 140), small topography (140–250), medium topography (250–370), and large topography (above or equal to 370). The topographic relief degree is mainly small topography (39.08%), distributed alternately with the middle relief area. The second is the medium topography (28.88%), distributed in the southwest and central parts. The third is the large topography, accounting for 10.37%, mainly distributed in the southwest with a high elevation and along the ridgeline from west to east like a belt. Micro-topography (21.67%) is mainly on the border of the central Hanzhong Basin and eastern border of the Qinba Mountains (Figure 9; Table 1).
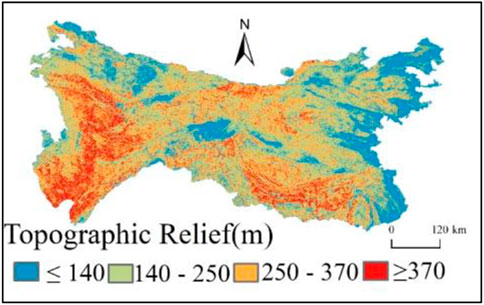
FIGURE 9. Topographic relief of Qinba Mountains.

TABLE 1. Statistical results of topographic relief in Qinba Mountains.
3.3.2 Spatial differentiation of precipitation and rainfall erosivity on topographic relief
Figures 10A–D display the corresponding AAP changes that exist in different topographic reliefs. The AAP in the micro-topography showed a distribution pattern of being high in the southeast and low in the northwest, with fewer areas of high AAP and low AAP concentrated in the northwest of the study area. The APP distribution pattern in the small topography is similar to that in the medium topography, decreasing from southeast to northwest. The main reason is that the Qinba Mountains pass through the Qinling–Huaihe Line, and the study area is a subtropical monsoon climate, resulting in high precipitation. Due to the small area of large topography in the topographic relief, the AAP was scattered with a decreasing trend from south to north. The AAP low-value area was concentrated in the southwest, while the AAP high-value area was not evident. The distribution of the AARE over different topographic reliefs is shown in Figures 11A–D. The RE in the micro-topography gradually decreases from the southeast to northwest, which is consistent with the variation of the AAP in the topographic relief. The sum of the RE distribution in the small and medium topographies accounts for 67.96%, with a decreasing trend from the east to west and from the south to north, mainly because of the influence of the monsoon climate on the eastern and southern areas and the superior hydrothermal conditions there. However, the northern and western areas are less affected by the monsoon climate, and the topography is complex, leading to a lower value of RE.
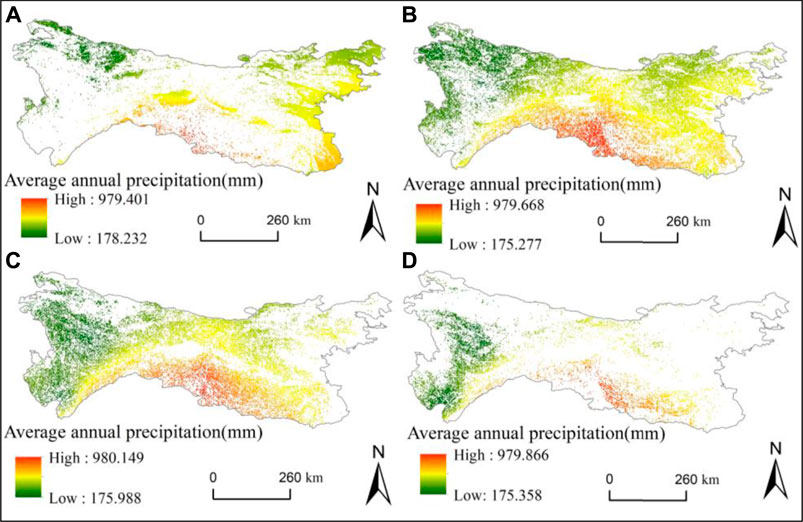
FIGURE 10. Spatial distribution of average annual precipitation over micro-topography (A), small topography (B), medium topography (C), and large topography (D).
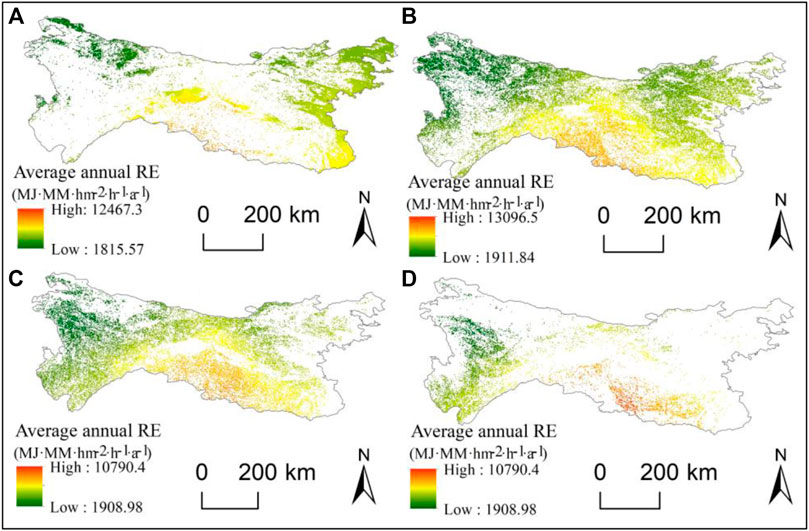
FIGURE 11. Spatial distribution of average annual rainfall erosivity over micro-topography (A), small topography (B), medium topography (C), and large topography (D).
3.4 Study of influencing factors on rainfall erosivity
Considering precipitation, NDVI, temperature, latitude and longitude, elevation, and topographic relief, the geospatial detector model was applied to explore the influencing factors of RE in the Qinba Mountains, identify the important indicators affecting the spatial distribution, and analyze the differences of the influence factors on the four topographic reliefs. As shown by Table 2, RE is most affected by precipitation, with a q value of 0.97. The second is the temperature (q = 0.65), and the factor with the smallest effect is NDVI (q = 0.24). Based on the q value of the geographic detector, the influencing factors of RE are ranked in the Qinba Mountains as follows: precipitation, temperature, longitude, latitude, and elevation.
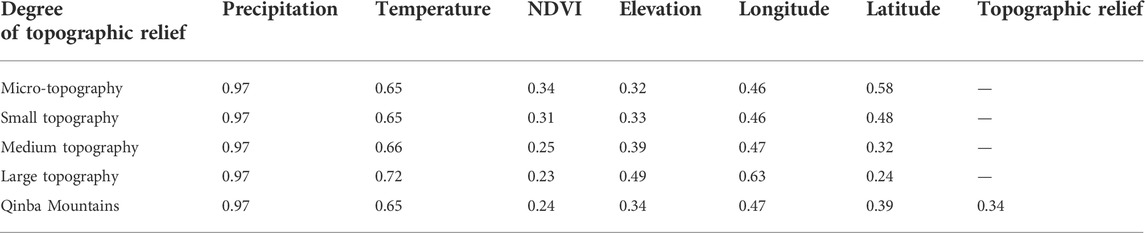
TABLE 2. Statistical results of q values of influencing factors of rainfall erosivity in Qinba Mountains.
There are differences in the factors influencing RE at different topographic reliefs, and precipitation is the most influential factor (q = 0.97). The temperature has similar effects on the four topographic reliefs, and the impact is most apparent in regions with large topography (q = 0.72). The NDVI has apparent differences in different topographic relief degrees, with the micro-topography being the greatest (0.34) and the large topography being the smallest (0.23), mainly due to the high vegetation coverage and high interpretation accuracy in low-altitude areas. Elevation has a strong correlation in RE with the increase of topographic relief. The correlation is the highest in the area with large topography (0.49), indicating that the greater the topographic relief, the greater the degree of RE. The correlation between the longitude and RE becomes stronger as the topographic relief becomes higher, while the correlation between the latitude and RE decreases with the increase of topographic relief. The results show that the sensitivity of RE to longitude is the highest in large topography, and the sensitivity of RE to latitude is stronger in small topography.
4 Discussion
Similar findings have also been revealed in other studies (Vijith and Dodge-Wan 2019; Chang et al., 2022; Johannsen et al., 2022), but the results of this study further display that due to the uneven seasonal distribution of precipitation, the RE has significant seasonal variation. Through semi-covariance function, co-kriging interpolation, and cross-validation, we corroborated the accuracy of RE, and the results indicate that the accuracy of the co-kriging interpolation results meets the research requirements (Qi et al., 2020; Sharma et al., 2022). Panagos et al. (2016) noticed that erosivity density is relatively low in the first 5 months (January–May) and higher in the remaining 7 months (June–December) of the year. High seasonality was present in the distribution of precipitation, and the seasonality of RE was strong (Lee and Julien, 2018; Galicia et al., 2019; Zhu et al., 2020). The abovementioned research proves that convective rain is the primary precipitation type in summer, with more extensive precipitation and higher intensity, leading to more noticeable changes in RE. In spring or autumn, frontal precipitation is dominant, and smaller precipitation is related to weaker intensity and lowers RE.
Furthermore, Yang and Lu (2015) noticed that RE showed a significant increasing trend accordingly to an increase in precipitation from the northwest to southeast in China’s dryland region. In the Qinba Mountains, the AARE declines from the southeast to northwest, with a decrease in precipitation. The southeast of the Qinba Mountains is the region with a high RE and precipitation distribution value, mainly due to the humid climate and flat topography in the eastern region. Yang et al. (2017) observed that RE displays an increasing trend in space in the Northern Shaanxi Plateau. The distribution of RE is consistent with that of precipitation. In most areas of Jinan, an insignificant increasing trend was discovered (Xu et al., 2018), where the spatial variation of RE is slight, showing a high distribution pattern in the west and a low distribution pattern in the east. Topography is the critical factor affecting the spatial variation coefficient of RE, and AARE is affected by many factors, thus leading to the significant variation coefficient of RE in local areas.
Overall, existing studies mainly focus on the spatial–temporal variation of RE, but there is still a lack of studies on the variation of RE in longitude, latitude, and topographic relief. Liu et al. (2008) found that the precipitation possessed longitude zonality and had no clear linear relationship with latitude. In this study, four longitude and latitude lines such as 32.67° N, 33.96°N, 107.05°E, and 108°E were selected to analyze the variation of RE. The results demonstrate that the increasing trend of 33.96° N is more evident than that of 32.67°N. When compared with 110.52°E, the decreasing trend of AARE is more marked at 107.05°E. The overall change trend is consistent with the spatial change of RE. In terms of different topographic reliefs, RE is mainly concentrated in the small- and medium-relief areas, with a distribution trend of being high in the southeast and low in the northwest. Plateau is the primary geomorphic type of large topography, concentrated in the northwestern part of the Qinba Mountains, where the effects of extreme weather and hydrological influence are relatively marked (Wang et al., 2021). In this area, the topographic relief is complicated, and the western and northern regions are less affected by the monsoon climate, thus displaying an RE trend of being high in the southeast and low in the northwest (Talchabhadel et al., 2020; Xu et al., 2021).
In addition, this research also studies the influence of different environmental factors on RE, indicating that precipitation exerts the most significant influence on RE and vegetation NDVI has the weakest effect on RE. The influence of sunspots and the Arctic Oscillation on RE is also essential (Cai et al., 2016). Precipitation is the dominant factor affecting RE (Liu et al., 2018; Zhu et al., 2019; Chen et al., 2020; Rutebuka et al., 2020). In our research, precipitation has the most noticeable influence on RE in different topographic relief degrees, mainly because the daily precipitation model calculates RE through daily precipitation data. Besides, temperature, elevation, longitude, latitude, and NDVI all have a particular influence on RE. The results presented in this article will deepen the understanding of the formation mechanism of RE. Multisource data fusion will be an essential direction to study RE in future processes. Remote sensing satellite product data will be applied to analyze RE in the Qinba Mountains, and the spatial–temporal variation of RE and its impact on soil erosion will be thoroughly studied. This study systematically investigates RE’s spatial and temporal variation and the driving mechanisms in the Qinba Mountains. Also, the article enriches the study of the transition zone from the north subtropical to the south warm temperate climate and can provide a reference for the study of soil erosion in mountainous areas of other climate transition zones in the world.
5 Conclusion
This study calculated rainfall erosivity based on daily precipitation data from 1970 to 2017 in the Qinba Mountains. The spatial and temporal characteristics of RE and precipitation were systematically analyzed. Seasonal fluctuations and interannual differences in RE were explored by applying the wavelet analysis. Also, the distribution of precipitation and rainfall erosivity at different topographic reliefs were measured, and the main control factors of RE were identified with geographical detectors. The results show that 1) from 1970 to 2017, AARE was 4,197.85 MJ mm hm−2 h−1 a−1 in the Qinba Mountains, with a mild variation coefficient of 0.16. The interannual variation trend shows a three-stage feature of first increasing, then decreasing, and again increasing, presenting a 5–10a periodic variation. The seasonal change displays that RE decreases significantly in spring and summer, increases sharply in autumn, and increases insignificantly in winter; 2) the spatial pattern of RE is high in the southeast and low in the northwest, and the spatial distribution of the area with high AARE is consistent with that of the area with high AAR. There are differences in RE’s distribution in different topographic reliefs. RE is more intense in small-topography and medium-topography areas, with an overall trend of being high in the south and east and low in the north and west. Moreover, the AARE decreases with the increase of latitude in longitude and increases with the increase of longitude in latitude (northern hemisphere); 3) precipitation has the dominant impact on RE in the Qinba Mountains (q = 0.97), and NDVI has the weakest impact on RE (q = 0.24). The study provides the rank of the influencing factors of RE from the most influential to the least influential: precipitation, temperature, longitude, latitude, elevation and topographic relief, and NDVI. With the increase of topographic relief, the correlation between temperature, elevation, longitude, and RE increases, while the correlation between NDVI and latitude and RE decreases.
Data availability statement
The original contributions presented in the study are included in the article/Supplementary Material; further inquiries can be directed to the corresponding author.
Author contributions
LL performed the analysis and wrote the manuscript; WZ analyzed the data; JL proposed the method; LW and CC voiced modifications; LZ (4th author), AN and GSB modified the article; LZ (5th author) conceived the study. All authors read and approved the final manuscript.
Funding
The work presented in this paper was supported by the National Key Research and Development Program of China (Grant No. 2021YFE0106700), National Science and Technology Basic Resource Investigation Program of China (Grant No. 2017FY1009002).
Conflict of interest
The authors declare that the research was conducted in the absence of any commercial or financial relationships that could be construed as a potential conflict of interest.
Publisher’s note
All claims expressed in this article are solely those of the authors and do not necessarily represent those of their affiliated organizations, or those of the publisher, editors, and reviewers. Any product that may be evaluated in this article, or claim that may be made by its manufacturer, is not guaranteed or endorsed by the publisher.
References
Alashan, S. (2020). Combination of modified Mann‐Kendall method and Şen innovative trend analysis. Eng. Rep. 2 (3), e12131. doi:10.1002/eng2.12131
Alewell, C., Borrelli, P., Meusburger, K., and Panagos, P. (2019). Using the USLE: Chances, challenges and limitations of soil erosion modelling. Int. soil water conservation Res. 7 (3), 203–225. doi:10.1016/j.iswcr.2019.05.004
Anton, V., Geert, S., Steven, M., and De, J. (2010). Satellite-based estimation of rainfall erosivity for Africa. J. Hydrology 395, 235–241. doi:10.1016/j.jhydrol.2010.10.035
Belkhiri, L., Tiri, A., and Mouni, L. (2020). Spatial distribution of the groundwater quality using kriging and Co-kriging interpolations. Groundw. Sustain. Dev. 11, 100473. doi:10.1016/j.gsd.2020.100473
Bezak, N., Petan, S., and Mikoš, M. (2021). Spatial and temporal variability in rainfall erosivity under alpine climate: A slovenian case study using optical disdrometer data. Front. Environ. Sci. 423, 735492. doi:10.3389/fenvs.2021.735492
Cai, X. K., Gao, P., Jiang, G. T., and Mu, X. M. (2016). Spatiotemporal variability of rainfall erosivity in weihe River basin. Res. Soil Water Conservation 23 (3), 25–28. doi:10.13869/j.cnki.rswc.2016.03.005
Chang, Y., Lei, H., Zhou, F., and Yang, D. (2022). Spatial and temporal variations of rainfall erosivity in the middle Yellow River Basin based on hourly rainfall data. Catena 216, 106406. doi:10.1016/j.catena.2022.106406
Chen, H., Zhang, X. P., Abla, M., Lü, D., Yan, R., Ren, Q. F., et al. (2018). Effects of vegetation and rainfall types on surface runoff and soil erosion on steep slopes on the Loess Plateau, China. Catena 170, 141–149. doi:10.1016/j.catena.2018.06.006
Chen, Y., Xu, M., Wang, Z., Chen, W., and Lai, C. (2020). Reexamination of the Xie model and spatiotemporal variability in rainfall erosivity in mainland China from 1960 to 2018. Catena 195, 104837. doi:10.1016/j.catena.2020.104837
Cheng, J. W., Yue, D. P., Da, X., Guo, K. J., Liu, J. C., and Wang, P. X. (2017). Research on rainfall erosivity changes during 1960-2014 in the southern Shaanxi. Mt. Res. 35, (1), 48–56. doi:10.16089/j.cnki.1008-2786.000195
Deng, L., Kim, D., Huang, C. B., Liu, Q. Y., Cheng, M., Shang, Z. P., et al. (2019). Land-use changes driven by ‘Grain for Green’ program reduced carbon loss induced by soil erosion on the Loess Plateau of China. Glob. Planet. Change 177, 101–115. doi:10.1016/j.gloplacha.2019.03.017
Diodato, N., Knight, J., and Bellocchi, G. (2013). Reduced complexity model for assessing patterns of rainfall erosivity in Africa. Glob. Planet. Change 100, 183–193. doi:10.1016/j.gloplacha.2012.10.016
Diodato, N., Ljungqvist, F. C., and Bellocchi, G. (2021). Climate patterns in the world’s longest history of storm-erosivity: The arno River basin, Italy, 1000–2019 CE. Front. Earth Sci. (Lausanne). 9, 637973. doi:10.3389/feart.2021.637973
Dissanayake, D. M. S. L. B., Morimoto, T., and Ranagalage, M. (2019). Accessing the soil erosion rate based on RUSLE model for sustainable land use management: A case study of the kotmale watershed, Sri Lanka. Model. Earth Syst. Environ. 5 (1), 291–306. doi:10.1007/s40808-018-0534-x
Duan, J., Liu, Y. J., Yang, J., Tang, C. J., and Shi, Z. H. (2020). Role of groundcover management in controlling soil erosion under extreme rainfall in citrus orchards of southern China. J. Hydrology 582, 124290. doi:10.1016/j.jhydrol.2019.124290
Galicia, S., Navarro-Hevia, J., Martinez-Rodriguez, A., Mongil-Manso, J., and Santibanez, J. (2019). ‘Green’, rammed Earth check dams: A proposal to restore gullies under low rainfall erosivity and runoff conditions. Sci. total Environ. 676, 584–594. doi:10.1016/j.scitotenv.2019.04.189
Gu, Z. J., Duan, X. W., Liu, B., Hu, J. M., and He, J. N. (2016). The spatial distribution and temporal variation of rainfall erosivity in the yunnan plateau, southwest China: 1960–2012. Catena 145, 291–300. doi:10.1016/j.catena.2016.06.028
Hoyos, N., Waylen, P. R., and Alvaro, J. (2005). Seasonal and spatial patterns of erosivity in a tropical watershed of the Colombian Andes. J. Hydrol. X. 314, 177–191. doi:10.1016/j.jhydrol.2005.03.014
Huang, J., Zhang, F. M., Hu, Z. H., and Chen, S. T. (2019). Climatology of rainfall erosivity during 1961-2012 in Jiangsu province, southeast China. Nat. Hazards (Dordr). 98, 1155–1168. doi:10.1007/s11069-018-3391-z
Johannsen, L. L., Schmaltz, E. M., Mitrovits, O., Klik, A., Smoliner, W., Wang, S., et al. (2022). An update of the spatial and temporal variability of rainfall erosivity (R-factor) for the main agricultural production zones of Austria. Catena 215, 106305. doi:10.1016/j.catena.2022.106305
Keesstra, S. D., Rodrigo-Comino, J., Novara, A., Giménez-Morera, A., Pulido, M., Di Prima, S., et al. (2019). Straw mulch as a sustainable solution to decrease runoff and erosion in glyphosate-treated clementine plantations in Eastern Spain. An assessment using rainfall simulation experiments. Catena 174, 95–103. doi:10.1016/j.catena.2018.11.007
Kiani-Harchegani, M., Sadeghi, S. H., Singh, V. P., Asadi, H., and Abedi, M. (2019). Effect of rainfall intensity and slope on sediment particle size distribution during erosion using partial eta squared. Catena 176, 65–72. doi:10.1016/j.catena.2019.01.006
Lee, J. H., and Julien, P. Y. (2018). Global climate teleconnection with rainfall erosivity in South Korea. Catena 167, 28–43. doi:10.1016/j.catena.2018.03.008
Liu, Q., Yang, Z. F., and Cui, B. S. (2008). Spatial and temporal variability of annual precipitation during 1961–2006 in Yellow River Basin, China. J. Hydrol. X. 361, 330–338. doi:10.1016/j.jhydrol.2008.08.002
Liu, S., Huang, S., Xie, Y., Leng, G., Huang, Q., Wang, L., et al. (2018). Spatial-temporal changes of rainfall erosivity in the loess plateau, China: Changing patterns, causes and implications. Catena 166, 279–289. doi:10.1016/j.catena.2018.04.015
Machiwal, D., Gupta, A., Jha, M. K., and Kamble, T. (2019). Analysis of trend in temperature and rainfall time series of an Indian arid region: Comparative evaluation of salient techniques. Theor. Appl. Climatol. 136 (1), 301–320. doi:10.1007/s00704-018-2487-4
Martínez-Mena, M., Carrillo-López, E., Boix-Fayos, C., Almagro, M., Franco, N. G., Díaz-Pereira, E., et al. (2020). Long-term effectiveness of sustainable land management practices to control runoff, soil erosion, and nutrient loss and the role of rainfall intensity in Mediterranean rainfed agroecosystems. Catena 187, 104352. doi:10.1016/j.catena.2019.104352
Meng, X., Gao, X., Li, S., and Lei, J. (2020). Spatial and temporal characteristics of vegetation NDVI changes and the driving forces in Mongolia during 1982–2015. Remote Sens. 12 (4), 603. doi:10.3390/rs12040603
Ministry of Water Resources of the People's Republic of China (2002). National Soil and Water Erosion Bulletin Beijing. Available at: http://www.ministryofwaterresourcesofthepeople'srepublicofchina/.
Muhire, I., Ahmed, F., and Abd, E. (2015). Spatio-temporal variations of rainfall erosivity in Rwanda. J. Soil Sci. Environ. Manag. 6 (4), 72–83. doi:10.5897/jssem14.0452
Nyssen, J., Vandenreyken, H., Poesen, J., Moeyersons, J., Deckers, J., Mitiku, H., et al. (2005). Rainfall erosivity and variability in the northern Ethiopian high-lands. J. Hydrol. X. 311, 172–187. doi:10.1016/j.jhydrol.2004.12.016
Oliveira, P. T. S., Wendland, E., and Nearing, M. A. (2013). Rainfall erosivity in Brazil: A review. Catena 100, 139–147. doi:10.1016/j.catena.2012.08.006
Panagos, P., Ballabio, C., Borrelli, P., and Meusburger, K. (2016). Spatio-temporal analysis of rainfall erosivity and erosivity density in Greece. Catena 137, 161–172. doi:10.1016/j.catena.2015.09.015
Peter, F., Peter, N., and Johanners, B. (2013). Long-term trends in rainfall erosivity–analysis of high resolution precipitation time series (1937–2007) from Western Germany. Agric. For. Meteorology 171-172, 115–123. doi:10.1016/j.agrformet.2012.11.011
Qi, J., Du, J., Siniscalchi, S. M., Ma, X., and Lee, C. H. (2020). On mean absolute error for deep neural network based vector-to-vector regression. IEEE Signal Process. Lett. 27, 1485–1489. doi:10.1109/LSP.2020.3016837
Renard, K. G., Foster, G. R., Weesies, G. A., McCool, D. K., and Yoder, D. C. (1997). Predicting soil erosion by water: A guide to conservation planning with the revised universal soil loss equation (RUSLE). Washington DC: United State Department of Agriculture: USA, Agriculture Handbook, 703.
Romshoo, S. A., Yousuf, A., Altaf, S., and Amin, M. (2021). Evaluation of various DEMs for quantifying soil erosion under changing land use and land cover in the himalaya. Front. Earth Sci. (Lausanne). 9, 782128. doi:10.3389/feart.2021.782128
Rutebuka, J., De Taeye, S., Kagabo, D., and Verdoodt, A. (2020). Calibration and validation of rainfall erosivity estimators for application in Rwanda. Catena 190, 104538. doi:10.1016/j.catena.2020.104538
Sa’adi, Z., Shahid, S., Ismail, T., Chung, E. S., and Wang, X. J. (2019). Trends analysis of rainfall and rainfall extremes in Sarawak, Malaysia using modified Mann–Kendall test. Meteorol. Atmos. Phys. 131 (3), 263–277. doi:10.1007/s00703-017-0564-3
Sharma, A., Mukhopadhyay, T., Rangappa, S. M., Siengchin, S., and Kushvaha, V. (2022). Advances in computational intelligence of polymer composite materials: Machine learning assisted modeling, analysis and design. Arch. Comput. Methods Eng. 29, 3341–3385. doi:10.1007/s11831-021-09700-9
Shiraishi, K., Yamada, Y., Nakano, M., Kinoshita, M., and Kimura, G. (2020). Three-dimensional topographic relief of the oceanic crust may control the occurrence of shallow very-low-frequency earthquakes in the Nankai Trough off Kumano. Earth Planets Space 72 (1), 72–14. doi:10.1186/s40623-020-01204-3
Singh, J., and Singh, O. (2020). Assessing rainfall erosivity and erosivity density over a Western Himalayan catchment, India. J. Earth Syst. Sci. 129, 97–119. doi:10.1007/s12040-020-1362-8
Sun, X., Miao, L., Yuan, J., Wang, H., and Wu, L. (2021). Application of enzymatic calcification for dust control and rainfall erosion resistance improvement. Sci. Total Environ. 759, 143468. doi:10.1016/j.scitotenv.2020.143468
Talchabhadel, R., Prajapati, R., Aryal, A., and Maharjan, M. (2020). Assessment of rainfall erosivity (R-factor) during 1986–2015 across Nepal: A step towards soil loss estimation. Environ. Monit. Assess. 192 (5), 1–17. doi:10.1007/s10661-020-8239-9
Teng, H. F., Liang, Z. Z., Chen, S. C., Yu, W., Viscarra, A., Chappell, A., et al. (2018). Current and future assessments of soil erosion by water on the Tibetan Plateau based on RUSLE and CMIP5 climate models. Sci. Total Environ. 635, 673–686. doi:10.1016/j.scitotenv.2018.04.146
Vaezi, A. R., Ahmadi, M., and Cerdà, A. (2017a). Contribution of raindrop impact to the change of soil physical properties and water erosion under semi-arid rainfalls. Sci. Total Environ. 583, 382–392. doi:10.1016/j.scitotenv.2017.01.078
Vijith, H., and Dodge-Wan, D. (2019). Spatial and statistical trend characteristics of rainfall erosivity (R) in upper catchment of Baram River, Borneo. Environ. Monit. Assess. 191 (8), 494. doi:10.1007/s10661-019-7604-z
Wang, J. (2020). Determining the most accurate program for the Mann-Kendall method in detecting climate mutation. Theor. Appl. Climatol. 142 (3), 847–854. doi:10.1007/s00704-020-03333-x
Wang, J. F., and Xu, C. D. (2017). Instrumental networking and social network building: How horizontal networking and upward networking create social capital. Acta Psychol. Sin. 1, 116–134. doi:10.3724/sp.j.1041.2017.00116
Wang, G., Li, Z., Zhang, J., Lu, Y., and Chen, Z. (2019). Loss rules of total nitrogen and total phosphorus in the soils of southwest mountains in Henan province, China under artificial rainfall. Appl. Ecol. Environ. Res. 17 (1), 451–461. doi:10.15666/aeer/1701_451461
Wang, L. Y., Chen, S. F., Zhu, W. B., Ren, H., Zhang, L. J., and Zhu, L. (2021). Spatiotemporal variations of extreme precipitation and its potential driving factors in China’s North-South Transition Zone during 1960–2017. Atmos. Res. 252, 105429. doi:10.1016/j.atmosres.2020.105429
Wei, S. T., He, Y., Mu, X. M., Gao, P., Zhao, G. J., and Sun, W. Y. (2019). Spatiotemporal Var. Rainfall Erosivity Qin-Ba Mt. Region 28 (2), 416–425. (In Chinese).
Wischmeier, W., H., and Smith, D. D. (1978). Predicting rainfall erosion losses: A guide to conservation planning, Washington DC: United States Department of Agriculture: USA. Agriculture Handbook, 58p.
Xiao, M., Zhang, G., Breitkopf, P., Villon, P., and Zhang, W. (2018). Extended Co-Kriging interpolation method based on multi-fidelity data. Appl. Math. Comput. 323, 120–131. doi:10.1016/j.amc.2017.10.055
Xie, Y., Yin, S. Q., Liu, B. Y., Mark, A., Nearing, C., and Zhao, Y. (2016). Models for estimating daily rainfall erosivity in China. J. Hydrology 535, 547–558. doi:10.1016/j.jhydrol.2016.02.020
Xin, Z. B., Yu, X. X., Li, Q. Y., and Lu, X. X. (2011). Spatiotemporal variation in rainfall erosivity on the Chinese Loess Plateau during the period 1956–2008. Reg. Environ. Change 11, 149–159. doi:10.1007/s10113-010-0127-3
Xu, J., Xu, Z. H., Li, W., Wang, X. R., and Wang, X. (2018). Temporal and spatial changes of rainfall erosivity during 1970-2016 in jinan city, China. Mt. Res. 36 (3), 391–400. doi:10.13870/j.cnki.stbcxb.2017.05.014
Xu, Y., Sun, H., and Ji, X. (2021). Spatial-temporal evolution and driving forces of rainfall erosivity in a climatic transitional zone: A case in huaihe River basin, eastern China. Catena 198, 104993. doi:10.1016/j.catena.2020.104993
Yang, B., Wang, Q. J., and Hao, S. (2017). Sather characteristic of temporal and spatial variation of soil erosion change in jialu river watershed from 1988 to 2013. J. Soil Water Conservation 5, 87–92.
Yang, F. B., and Lu, C. H. (2015). Spatiotemporal variation and trends in rainfall erosivity in China's dryland region during 1961-2012. Catena 133, 362–372. doi:10.1016/j.catena.2015.06.005
Yang, Y., Wu, T., Zeng, Y., and Wang, S. (2021). An adaptive-parameter pixel unmixing method for mapping evergreen forest fractions based on time-series NDVI: A case study of southern China. Remote Sens. 13 (22), 4678. doi:10.3390/rs13224678
Yin, S., Xie, Y., Liu, B., and Nearing, M. A. (2015). Rainfall erosivity estimation based on rainfall data collected over a range of temporal resolutions. Hydrol. Earth Syst. Sci. 19 (10), 4113–4126. doi:10.5194/hess-19-4113-2015
Yin, W., Wang, F., Liu, W., Wu, Y., and Wang, X. (2022). Analysis of rainfall erosion and protective measures for the aeolian sand subgrade slope of the wuma expressway. Adv. Mater. Sci. Eng. 2022, 1–14. doi:10.1155/2022/2000083
Zhang, J. Q., Gong, J., and Wu, Y. J. (2014). A preliminary study on rainfall erosion force in Hubei based on the data of daily rainfall. Resour. Environ. Yangtze. Basin. 23 (2), 274–280. doi:10.1870/cjlyzyyhj201402017
Zhang, Q., Xu, C. Y., Zhang, Z., Chen, Y. D., Liu, C. L., and Lin, H. (2008). Spatial and temporal variability of precipitation maxima during 1960-2005 in the Yangtze River basin and possible association with large-scale circulation. J. Hydrol. X. 353, 215–227. doi:10.1016/j.jhydrol.2007.11.023
Zhang, W. B., Xie, Y., and Liu, B. Y. (2002). Rainfall erosivity estimation using daily rainfall amounts. Sci. Geogr. Sin. 22, 705–711. (in Chinese with English abstract).
Zhang, W. B., Xie, Y., and Liu, B. Y. (2003). Spatial distribution of rainfall erosivity in China. J. Mt. Sci. 21 (1), 33–40. doi:10.16089/j.cnki.1008-2786.2003.01.005
Zhu, D., Xiong, K., Xiao, H., and Gu, X. (2019). Variation characteristics of rainfall erosivity in guizhou province and the correlation with the el niño southern oscillation. Sci. Total Environ. 691, 835–847. doi:10.1016/j.scitotenv.2019.07.150
Keywords: rainfall erosivity, geographic detectors, relief degree, multidimensional change, Qinling–Daba mountains
Citation: Li L, Zhu W, Liu J, Zhang L, Zhu L, Wang L, Chen C, Ahmed N and Gurung SB (2022) Study on multidimensional changes of rainfall erosivity during 1970–2017 in the North–South Transition Zone, China. Front. Environ. Sci. 10:969522. doi: 10.3389/fenvs.2022.969522
Received: 15 June 2022; Accepted: 17 October 2022;
Published: 08 November 2022.
Edited by:
Regina Alvala, Centro Nacional de Monitoramento e Alertas de Desastres Naturais (CEMADEN), BrazilReviewed by:
Rafael Coll Delgado, Universidade Federal Rural do Rio de Janeiro, BrazilAlex Ovando, Cemaden, Brazil
Copyright © 2022 Li, Zhu, Liu, Zhang, Zhu, Wang, Chen, Ahmed and Gurung. This is an open-access article distributed under the terms of the Creative Commons Attribution License (CC BY). The use, distribution or reproduction in other forums is permitted, provided the original author(s) and the copyright owner(s) are credited and that the original publication in this journal is cited, in accordance with accepted academic practice. No use, distribution or reproduction is permitted which does not comply with these terms.
*Correspondence: Lianqi Zhu, bHF6aHVAaGVudS5lZHUuY24=