
95% of researchers rate our articles as excellent or good
Learn more about the work of our research integrity team to safeguard the quality of each article we publish.
Find out more
ORIGINAL RESEARCH article
Front. Environ. Sci. , 29 August 2022
Sec. Atmosphere and Climate
Volume 10 - 2022 | https://doi.org/10.3389/fenvs.2022.968507
This article is part of the Research Topic Air Pollution and Climate Change: Interactions and Co-mitigation View all 18 articles
 Yufeng Tian1,2
 Jingyuan Li1*Chaolei Yang2Jingqi Cui1Fuzhen Shen3Jianyong Lu1*Shiping Xiong1Guanchun Wei1Zheng Li1Hua Zhang1Guanglin Yang4,5Yewen Wu1Zong Wei2Shuwen Jiang1Jingrui Yao1Jingye Wang1Zhixin Zhu1
The impact of the annual solar eclipse, starting on 21st June 2020, attributable to surface ozone concentration (O3) has been investigated in this study. To estimate the influence of the solar eclipse on O3 better, the variations of one reaction precursor of ozone production [nitrogen dioxide (NO2)], coupled with the meteorological factors (including Total Solar Irradiance (TSI), Temperature (T), and Relative Humidity (RH)), were analyzed in Yunnan Province, China. The results show observed O3 decreases from the beginning of the eclipse, reaching its minimum value when the eclipse left Yunnan province. During the period of the solar eclipse, the O3 decrease lasted for 20 h with a reduction of more than 40%. The reduction of TSI lasted for 5 h with a maximum at -90%. Simultaneously, the temperature decreased but the relative humidity increased during the reduction in solar radiation. O3 exhibits a significantly positive correlation with temperature and a negative correlation with relative humidity. However, NO2 did not show a clear response with changes lasting for 4 h. O3 and NO2 show a negative correlation. The influence of CO on O3 is minor except for Kunming. Thus, O3 in seriously polluted cities is more sensitive to NO2 and CO during the eclipse, such as in Kunming.
• (1) TSI decreases move from west to east with a reduction of more than 90% during the solar eclipse on June 21st, 2020, and last 3 h in Yunnan.
• (2) O3 decreases more than 40% during solar eclipse, and starts to recover in Yunnan when the solar eclipse leaves Yunnan.
• (3) Both meteorological factors and precursors are important for affecting O3 changes during solar eclipse.
A moon shadow is cast in the Earth’s atmosphere and surface when the Moon occurs between the Earth and the Sun. The moon’s shadow moves through the Earth at thousands of kilometers per hour. The region marked by eclipse experiences a phenomenon similar to sunrise and sunset in a short time. The solar radiation in the moon’s shadow sharply decreases and then recovers after the solar eclipse ends. The effects of different eclipse events on Earth are unique due to different paths and occurrence times (Baran et al., 2003). Therefore, the obscuration effects of the eclipse on the atmosphere are most attractive. The previous studies, although very limited due to rarely eclipse events, have shown the obscuration effects of the eclipse on the ionosphere, stratosphere, and surface, involving solar radiation, meteorological parameters, pollutants, and so on (e.g., Amiridis et al., 2007; Gerasopoulos et al., 2007; Kazadzis et al., 2007; Chung et al., 2010; Panda et al., 2015).
Significant reductions in global radiation, surface temperature, relative humidity, and wind speed can be observed during solar eclipses (e.g., Anderson et al., 1972; Founda et al., 2007; Pasachoff, 2009). The temperature in the Ahmedabad, India decreased by 0.5°C during a maximum solar obscuration on 11 August 1999, accompanied by a drop in the wind speed (Krishnan et al., 2004). A decrease of 0.7 m s−1 in wind speed and 3°C in temperature can be seen in southern England during the total solar eclipse on 11 August 1999 (Gray and Harrison 2012). Aplin et al. (2016) reviewed radiation changes during 44 solar eclipses from 1834 to 2006. They found that the radiation decreased to zero during total solar eclipses, whereas radiation was partly reduced during partial and annular eclipses.
The atmospheric photochemistry processes play an important role in ozone generation and elimination. O3 is produced under photodissociation of NO2 at wavelengths shorter than ∼420 nm, etc., like
The variations of O3 have been focused on for several years as an important member of pollutants. The increase in O3 can damage the respiratory and lungs (Wang et al., 2019). There are relationships between O3 and short-term memory loss, immune system dysfunction, and lymphocyte chromosomal abnormalities (e.g., Monks et al., 2015). Thus, O3 change should be focused on due to its hazard.
However, most of the previous studies are focused on North America, Europe, and South Asia, while there are few studies on the effect of the solar eclipse on ozone in China. Surface O3 response to the eclipse is a complex process and varies by using observations due to the dynamic change of the meteorological condition, topography, and pollutant discharge in different regions. The annular solar eclipse on June 21st, 2020, a nearly total eclipse (99.5% of obscuration), is the only and fully visible in China in the past decade. Thus, the solar eclipse event provides a perfect opportunity to explore the O3 variations response to eclipse in China. In this paper, using ground-based observations in Yunnan province, China, we investigate the effects of the solar eclipse on O3, NO2, Total Solar Irradiance (TSI), and meteorological data. The solar eclipse and observations are introduced in Section 2. We show results in Section 3 and discussion in Section 4. In Section 5 we illustrate the conclusions.
The annular solar eclipse, which occurred on 21 June 2020, began in central Africa, passed to South Asia, across China, and was last visible in the Pacific Ocean. The effects of the solar eclipse on the narrow strip were about 21.2 km. This annular solar eclipse began at 04:48 UT (Universal Time) in the eastern part of the Democratic Republic of the Congo and ended at 08:32 UT in the Pacific Ocean. The process lasted 3 h and 45 min, spanning about 14,000 km across the Earth (https://eclipse.gsfc.nasa.gov). This solar eclipse was the only one that can be seen in its whole process and was close to total solar eclipses in China over the last decade. The annular solar eclipse entered from the sacred lake of Tibet, Ma Panyong, passed through the southern part of the Sichuan Basin, across Southern China, traversed Taiwan Strait, and finally left China.
The data in the study is from ground-based observation in Yunnan province. These sites are between 97°31′–106°11′E and 21°8′–29°15′N° in southern China and in the path of the solar eclipse on 21 June 2020. The solar eclipse started and ended slightly differently at different sites. The maximum obscuration of the eclipse was observed everywhere around 15:30:00 CST (Chinese Standard Time, Universal Time + 8 h). The eclipse in Kunming, the capital of Yunnan province, began at 14:02 CST and ended at 17:12 CST. The maximum obscuration of the eclipse in Kunming occurred at 15:45 CST and reached about 86.6%. The solar eclipse in Kunming lasted 3 h and 9 min. Figure 1 gives the full eclipse path in China during the annular solar eclipse on 21 June 2020.
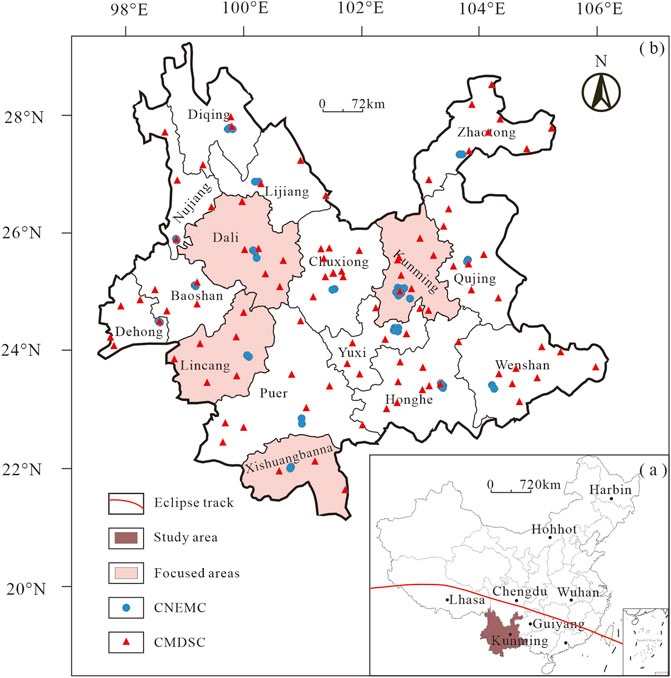
FIGURE 1. The study area (brown area), focused area (pink area) and observational sites from China National Environmental Monitoring Centre (CNEMC, blue circles) and China Meteorological Data Service Centre (CMDSC, red triangles). Brown lines represent the solar eclipse path.
In this study, the air quality and meteorological datasets were released by the China National Environmental Monitoring Centre (CNEMC) and China Meteorological Data Service Centre (CMDSC), respectively. The meteorological data is hourly observations derived from the ground stations of the China Meteorological Data Network (http://data.cma.cn), mainly including Temperature (T), Relative Humidity (RH), and TSI. In addition, the sites measuring TSI are less, and the TSI data is available in the daytime from 06:00 CST to 18:00 CST. Hourly O3 and NO2 data were measured by 1,605 state-controlled monitoring stations of the China National Environmental Monitoring Centre (http://106.37.208.233:20035). Blue circles and red triangles in Figure 1 represent the spatial distribution of 45 stations of the CNEMC and 103 stations of the CMDSC.
Figure 2 gives the variation percentage of TSI in Yunnan. The variation percentage of TSI is calculated by (hourly TSI—hourly TSI means)/hourly TSI means. Here the mean total irradiance between 18th and 20th is obtained to be quiet-time TSI. The percentage of hourly TSI eliminates the influences of diurnal variations. The changes in TSI percentage represent the effects of the solar eclipse on the TSI. The TSI significantly reduced as a response to the solar eclipse (Figure 1). The annular solar eclipse entered western Yunnan and traveled quickly eastward. The eclipse’s effects on irradiance in Yunnan lasted for about 4 h. Before the solar eclipse (13:00 CST, Figure 2A), TSI was stepped distributed and gradually reduced from northwest to southeast, in which O3 in the northwest was a slight increase in the range of 0%–40% and O3 decreases were smaller than 40% in the southeast. When the solar eclipse entered Yunnan around 14:00 CST (Figure 2B), O3 in the central and eastern region decreased slightly, with a decrease from −30% to −60%. At this time, the TSI in the western region decreased significantly, with a decrease from −80% to −100%, which was clearly affected by the solar eclipse. At 15:00 CST (Figure 2C), as the solar eclipse gradually moved eastward, the areas of TSI decline also moved eastward. There is a slight decrease in the northwest region and a sharp decrease in the southeast region. The solar eclipse left Yunnan at 16:00 CST (Figure 2D) and then the TSI began to recover. TSI in the central and northern regions began to increase with increasing latitude, and the range of the increase is from 35% to 90%. However, the southern areas have been decreased in TSI, in which southwest irradiance was from −80% to −20% and southeast irradiance was from −20% to −10%. The solar eclipse would end in Yunnan at about 17:00 CST. There were irradiance increases in the central and eastern regions, with an increase of nearly 150%. Whereas, the irradiance in the western regions decreased from −20% to −80% (Figure 2E). The irradiance changes were similar to that before the solar eclipse. At 18:00 CST (Figure 2F), the solar eclipse completely left Yunnan province. The irradiance enhancement in the southern region and reductions in the western region can be observed.
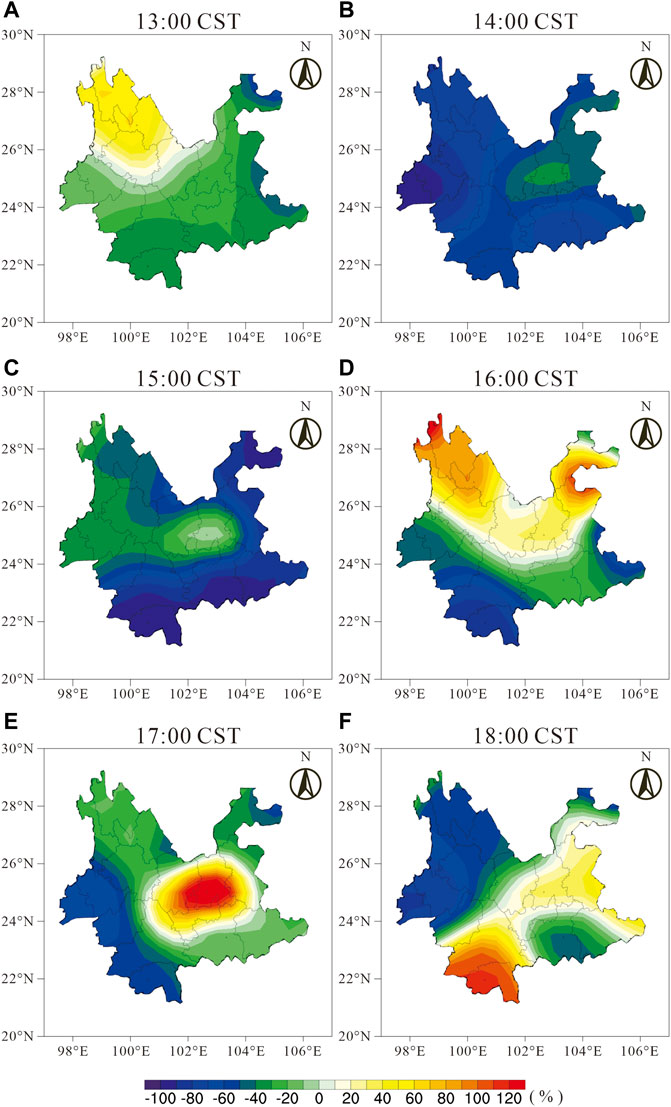
FIGURE 2. The variations in percentage of total solar irradiance at the ground station in Yunnan. The differences in percentage of irradiance are calculated by (hourly total irradiance-hourly total irradiance mean)/hourly total irradiance mean. Here the mean total irradiance between 18th and 20th is obtained to be solar irradiance during non-solar eclipse.
Kunming, the capital city of Yunnan province, is in the central and eastern part of Yunnan province (25°2′N, 102°39′E). The solar eclipse started in Kunming at 14:02 CST and ended at 17:12 CST. The maximum obscuration of the eclipse was at 15:45 CST. Before the start of the solar eclipse, the TSI showed a slight decrease of −24%. The irradiance dropped to −36% after the eclipse started. Approaching the maximum obscuration, the TSI has little changed, and its changes were close to 0 compared to the eclipse beginning. After the eclipse’s maximum obscuration, the TSI began to recover, with an increase of 35%. Approaching the eclipse ends, the irradiance increased up to 149%. After the eclipse completely left, the irradiance increased to 36% (Figure 2).
We find that the solar eclipse entered from the west of Yunnan, gradually traveled from west to east, and finally left from the east. While the solar radiation was closely related to the solar eclipse. Before the solar eclipse started, the solar radiation showed a slight change. During the maximum obscuration of the eclipse, the solar radiation changed with the solar eclipse moving and gradually decreased significantly from west to east. A drop of about 100% in reductions of TSI can be observed. After the maximum obscuration of the eclipse, the TSI fluctuated slightly during the recovery period. During the short recovery period, irradiance is recovered to normal., After the solar eclipse completely left Yunnan province, the impacts of the solar eclipse on the TSI had no obvious regularity, and the impact of the TSI on the whole Yunnan province lasted for about 4 h.
Ozone in the stratosphere is the Earth’s barrier, which can shield the Earth from the damage of the solar ultraviolet ray. However, surface ozone is a pollutant, which induces aggravating respiratory irritation and lung injury. The changes in O3 affect air quality. Figure 3 shows the variation percentage of O3 in Yunnan, which is calculated the same as TSI ((O3-O3 means)/O3 means). Thus, Figure 3 gives the effects of the solar eclipse on O3, which eliminates the effects of diurnal variations. At 13:00 CST on June 21 (Figure 3A), before the solar eclipse in Yunnan, a little change with a range between −10% and 10% in O3 was observed in the northwest, central-eastern, and southern. The variations of O3 in western Yunnan were about -20%. However, O3 was reduced by 50% and 25% in the northeast and southeast Yunnan, respectively. The decreases in O3 may be affected by the local meteorological condition. The increases in O3 of 20%–50% can be observed in Dehong.
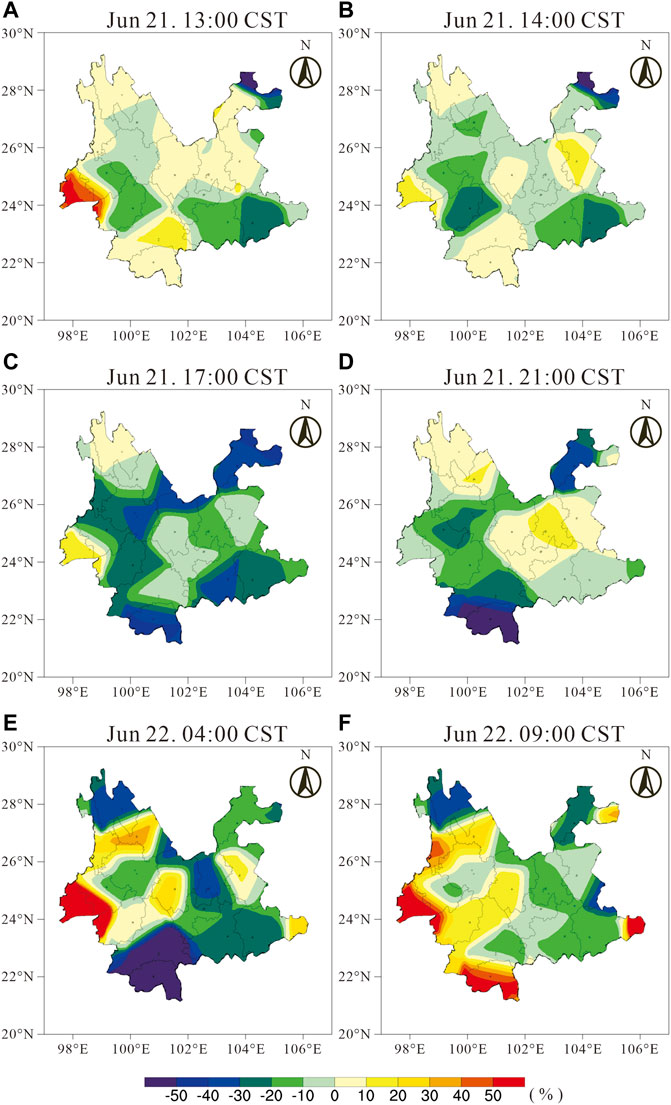
FIGURE 3. Same as Figure 2, but for surface ozone.
When the solar eclipse commenced at 14:00 CST (Figure 3B) in Yunnan, there was obvious depletion of O3 by −10% to −30% in the western and central regions. The maximum depletion was located in Lincang. There is a strong connection between the O3 depletion region and the TSI decrease region. The solar eclipse entered the western region of Yunnan at 14:00 CST. Thus, the changes of O3 in the western were related to the solar eclipse. O3 in the eastern region has no significant changes and was the same as that in quiet time at 13:00 CST.
The solar eclipse ended at 17:00 CST (Figure 3C) in Yunnan. The O3 decreases presented in the whole Yunnan province. The significant decreases from −10% to −40% in O3 occurred in most of the region, while O3 variations in the northwest and the central eastern region were relatively weak. The O3 changes reached the maximum in most of the Yunnan, except for the southwest Yunnan.
During the recovery periods (Figure 3D), the effects of the solar eclipse on O3 began to fade at 21:00 CST in most regions of Yunnan. The decline of O3 in western and southeastern weakened significantly. O3 increased from 10% to 30%. The northwest and central region recovered fully to normal., However, O3 in Xishuangbanna continued to decrease from −30% to −50%. At 04:00 CST on June 22 (Figure 3E), the O3 in the western region continued to rise with a range of 20%–50%. O3 variations in the western and central regions were stable with a range of −15%–10%. The decrease of O3 in Xishuangbanna reached the minimum value. Whereas, O3 in the central and Diqing region began to decrease, which was associated with the meteorological condition and not caused by the eclipse. At this time, the effects of the solar eclipse on O3 in most of the regions have finished, except for the Xishuangbanna region.
The influences of the solar eclipse on O3 recovered completely at 09:00 CST on June 22 (Figure 3F). There were no significant changes in O3, with a range of −15%–15%, in the northeast, central and southeast regions. The increases in O3 ranging from 20% to 50% can be seen in the whole western region, except for Diqing. The O3 in Diqing was the same as that at 04:00 CST. Compared with the O3 before the eclipse (Figure 3A), the changes in O3 at 09:00 CST were similar, which were mainly increases and relatively weak decreases. The effects of the solar eclipse on O3 in Yunnan have vanished.
Compared to the observation of the other 4 days, a maximum depletion of 25
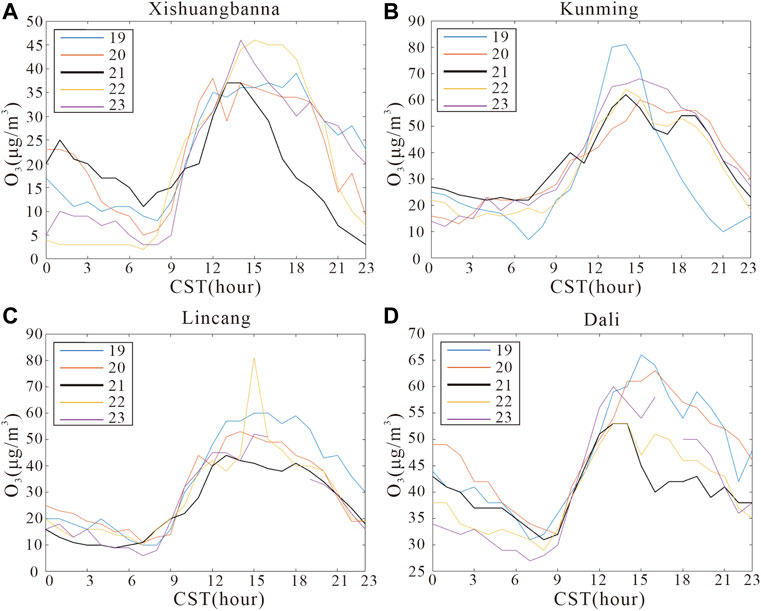
FIGURE 4. The variations of surface ozone concentration at different sites from 19th to 23rd June, 2020. The annular solar eclipse is on 21st June (black lines).
The impacts of the solar eclipse on O3 concentrations in different cities showed a different response. The solar eclipse had a significant impact on these three cities. The concentration changes of O3 in Dali, Xishuangbanna, and Lincang showed a significant decrease during the solar eclipse, then gradually returned to normal., The recovery periods of these three cities were different, with which the recovery period in Xishuangbanna was the longest. The effects of the eclipse on O3 in Kunming were weak and had a short duration.
Therefore, O3 changes were small before the solar eclipse. As the solar eclipse entered Yunnan, the O3 gradually decreased. The decreases in O3 became more and more significant until the solar eclipse left Yunnan. O3 reached its minimum when the eclipse left Yunnan, and the O3 depletion was from −10% to −40%. After the eclipse left Yunnan, O3 began to recover, except for the southwest region. O3 recovered after 8 h of eclipse occurrence, while O3 in the southwest region continued to decrease and reached a minimum value of -60% until 04:00 CST on June 22. The effects of the solar eclipse on O3 recovered completely at 09:00 CST on June 22. The influence of the solar eclipse on O3 in Yunnan lasted for about 20 h. The results of O3 caused by eclipse were similar to the previous study, while the O3 reductions lasted significantly longer and the minimum value of O3 occurred later than that in the previous study.
As precursor gases, NO2 and CO were important to the production of O3 (e.g., Nishanth et al., 2011; Vyas et al., 2012). Figure 5 and Figure 6 give the variation percentage of NO2 and CO in Yunnan, respectively. Before the solar eclipse (13:00 CST on June 21, Figure 5A), little changes in NO2 can be observed in most regions, except for Kunming. There were significant decreases of -50% in Kunming. When the solar eclipse entered Yunnan (14:00 CST on June 21, Figure 5B), decreases and increases of NO2 in Yunnan occurred. The NO2 reduced by −10% to −20% in the western region. The minimum value of NO2 changes occurred in Zhaotong, which reached −40%. NO2 increased by 10% compared to that at 13:00 CST in the northwest and central region. At 14:00 CST (Figure 5C), NO2 in the southwest region continued to reduce, especially decrease in 40% in Lincang. NO2 in Baoshan and Dali have been recovered. NO2 in Dali increased by 40%. NO2 in the northeast region continued to decrease and penetrated to the central region. Increases in NO2 can be observed at 16:00 CST (Figure 5D) in most of Yunnan. The NO2 decreases of −40% in Lincang and Zhaotong have been maintained. Therefore, NO2 in most of Yunnan has been recovered at 16:00 CST. The effects of the solar eclipse on NO2 concentration only lasted for 3 h.
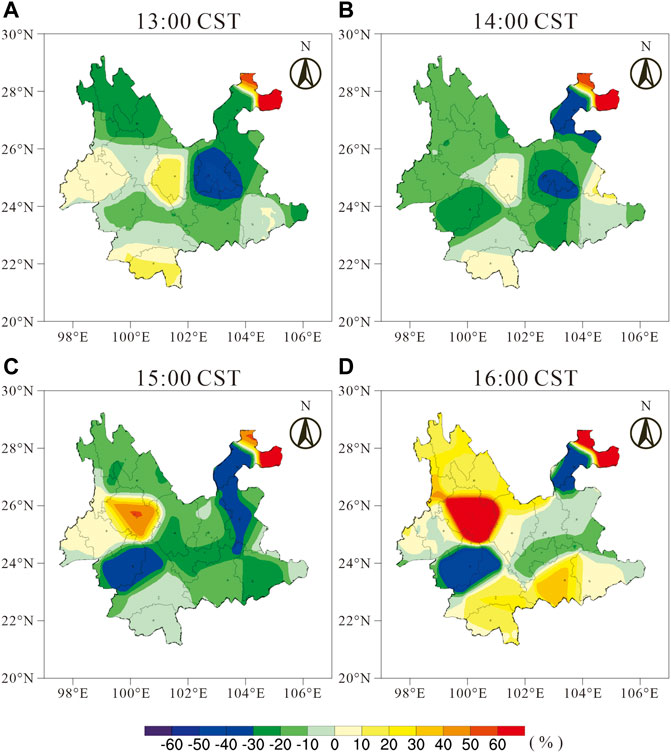
FIGURE 5. Same as Figure 2, but for NO2.
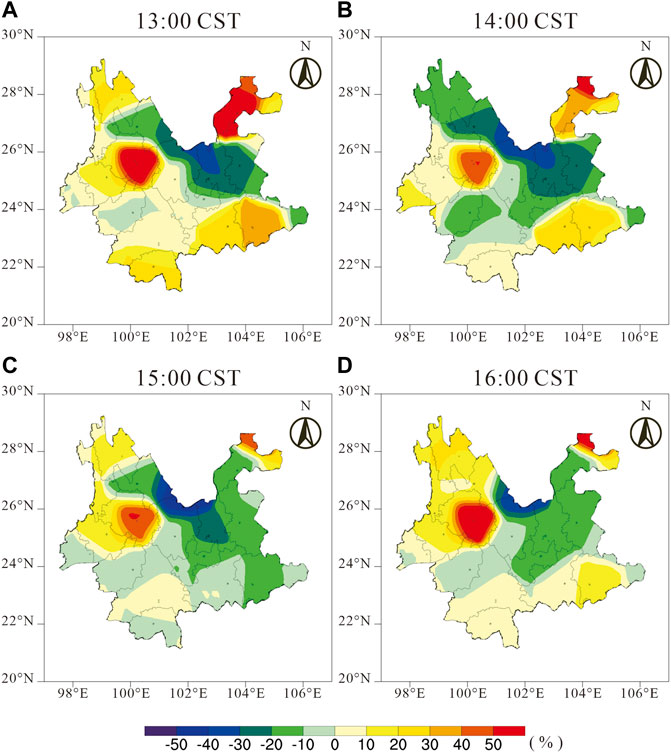
FIGURE 6. Same as Figure 2, but for CO.
As another precursor gas, the changes of CO were smaller than that of NO2 during the solar eclipse. The changes in CO were minor during the eclipse in Yunnan. CO reduced by −10% to −20% in the whole of Yunnan from 13:00 CST to 14:00 CST (Figures 6A,B), except Honghe maintained its previous state. At 15:00 CST (Figure 6C), CO increased by 10% in the central and northern regions of Yunnan. CO in the southern region decreased by 10%. A CO increase of 10% can be seen in the whole of Yunnan at 16:00 CST (Figure 6D). Thus, a slight CO variation of 10% can be observed.
To explore the reason causing the O3 variation during the solar eclipse, we selected the four typical Yunnan cities (Same as Figure 4), Lincang, Xishuangbanna, Dali, and Kunming, respectively. The correlation coefficients between O3 and temperature, relative humidity, NO2, CO, and TSI were calculated from 18th to 24th (quiet time) and solar eclipse (21st) as shown in Table 1, in which R represented the correlation coefficients. The sites of TSI observation are far fewer than CNEMC sites, thus we selected two sites of the four sites in Figure 4, where TSI data was available in Xishuangbanna (Figure 7) and Kunming (Figure 8), to show multivariate analysis.
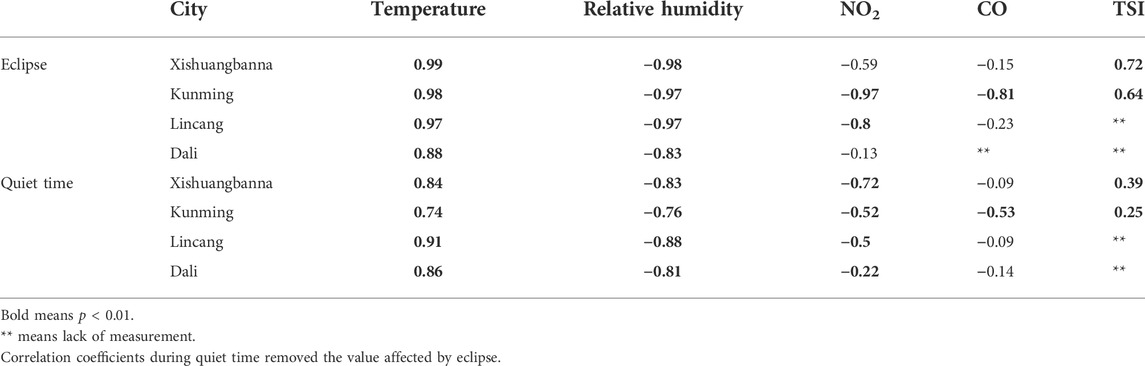
TABLE 1. The correlation coefficients between surface O3 and temperature, relative humidity, NO2, and CO at different sites in Yunnan during solar eclipse (14:00 CST on 21st to 05:00 CST on 22nd) and quiet time from 18th to 24th June, 2020.
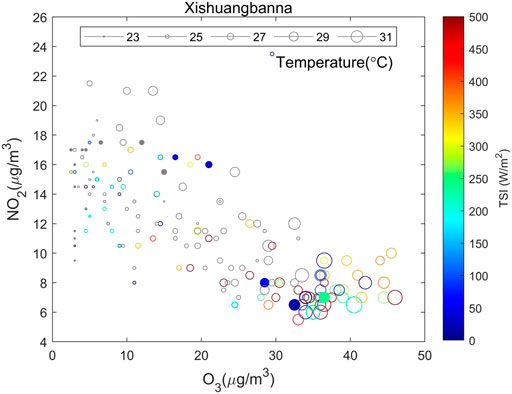
FIGURE 7. The relationships between O3 and NO2, temperature, and TSI at Xishuangbanna from 19th to 23rd June, 2020. The circle size and color represent temperature and total solar irradiance. Grey circles means missing TSI at night. Solid circles are affected by solar eclipse from 14:00 CST on 21st to 06:00 CST on 22nd June, 2020.
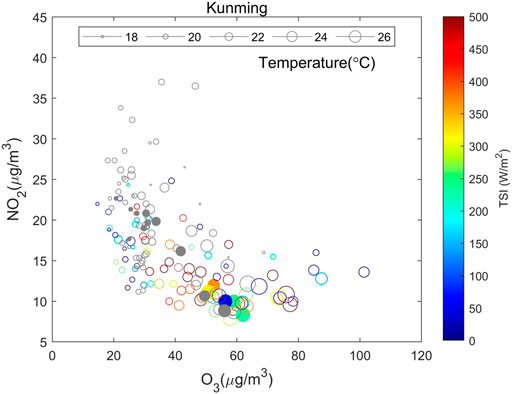
FIGURE 8. Same as Figure 7, but for Kunming.
Xishuangbanna is a tropical and sunniest city, and TSI is generally above 350
Kunming is a special city during this eclipse, TSI was similar to that during quiet time. Blue circles were less in Figure 8, which means TSI was similar to quiet time and the effects of the eclipse on TSI were minor. In addition, the influences of TSI on O3 were minor. Warm and low NO2 were in the daytime, and cold and high NO2 were in the nighttime. The correlation between O3 and temperature was significantly positive and the correlation coefficient reached 0.98 during the eclipse (Figure 8; Table 1). O3 and NO2 have a negative correlation relationship (R = −0.97), passing the significance test (p < 0.01, Table 1). Therefore, there was higher O3 in the daytime and lower O3 in the nighttime. In the other three cities, CO has no significant effects on O3. However, the O3 in Kunming had a significant negative correlation with CO through a significant test during the solar eclipse and quiet time, in which the correlation coefficient was obviously larger during the eclipse. The increases in CO were observed in Kunming during the beginning and maximum obscuration. CO changes were minor due to the non-reaction of CO compared to NO2. However, for Kunming, CO increases were associated with the chemical reaction of altering CO, etc., like
O3 in Lincang was positively correlated with temperature and the relationship was credible by the significance test (p < 0.01), which was 0.91 (0.97, where the R in parentheses was the correlation coefficient during the solar eclipses, the same as below). The O3 was negatively correlated with the relative humidity and NO2, passing the significance test (p < 0.01). R was −0.88 (−0.97) and −0.5 (−0.8). The correlation coefficient between the O3 and CO did not pass the significance test. During the solar eclipse, temperature, relative humidity, and NO2 in Lincang were more important for O3 changes than that in quiet time, as the correlation coefficients were larger during a solar eclipse than that in quiet time.
O3 in Dali and its temperature have a positive correlation relationship, passing the significance test (p < 0.01). R is 0.86 (0.88). O3 and relative humidity are negatively correlated, passing the significance test (p < 0.01). R is −0.81 (−0.83). CO was invariant during the eclipse, which was unavailable. The correlation coefficients between O3 and NO2 failed in the significance test. The effects of temperature and relative humidity on O3 were fairly weak during the solar eclipse. NO2 and CO did not show significant importance for O3 in Dali.
As the solar eclipse occurred, reductions in solar irradiance were directly observed in different locations around the world. Founda et al. (2007) reported that solar irradiance was reduced by 89% and 100% over Thessaloniki and Kastelorizo, respectively. Girach et al. (2012) found that solar irradiance decline was most obvious over Thumba, India during the annular solar eclipse on 15 January 2010. During the solar eclipse events on 21 June 2020, due to the moon’s shadow, the solar irradiance decreased by more than -90%, and the whole process lasted for about 5 h in Yunnan (Figure 2).
On the one hand, various meteorological conditions changed response to radiation variations. The temperature in Yunnan reduced during the solar eclipse, which is consistent with previous studies (Eaton et al., 1997; Anderson, 1999; Krishnan et al., 2004; Tzanis et al., 2008; Girach et al., 2012; Burt, 2018). O3 and temperature in many cities in Yunnan are significantly and positively correlated (Table 1). Thus, the temperature is a greatly important factor in affecting the photochemical reaction of O3. As the temperature decreased, O3 also reduced which is consistent with previous studies (Sheehan and Bowman, 2001; Kleeman, 2008). An increasing trend in relative humidity changes is observed at most sites throughout the solar eclipse event (Table 1). Previous studies also reported an increase in relative humidity during solar eclipse events (Tzanis et al., 2008; Namboodiri et al., 2011; Prasad et al., 2019). Temperature and humidity were inversely proportional., The relative humidity would respond as the temperature changed. The radiation is further reduced due to the strong relative humidity and affects the photochemical reaction of O3, thereby reducing O3 which is consistent with previous studies (Kumar et al., 2014; Manju et al., 2018).
On the other hand, as a reaction precursor gas of ozone production, NO2 changes can be observed during the solar eclipse. Sharma et al. (2010) observed NO2 decreases from 2.52 to 0.78 ppb during a solar eclipse. However, Vyas et al. (2012) found that the differences in NO2 increased slightly from −1.8 to 0.9 ppb during the maximum obscuration of the solar eclipse. After the maximum obscuration, there was a certain fluctuation in the range of 0.9–1.6 ppb. Nishanth et al. (2011) found that there are no changes in NOx caused by the solar eclipse. During the solar eclipse on June 21, the effects of the solar eclipse on NO2 in different cities of Yunnan are various. Decreases, increases, and invariance of NO2 have been observed in response to eclipse. NO2 in Kunming gradually increased from −40% to −10% with the solar radiation decreases. NO2 in Dali and Xishuangbanna firstly decreased and then increased. NO2 in Lincang decreased and minimum values can reach −40% during the entire eclipse (Figure 5). O3 in Lincang and Kunming were negatively correlated with the NO2 (Table 1), which means O3 increased and NO2 decreased. Whereas, there was no significant relationship between O3 and NO2 in Dali and Xishuangbanna (Table 1). O3 is produced under photodissociation of NO2 at wavelengths shorter than ∼420 nm, etc., like
There are significant decreases in O3 during a solar eclipse (Zerefos et al., 2001; Tzanis et al., 2008; Girach et al., 2012; Jain et al., 2020; Patel and Singh, 2021; Pratap et al., 2021). The significant effects of the solar eclipse were manifested with a certain delay from the maximum obscuration. The delay was associated with the slow destruction process of O3 (Tzanis et al., 2008; Girach et al., 2012). The slow destruction process of O3 during the solar eclipse is a fairly complex process, which is associated with meteorological parameters, such as solar radiation, temperature, relative humidity, and other pollutants, NO2 and CO (Gerasopoulos et al., 2007). The seasons and months in which solar eclipse events occur also play a very important role in these changes in atmospheric parameters (Tzanis et al., 2008).
In this paper, we examine the effects of the solar eclipse on O3 in Yunnan, China. By analyzing TSI, O3, NO2, CO, temperature, and relative humidity obtained from CNEMC and CMDSC during the solar eclipse on 21 June 2020, we have reached the following conclusions:
(1) TSI decreases more than 90% during the solar eclipse on 21 June 2020. This TSI decreases moving from west to east and last 3 h in Yunnan. The total influences of the solar eclipse on TSI in Yunnan last for about 5 h.
(2) In the early phase of the solar eclipse, O3 reduces by −10%∼−20% in the western region of Yunnan. As the eclipse travels east, the O3 depletion becomes more and more significant and penetrates the whole of Yunnan. The O3 changes reach the minimum value of more than −40% and then O3 starts to recover in Yunnan when the solar eclipse leaves Yunnan. The western and southern regions are more sensitive to eclipse, because these regions show more rapid and significant O3 reductions. The response of O3 to solar eclipse lasted for 8 h in most of Yunnan. However, O3 variations last 20 h in the whole of Yunnan, due to slow recovery in Xishuangbanna.
(3) O3 and temperature were positively correlated and the relationship is closest to other meteorological parameters. Whereas, O3 was linearly negatively correlated with relative humidity.
(4) As the precursors, NO2 is more important than CO to O3 changes during the solar eclipse. Decreases, increases, and invariance of NO2 can be observed. The impacts of the eclipse on NO2 last for 4 h. O3 and NO2 in most cities of Yunnan are a significantly negative correlation.
(5) Among the cities in Yunnan during the solar eclipse, only O3 in Kunming was negatively correlated with CO. The O3 in the seriously polluted city is more sensitive to NO2 and CO during the eclipse.
The original contributions presented in the study are included in the article/Supplementary Material, further inquiries can be directed to the corresponding author.
YT, JLu, FS, and JLi contributed to conception and design of the study. FS, SX, GW, ZL, HZ, GY and organized the database. CY, JC, YW, SJ, JY, JW, ZZ, and ZW performed the statistical analysis. YT wrote the first draft of the manuscript. JLi wrote sections of the manuscript. All authors contributed to manuscript revision, read, and approved the submitted version.
The work is supported by the National Natural Science Foundation of China (grants 42004132, 42030203, and 42074183), the Startup Foundation for Introducing Talent of NUIST (2020r052), the China Geological Survey (ZD20220145 and ZD20220135), the open funding of MNR Key Laboratory for Polar Science (KP202104), and the stable support projects of institutes for basic scientific research (A131902W03).
We highly acknowledge CNEMC and CMDSC provide the hourly pollutants and meteorological data at ground stations in China. Meteorological data was downloaded from the China Meteorological Data Network (http://data.cma.cn), mainly including hourly temperature, relative humidity, and total solar irradiance. Hourly O3 and NO2 data was downloaded from the China National Environmental Monitoring Centre (http://106.37.208.233:20035). The data is also being saved on the National Space Science Data Center (DOI: 10.12176/04.99.02959).
The authors declare that the research was conducted in the absence of any commercial or financial relationships that could be construed as a potential conflict of interest.
All claims expressed in this article are solely those of the authors and do not necessarily represent those of their affiliated organizations, or those of the publisher, the editors and the reviewers. Any product that may be evaluated in this article, or claim that may be made by its manufacturer, is not guaranteed or endorsed by the publisher.
Amiridis, V., Melas, D., Balis, D. S., Papayannis, A., Founda, D., Katragkou, E., et al. (2007). Aerosol Lidar observations and model calculations of the planetary boundary layer evolution over Greece, during the March 2006 total solar eclipse. Atmos. Chem. Phys. 7, 6181–6189. doi:10.5194/acp-7-6181-2007
Anderson, R. C., Keefer, D. R., and Myers, O. E. (1972). Atmospheric pressure and temperature changes during the 7 march 1970 solar eclipse. J. Atmos. Sci. 29, 583–587. doi:10.1175/1520-0469(1972)029<0583:apatcd>2.0.co;2
Anderson, J. (1999). Meteorological changes during a solar eclipse. Weather 54 (7), 207–215. doi:10.1002/j.1477-8696.1999.tb06465.x
Aplin, K. L., Scott, C. J., and Gray, L. (2016). Atmospheric changes from solar eclipses. Phil. Trans. R. Soc. A 374, 20150217–20150224. doi:10.1098/rsta.2015.0217
Baran, L. W., Ephishov, I. I., Shagimuratov, I. I., Ivanov, V. P., and Lagovsky, A. F. (2003). The response of the ionospheric total electron content to the solar eclipse on August 11, 1999. Adv. Space Res. 31 (4), 989–994. doi:10.1016/S0273-1177(02)00885-2
Burt, S. (2018). Meteorological impacts of the total solar eclipse of 21 August 2017. Weather 73 (3), 90–95. doi:10.1002/wea.3210
Chakrabarty, D. K., Shah, N. C., and Pandya, K. V. (1997). Fluctuation in ozone column over Ahmedabad during the solar eclipse of 24 October 1995. Geophys. Res. Lett. 24 (23), 3001–3003. doi:10.1029/97GL03016
Chimonas, G., and Hines, C. O. (1971). Atmospheric gravity waves induced by a solar eclipse. J. Geophys. Res. 76, 7003–7005. doi:10.1029/ja076i028p07003
Chung, Y. S., Kim, H. S., and Choo, S. H. (2010). The solar eclipse and associated atmospheric variations observed in South Korea on 22 July 2009. Air Qual. Atmos. Health 3, 125–130. doi:10.1007/s11869-009-0060-0
Eaton, F. D., Hines, J. R., Hatch, W. H., Cionco, R. M., Byers, J., Garvey, D., et al. (1997). Solar eclipse effects observed in the planetary boundary layer over a desert. Bound. Layer. Meteorol. 83 (2), 331–346. doi:10.1023/a:1000219210055
Founda, D., Melas, D., Lykuodis, S., Lisaridis, I., Gerasopoulos, E., Kouvarakis, G., et al. (2007). The effect of the total solar eclipse of 29 March 2006 on meteorological variables in Greece. Atmos. Chem. Phys. 7, 5543–5553. doi:10.5194/acp-7-5543-2007
Gerasopoulos, E., Zerefos, C. S., Tsagouri, I., Founda, D., Amiridis, V., Bais, A. F., et al. (2007). The total solar eclipse of march 2006: An overview. Atmos. Chem. Phys. Discuss. 7, 17663–17704. doi:10.5194/acp-8-5205-2008
Girach, I. A., Nair, P. R., David, L. M., Hegde, P., Mishra, M. K., Kumar, G. M., et al. (2012). The changes in nearsurface ozone and precursors at two nearby tropical sites during annular solar eclipse of 15 January 2010. J. Geophys. Res. Atmos. 117 (D1), 1–14. doi:10.1029/2011JD016521
Gray, S. L., and Harrison, R. G. (2012). Diagnosing eclipse-induced wind changes. Proc. R. Soc. A 468, 1839–1850. doi:10.1098/rspa.2012.0007
Hanna, E., Penman, J., Jónsson, T., Grant, R., Björnsson, H., Sjúrðarson, S., et al. (2016). Meteorological effects of the solar eclipse of 20 march 2015: Analysis of UK met office automatic weather station data and comparison with automatic weather station data from the faroes and Iceland. Philos. Trans. R. Soc. A Math. Phys. Eng. Sci. 374, 20150212. doi:10.1098/rsta.2015.0212
Hanna, E. (2018). Meteorological effects of the 20 March 2015 solar eclipse over the United Kingdom. Weather 73 (3), 71–80. doi:10.1002/wea.2820
Jain, C. D., Venkat Ratnam, M., and Madhavan, B. L. (2020). Direct and indirect photochemical impacts on the trace gases observed during the solar eclipse over a tropical rural location. J. Atmos. Solar-Terrest. Phys. 211, 105451. doi:10.1016/j.jastp.2020.105451
Kazadzis, S., Bais, A., Blumthaler, M., Webb, A., Kouremeti, N., Kift, R., et al. (2007). Effects of total solar eclipse of 29 march 2006 on surface radiation. Atmos. Chem. Phys. 7, 9235–9258. doi:10.5194/acpd-7-9235-2007
Kleeman, M. J. (2008). A preliminary assessment of the sensitivity of air quality in California to global change. Clim. Change 87 (S1), 273–292. doi:10.1007/s10584-007-9351-3
Kolev, N., Tatarov, B., Grigorieva, V., Donev, E., Simeonov, P., Umlensky, V., et al. (2005). Aerosol Lidar and in situ ozone observations of the planetary boundary layer over Bulgaria during the solar eclipse of 11 August 1999. Int. J. Remote Sens. 26 (16), 3567–3584. doi:10.1080/01431160500076939
Krishnan, P., Kunhikrishnan, P. K., Nair, S. M., Ravindran, S., Ramachandran, R., Subrahamanyam, D. B., et al. (2004). Observations of the atmospheric surface layer parameters over a semi arid region during the solar eclipse of August 11th, 1999. J. Earth Syst. Sci. 113 (3), 353–363. doi:10.1007/BF02716730
Kumar, A., Singh, B. P., Punia, M., Singh, D., Kumar, K., and Jain, K. (2014). Determination of volatile organic compounds and associated health risk assessment in residential homes and hostels within an academic institute. New Delhi. Indoor Air 24, 474–483. doi:10.1111/ina.12096
Manju, A., Kalaiselvi, K., Dhananjayan, V., Palanivel, M., Banupriya, G. S., Vidhya, M. H., et al. (2018). Spatio-seasonal variation in ambient air pollutants and influence of meteorological factors in Coimbatore, Southern India. Air Qual. Atmos. Health 11 (10), 1179–1189. doi:10.1007/s11869-018-0617-x
Monks, P. S., Archibald, A. T., Colette, A., Cooper, O., Coyle, M., Derwent, R., et al. (2015). Tropospheric ozone and its precursors from the urban to the global scale from air quality to short-lived climate forcer. Atmos. Chem. Phys. 15 (15), 8889–8973. doi:10.5194/acp-15-8889-2015
Namboodiri, K. V. S., Dileep, P. K., Mammen, K., Ramkumar, G., Kiran Kumar, N. V. P., Sreenivasan, S., et al. (2011). Effects of annular solar eclipse of 15 January 2010 on meteorological parameters in the 0 to 65 km region over Thumba, India. metz. 20 (6), 635–647. doi:10.1127/0941-2948/2011/0253
Nishanth, T., Ojha, N., Kumar, M., and Naja, M. (2011). Influence of solar eclipse of 15 january 2010 on surface ozone. Atmos. Environ. 45 (9), 1752–1758. doi:10.1016/j.atmosenv.2010.12.034
Panda, S. K., Gedam, S. S., Rajaram, G., Sripathi, S., and Bhaskar, A. (2015). Impact of the 15 January 2010 annular solar eclipse on the equatorial and low latitude ionosphere over the Indian region. J. Atmos. Solar-Terrest. Phys. 135, 181–191. doi:10.1016/j.jastp.2015.11.004
Pasachoff, J. M. (2009). Scientific observations at total solar eclipses. Res. Astron. Astrophys. 9 (6), 613–634. doi:10.1088/1674-4527/9/6/001
Patel, K., and Singh, A. K. (2021). Changes in atmospheric parameters due to annular solar eclipse of June 21, 2020, over India. Indian J. Phys. 96, 1613–1624. doi:10.1007/s12648-021-02112-2
Prasad, S. B. S., Kumar, V., Reddy, K. K., Dhaka, S. K., Malik, S., Reddy, M. V., et al. (2019). Perturbations in Earth’s atmosphere over an Indian region during the total solar eclipse on 22 july 2009. J. Meteorol. Res. 33 (4), 784–796. doi:10.1007/s13351-019-8056-7
Pratap, V., Kumar, A., and Singh, A. K. (2021). Overview of solar eclipse of 21st June 2020 and its impact on solar irradiance, surface ozone and different meteorological parameters over eight cities of India. Adv. Space Res. 68, 4039–4049. doi:10.1016/j.asr.2021.08.014
Reid, S. J., Vaughan, G., Mitchell, N. J., Prichard, I. T., Smit, H. J., Jorgensen, T. S., et al. (1994). Distribution of ozone laminae during EASOE and the possible influence ofinertiagravity waves. Geophys. Res. Lett. 21 (13), 1479–1482. doi:10.1029/93GL01676
Sharma, S. K., Mandal, T. K., Arya, B. C., Saxena, M., Shukla, D. K., Mukherjee, A., et al. (2010). Effects of the solar eclipse on 15 January 2010 on the surface O3, NO, NO2, NH3, CO mixing ratio and the meteorological parameters at Thiruvanathapuram, India. Ann. Geophys. 28 (6), 1199–1205. doi:10.5194/angeo-28-1199-2010
Sheehan, P. E., and Bowman, F. M. (2001). Estimated effects of temperature on secondary organic aerosol concentrations. Environ. Sci. Technol. 35 (11), 2129–2135. doi:10.1021/es001547g
Subrahmanyam, K. V., Ramkumar, G., Kumar, K. K., Swain, D., Sunil Kumar, S. V., Das, S. S., et al. (2011). Temperature perturbations in the troposphere-stratosphere over Thumba (8.5° N, 76.9° E) during the solar eclipse 2009/2010. Ann. Geophys. 29 (2), 275–282. doi:10.5194/angeo-29-275-2011
Tzanis, C., Varotsos, C., and Viras, L. (2007). Impacts of the solar eclipse of 29 march 2006 on the surface ozone and nitrogen dioxide concentrations at Athens, Greece. Atmos. Chem. Phys. Discuss. 7 (5), 14331–14349. doi:10.5194/acpd-7-14331-2007
Tzanis, C., Varotsos, C., and Viras, L. (2008). Impacts of the solar eclipse of 29 March 2006 on the surface ozone concentration, the solar ultraviolet radiation and the meteorological parameters at Athens, Greece. Atmos. Chem. Phys. 8 (2), 425–430. doi:10.5194/acp-8-425-2008
Vyas, B. M., Saxena, A., and Panwar, C. (2012). Study of atmospheric air pollutants during the partial solar eclipse on 15 january 2010 over Udaipur: A semi-arid location in Western India. Adv. Space Res. 50 (11), 1553–1563. doi:10.1016/j.asr.2012.07.021
Wang, J., Yang, Y., Zhang, Y., Niu, T., Jiang, X., Wang, Y., et al. (2019). Influence of meteorological conditions on explosive increase in O3 concentration in troposphere. Sci. Total Environ. 652, 1228–1241. doi:10.1016/j.scitotenv.2018.10.228
Keywords: solar eclipse, surface ozone, total irradiance, CO, NO2
Citation: Tian Y, Li J, Yang C, Cui J, Shen F, Lu J, Xiong S, Wei G, Li Z, Zhang H, Yang G, Wu Y, Wei Z, Jiang S, Yao J, Wang J and Zhu Z (2022) Effects of the annular eclipse on the surface O3 in yunnan province, China. Front. Environ. Sci. 10:968507. doi: 10.3389/fenvs.2022.968507
Received: 14 June 2022; Accepted: 01 August 2022;
Published: 29 August 2022.
Edited by:
Haofei Yu, University of Central Florida, United StatesReviewed by:
Ioannis Konstantinos Christodoulakis, National and Kapodistrian University of Athens, GreeceCopyright © 2022 Tian, Li, Yang, Cui, Shen, Lu, Xiong, Wei, Li, Zhang, Yang, Wu, Wei, Jiang, Yao, Wang and Zhu. This is an open-access article distributed under the terms of the Creative Commons Attribution License (CC BY). The use, distribution or reproduction in other forums is permitted, provided the original author(s) and the copyright owner(s) are credited and that the original publication in this journal is cited, in accordance with accepted academic practice. No use, distribution or reproduction is permitted which does not comply with these terms.
*Correspondence: Jingyuan Li, amluZ3l1YW5saUBudWlzdC5lZHUuY24=; Jianyong Lu, anlsdUBudWlzdC5lZHUuY24=
Disclaimer: All claims expressed in this article are solely those of the authors and do not necessarily represent those of their affiliated organizations, or those of the publisher, the editors and the reviewers. Any product that may be evaluated in this article or claim that may be made by its manufacturer is not guaranteed or endorsed by the publisher.
Research integrity at Frontiers
Learn more about the work of our research integrity team to safeguard the quality of each article we publish.