- 1School of Resources and Planning, Guangzhou Xinhua University, Guangzhou, China
- 2School of Civil Engineering, Sun Yat-sen University, Guangzhou, China
To understand the spatio-temporal changes in the water resources carrying capacity (WRCC) of Pearl River Delta (PRD), 19 indicators were selected from three subsystems (water resources, socio-economic, and eco-environment), and the entropy weight-TOPSIS model was employed to analyze the WRCC of each cities in PRD from 2015 to 2020. As the result shows, the water resources subsystem (WRS) had the largest weight in the evaluation system, followed by the socio-economic subsystem (SES), and the eco-environmental subsystem (EES); among these indicators, economic density, water resources per capita, annual precipitation, and new soil erosion treatment area had the highest weights; the PRD had a low WRCC score overall, with considerable regional differences; the capacity score changed with time, but the ranking of cities remained largely the same, with Shenzhen, Zhaoqing, and Huizhou marking higher scores, whereas Zhongshan, Foshan, and Zhuhai achieving lower scores. It was also found that Shenzhen had a high score for SES, which made up for the shortage of natural water resources there; cities like Huizhou, Jiangmen, and Zhaoqing which boast rich water resources and extensive development achieved high scores for WRS and EES. As the PRD develops, it is important to optimize dispatch of water resources, boost green economy, and promote ecological wellbeing.
Introduction
Water resources play a significant role in national economy and living-standard improvement. “Water resources-based planning” is a planning strategy that takes water resources as the primary constraint in control of urban area expansion and restructuring of industry layouts. Though cities often boast rich water resources in the early stage of development, problems like water shortage, water pollution, and ecological degradation rear their ugly heads as the economy takes off and the population grows, hobbling urban development (Wu et al., 2020). Researches show that there is no consensus on the definition of water resources carrying capacity (WRCC) among researchers, and relevant studies often have varied focuses. For instance, Falkenmark and Lundqvist (1998) put forward the term “available water,” and probed into the problem of water security from the perspectives of policy determination and human adaptation. Clarke (2002) maintained that WRCC is closely related to population growth and resource depletion. Milano et al. (2013) used the “water supply/demand ratio” to assess whether the water resources in the Ebro basin would meet the current and future demands of water in the region. Given our research goals, WRCC is defined as the capacity of water resources to meet the needs of human activities in a region within a given time frame, which is subject to impacts from comprehensive factors including water resources abundance, economic-technological strength, and ecological quality (Lin et al., 2020; Zhao et al., 2020; Wang et al., 2022). Evaluating the regional WRCC is a crucial step in urban planning and construction (Buckerfield et al., 2020).
WRCC has been extensively studied. In terms of the research object, most of these studies focused on regions with a certain economic scale like basins, provinces, cities, and economic circles, which rely heavily on water resources and are likely to suffer water shortage, whether rich or lack of natural water resources. As reported by Kang et al. (2019), the Haihe River basin has a low agricultural WRCC; the agricultural WRCC in Shanxi, Inner Mongolia, and Liaoning is also small, though there is no overload problem; the WRCC in Beijing, Tianjin, Hebei, Henan, and Shandong is overloaded, and hence it is necessary to optimize groundwater development and adjust the effective irrigation area. Magri and Berezowska-Azzag (2019) evaluated the water carrying capacity (WCC) of Oran, Algeria, based on four scenarios from the aspects of urban water resources sustainability, urban economy, society and environment, and believed that compared with improving water supply, rational development and recycling of water resources is the solution to maintain WCC. Wang et al. (2022) found that under the scenario of rapid economic development, the WRCC and coupling coordination degree of Guangzhou city are the worst, the water environment protection scenario and water conservation scenario are better, and the comprehensive scenario performs the best. Wang et al. (2021) analyzed the current and future WRCC of the Chang-Ji economic circle, and pointed out the major problems of water resources there—water shortage and poor water quality.
Studies that built WRCC evaluation indicator systems turn out to be similar as most involve indicators in the subsystems such as the water resources, the socio-economic, the eco-environmental and so on, though these indicators differ from each other in the natural and social conditions of the studied area or their research focuses (Li et al., 2021; Meng et al., 2021; Wei et al., 2021). Regarding the research methods, as WRCC evaluation involves many indicators that play varied roles in the evaluation system, researchers often need to assign weights to the indicators and then obtain a comprehensive WRCC score based on the weighted mean. Such methods are legion. Wang et al. (2014a) simulated the impact of economic advances and population growth on water consumption in Tongzhou District, Beijing by the system dynamics (SD) model, and found that the region suffered from severe water shortage and the current water supply could not meet the future needs. Peng et al. (2021) proposed the Driver-Pressure-Engineering water shortage-State-Ecological Basis-Response-Management (DPESBRM) concept, and employed the cloud model to calculate the weights of WRCC indicators, which fully considers the randomness and fuzziness of the evaluation object; their method was used to evaluate the WRCC of karst areas in Guiyang, China, and the evaluation results were found to be in line with the TOPSIS-based evaluation outcomes. Deng et al. (2021) quantified the WRCC of Han River basin in 2010–2016 by set-pair analysis, and forecasted the WRCC of the basin in 2035 by the soil and water assessment tool (SWAT) model. Other evaluation methods include analytic hierarchy process (AHP) (Lu et al., 2017), system dynamics (SD) models, neural networks (Wang et al., 2014b), and TOPSIS models (Lin et al., 2020).
Despite the extensive studies on WRCC, few probed into the WRCC in the urban agglomeration of Pearl River Delta (PRD), and even less combined the spatial and temporal dimensions for comprehensive analysis (Xu et al., 2019). Compared with northern China, the PRD is rich in water resources, however, due to the large population, water resources-reliant industries, urban area expansion, and monotonous water sources in the eastern part, the PRD is plagued by water shortage as it develops. To strike a balance between water resources, environment, and economy, manage water resources in a scientific manner, and promote ecological wellbeing the PRD, we believe it is imperative to comprehensively analyze the spatio-temporal changes in the WRCC of the PRD. Based on the present work, collect data from 2015 to 2020 in the PRD, taking into account the differences in water resources, economic development and ecological environment, an WRCC evaluation index model was established, and the entropy weight-TOPSIS model was employed to perform empirical research from spatial and temporal dimensions. Suggestions were proposed based on the research findings and the differences of each cities, to provide a basis for sustainable and quality development of the PRD, and to expand the meaning of WRCC to a certain extent.
Research area overview
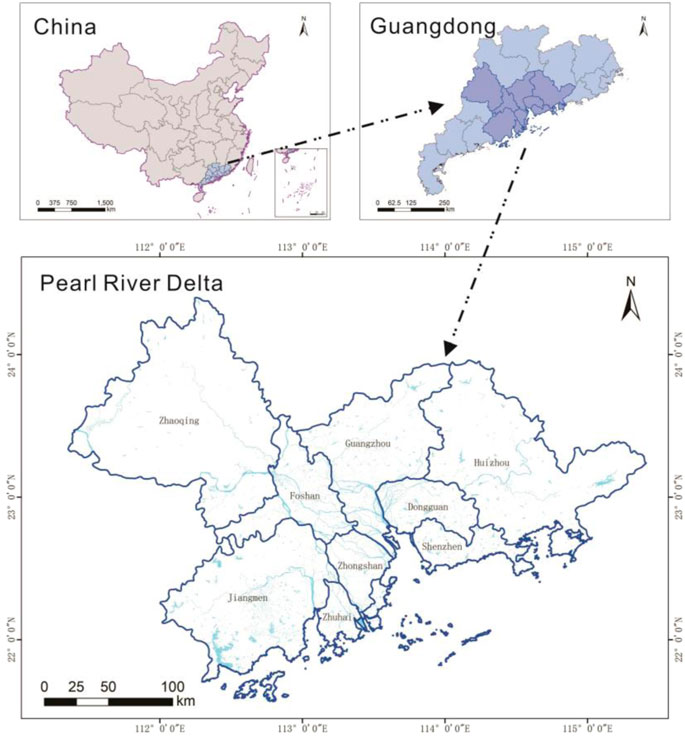
The PRD (111.35°E–115.43°E, 21.56°N–24.40°N), located in the mid-south of Guangdong province and the lower reaches of Pearl River (Figure 1), borders on South China Sea and is subject to the subtropical monsoon climate, with an annual average temperature of 21.4°C–22.4°C, and annual precipitation of 1,600–2,300 mm. The PRD accommodates nine cities, i.e., Guangzhou, Shenzhen, Zhuhai, Foshan, Huizhou, Dongguan, Zhongshan, Jiangmen, and Zhaoqing, taking up an area of 55,400 km2, which is less than one-third of the total area of Guangdong province. As one of the earliest regions that were opened up to the outside world in China, the PRD remains an economic hub for the country and the major part of the Guangdong-Hong Kong-Macau Greater Bay Area. In 2020, the PRD reached an urbanization rate of 85%, and the GDP there reached $1.4 trillion (over 80.8% of the total of Guangdong province). The PRD is at the confluence of Xijiang River, Beijiang River, and Dongjiang River, with rich dense network of waterways.
Research methodology
In the present work, WRCC evaluation index system is constructed, the entropy weight method is used to calculate the weight of each indicator, and the TOPSIS model is used to calculate the annual WRCC and scores of the three subsystems of each city from 2015 to 2020. The weights of indicators, the spatio-temporal changes in the WRCC, and the spatio-temporal changes in the subsystems are discussed, and suggestions for improving the WRCC of PRD is proposed.
Constructing the water resources carrying capacity evaluation index system
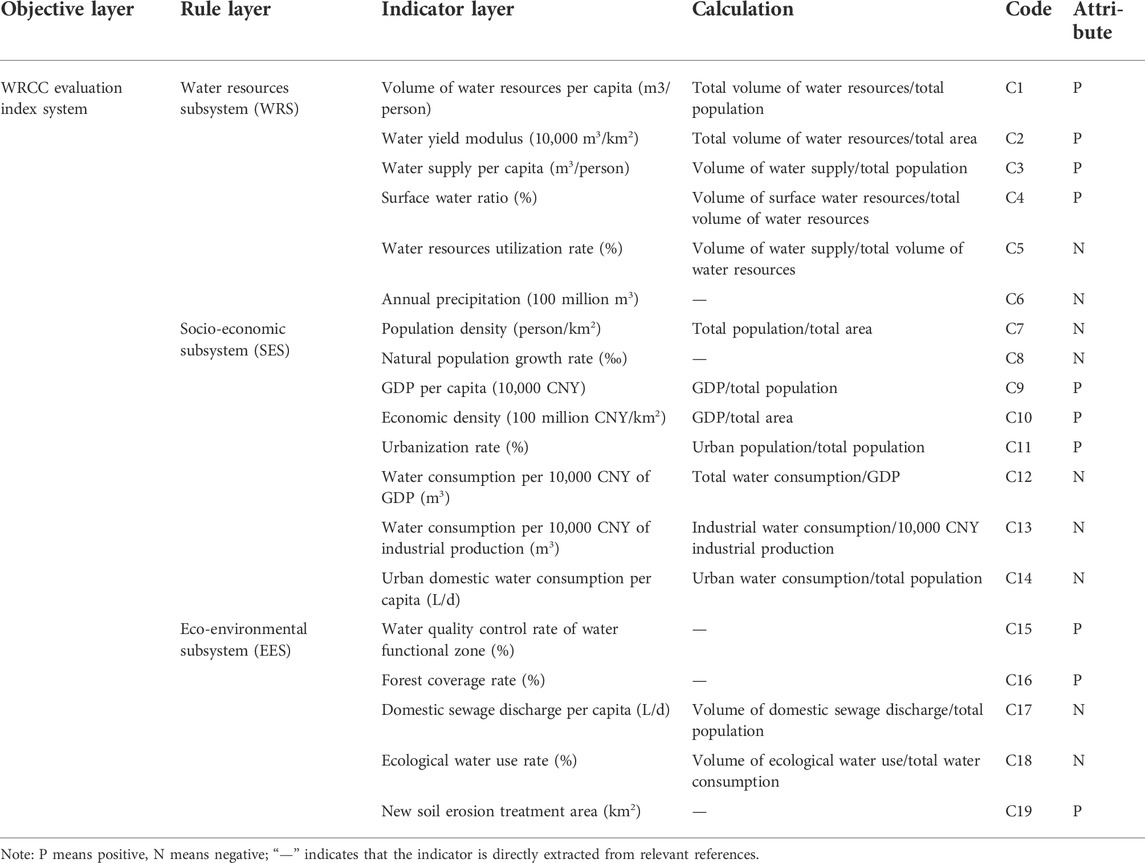
Water resources are a vital form of natural resources that social and economic advances hinge on. Developing and utilizing water resources need financial support, and a good environment is the foundation for regeneration of water resources. Thus, to assess regional WRCC, we need to build a multi-layered evaluation system that fully considers factors of water resources, economy, and the natural environment. By referring to relevant works (Xu et al., 2019; Lin et al., 2020; Zhao et al., 2020; Wang et al., 2022) and considering data availability, we constructed a WRCC evaluation indicator system for PRD. PRD is the confluence of three rivers, where cities vary considerably from each other in terms of local water yield and inflow water volume, and it is challenging to develop inflow water resources, so the water resources subsystem discussed in the present work focuses on the volume and development potential of local water resources, with the volume of water resources per capita and water yield modulus as the evaluation indicators for this subsystem. Population growth and increased water consumption will pose pressure to water resources, but development of water resources utilization facilities and protection of water resources require large economic investment, so such indicators as population density and economic density as selected to assess the socio-economic subsystem of WRCC. Factors that affect water quality like water quality control rate of water functional zone and forest coverage are selected to assess the eco-environmental subsystem of WRCC. Table 1 shows the 19 indicators selected in the present work.
Determining indicator weight by the entropy weight method
A diverse and complex collection of factors contribute to WRCC. The weights should be assigned to the indicators in an objective manner to avoid subjectivity in calculation of weights. In the present work, the entropy weight method that could objectively reflect information in the indicators was employed to resolve the problem of subjectivity of weight assignment. Generally, a smaller entropy of the indicator means a larger entropy weight and hence more importance of the indicator (Kang et al., 2019). With the dimension of time considered, the weight of indicator is calculated as follows:
1) Normalization of the indicators
The primary evaluation matrix of regional WRCC is set as follows:
There are both positive and negative indicators for WRCC evaluation. These indicators are normalized as follows:
For positive indicators:
And for negative indicators:
where
2) The weight of each indicator is:
3) The entropy of each indicator can be obtained by the following equation:
And if
4) The weight of each indicator can be obtained by the following equation:
where
TOPSIS model
The technique for order of preference by similarity to ideal solution (TOPSIS) model is a comprehensive evaluation method which can make the best of all primary information to accurately reveal the gaps between different evaluation schemes. The TOPSIS modelling process is as follows:
1) Positive processing is performed on the primary evaluation matrix:
2) The weighted normalization matrix can be obtained as follows:
3) The positive ideal solution and the negative ideal solution can be calculated:
4) The Euclidean distance is employed to calculate the distance of the evaluation object from the positive ideal solution and the negative ideal solution:
5) The closeness between the evaluation object and the positive and negative ideal solutions is calculated as follows:
And the closer
Data source
The data used in the present work are from the water resources bulletins, annual statistical year books for cities in the PRD, as well as the water resources bulletins, and soil and water conservation bulletins of Guangdong Province in 2015–2020. The calculation method of some indicators is in Table 1.
Results and analysis
Indicator weight
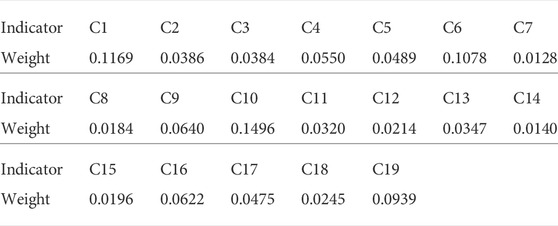
Based on primarily processed data, the entropy weight method was employed to calculate the weight of each indicator, as shown in Table 3. The weights for the WRS, the SES, and the EES are 0.4052, 0.3470, and 0.2478, respectively. The WRS has the largest weight, which means the natural reserve of water resources and water supply engineering capacity are the major contributors to the WRCC of the PRD, and although the geographical distribution of natural water resources cannot be changed, a reasonable WRCC can be maintained through scientific development of water resources and control of population; the SES has the second largest weight, only 0.06 less than WRS, which means economic growth not only relies on the natural reserve of water resources, but plays a role in improving the regional WRCC; the EES has the smallest weight, which may be because the impact of changes in the ecological environment on the WRCC is lagging, but a good ecology can sustain the regular water cycle and promote rational development of water resources, and hence the EES is an indispensable part in WRCC evaluation. Indicators with the largest weights in each subsystem are C1, C10, and C19. In this logic, rational development of water resources, acceleration of economic growth, and ecological improvement initiatives are effective measures to improve WRCC.
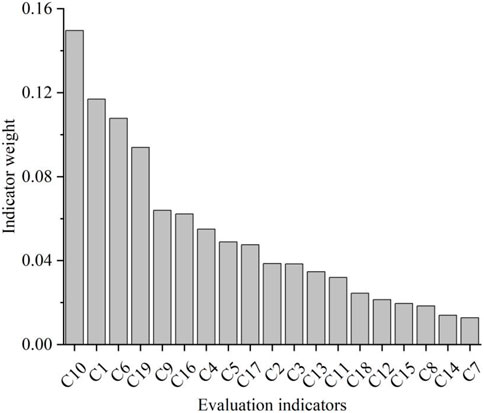
Table 2 shows the 19 indicators selected in the present work for WRCC evaluation; these indicators are sequenced, as shown in Figure 2. The top-ranking six indicators, C10, C1, C6, C19, C9, and C16, are positive indicators, and two for each subsystem. The weight of C10 is the largest, and C9 ranks fifth, indicating that in the relatively developed PRD, economic investment is particularly important for the utilization and protection of water resources. C1 and C6 take the second place, indicating that natural water resources are the most basic component of WRCC. The treatment of soil erosion and the improvement of forest coverage are conducive to maintaining a good watershed ecology and normal hydrological cycle. That is to say, to improve the WRCC of PRD, we need to fully consider the three subsystems.
Analysis of water resources carrying capacity evaluation results of Pearl River Delta
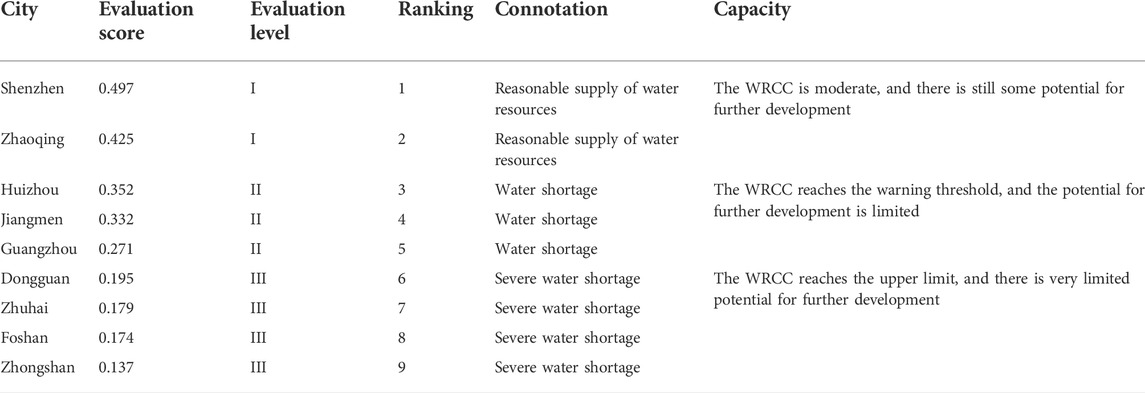
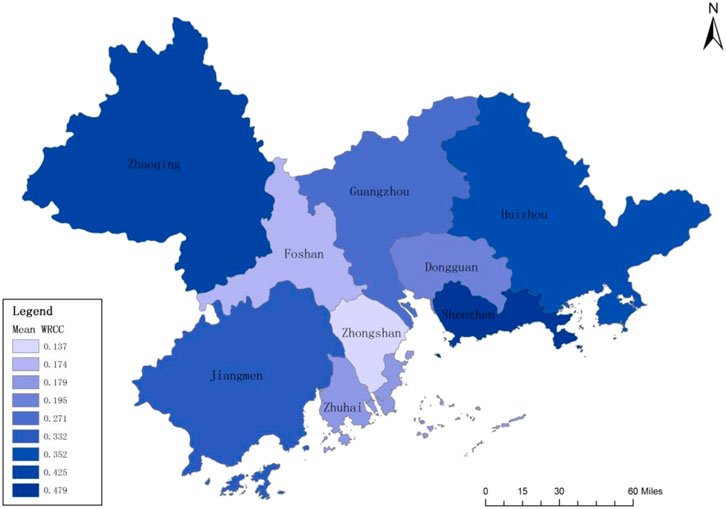
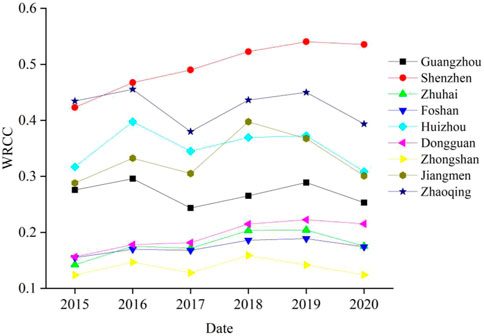
1) The TOPSIS model was employed to calculate the mean scores of WRCC of the PRD in 2015–2020. The natural breaks method is used to divide the nine cities into three grades according to the scores. With reference to Lin et al. (2020), the connotation and status of WRCC of each grade are explained, as shown in Table 3 and Figure 3 presents the annual changes in WRCC there. As Table 3 reveals, the overall WRCC of the PRD remained small, and the mean score of each city ranges from 0.137 to 0.479; only Shenzhen and Zhaoqing scored higher, followed by Huizhou, Jiangmen and Guangzhou, while Dongguan, Zhuhai, Foshan, and Zhongshan scored relatively lower. As Figure 3 shows, cities along the borders of the PRD including Zhaoqing, Huizhou, Jiangmen, and Shenzhen had the highest WRCC, whereas the five cities in the central region of the PRD had a lower WRCC, demonstrating considerable regional differences. Shenzhen, due to its economic strength, reaches the highest score (0.497), and Zhaoqing, with its rich reserve of water resources and good ecology, has the second largest score of WRCC (0.425), whereas Zhongshan has the lowest score (0.137), and Foshan has the second smallest score (0.174). As Figure 4 shows, in 2015–2020, despite the changes in the WRCC of each city, the ranking of cities remained the same; Foshan, Zhaoqing, and Guangzhou showed stable changes, whereas Shenzhen, Dongguan, and Haizhu presented an upward trend in the evaluation score. As the PRD witnessed a normal and relatively dry year in 2020, with the annual precipitation staying at merely 1,609 mm, all cities in the PRD had a smaller WRCC score in 2020 than in 2019; except Shenzhen and Zhongshan, all other cities had a larger WRCC in 2016 and 2019 than in other years, which is attributed to the rich rainfall in these 2 years and hence a high volume of water resources per capita. The WRCC of the PRD is positively correlated to the precipitation, especially in Guangzhou, Huizhou, Zhongshan, Jiangmen and Zhaoqing, the correlation coefficient is more than 0.72, while Zhuhai is 0.57. To resolve the problem of overdependence of WRCC on natural rainfall, we need to reserve water in the wet years to resolve water shortage in the dry years.
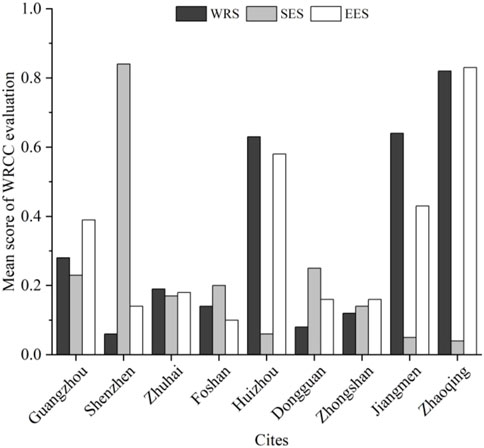
2) The TOPSIS model was used to calculate the score of each subsystem in the WRCC evaluation system for the PRD, and the mean score from 2015 to 2020 was obtained: the mean score for WRS, SES, and EES was 0.329, 0.220, and 0.331, respectively. Figure 5 shows the mean WRCC score of each city in the PRD from 2015 to 2020. For cities including Guangzhou, Zhuhai, Foshan and Zhongshan, the score for each subsystem shows little difference; for Shenzhen, however, the SES has a far larger score than the other two subsystems; for Huizhou, Jiangmen, and Zhaoqing, the scores for WRS and EES are far higher than that for the SES. Though Shenzhen had a low volume of water resources per capita (C1), a small annual precipitation (C6), a high population density (C7), and a high ecological water utilization rate (C18), it ranked top among all cities in the PRD in terms of the economic density (C10), urbanization rate (C11), water use volume per 10,000 yuan of GDP (C12), and water use volume per 10,000 yuan of industrial production (C13), which makes up for the lows in WRS and EES. In future urban planning of Shenzhen, it is necessary to better allocate water resources, maintain water diversion projects, improve the ecology, and seek new sources of water supply. For Huizhou and Zhaoqing, the score for SES is far smaller than that for WRS and EES. Thus, these two cities should make the fullest of their rich water resources and good environment to restructure the industries and boost economic growth. In sum, cities in the PRD, which constitute one the most important urban agglomerations in China, should cooperate with each other to achieve optimized transfer of industries and resources, and join hands to improve the natural environment.
3) The subsystems for WRCC evaluation in the PRD show considerable differences, which implies the problems like uneven distribution of water resources, unbalanced economic growth, and varied efforts for ecological improvement in this region. By the score of the WRS in WRCC evaluation, the cities are ranked as follows: Zhaoqing > Jiangmen > Huizhou > Guangzhou > Zhuhai > Foshan > Zhongshan > Dongguan > Shenzhen, and the gap between the maximum (0.817) and the minimum (0.063) is 0.754, which shows varied possession of water resources among cities. Zhaoqing, Huizhou, and Jiangmen boast rich rainfall, with the volume of water resources per capita reaching 3,700, 2,700, and 2,900 m3/person; besides, with a low water resources utilization rate, the score for the WRS in these three cities is higher than in other cities, indicating the great potential for development of water resources in these cities. For Guangzhou, despite the high precipitation and water supply per capita, the volume of water resources per capita there is only half that of the PRD, and the water utilization rate is high, so the city achieves a score merely at 0.275. Zhuhai, because of its low volume of water resources per capita and small annual precipitation, reaches a score of mere 0.188 in WRCC evaluation. Foshan, Zhongshan, Dongguan, and Shenzhen feature a low annual precipitation and large population, with a volume of water resources per capita at merely 190–590 m3/person, and hence achieving small scores in WRCC evaluation, at 0.136, 0.121, 0.080, and 0.063, respectively.
By the score of the SES in WRCC evaluation, the cities in the PRD are sequenced as follows: Shenzhen > Dongguan > Guangzhou > Foshan > Zhuhai Zhongshan > Huizhou > Jiangmen > Zhaoqing. The top ranking four cities have a high urbanization rate, all with a rate higher than 90% except Guangzhou, and the rate in Shenzhen even approaches 100%. Besides, these four cities have a high economic density and a high GDP per capita; in particular, Shenzhen has an economic density of $186 million/km2, and a GDP per capita of $28,000/year; besides, the city’s strong initiatives towards green economy and low-carbon economy have contributed to coordinated development of water resources and economy. Zhaoqing, which ranks the last among all the cities in the PRD with a score at mere 0.042, has an urbanization rate lower than 50%, and a per-capita GDP of merely $8,000/year, less than 1/3 of that in Shenzhen. These can be attributed to the low GDP in Zhaoqing, the large area of land, its irrational industrial layout, defective industrial chains for the manufacturing and service sectors, and a low water utilization rate of industries. Therefore, in future planning of Zhaoqing, it is necessary to balance resources and economic growth.
By the score of EES in WRCC evaluation, the cities in the PRD are ranked as follows: Zhaoqing > Huizhou > Jiangmen > Guangzhou > Zhuhai > Zhongshan > Dongguan > Shenzhen > Foshan. The cities have varied degrees of environmental quality and ecological treatment efforts, and cities with a higher score often have a larger area. Jiangmen and Zhaoqing have water functional areas with a high water quality control rate; Zhaoqing and Huizhou has a large forest coverage rate and large areas of new soil erosion treatment. Cities with lower scores generally have a smaller area: Foshan, Zhuhai, and Guangzhou have a high domestic sewage discharge per capita; Zhongshan, Foshan, and Zhuhai have a small forest coverage rate. Therefore, cities with a high score in WRCC evaluation need to maintain good environment, strengthen pollution treatment, and promote the pollution accountability systems; for cities with a large population and a small area of land, ecological improvement can only play a limited role in increasing the regional WRCC, so it is necessary to find new solutions for environmental treatment and achieve harmony between human and nature.
Analysis of the three subsystems in WRCC evaluation show that cities including Shenzhen, Dongguan, Zhongshan, and Foshan need to make better use of their limited water resources and optimize spatial and temporal allocation of water resources; cities like Zhaoqing, Jiangmen, Huizhou, and Zhongshan should promote industry upgrading, encourage green production and boost economic growth; Cities including Foshan, Shenzhen, Dongguan and Zhongshan need to curb blind expansion of urban areas and reserve more area for the “lucid waters and lush mountains.”
4) As Figure 6 shows, as the time proceeds, the score of the WRS in WRCC evaluation varied from 2015 to 2020, registering a slight decrease overall. The scores for Zhaoqing, Jiangmen, and Huizhou varied considerably, whereas the scores for other cities remained stable. The score for the SES remains stable, with a slight increase; the score for Shenzhen saw a rapid rise, followed by Dongguan and Guangzhou. Under the impact of the Covid-19 pandemic, however, the score for all cities stayed low in 2020. For most cities in the PRD, the score for EES in WRCC evaluation presented an upward trend, though with slight fluctuations; Guangzhou, however, witnessed a dropped score due to its reduced new soil erosion treatment area and increased utilization rate of water for ecological purposes. Though economic growth and ecological treatment can improve regional WRCC, uneven distribution of water resources and increased water demand along with economic growth will still reduce the regional WRCC. Therefore, we need to proceed with strict water resources management policies, encourage water-saving efforts, and transfer water resources in water-rich regions to water-short areas to achieve coordinated development among regions.
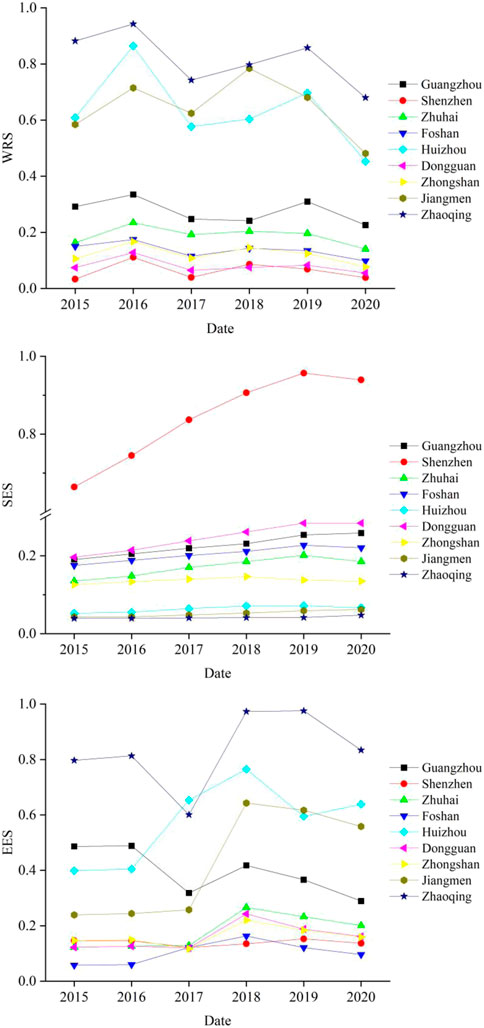
FIGURE 6. Changes in the score of the WRS, SES, and EES in regional WRCC evaluation of cities in PRD from 2015 to 2020.
Conclusion and suggestions
Conclusion
In the present work, the WRCC of cities in PRD was discussed, and the following conclusion were reached:
1) The three subsystems are sequenced as follows by the weight they have in WRCC evaluation: WRS > SES > EES. Indicators including economic density, C10, C1, C19, C9, and C16 contribute considerably to the regional WRCC of the PRD. Rationally developing water resources, boosting economic growth, and improving the environment are effective measures to improve the regional WRCC.
2) From 2015 to 2020, the WRCC of the PRD remained low overall, with significant regional differences. Cities along the borders of the PRD like Zhaoqing, Huizhou, Jiangmen, and Shenzhen reached a high score in WRCC evaluation, whereas cities in the central area of the PRD achieved a lower score. Though the WRCC of each city changed over time, the ranking of cities by the score of WRCC remained largely the same. The WRCC was found to be positively correlated to precipitation. The scores of WRS, SES, and EES were 0.3288, 0.2202, and 0.3306, respectively. For cities including Guangzhou, Zhuhai, Foshan and Zhongshan, the subsystems achieved similar scores in WRCC evaluation; in Shenzhen, SES achieved a far higher score than the other two subsystems in WRCC evaluation; for Huizhou, Jiangmen, and Zhaoqing, WRS reached a far higher score in WRCC evaluation than the other two subsystems.
3) As further analysis of the three subsystems shows, Zhaoqing, Huizhou, and Jiangmen boast a rich reserve of water resources and considerable potential for further development; Shenzhen, Dongguan, Zhongshan, and Foshan are in short supply of water; Shenzhen, Dongguan, Guangzhou, and Foshan enjoy considerable economic strength, which contributes to coordinated development of the water environment and economy. Zhaoqing, which ranks last in the WRCC evaluation, is less developed than other cities. Zhaoqing, Huizhou, and Jiangmen have a large area of land and good ecology, whereas other cities should pay more attention to promote coordinated development between economic growth and ecological wellbeing.
Suggestions
As the construction of the Guangdong-Hong Kong-Macau Greater Bay Area moved forward, the PRD is bound to see population and economic growth, which will pose tangible challenges to the sustainable development of water resources. In the future, cities in the PRD should cooperate with each other to optimize spatial and temporal allocation of water resources. For example, optimizing the allocation of water resources in the Dongjiang River, and transferring water to water scarce cities in the eastern PRD by Xijiang River diversion project. In order to drive the social-economic development of Zhaoqing, Jiangmen, and Huizhou, green economy and industry configuration should be encouraged. On the basis of comprehensively promotion of the pollution accountability systems, and pursue ecological wellbeing, we should attach importance to the governance of urban rivers in Guangzhou, Zhongshan, and Foshan, and strengthen the monitoring and assessment of environmental health risks. Furthermore, we should push forward the initiatives to build a water-saving society, taking advantage of the economic of the PRD, with further improvement of water resources utilization efficiency. We can also incorporate more data and set thresholds for the evaluation indicators to capture changes in regional WRCC, thereby providing a scientific basis for sustainable development of water resources, economic growth, and ecological improvement in PRD.
Contributions, limitations, and future research
In the present work, 19 indicators were selected, and the entropy weight-TOPSIS model was employed to calculate the WRCC score of cities in the PRD from 2016 to 2020 with relation to WRS, SES, and EES. The distribution pattern of WRCC was analyzed, and contributing factors to regional WRCC were explored on the temporal and socio-economic dimensions. Moreover, suggestions were proposed to promote harmony between water resources and human in PRD.
Nonetheless, there are some limitations in our work. First, the water resources system is complex and constantly changing, and WRCC has such characteristics as diversity, dynamic changes, and fuzziness. Evaluation of WRCC in our work, however, is static evaluation based on historical data and a limited set of indicators; the interactions between subsystems are overlooked; and the results are applicably only to the years between 2015 and 2020. In future works, it is necessary to improve the evaluation indicator system by introducing new indicators related to water conservation and the water environment, increase the basis data to make the research result more scientific and practical; in addition, scientific methods should be adopted to predict the impacts of different urban development plans on the future WRCC of PRD.
Data availability statement
The original contributions presented in the study are included in the article/supplementary material, further inquiries can be directed to the corresponding author.
Author contributions
YZ and QY conceived the conceptualization, acquired the funding and administrated the project; ZL and BZ conducted the investigation, analyzed data and refined the methodology; YZ wrote the original draft; QY reviewed and YZ editing the final paper.
Funding
This study was supported by the Scientific Research Project approved by Department of Education of Guangdong Province (No. 2020KQNCX125) and Scientific Research Foundation of Guangzhou Xinhua University (Nos 2020KYQN01 and 2019KYYB08), Human Geography and Urban-rural Planning, the construction of Guangdong first class undergraduate Program (F22MJ04JY).
Acknowledgments
The authors are grateful for the anonymous referees for their comments and suggestions, which allowed us to improve the quality of this paper.
Conflict of interest
The authors declare that the research was conducted in the absence of any commercial or financial relationships that could be construed as a potential conflict of interest.
Publisher’s note
All claims expressed in this article are solely those of the authors and do not necessarily represent those of their affiliated organizations, or those of the publisher, the editors and the reviewers. Any product that may be evaluated in this article, or claim that may be made by its manufacturer, is not guaranteed or endorsed by the publisher.
References
Buckerfield, S. J., Quilliam, R. S., Bussiere, L., Waldron, S., Naylor, L. A., Li, S. L., et al. (2020). Chronic urban hotspots and agricultural drainage drive microbial pollution of karst water resources in rural developing regions. Sci. Total Environ. 744, 140898. doi:10.1016/j.scitotenv.2020.140898
Clarke, A. L. (2002). Assessing the carrying capacity of the Florida Keys. Popul. Environ. 23 (4), 405–418. doi:10.1023/a:1014576803251
Deng, L. L., Yin, J. B., Tian, J., Li, Q. X., and Guo, S. L. (2021). Comprehensive evaluation of water resources carrying capacity in the Han River Basin. Water 13, 249. doi:10.3390/w13030249
Falkenmark, M., and Lundqvist, J. (1998). Towards water security: Political determination and human adaptation crucial. Nat. Resour. Forum 22 (1), 37–51.
Kang, J., Zi, X., Wang, S. F., and He, L. Y. (2019). Evaluation and optimization of agricultural water resources carrying capacity in Haihe river basin. Water 11, 999. doi:10.3390/w11050999
Li, J. X., Ke, L. F., Yang, L., and Qi, H. S. (2021). Research on the county water resources carrying capacity in the new period. E3S Web Conf. 276, 01009. doi:10.1051/e3sconf/202127601009
Lin, L. Z., Li, D., and Lin, Z. (2020). Evaluation of water resources carrying capacity in Kubuqi Desert Area based on entropy weight and TOPSIS model. J. Central China Normal Univ. Nat. Sci. 54 (4), 640–648. (in Chinese).
Lu, Y., Xu, H. W., Wang, Y. X., and Yang, Y. (2017). Evaluation of water environmental carrying capacity of city in huaihe River basin based on the AHP method: A case in huai'an city. Water Resour. Industry 18, 71–77. doi:10.1016/j.wri.2017.10.001
Magri, A., and Berezowska-Azzag, E. (2019). New tool for assessing urban water carrying capacity (WCC) in the planning of development programs in the region of Oran, Algeria. Sustain. Cities Soc. 48, 101316. doi:10.1016/j.scs.2018.10.040
Meng, L. H., Liu, Y. C., Ma, W. J., Wang, Q. Y., Mo, X. L., and Tian, J. M. (2021). Variable fuzzy evaluation model for water resources carrying capacity in the Tarim River Basin, China. Water Supply 22, 1445–1458. doi:10.2166/ws.2021.341
Milano, M., Ruelland, D., Dezetter, A., Fabre, J., Ardoin-Bardin, S., and Servat, E. (2013). Modeling the current and future capacity of water resources to meet water demands in the Ebro basin. J. Hydrology 500, 114–126. doi:10.1016/j.jhydrol.2013.07.010
Peng, T., Deng, H. W., Lin, Y., and Jin, Z. Y. (2021). Assessment on water resources carrying capacity in karst areas by using an innovative DPESBRM concept model and cloud model. Sci. Total Environ. 767, 144353. doi:10.1016/j.scitotenv.2020.144353
Wang, G., Xiao, C. L., Qi, Z. W., Liang, X. J., Meng, F. N., and Sun, Y. (2021). Water resource carrying capacity based on water demand prediction in chang-ji economic circle. Water 13, 16. doi:10.3390/w13010016
Wang, S., Xu, L., Yang, F. L., and Wang, H. (2014). Assessment of water ecological carrying capacity under the two policies in Tieling City on the basis of the integrated system dynamics model. Sci. Total Environ. 472, 1070–1081. doi:10.1016/j.scitotenv.2013.11.115
Wang, W. Y., Zeng, W. H., Yao, B., and Wei, J. (2014). A simulation impact evaluation of social-economic development on water resource use. J. Water Reuse Desalination 4 (3), 137–153. doi:10.2166/wrd.2014.050
Wang, X., Liu, L., Zhang, S., and Gao, C. (2022). Dynamic simulation and comprehensive evaluation of the water resources carrying capacity in Guangzhou city, China. Ecol. Indic. 135, 108528. doi:10.1016/j.ecolind.2021.108528
Wei, Y. J., Wang, R., Zhuo, X., and Feng, H. Y. (2021). Research on comprehensive evaluation and coordinated development of water resources carrying capacity in qingjiang River basin, China. Sustainability 13, 10091. doi:10.3390/su131810091
Wu, C. G., Zhou, L. Y., Jin, J. L., Ning, S. W., Zhang, Z. X., and Bai, L. (2020). Regional water resource carrying capacity evaluation based on multi-dimensional precondition cloud and risk matrix coupling model. Sci. Total Environ. 710, 136324. doi:10.1016/j.scitotenv.2019.136324
Xu, Z. Q., Liu, X. Y., Xiao, S. H., Duan, L., Deng, Q. Y., and Li, J. (2019). Evaluation and obstacle factors study of water environmental carrying capacity in the Pearl River Delta. J. Environ. Eng. Technol. 9 (1), 44–52. (in Chinese).
Keywords: entropy weight-TOPSIS model, Pearl River Delta, water resources carrying capacity, regional differences, green economy
Citation: Zhou Y, Liu Z, Zhang B and Yang Q (2022) Evaluating water resources carrying capacity of Pearl River Delta by entropy weight-TOPSIS model. Front. Environ. Sci. 10:967775. doi: 10.3389/fenvs.2022.967775
Received: 13 June 2022; Accepted: 27 September 2022;
Published: 11 October 2022.
Edited by:
Shengsen Wang, Yangzhou University, ChinaReviewed by:
Guohua Hu, East China Normal University, ChinaChengjia Su, Sun Yat-sen University, China
Copyright © 2022 Zhou, Liu, Zhang and Yang. This is an open-access article distributed under the terms of the Creative Commons Attribution License (CC BY). The use, distribution or reproduction in other forums is permitted, provided the original author(s) and the copyright owner(s) are credited and that the original publication in this journal is cited, in accordance with accepted academic practice. No use, distribution or reproduction is permitted which does not comply with these terms.
*Correspondence: Qiannan Yang, eWFuZ3FpYW5uYW5AeGhzeXN1LmVkdS5jbg==
 Yueying Zhou
 Zufa Liu2
 Qiannan Yang