 Long Zhao
 Otilia Manta
 Iuliana Militaru3
- 1Department of Economics and Management, Guangling College of Yangzhou University, Yangzhou, China
- 2Research Department, Romanian American University, Bucharest, Romania
- 3Department of Finance, Credit and Accounting, Romanian-American University, Bucharest, Romania
- 4Department of Trade, Economic Integration and Business Administration, Romanian-American University, Bucharest, Romania
In a context of multi-crises, as well as the challenges of both the medium and long term, associated with elements highlighted by the transformation of the EU energy system, we appreciate that not only is it a very difficult time to overcome efficiently and balanced EU Member States, but above all it is a time to activate research systems on identifying key solutions, as well as firm decisions at the level of decision-making institutions at the level of the European Institutions. Moreover, based on the latest European studies, systematic testing of ongoing initiatives can strategically prepare for an increase in the resilience of Member States’ economies to crisis shocks, as well as “the key to success Europe’s ecological transformation and climate neutrality of the EU economy in a broader sense.” The paper aims to highlight how to act at European level in the context of the latest energy decisions (regulations, strategies, pro-grams and directives) and how to stimulate “the EU economy with about 3.3% of EU GDP or EUR 464 billion in 2030 and up to EUR 5.6% or more than EUR 1 trillion in 2050.” At the same time, we appreciate that as a result of green energy, digitalization and technology, the environmental objective on the EU and UN net emissions in 2050 can be achieved, especially as a result of a fair and equitable transformation for the economic environment and for citizens, being an objective that directly contributes to achieving a sustainable, collaborative and prosperous society with an open and modern society, but more chosen efficiently in terms of resource optimization and a sustainable and competitive economy.
Introduction
Following Member States’ decisions on the production of renewable energy from hydro, wind, hydrogen and solar by installing new renewable energy production capacity is a priority for each nation’s economy. This goal is also given by the alignment of state economies with the internal GHG the permanent target is to raise the level of reduction by at least 40% in 2030 compared to 1990 levels, in line with the principles and targets set out in European and global strategies and agreements.
It should be noted that in order to achieve these objectives, Member States receive significant financial support and support for investments in electricity production based on renewable resources from wind and solar energy, with or without integrated storage facilities, helping to achieve the objectives undertaken by member states in their National Recovery and Resilience Plans, which provide for specific investment measures.
Climate change, environmentally friendly technologies, innovations in the clean energy industry, make interventions aimed at promoting direct investments in the clean energy sector and energy efficiency to ensure the contribution to the objectives set by the European Green Agreement, make the targets set in the National Integrated Plan for Energy and Climate Change 2021–2030 (PNIESC) oriented on the production of energy based on renewable resources, as well as those established in the PNRR, by increasing the share of its production of wind and solar energy, to be targets that can be achieved by state decision makers.
Investments supported by these sources of funding at EU level from which an impact with direct effect is expected, respectively:
1) the first and most important is given by the reduction of carbon emissions into the atmosphere generated by the energy sector by replacing a part of the amount of fossil fuels consumed each year—coal, natural gas;
2) the second impact is that there is an increase in primary resources compared to the increase in renewable energy production resources, as a result of the investments to increase the installed power to produce electricity from renewable sources of wind and solar energy;
3) the third we consider is supported increase production based on renewable resources in total energy production and which make an important contribution to achieving the objectives in the European Green Pact as a strategy for sustainable growth in Europe and combating climate change in line with the Union’s commitments to put implementing the UN Sustainable Development Goals set out in the 2030 Agenda;
4) the fourth concerns the fact that a competitive, efficient and environmentally friendly system in the sustainability of the economy in terms of the use of sources leads to sustainable development; and
5) the fifth is given by the objectives regarding the use of renewable resources in energy production according to European regulations and directives (Directive (EU) 2018/2001).
In our paper we aim, on the one hand, to present a factual situation that exists at European level and national level, and, on the other hand, to highlight the renewable resources that can actively contribute to the implementation of energy strategies and policies in the actual context.
The paper addresses a current issue at European and global level, namely the EU energy system and its impact on the sustainability of Member States’ economies by 2050 from several perspectives, namely:
1. From the perspective of the decisions taken by the European Commission on energy sources and how this energy transition impacts the economies of the Member States.
2. From the perspective of the structures of domestic and industrial consumers, given that the energy resource is one of the vital resources of the consumer whether domestic or industrial, and the transition to renewable sources directly influences family budgets and the budgets of companies involved in various industrial processes, energy and vital part of these processes;
3. From the perspective of the solutions offered by decision-makers through the regulations providing for this green transition, the strategies that support this transition from conventional to renewable sources of electricity production, and the funding programs and European directives that support resources and financial instruments investments in electricity generation capacities based on renewable resources, but especially industrial consumers and household consumers in endowment with investments in energy production equipment through renewable resources (wind, solar, hydrogen, biofuels, water, etc.) and which resources were also mentioned in our paper.
Literature review
Both financial performance and profitability are key indicators for the business environment to be as stable as possible and for companies to be sustainable in their sector of activity (Morina et al., 2021). Overall, it is important to understand the bottom-up approach to sustainable economic development. Starting from the micro-level, firms have to be encouraged to invest in technologies offering good standards for renewable energy. This has to be regulated by the governmental bodies and has to be endorsed by the companies that agree upon the beneficial aspects of investing in renewable and green energies. As the aggregate of all companies investing in renewable energies, and innovation related to, the impact targets the macro-level, addressing one sole country, or a group of countries.
According to the general literature, we identify two main views with regard to profit-ability and its determinants, opposing each other. From one side, structural conduct performance, and market concentration are found as the key indicator in the analysis of the company’s profitability [2]. On the other hand, there are various other studies that show that different factors decisively influence the performance of activities (Barney, 1991; Morina et al., 2021; Spanos et al., 2004). Additional to the theoretical studies, some empirical studies examined the environmental and the financial results of the companies involved in the production of energy based on renewable resources (Wang et al., 2014) and (Ruggiero and Lehkonen, 2017). Furthermore, the literature showed that investing in renewable energy would cause financial difficulties for companies (Paun, 2017). Additionally, it is important that such firms be supported by governments (Marian and Panait, 2019). Emphasized the importance of the role of governments in supporting local development, environmental implications and limiting shocks in open energy markets, as such endorsing sustainable development. This is also supported by the study of Abbasi et al. (2020), which states that companies endorsing renewable resources actively contribute to the sustainable development of the economy, implicitly of their growth and also keep the environment clean.
Moreover, starting from the early 1990s, there were some pioneering studies trying to identify in there exists a correlation between sustainable economic development and environmental indicators. The study by Kuznets (1955) points out the existence of the inverted U-shaped curve, nowadays known as the Kuznet curve. Afterward, Grossman and Krueger (1995) investigated the relationship between sustainable economic development and specific environmental indicators. They confirmed the Kuznet curve and defined this curve as the Environmental Kuznets Curve (EKC) (Kuznets, 1955).
It should be noted that at the beginning of sustainable economic development (including growth), the firms and/or countries do not harm the environment because of their low industrialization level. As the firms and/or countries go through the growth process, along with the economic growth it can be seen an increase in environmental destruction. In the meantime, while firms and/or countries put themselves in a better position with regard to development and growth, they are finding ways to improve the environment. As such, with the development, governments try to keep with proper laws and rules for a better environment, targeting sustainable development. The EKC hypothesis has been a question of research from many researchers that used empirical analysis to confirm it. The inverted U-shaper curve was confirmed by other studies (Grossman and Krueger, 1995), (List and Gallet, 1999), (Andrei et al., 2014), and (Shukla and Parikh, 1992). Different from what was found before (Shafik and Bandyopadhyay, 1992), found that it might exist an N-shaped relation among the above-mentioned variables. Some other studies failed to confirm EKC hypothesis (Bo, 2011). Additional studies (Iddagoda et al., 2021) were developed for different groups of countries in order to demonstrate the relationship be-tween economic development and environmental pollution (Panait et al., 2019), (Leitão et al., 2021), (Simionescu, 2021), (Badulescu et al., 2020), (Khan et al., 2016), (Sharif et al., 2020), (Armeanu et al., 2018), and (Armeanu et al., 2021).
Obviously, the main concern is given by how we can maintain a balance between social and corporate, all the more so as the gap between the social economy and the corporate economy is growing. The study of (Nurunnabi et al., 2020) answered this question by confirming the positive effect that these energy initiatives, especially energy efficiency, we believe should be in line with social issues and the objectives of the 2030 Agenda, while supporting cost reduction and the sustainable development of economies. Another question might be related to the factors motivating the responsibility in the energy sector? According to (Agudelo et al., 2020) these drivers can be internal and external. Business strategy, corporate environment, cost reduction and sustainable development of economies, sustainable environmental policies and the prevention and limitation of climate change, risk management are listed as internal drivers, being at the same time in line with the sustainable development aspect (economic-environmental-social). Elements related to competitiveness, environmental regulations and legislation, the social framework and societal impact and engagements, stockholder compliance with regulations and the impact of satisfaction are found as external drivers (Agudelo et al., 2020), (Neacsa et al., 2020), (Panait et al., 2022), (Vollero et al., 2011), (Piciocchi et al., 2009), and (Janjua, 2021).
Global energy decisions impact decisions at the state level, for example at the November 2021 COP 26 (United Nations, 2022) Conference (26th Conference) on climate change, following the debates. To a decision in the form of a joint agreement on eradicating emissions by 2050 (Shahbaz et al., 2022). As we mentioned earlier in our paper, in parallel with the transition to renewable energy production, it is a major priority to limit these emissions so that we do not exceed 1.5°C globally for the levels allowed in upstream of industries. It is noteworthy that globally up to 2022, societal activities continued to directly affect this growth, thus reaching a global temperature exceedance of 1.1°C (United Nations, 2022). Moreover, another priority is given by the way of forest management and the limitation of deforestation, or rather of their reversal until 2030 (World leaders, 2022). The 2030 Agenda is the one that has guided our strategies, activities, funding programs and others over the last years, so that through them we can actively contribute to achieving the objectives mentioned in it. Among these objectives is the 15th of the “Land Life” objectives, which leads us to major decisions on biodiversity, how humans act in contact with nature, as well as how to protect resources and the ecosystem, but especially the management of natural disasters generated by deforestation activities and the creation of natural imbalance (Forests, 2019). Biomass-based renewable energy resources are directly linked to this major problem of deforestation at European and global level. Which means that only through regulation and support programs can this problem be limited and geared to these sustainable resources and contribute to reducing these increases in global greenhouse gas emissions, all the more so as through the forest resource, terrestrial carbon could reach significant levels by limiting these emissions (Oldekop et al., 2019) and (Lawrence and Vandecar, 2015).
It is noteworthy that the energy resource influences social life both at European and global level, which makes the integration of renewable resources, whether it is Sun, wind, hydrogen, biomass, water and others, to be done accordingly. The socio-economic specificities of the area in which investment projects on renewable energy production are in balance with the local ecosystem, especially in areas where the absolute and relative poverty rate is high, which makes that these communities find it very difficult to bear this transition due to lack of material resources, and in this sense government decisions and support programs are the solution for the green transition in these communities, being known interdependence between nature and man (social), it is valid both for poor communities and for developed areas (Klooster and Masera, 2000), (Samii et al., 2014), and (Zulu, 2010).
Finally, it is important to agree that environmental issues may be costly to a certain extent for companies, but at the same time investing in the environment brings social benefits. If the companies involve innovative tools that contribute to both, environ-mental enhancement and cost reduction, then this would be beneficial for both, private and social contexts. However, what is crucial, is a good collaboration among governmental bodies, academia, businesses, and civil society is key to innovation for sustainability (Hysa et al., 2020), which can further target to achieve sustainable development principles.
Research methodology
To support research methodology, namely: “competence, objectivity, truth, method-ology, aspects related to the demonstration and the final results of the research and psychomotor” (Schuwirth and Van der Vleuten, 2018). Our empirical research is based on documentation of existing European strategies and regulations on Member States’ national recovery and resilience plans, as well as the objectives and targets set out in the European Green Agreement and the 2030 UN Energy Agenda.
At the same time, for the sizing of energy investment projects, several benchmarks have been established at European level, including:
Indicator 1 “Newly installed capacity for renewable energy production” (Song et al., 2021) = newly installed capacity (Song et al., 2021) for renewable energy production (Song et al., 2021) (solar/wind) put into operation and connected to the grid, built by project.
Calculation formula: Newly installed capacity to produce energy from renewable sources, expressed in MW.
Indicator 2 “Reduction of greenhouse gases” = total estimate of the annual decrease in the amount as a result of the process of replacing conventional energy production with energy based on renewable resources, respectively the reduction of greenhouse gas emissions.
Calculation formula: reduction of the amount of greenhouse gas emissions, as a result of the production of energy from renewable resources, respectively of its neutralization, in tons of CO2 equivalent.
It is calculated by following the steps below:
1. Calculate the annual electricity production = capacity to be installed from renewables * annual use period (not less than 1138 h/year for solar energy and 2100 h/year for wind energy)
2. Calculate the reduced amount of emissions: the annual electricity production is multiplied by the emission factor, of the national weighted average CO2 for fossil sources based on the data of National Energy Regulatory Agency (ANRE, 2020) report for 2020.
The national weighted average CO2 emission factor according to the ANRE report for each MWh of fossil sources is 0.6177 tons of CO2/MWh.
Indicator 3 “Gross production of energy from renewable resources” = Gross production of energy from renewable resources (wind and solar).
Calculation methodology: Renewable energy production (wind and solar) according to the installed capacity, monitored by the annual reports of registered operators and official statistics.
Indicator 4 “Total electricity production from renewable sources” = Total electricity production from renewable sources (wind and solar).
Calculation formula: Annual electricity production * analysis period (20 years).
As working hypotheses we have structured three possible innovative projects in the field of renewable energy of 50 MW, 100 MW and 150 MW capacity.
At the same time, we start from the working hypothesis that the four key indicators help us to demonstrate the efficiency and effectiveness of investment projects, as well as their sizing at the territorial level in terms of financial resources allocated to each project.
Along with the structure of investment projects, it is necessary on the basis of empirical documentation to identify all support financing programs, as well as regulations on public procurement, “green energy” policy and the instrument of financing investments through public programs, as well as globally—considered representative for the understanding of the studied phenomena.
Results and discussions
In order to respond to the sizing of projects according to the working methodology, it is particularly important to know the financial support at national, European and global governmental level, as well as the financing conditions for each type of eligible project.
A first financial support (EUR 1134.6 billion) is the Multiannual Financial Framework 2021–2027, and which budget has been built in line with European policies at the level of each Member State. The current budget at European level includes grant-type financial instruments and credit-type financial instruments, which is why the funding mix must be carefully analyzed at each level so that the effectiveness of each project is achieved. Moreover, for the first time, a share of 25% of the eligible budget of each project needs to be directed towards environmentally friendly investments, and which have a positive impact on climate change at national and European level.
The European funding programs that support the above-mentioned objectives are the Horizon Europe program (EUR 97.6 billion), being a program that supports innovations in the field and applied research at European level, as well as the Life with a Budget program a total of EUR 5.4 billion, a support program for all actions aimed at the environment and climate change, as well as supporting jobs and supporting a healthy economic environment. Moreover, these support programs, which also directly support European policies, respect “the transition to a low-carbon economy, environmental protection and climate action” (Simionescu, 2021).
Researchers, experts and specialists in the field of renewable resources support through their results both efficient models of use of renewable resources, but especially the efficient use and with appropriate reductions based on technologies at the level of industries and the population. Moreover, close monitoring at European and global level of the use of these resources can be a solution developed in parallel with the identification of efficient renewable resources that can lead to a balanced solution in the context of current energy challenges.
In addition to knowing the energy consumption data of both the population and the economic agents in this study, we appreciate that we should first know the Earth’s ability to give the renewable resources so necessary to us all.
Therefore, at the planetary level according to studies falls on Earth each year an estimated power between 85 and 290 W/m2 and appreciating a different gap from one to three in some regions. Quoting Carlo Rubia (Nobel Prize in Physics), Jean-Maria Chevalier recalls that in the Sahara it “rains” every year the equivalent of a barrel of oil per square meter, in solar form1. Or, keep in mind that the Earth receives 10,000 times the consumption of primary energy from the Sun annually.2
Therefore, the solar resource is a renewable resource available to everyone, but it also depends a lot on the regions and the number of sunny days.
Among the major producers of solar energy, we can mention Germany and Japan with a percentage of each of these states of 38%, followed by the United States with a percentage of 13% according to existing global studies. Al Gore mentioned in his works that “what comes from the Sun in an hour is theoretically equal to the world’s energy consumption in a year”.
Another important resource is hydropower using tidal energy (ocean energy) we can consider that water can be appreciated as a renewable resource that can be used continuously. Among the hydropower producing countries we can mention in the top 10 after Christian Ngõ: China, Canada, Brazil, United States, Russia, Norway, India, Japan, Venezuela and Sweden.
Geothermal energy is the next renewable resource that uses the heat of the crust (Earth’s temperature), the Italians being among the first to build a plant in 1904 at Larderello. From existing studies and research we find information that a majority of the Earth has a very high temperature, respectively over 10000C. However, current science and technological research have highlighted heat pumps, which are often based on an extremely efficient and reversible principle, namely producing heat in winter and coolness in summer. Sweden is currently the largest producer of geoenergy (over 270,000 production units), and Europe is the continent that uses this renewable resource the most.
Another resource that joins the above is the wind, the global wind potential according to studies is 50,000 TWh. In Europe we have the leaders of this category of renewable resource, namely Denmark and Germany. Followed by these two countries in the ranking of the United States, China and India.
Last but not least in the category of renewable resources based on biomass and biofuels resulting from agricultural products (sunflower, corn, rapeseed, wheat, soybeans, etc.) and wood pulp. However, in the context of the food crisis, there are differing views on the use of agricultural products for electricity production to the detriment of agri-food products and animal feed. Among the leading producing countries of this category we mention the United States and France.
Moving on from the main categories of renewable resources, we appreciate that it is important from existing studies at European level to highlight on the one hand the situation of domestic energy consumers as well as industrial consumers, especially before highlighting the decision to liberalize the market in 2018 with applicability until December 2021.
At European and global level in the context of the European and Global Green Agreement, strategic priorities have been set, and which are currently being transposed into decision-making at state level through decision-making programs.
Developments in international energy prices−price dynamics in the EU
In order to reflect these developments as suggestively as possible, we have used the Rademaekers et al., 2018, from which we have taken all the specific relevant elements both at European level, but especially at national level.
Notes on Charts 1–8: Average and median values differ from EU averages because the values are unweighted and in Table 1 you can see the evolution of the share of energy costs over time in the main activity sectors analyzed at the European level, a situation presented in the same final report (Rademaekers et al., 2018).
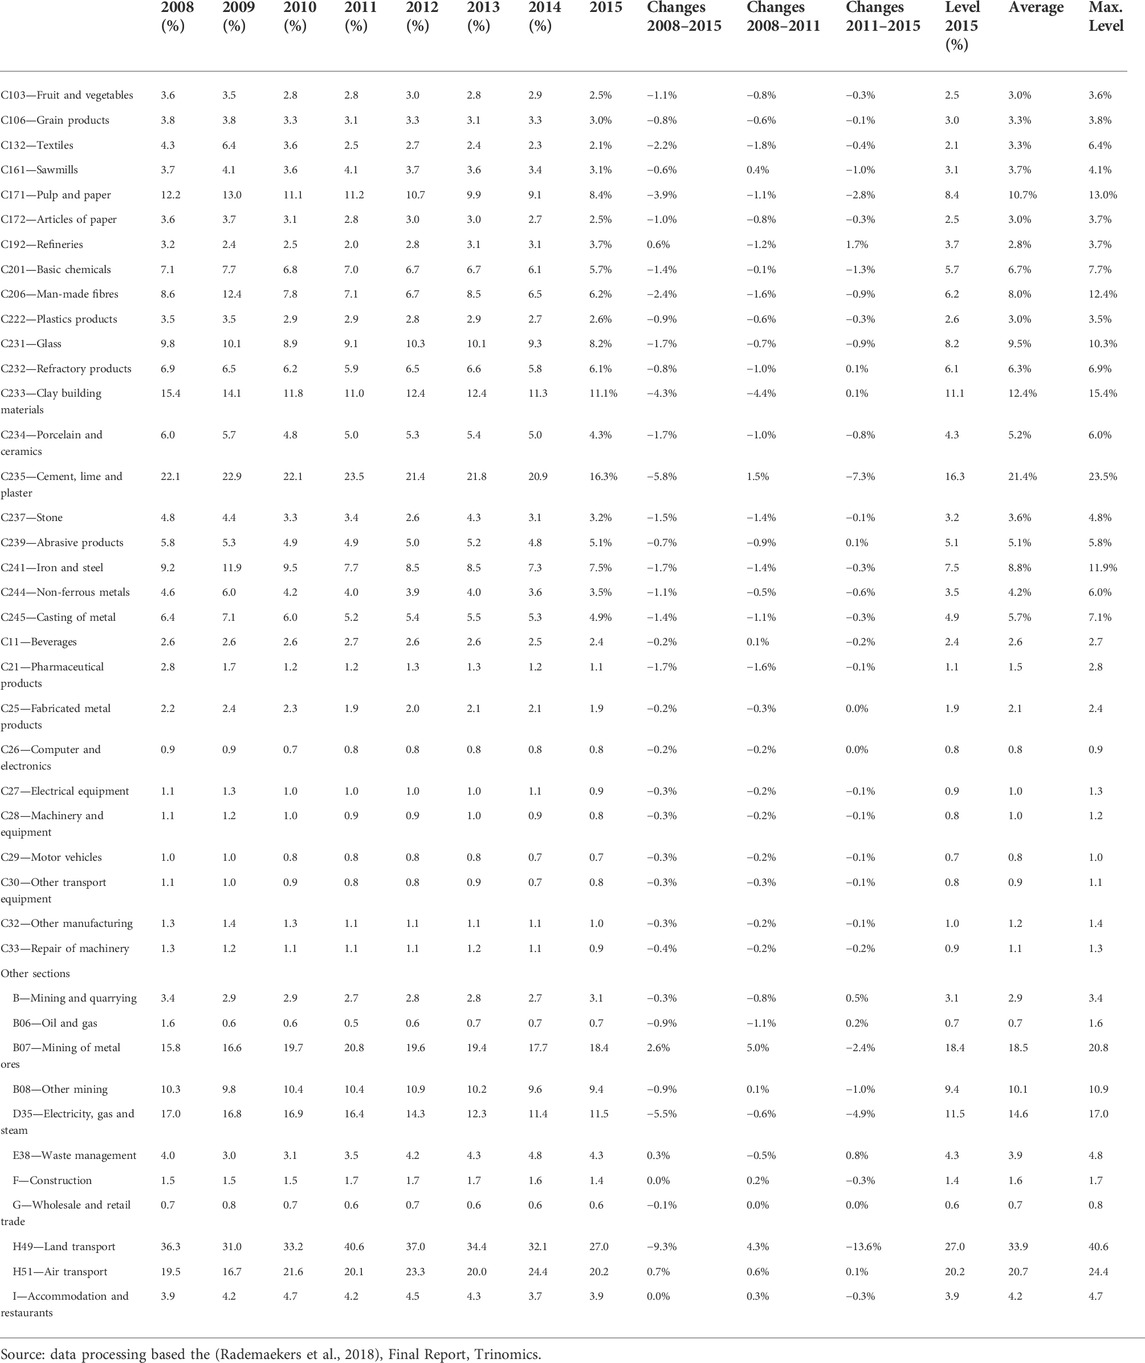
TABLE 1. Evolution of the share of energy costs over time in the main sectors of activity analyzed at European level.
Regarding the evolution of prices, costs and energy subsidies for Romania, we also identified in the above-mentioned study, the following considerations relevant to our analysis, respectively: the fact sheet presented in the study was examined by a representative of ANR and the data were adjusted accordingly.
Regulation of household prices in Romania before December 2021
By December 2021, Romania had a regulated energy market (gas and electricity) and gradually began in 2007 (Romania’s accession to the EU) and continued through government policies since 2012 price liberalization, while keeping the market regulated through the government apparatus until at the level of 2021. Being a member of the European Union, the liberalization of prices was based on a memorandum with the Commission signed in 2012, and through which Romania liberalized energy prices for both domestic and industrial consumers. The strategic plan is given by the gradual transition to the use of renewable resources and the transition to a sustained policy of green energy production.
The regulated market supported a policy of government intervention on prices and tariff systems established by the regulator. In order to highlight as clearly as possible the situation of price regulation in Romania for households, we present you in the figure below. It is noteworthy that by 2017 the price regulation policies and the transition to the free market had to be eliminated, however according to the agreements with the European Commission, this price regulation was possible until 2021 (Charts 9, 10) when it went directly to the free energy market with all its consequences.
Social support policy for energy prices
The policy of social support of groups vulnerable to tariffs on the market was applied only for electricity and not for gas. The evolutions of social tariffs at the level of 2008 being of 16%, and at the level of 2016 announcing at 10% (CEER, 2018).
As we mentioned for the gas market there is no social policy support in terms of regulation. At the market level, it is worth mentioning the fact that the first three suppliers in the natural gas and energy market had a percentage of 70%, and in recent years about 90%. In the context of market liberalization, we would appreciate not the monopoly but the competitiveness through the emergence of new players that can create the free market in the true sense of the concept of free market.
Evolution of consumer price trends
The evolution of electricity tariffs, knowing slight evolutions, respectively (Chart 11) increased by 0.7% in 2016 compared to 2014, and a trend being in the period 2010 and until 2018 increasing slightly (CEER, 2018).
It is certain that the period in which tariffs were regulated, the impact was minor at the beginning and very difficult to bear at present when the market was liberalized. In the period 2010–2018, the share of disposable income as an indicator spent on energy was very close to the European average (Chart 12). The decrease in energy expenditure was due to a sharp increase in disposable income.
Raising the level of competitiveness of the energy market
Efficiency and competitiveness are directly linked to final consumer tariffs, which is why depending on the source of the resource (especially gas) the price differs from 20 €/MWh (domestic) compared to the import tariff which is significantly higher. For the electricity component, the wholesale price was close to the retail price, justified also by the fact that the electricity production is mostly local, which allows the efficiency and competitiveness policy to be under the influence of internal factors and more limited under the influence of external factors (Chart 13).
It is noteworthy that according to the graphs below the price developments were negative until 2013, and the price experienced an upward trend reaching in 2016 to increase to 7 EUR/MWh. Compared to other European countries, Romania has evolved for many years with an upward but negative trend.
The effects of energy on vulnerable groups in poverty
In the chart below (Chart 14) and based on the policy of regulation and support we can see a downward evolution of the indicators presented in the chart since 2008. However in the context of liberalization at present (2022) these groups have become very vulnerable and government policies must specifically aimed at supporting them, based on both the past and the present, in order to be able to project a more predictable future.
Quality of services with utilities (electricity and gas)
The evolution of the quality of services provided to consumers is directly related to the satisfaction of the final consumer and the quality of the services offered to consumers.
Consumer satisfaction
In recent years, the consumer satisfaction indicator for the services provided by energy markets has experienced an increased positive evolution over time, based on the decade of the market in 2010 and 2011, respectively energy remained at a relatively low level of stagnation (Chart 15).
The graphs below (Chart 16) show that for both electricity and gas, consumers’ ability to compare products or services has been stable over time (with a score of about seven on a scale of 1–10). For electricity, the perceived ease of switching increased from 2011 to 2015 (after a sharp decrease in 2011 compared to 2010). For gas, the perceived ease of switching decreased between 2013 and 2015.
The consumer’s options
At present we cannot discuss a standardization of options but only a direct influence of it by direct factors related to the purchasing power of the final consumer. As can be seen from the graph below, the consumer’s choice can be induced by a reduction of up to 15% of the total value of the bill in which the energy services are mentioned, and implicitly depending on this aspect the consumer can opt for one supplier or another, which is also a limitation of this study (Chart 17).
The graphs below (Charts 18, 19) show different offers on the market for both the gas component and electricity.
Regulation of non-household prices in Romania
Romania has gradually eliminated the regulation of energy prices for both domestic and industrial consumers starting with 2014 for electricity consumption and continuing with 2015 for gas consumption. A small part of the final consumers still benefited from regulated prices. For industrial consumers, price regulation ended in 2014 (ANRE, 2014), however, there were occasional interventions during 2014 and until 2016 in a limited share for these consumers. This share reached 4.2% in 2016. From 2015 until now, the regulation of gas prices for non-household consumers has been abolished (Romanian Energy Regulatory Authority, 2017; ANRE, 2020).
Competitiveness issues in the context of regulations
The evolution of energy prices for both industries and household consumers has created a “proxy” in the efficiency of competitive players in the market. Moreover, competition was assessed in terms of both retail and wholesale price developments, as can be seen in the graph below (Chart 20), and regulation or deregulation was the decisive influencing factor in the national market.
The evolution of competition in terms of competitiveness and efficiency is evolving as shown above, but the profit indicator at the level of energy suppliers is the one that is also correlated with the increases practiced by them. Moreover, at the level of markets, increases in retail prices are determined as the difference between the wholesale price and the retail energy price.
In the projection below (Chart 21), the figures show that price increases are directly proportional to increases in the price of wholesale energy, as well as increases in energy in 2009, 2010, and 2013. In the energy component gas can be seen from the graph increases, but negative (2014, respectively 2015), as can be seen directly in the graph.
Between 2008 and 2016, the Romanian energy market experienced a clear tariff deficit. Moreover, negative growth influences as we have shown on the energy market were registered during this period and due to the fact that for certain periods of time the energy market regulations were present, but the income deficiencies were mainly generated by the price policy, and these were often not optimal in terms of expenditure (European Commission, 2014) At the same time, starting with 2014, the intervention of the European Commission both in the area of tariff deficiencies, but especially in the area of performance and competitiveness of regulated companies in the energy field (European Commission, 2014), highlighting on the one hand that regulated prices were not properly assessed, respectively they were small compared to the European average. Starting with 2021, respectively with the liberalization of the Romanian energy market, the evolutions of the tariff deficits were adequate and did not represent a problem compared to the European average. However, the lack of regulation cannot be said to be directly proportional to the tariff deficit, which is why at government level the proposed strategies and action plans seek to identify optimal solutions and on the one hand to meet consumer needs and on the other hand to align with policies and regulations at European level, especially in the context of military conflict with a direct impact on the energy market at national and European level. So, the energy transition poses many challenges for both public authorities and companies and consumers, which is why the concerns of European officials have been focused on achieving a fairer process for the parties involved. Liberalization of the energy market but also the political tensions generated by energy dependence will have negative effects on consumers who will face the intensification of the phenomenon of energy poverty (Dobrowolski, 2021), (Dobrowolski and Drozdowski, 2022), (Neacsa et al., 2020), (Druică et al., 2019), and (Apergis et al., 2022).
Through the presented results we wanted to highlight through the analyzed indicators the state of the domestic and industrial consumer at the level of a member state of the European Union (Romania), so that the solutions offered by decision makers both locally and at European level through the legislature and the regulations providing for this green transition, be carefully structured on the basis of strategies that support this transition from conventional to renewable sources of electricity production, and through funding programs and European directives that support through resources and financial instruments investments in electricity generation capacity based on renewable resources, to come as support to sustainably succeed this move to the green transition. Moreover, the efforts of both the population and the industries must be sustained so that they can reasonably pay for their energy consumption on the one hand, and on the other hand succeed in making financial investments in order to produce green energy for own consumption (for the domestic consumer) and for own consumption and for the energy system (for the industrial consumer). Through future discussions, we aim not only to assess the impact of decisions at national and European level in 2018–2022, but especially to analyze the profile of domestic and industrial renewable energy consumers, as well as to highlight solutions for energy policy, but especially for green investments, all the more so as the whole process of sustainable societal transformation has as its clear target the year 2050.
Conclusion
Referring to history, 1933 was the year that President Roosevelt F.D. to get the US out of the disastrous situation of the financial and economic crisis initiated and launched the economic program “New Deal,” and today with the specific elements of the present we are in a period of multi-crisis, which leads us to consider that this program of The European Commission “The New Green Deal” comes as a solution to economic recovery in the context of the current situation. Green energy is an integral part of the strategic directions until 2050. It should be noted that from the point of view of the regulatory framework at European level, the energy market has a stable framework since 2011, when the action plan on the European energy market until 2050 was also designed.
In our paper, in addition to the clear identification of renewable resources and the clear projection of the real situation in energy and gas consumption in Romania, we appreciate that only through a uniform support related to renewable resources and consumption can we move to the transition to green energy. Moreover, the emission reduction limitations of up to 60% in 2030 and 80% in 2040, respectively, compared to the level of 1990, determine us to continue our research, so that starting with the following years in addition to the indicators reflected in this study to analyze the types of energy used by both domestic and industrial consumers, as well as the level of emission reduction through their use. However, from our point of view, the sudden transition to green energy cannot be borne by citizens, which is why stages such as 2030, stage 2040 and stage 2,950 can be achievable and sustainable stages. Due to the lack of data, some of the indicators could not be presented until 2018, and this is a limitation of our study, but a determination to continue our future research.
The proposal through policies and regulations at the level of the European Commission for the EU to become neutral by 2050 in the current climate context, respectively the support through financing programs of member states’ economies and the establishment of these neutral and zero greenhouse effect economies, determines us not only to state that we will continue our research, but we will also try to outline applied economic models in different fields of activity and especially in the development of financial instruments to support these decisions and activities. Predictability also comes in the context of the objectives mentioned in the European Green Agreement, as well as in the context of existing global commitments and negotiations to support the Paris Agreement and against climate change, being a global action, and our research in this field we can say that it will create a multiplying effect, being a global problem. In addition, we will continue to engage in our future research both in the evolution of this topic and in the adoption of the European energy market, including market liberalization and the removal of regulated prices.
Moreover, this transition can also open new horizons of opportunity through our innovative capacity to actively participate in a sustainable and better future in the context of these climate constraints and through the active involvement of research, government and business environments and not least of the citizens, given the fact that “energy” is a necessary resource for the well-being of each of us. Therefore, the continuation of our research in this field is not only a desire, but rather an obligation, being part of this just societal ecosystem.
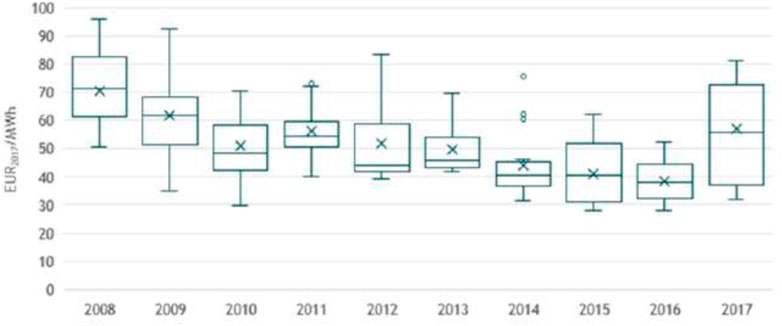
CHART 1. “Box plot” of EU wholesale electricity prices (28) in the period 2008–2017. Source: data processing based the (Rademaekers et al., 2018).
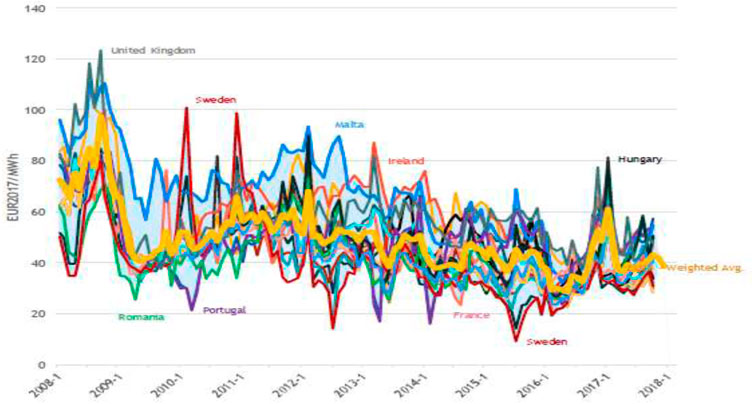
CHART 2. Wholesale electricity prices in the EU (28) 2008–2017. Source: data processing based the (Rademaekers et al., 2018).
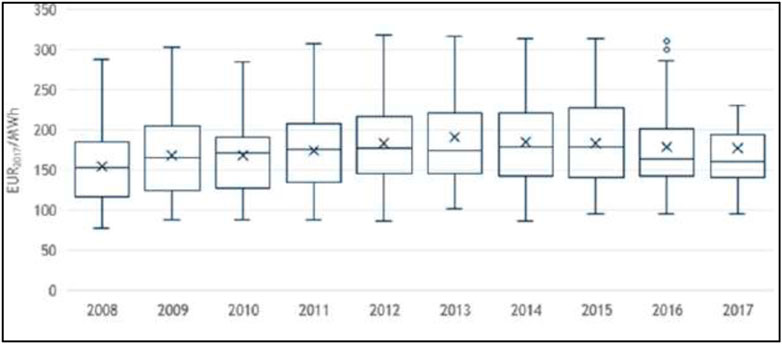
CHART 3. “Box plot” of retail electricity prices for EU households (28) 2008–2017. Source: data processing based the (Rademaekers et al., 2018).
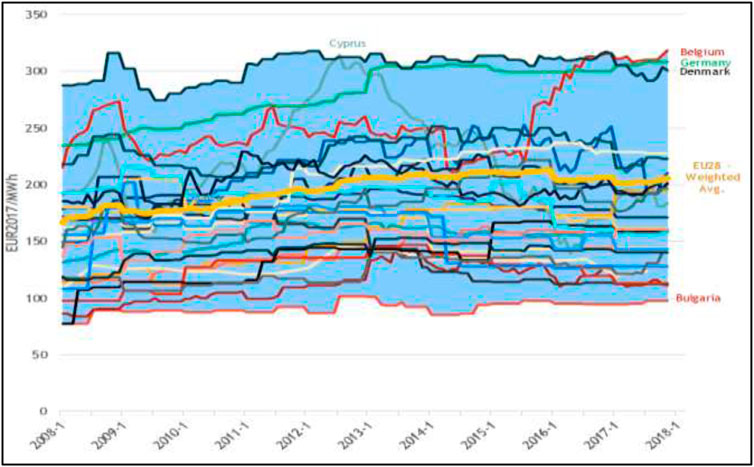
CHART 4. Electricity prices for EU households (28) in the period 2008–2017. Source: data processing based the (Rademaekers et al., 2018).
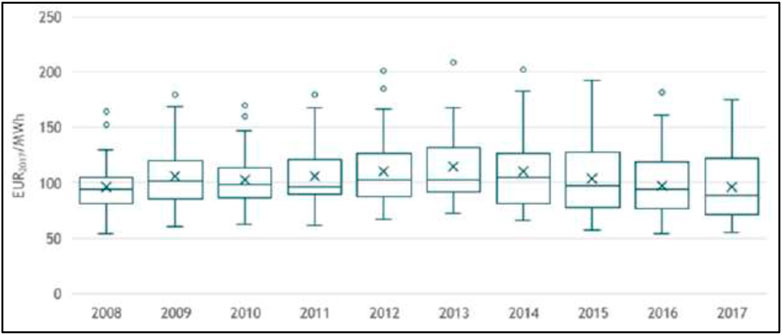
CHART 5. “Box plot” of wholesale EU gas prices (28) in the period 2008–2017. Source: data processing based the (Rademaekers et al., 2018).

CHART 6. EU natural gas wholesale prices for 2008–2017. Source: data processing based the (Rademaekers et al., 2018).
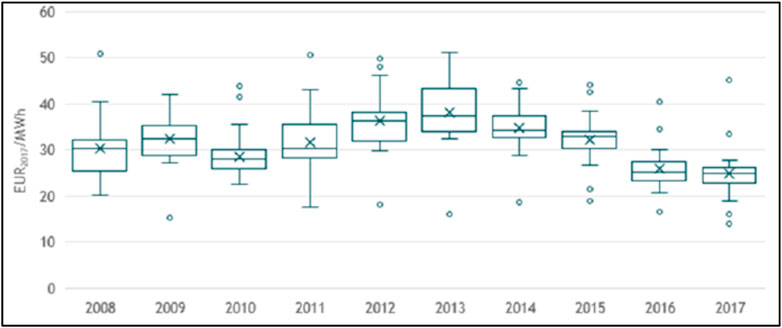
CHART 7. “Box plot” of industrial retail prices in the EU28 for natural gas in the period 2008–2017. Source: data processing based the (Rademaekers et al., 2018).
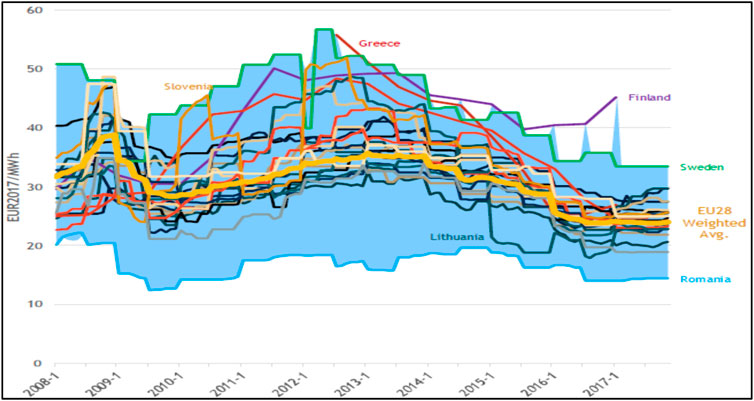
CHART 8. EU28 industrial retail prices for natural gas for the period 2008–2017. Source: data processing based the (Rademaekers et al., 2018).
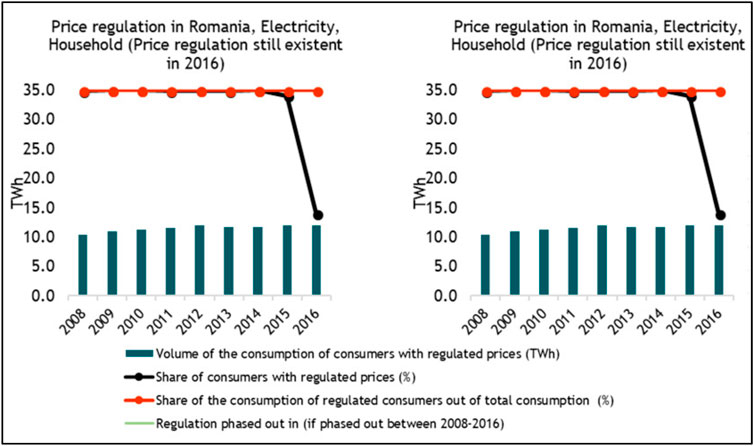
CHART 9. Regulation of household prices in Romania from 2008 to 2016. Source: data processing based the CEER, 2018.
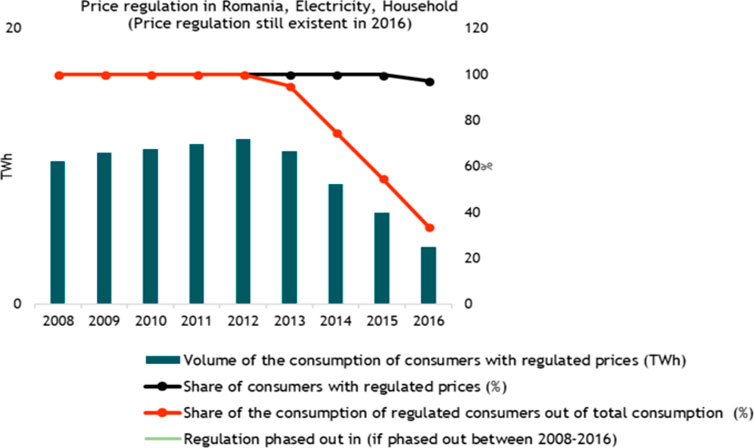
CHART 10. Regulated quotas of households. Source: data processing based the CEER, 2018.
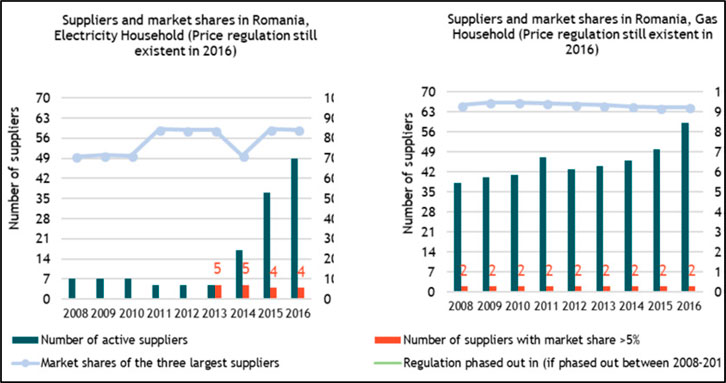
CHART 11. Presentation of the situation of suppliers and their market share. Source: data processing based the CEER, 2018.
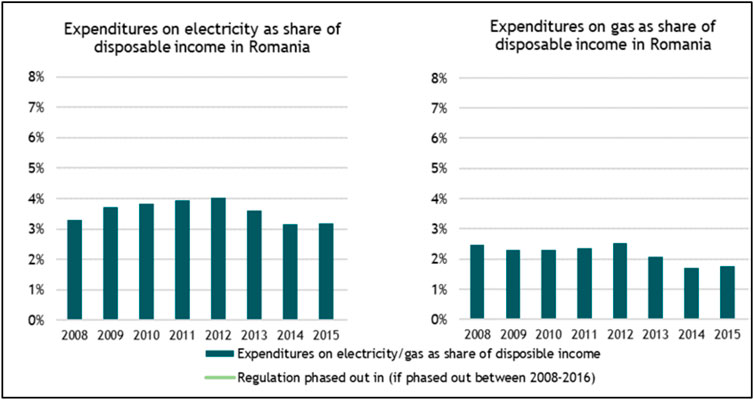
CHART 12. Share of energy expenditure (electricity and gas) in disposable household income (based on prices). Source: data processing based the (Rademaekers et al., 2018).
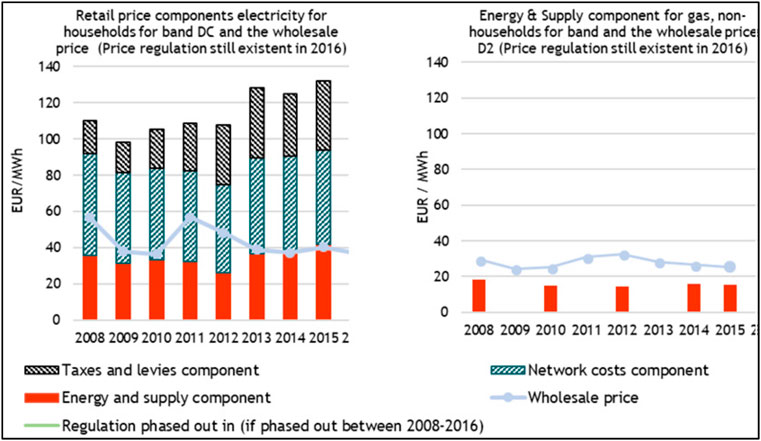
CHART 13. Presentation of the evolution of the price situation at the household level. Source: data processing based the Eurostat, 2018.
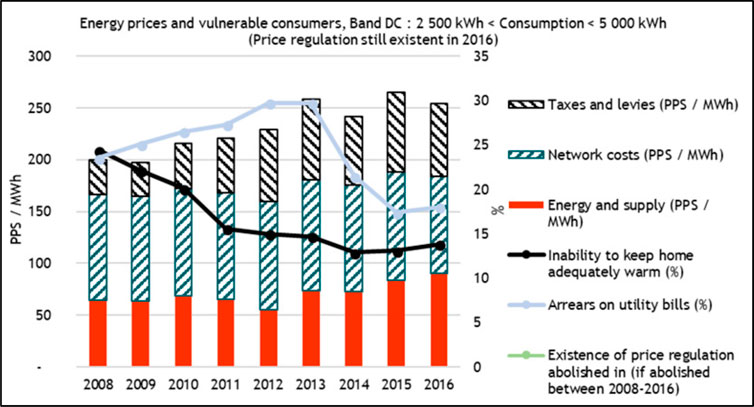
CHART 14. The components of the electricity price for the DC band, the inability to maintain the adequate quality of services and the arrears on utility bills in Romania. Source: data processing based Eurostat, 2018.
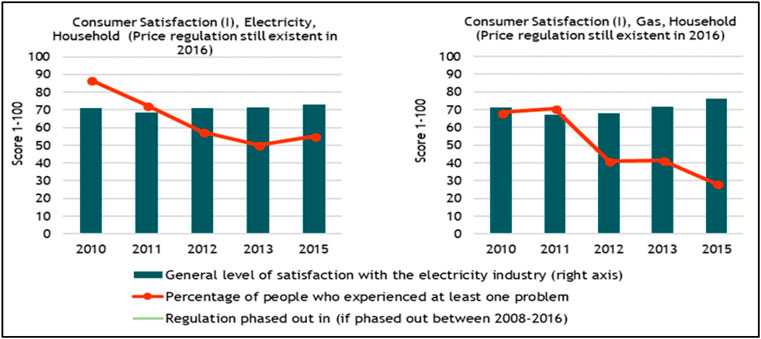
CHART 15. Presentation of the level of satisfaction indicator for the energy market services in Romania. Source: data processing based DG Justice, 2018.
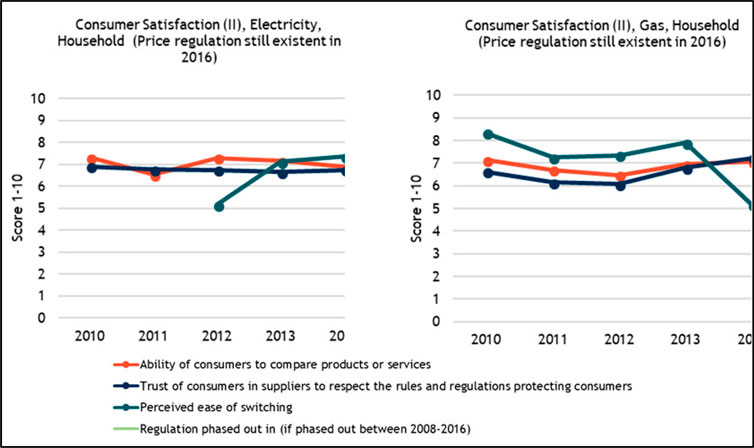
CHART 16. Consumer adaptation to change and the confidence indicator. Source: data processing based DG Justice, 2018.
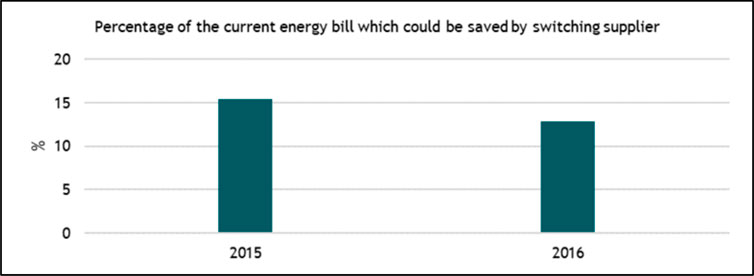
CHART 17. The consumer saving option generated by the change of supplier. Source: processing company data VaasaETT, 2017.
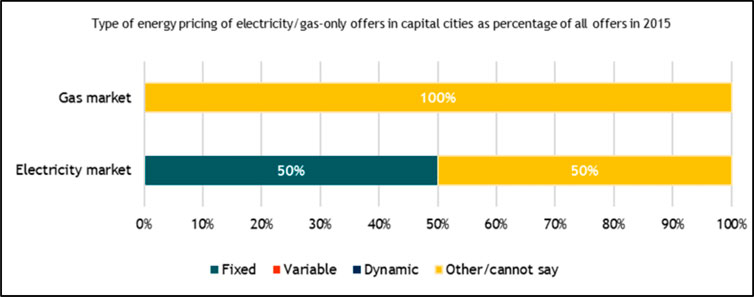
CHART 18. Exemplification of offers for household consumers in Romania. Source: data processing based ACER/CEER, 2015.
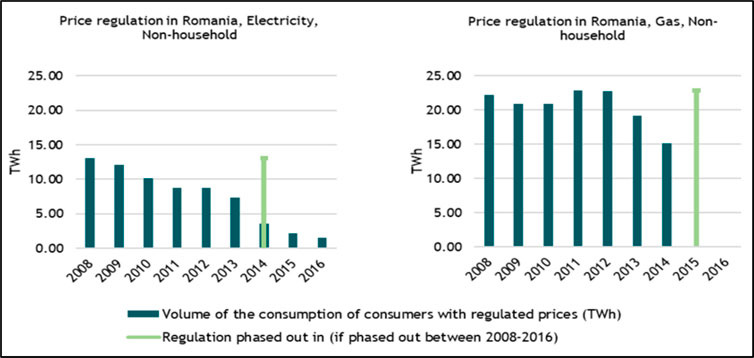
CHART 19. Presentation of price regulation for industrial consumers during 2008 and until 2016. Source: data processing based CEER, 2018.
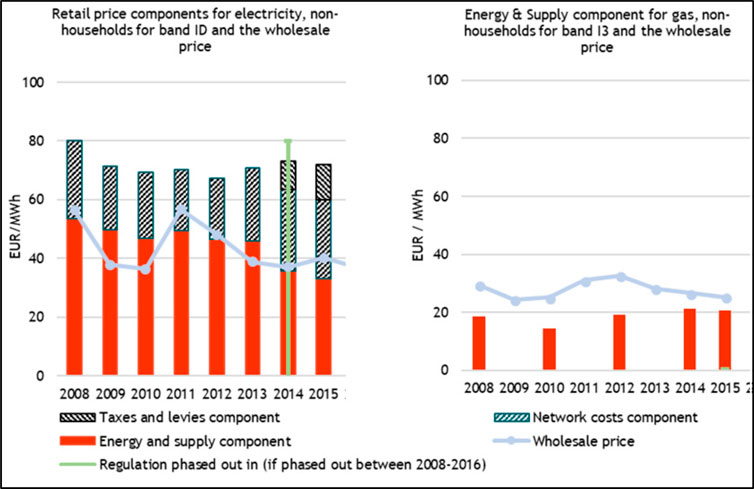
CHART 20. Components of industry retail prices and those wholesale in the Romanian energy market. Source: data processing based Eurostat, 2018.
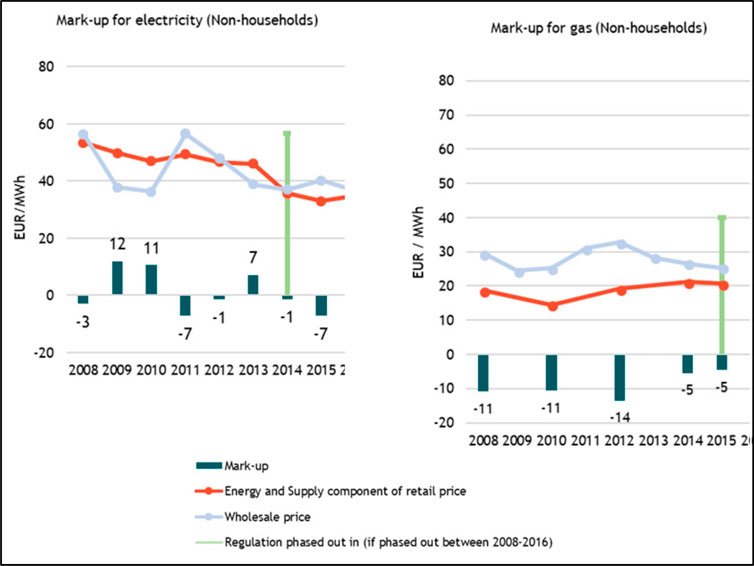
CHART 21. Evolutions of the growth in consumption of the Romanian energy market. Source: data processing based Eurostat, 2018.
Data availability statement
The raw data supporting the conclusion of this article will be made available by the authors, without undue reservation.
Author contributions
Conceptualization, LZ, OM, and IM; methodology, OM and IM; validation, OM, IM, and OF; formal analysis, OM, IM, and OF; investigation, OM, IM, and OF; resources, LZ, OM, IM, and OF data curation, OM, IM, and OF; writing—original draft preparation, LZ and OM; writing—review and editing, LZ, OM, IM, and OF; supervision, OM; project administration, OM; funding acquisition LZ. All authors have read and agreed to the published version of the manuscript.
Conflict of interest
The authors declare that the research was conducted in the absence of any commercial or financial relationships that could be construed as a potential conflict of interest.
Publisher’s note
All claims expressed in this article are solely those of the authors and do not necessarily represent those of their affiliated organizations, or those of the publisher, the editors and the reviewers. Any product that may be evaluated in this article, or claim that may be made by its manufacturer, is not guaranteed or endorsed by the publisher.
Footnotes
1to be seen Jean–Maria Chevalier, op.cit.pp 45–46.
2to be seen Christian Ngõ, op.cit. pp 97.
References
Abbasi, K., Jiao, Z., Shahbaz, M., and Khan, A. (2020). Asymmetric impact of renewable and non-renewable energy on economic growth in Pakistan: New evidence from a nonlinear analysis. Energy Explor. Exploitation 38 (5), 1946–1967. doi:10.1177/0144598720946496
Agudelo, M. A. L., Johannsdottir, L., and Davidsdottir, B. (2020). Drivers that motivate energy companies to be responsible. A systematic literature review of Corporate Social Responsibility in the energy sector. J. Clean. Prod. 247, 119094. doi:10.1016/j.jclepro.2019.119094
Andrei, J. V., Panait, M., and Voica, C. (2014). 10.5937/industrija42-7236 = Implication of the CSR and cultural model features in Romanian energy sector. Industrija 42 (4), 115–131. doi:10.5937/industrija42-7236
ANRE (2014). Newsletter fourth quarter 2014. Bucharest, Romania. Available at: https://www.scribd.com/document/334465953/Romania-ANRE-Newsletter-Fourth-Quarter-2014-1.
Apergis, N., Polemis, M., and Soursou, S. E. (2022). Energy poverty and education: Fresh evidence from a panel of developing countries. Energy Econ. 106, 105430. doi:10.1016/j.eneco.2021.105430
Armeanu, D. S., Gherghina, S. C., Andrei, J. V., and Joldes, C. C. (2021). Modeling the impact of the COVID 19 outbreak on environment, health sector and energy market. Sustain. Dev. doi:10.1002/sd.2299
Armeanu, D., Vintilă, G., Andrei, J. V., Gherghina, Ş. C., Drăgoi, M. C., and Teodor, C. (2018). Exploring the link between environmental pollution and economic growth in EU-28 countries: Is there an environmental Kuznets curve? PloS one 13 (5), e0195708. doi:10.1371/journal.pone.0195708
Badulescu, D., Badulescu, A., Simut, R., Bac, D., Iancu, E. A., and Iancu, N. (2020). Exploring environmental Kuznets curve. An investigation on EU economies. Technol. Econ. Dev. Econ. 26 (1), 1–20. doi:10.3846/tede.2019.11261
Dobrowolski, Z., and Drozdowski, G. (2022). Does the net present value as a financial metric fit investment in green energy security? Energies 15 (1), 353. doi:10.3390/en15010353
Dobrowolski, Z. (2021). Energy and local safety: How the administration limits energy security. Energies 14 (16), 4841. doi:10.3390/en14164841
Druică, E., Goschin, Z., and Ianole-Călin, R. (2019). Energy poverty and life satisfaction: Structural mechanisms and their implications. Energies 12 (20), 3988. doi:10.3390/en12203988
European Commission (2014). Electricity tariff deficit: Temporary or permanent problem in the EU?. Bruxelles, Belgium. Available at: http://ec.europa.eu/economy_finance/publications/economic_paper/2014/pdf/ecp534_en.pdf.
Eurostat (2018). European commission. Bruxelles, Belgium. Available at: http://ec.europa.eu/economy_finance/publications/economic_paper/2014/ecp534_en.htm.
Grossman, G. M., and Krueger, A. B. (1995). Economic growth and the environment. Q. J. Econ. 110 (2), 353–377. doi:10.2307/2118443
Hysa, E., Kruja, A., Rehman, N. U., and Laurenti, R. (2020). Circular economy innovation and environmental sustainability impact on economic growth: An integrated model for sustainable development. Sustainability 12 (12), 4831. doi:10.3390/su12124831
Iddagoda, A., Hysa, E. H., Stangrecka, B., and Manta, O., 2021, Green work-life balance and greenwashing the construct of work-life balance: Myth and reality, Energies, 14, 4556, doi:10.3390/en14154556
Janjua, L. R. (2021). Financial flows and environmental degradation: Empirical evidence from Algeria using auto regressive distributed lag estimation (ARDL). Int. J. Circular Econ. Waste Manag. (IJCEWM) 1 (2), 1–15. doi:10.4018/ijcewm.2021070101
Khan, S. A. R., Zaman, K., and Zhang, Y. (2016). The relationship between energy-resource depletion, climate change, health resources and the environmental Kuznets curve: Evidence from the panel of selected developed countries. Renew. Sustain. Energy Rev. 62, 468–477. doi:10.1016/j.rser.2016.04.061
Klooster, D., and Masera, O. (2000). Community forest management in Mexico: Carbon mitigation and biodiversity conservation through rural development. Glob. Environ. Change 10, 259–272. doi:10.1016/S0959-3780(00)00033-9
Lawrence, D., and Vandecar, K. (2015). Effects of tropical deforestation on climate and agriculture. Nat. Clim. Chang. 5, 27–36. doi:10.1038/nclimate2430
Leitão, N. C., Balsalobre-Lorente, D., and Cantos-Cantos, J. M. (2021). The impact of renewable energy and economic complexity on carbon emissions in BRICS countries under the EKC Scheme. Energies 14 (16), 4908. doi:10.3390/en14164908
List, J. A., and Gallet, C. A. (1999). The environmental Kuznets curve: Does one size fit all? Ecol. Econ. 31 (3), 409–423. doi:10.1016/s0921-8009(99)00064-6
Marian, C., and Panait, M. (2019). Challenges imposed by renewable energy paradigms of the Romanian economy from the European perspective. Econ. Insights - Trends Challenges 8 (1), 49–60.
Morina, F., Ergün, U., and Hysa, E. (2021). Understanding drivers of renewable energy firm’s performance. Environ. Res. Eng. Manag. 77 (3), 32–49. doi:10.5755/j01.erem.77.3.29230
Neacsa, A., Panait, M., Muresan, J. D., and Voica, M. C. (2020). Energy poverty in European Union: Assessment difficulties, effects on the quality of life, mitigation measures some evidences from Romania. Sustainability 12 (10), 4036. doi:10.3390/su12104036
Nurunnabi, M., Esquer, J., Munguia, N., Zepeda, D., Perez, R., and Velazquez, L. (2020). Reaching the sustainable development goals 2030: Energy efficiency as an approach to corporate social responsibility (CSR). GeoJournal 85 (2), 363–374. doi:10.1007/s10708-018-09965-x
Oldekop, J. A., Sims, K. R. E., Karna, B. K., Whittingham, M. J., and Agrawal, A. (2019). Reductions in deforestation and poverty from decentralized forest management in Nepal. Nat. Sustain. 2, 421–428. doi:10.1038/s41893-019-0277-3
Panait, M. C., Voica, M. C., Hysa, E., Siano, A., and Palazzo, M. (2022). The bucharest stock exchange: A starting point in structuring a valuable csr index. J. Risk Financ. Manag. 15 (2), 94. doi:10.3390/jrfm15020094
Panait, M., Voica, M. C., and Rădulescu, I. (2019). Approaches regarding environmental Kuznets curve in the European Union from the perspective of sustainable development. Appl. Ecol. Environ. Res. 17 (3), 6801–6820. doi:10.15666/aeer/1703_68016820
Paun, D. (2017). Sustainability and financial performance of companies in the energy sector in Romania. Sustainability 9 (10), 1722–1732. doi:10.3390/su9101722
Piciocchi, P., Vollero, A., and Palazzo, M. (2009). Towards the integration between corporate community relations and CSR communication strategies the ENEL case study. Esperienze d'Impresa 17 (2).
Rademaekers, K., Smith, M., Yearwood, J., Saheb, Y., Moerenhout, J., Pollier, K., et al. (2018). Study on Energy Prices, Costs and Subsidies and their Impact on Industry and Households. Final Report, Trinomics, Rotterdam.
Romanian Energy Regulatory Authority (2017). National report 2016. Available at: https://www.ceer.eu/documents/104400/5988265/C17_NR_Romania-EN.pdf/f91e100d-0e28-fd97-2c18-719d1993c1e1.
Ruggiero, S., and Lehkonen, H. (2017). Renewable energy growth and the financial performance of electric utilities: A panel data study. J. Clean. Prod. 142, 3676–3688. doi:10.1016/j.jclepro.2016.10.100
Samii, C., Lisiecki, M., Kulkarni, P., Paler, L., and Chavis, L. (2014). Effects of decentralized forest management (dfm) on deforestation and poverty in low- and middle-income countries: A systematic review. Campbell Syst. Rev. 10, 1–88. doi:10.4073/csr.2014.10
Schuwirth, L. W., and Van der Vleuten, C. P. (2018). How to design a useful test: The principles of assessment. Understanding medical education: Evidence, theory, and practice, 275–289.
Shafik, N., and Bandyopadhyay, S. (1992). Economic growth and environmental quality: Time-series and cross-country evidence, 904. World Bank Publications.
Shahbaz, M., Wang, J., Dong, K., and Zhao, J. (2022). The impact of digital economy on energy transition across the globe: The mediating role of government governance. Renew. Sustain. Energy Rev. 166, 112620. doi:10.1016/j.rser.2022.112620
Sharif, A., Afshan, S., Chrea, S., Amel, A., and Khan, S. A. R. (2020). The role of tourism, transportation and globalization in testing environmental Kuznets curve in Malaysia: New insights from quantile ARDL approach. Environ. Sci. Pollut. Res. 27 (20), 25494–25509. doi:10.1007/s11356-020-08782-5
Shukla, V., and Parikh, K. (1992). The environmental consequences of urban growth: Cross-national perspectives on economic development, air pollution, and city size. Urban Geogr. 13 (5), 422–449. doi:10.2747/0272-3638.13.5.422
Simionescu, M. (2021). Revised environmental Kuznets Curve in CEE countries. Evidence from panel threshold models for economic sectors. Environ. Sci. Pollut. Res. 28 (43), 60881–60899. doi:10.1007/s11356-021-14905-3
Song, X-H., Han, J-J., Zhang, L., Zhao, C-P., Wang, P., Liu, X-Y., et al. (2021). Impacts of renewable portfolio standards on multi-market coupling trading of renewable energy in China: A scenario-based system dynamics model. Energy Policy 159, 112647. doi:10.1016/j.enpol.2021.112647
Spanos, Y. E., Zaralis, G., and Lioukas, S. (2004). Strategy and industry effects on profitability: Evidence from Greece. Strateg. Manag. J. 25 (2), 139–165. doi:10.1002/smj.369
United Nations (2022). Decision/CP.26, glasgow climate Pact. Available online: https://unfccc.int/sites/default/files/resource/cop26_auv_2f_cover_decision.pdf.
Vollero, A., Siano, A., Palazzo, M., and Elving, W. (2011). “Corporate Communication and CSR; comparing Italian and Dutch energy companies on anti-greenwashing strategies,” in CSR Communication conference 2011: The 1st international CSR Communication conference.
Wang, L., Li, S., and Gao, S. (2014). Do greenhouse gas emissions affect financial performance? - an empirical examination of Australian public firms. Bus. Strategy Environ. 23 (8), 505–519. doi:10.1002/bse.1790
World leaders (2022). Corporations at COP26, take major step to restore and protect forests. Available online: https://news.un.org/en/story/2021/11/1104642 (accessed on July 9, 2022).
Keywords: climate neutrality, energy system, competitiveness, sustainability, collaborative economy
Citation: Zhao L, Manta O, Militaru I and Folcut O (2022) The current paradigm of the EU energy system and its impact on the sustainability of member states’ economies by 2050. Front. Environ. Sci. 10:967503. doi: 10.3389/fenvs.2022.967503
Received: 13 June 2022; Accepted: 28 September 2022;
Published: 15 November 2022.
Edited by:
Xiao-Guang Yue, European University Cyprus, CyprusReviewed by:
Xiao Huaiyun, Yancheng Institute of Technology, ChinaYang Hongmei, Rajamangala University of Technology Rattanakosin, Thailand
Xiaojing Li, Rajamangala University of Technology Tawan-ok, Thailand, in collaboration with reviewer (YH)
Copyright © 2022 Zhao, Manta, Militaru and Folcut. This is an open-access article distributed under the terms of the Creative Commons Attribution License (CC BY). The use, distribution or reproduction in other forums is permitted, provided the original author(s) and the copyright owner(s) are credited and that the original publication in this journal is cited, in accordance with accepted academic practice. No use, distribution or reproduction is permitted which does not comply with these terms.
*Correspondence: Otilia Manta, b3RpbGlhLm1hbnRhQHJnaWMucm8=