 Dawei Huang1,2
 Gang Chen2*
- 1School of Management, Shenzhen Polytechnic, Shenzhen, Guangdong, China
- 2School of Economics and Management, Harbin Institute of Technology, Shenzhen, Guangdong, China
The purpose of this study is to apply a multidimensional fixed-effects difference-in-differences (DID) model to empirically examine the impact, policy mechanism, and heterogeneity of Technologically Advanced Policy (TAP) on green innovation in small and medium-sized enterprises (SMEs) based on the data of China’s A-share listed companies from 2004 to 2021. The results show that TAP significantly improves the green innovation level of listed companies on the small and medium-sized board, and has a more significant role in promoting technologically advanced enterprises (TAEs). The results of the policy effect are still robust after the placebo test, changing the dependent variable, and controlling for the influence of the environmental inspection system, the emissions trading system (ETS), and the carbon emissions trading system (CETS). Furthermore, we find that the policy effect of TAP is better in state-owned SMEs and SMEs in the eastern, central, and western regions. In addition, further research shows that the green innovation effect of TAP is mainly realized through mechanisms such as government subsidies, tax reduction, credit financing, and market competition. Moreover, state-owned SMEs have obvious advantages in the three mechanisms of government subsidy, tax reduction, and market competition, while private SMEs only have significant advantages in credit financing mechanisms. Overall, our findings show that TAP has achieved policy effects in promoting green innovation for SMEs in China, but state-owned SMEs still receive significant policy preference. It is recommended that future policy reforms favor private SMEs.
1 Introduction
To cope with environmental pollution, climate change, and the increasingly complex international political, economic, and trade situation, the Chinese government has put forward high-quality development requirements for its economy (An et al., 2021; Zhao et al., 2021; Ge et al., 2021), that is, to transform from extensive development with high pollution and high emissions to green and sustainable quality development (Su et al., 2022; Yuan et al., 2022). As the largest economic entity in economic and social development, small and medium-sized enterprises (SMEs) are the key to expanding employment, improving people’s livelihoods, promoting green innovation and development, and then realizing economic transformation in China (Yu and Fu, 2021; Dai et al., 2021). According to Sixlens data, by the end of 2020, the number of SMEs in business in China exceeded 42 million, accounting for more than 98% of the total number of Chinese enterprises (Zhang et al., 2021). However, there is still a big gap between the innovation and development of SMEs and the leading large enterprises (Zhu et al., 2012). By the end of 2020, only 1.011 million Chinese SMEs had patents, accounting for only 2.4%. In Guangdong Province, which has the largest number of SMEs (5.865 million), SMEs with patents only account for 3.4%, which shows that the innovation and development situation of SMEs is not optimistic (Jia et al., 2020; Zheng et al., 2021). Therefore, the Chinese government has issued a series of economic policies to help SMEs quickly promote green innovation and development (Sizhen et al., 2005; Min et al., 2021; Wang and Kesan, 2022). In July 2013, China’s Ministry of Industry and Information Technology issued the “Guiding Opinions on Promoting the Development of Technologically Advanced Small and Medium-sized Enterprises”, which aims to guide SMEs to carry out technological innovation, management innovation, and business model innovation, and cultivate new growth points, to form new competitive advantages and improve the overall quality of SMEs. And from 2019 to 2021, three batches of technologically advanced “little giant” companies have been announced, and it is planned to form 1 million innovative SMEs and 100,000 ″technologically advanced” SMEs during the “14th Five-Year Plan” period (Zhang et al., 2022; Dong and Li, 2021; Li, 2021). Therefore, an in-depth understanding of the processing effect of Technologically Advanced Policy (TAP) will help the Chinese government more effectively use policy tools to promote green innovation in SMEs to meet the challenges of green and sustainable development under complex climate conditions.
According to the existing researches, few scholars have conducted an empirical analysis on whether the Chinese government’s TAP can play a role in promoting the SMEs’ green innovation (Zhang et al., 2022). On the one hand, China’s TAP has a long time span and involves a wide range of areas making it difficult to simply judge the policy effect. In theory, such policies may not only promote the high-quality development of SMEs, but also have a dampening effect due to the green requirements of the policy. On the other hand, China’s TAP is rich in content, diverse in policy intervention methods, and the channels through which policy effects are exerted and the heterogeneity of policy effects are relatively complex (Yu et al., 2016).
To better solve the above problems, we manually collected the green patent data of SMEs, and matched it with the CSMAR listed company Database to obtain the green patent data set of listed companies including SMEs, and constructed the TAP variable, using a variety of estimation methods including the difference-in-differences (DID) method with multi-dimensional fixed effects to examine the influence, mechanism and heterogeneity of policy effects of China’s TAP on green innovation of SMEs.
Our contributions are mainly reflected in the following three aspects: Firstly, we enriched the research on the influencing factors of SMEs’ green innovation. There is abundant theoretical and empirical literature on enterprise green innovation (Zhou et al., 2021; Du et al., 2022), but there are few works of literature on the evaluation of relevant policy effects of SMEs’ green innovation (Iqbal et al., 2021), especially the research on the impact of TAP on SMEs’ green innovation. We use the small and medium-sized board of Chinese A-share listed companies and other listed companies to form a treatment group and a control group, combined with the TAP implementation time treatment variable, and confirm the positive effect of the Chinese government’s introduction of TAP through empirical testing. Secondly, we try to use a variety of causal identification methods, such as the DID method with multi-dimensional fixed effects, the difference-in-difference-in-differences (DDD) method, etc. to estimate Chinese TAP effects, mechanisms, and heterogeneity. Thirdly, we further examine the effect of Chinese TAP on the cultivation of technologically advanced SMEs and technologically advanced “little giants”. The above research provides ideas for subsequent scholars to evaluate the effects of similar SMEs’ stimulus policies introduced by other countries or regions.
The rest of this paper is organized as follows: Section 2 discusses the policy background and theoretical analysis. Section 3 presents the methodology and data. Section 4 presents the empirical results of the benchmark model and robustness tests. Section 5 is an in-depth analysis of the mechanism. Section 6 is the investigation of policy heterogeneity. The last part is the discussion and conclusions.
2 Policy background and hypothesis
With global climate change, the intensification of Sino-US trade friction, and the global abuse of COVID-19, China’s green innovation development is facing severe challenges. The Chinese government urgently needs to speed up the solution of green innovation problems, and gives full play to the supporting role of macroeconomic policies in the high-quality development of “technologically advanced” SMEs (Dong and Li, 2021; Zhang et al., 2022). In July 2013, China’s Ministry of Industry and Information Technology issued the “Guiding Opinions on Promoting the Development of Technologically Advanced Small and Medium-sized Enterprises”, and it put forward opinions on promoting the development of “technologically advanced” SMEs from the perspectives of overall thinking, key tasks, and promotion measures, and called for strengthening the cultivation and support of “technologically advanced” SMEs. In July 2021, the Politburo meeting of the CPC Central Committee emphasized the need to strengthen technological innovation and the resilience of industrial and supply chains, and to develop “technologically advanced” SMEs. China’s central and local governments have introduced a series of “technologically advanced” policies on fiscal and taxation, direct financing, credit, government procurement, and technological innovation. By the end of 2021, China has cultivated 4,762 national-level technologically advanced “little giant” enterprises, driving more than 40,000 provincial-level “technologically advanced” SMEs, and 117,000 warehousing enterprises, involving more than 30 sub-sectors. At the beginning of 2022, the government work report of China’s Two Sessions once again proposed to “focus on cultivating ‘technologically advanced’ enterprises, and provide strong support in terms of funds, talents, incubation platform construction, etc.” (Dong and Li, 2021; Li, 2021).
TAP pointed out the key tasks (targets): to enhance the technological innovation capabilities of enterprises; to give play to the role of SMEs as the main body of innovation; to encourage SMEs to continuously increase investment in R&D and technological transformation; to improve the ability of independent innovation, integrated innovation and introduction, digestion, absorption, and re-innovation; and to enhance the driving force of innovation-driven development. Based on the above policy content and literature (Zhang et al., 2022), we propose the core hypothesis of this study:
H1: TAP will increase the level of green innovation of SMEs.
In addition, according to the content of the policy document, we summarize the main measures of TAP:
①Fiscal and taxation support. Give full play to the guiding and supporting role of special funds and funds at all levels to support the development of SMEs, increase support for technological progress and technological transformation of SMEs, focus on supporting “technologically advanced” technologies and products, and cultivate “technologically advanced” SMEs. Implement incentive policies to support the innovation and development of SMEs, such as pre-tax deduction of corporate R&D expenses and accelerated depreciation of eligible fixed assets. Accordingly, based on the above policy content and literature (Li and Wang, 2022; Wang and Kesan, 2022), we propose the first hypothesis about the policy effect mechanism:
H2: Fiscal and taxation policy support is an important mechanism for TAP to enhance the green innovation level of SMEs.② Financial support. Broaden the financing channels to support the technological innovation of SMEs, build a financing service platform, and facilitate the connection of projects between banks and “technologically advanced” enterprises. Encourage banking financial institutions to innovate in financial products and services, and support “technologically advanced” SMEs to take credit loans and other means of financing. Accordingly, we propose a second hypothesis about the policy effect mechanism (Zhang et al., 2022):
H3: Credit financing support is an important mechanism for TAP to enhance the green innovation level of SMEs.③Enhance competitiveness. Establish and improve the service system, organize market development activities, strengthen the cultivation and promotion work, actively carry out the work of promoting the “technologically advanced” development of SMEs, cultivate and identify a batch of “technologically advanced” SMEs, and enhance industrial competitiveness. Accordingly, we propose a third hypothesis about the policy effect mechanism (Han, 2022):
H4: Enhancing market competitiveness is an important mechanism for TAP to enhance the green innovation level of SMEs.
3 Methodology and data
3.1 Methodology
For credible identification of policy effects, we mainly use the DID method (Card and Krueger, 1994; Goodman-Bacon, 2021) with multi-dimensional fixed effects and the DDD method (Huang and Chen, 2022; Wang et al., 2021) to investigate the impact of TAP on the green innovation of SMEs, especially technologically advanced enterprises. Specifically, this study uses the TAP year as the first difference to compare the impact before and after the policy implementation; SMEs are used as the second difference to examine the impact of policy implementation on SMEs, while non-SMEs have no significant or no impact; taking technologically advanced enterprises as the third difference, compare whether the impact of technologically advanced enterprises is different from that of non-technologically advanced enterprises. Accordingly, we constructed the following DID model to test the impact of TAP on the green innovation of SMEs:
Further, we construct the following DDD model to examine the impact of TAP on technologically advanced firms in SMEs:
In the above two models, {i,m}represents the listed company, j represents the province, and t represents the year.
3.2 Variables
1) Dependent Variable. Referring to the studies of Li and Zheng (2016), Wang and Wang (2021), etc., we use the number of green patent applications of listed companies to measure the level of corporate green innovation. Liu and Xiao (2022) believe that, firstly, compared with green patent data, it is difficult for researchers to obtain green innovation R&D data from enterprise-level R&D data, while green patent data can be accurately obtained through matching multiple databases. Secondly, because green patent application data is more reliable and timelier than patent grant data and other metrics, patent granting often requires a relatively long processing and certification cycle, with serious lag, but patent application data does not have this problem. Specifically, the number of green patent applications of listed companies is obtained by adding up the number of green invention patents and green utility model patents of listed companies. In addition, in the follow-up research, we will conduct a robustness test with the number of green invention patents and green utility model patents of listed companies as proxy variables of the dependent variable. To eliminate the obvious right-skewed distribution problem of green patent data of listed companies, we take the natural logarithm of the number of patents plus 1 to obtain the dependent variable
2) Key Explanatory Variable. The key explanatory variable in the benchmark model (1) is the multiplication term of the dummy variable of TAP time and the dummy variable of the treatment group of whether the company is listed on the small and medium board.
3) Control Variables. To control the potential confounding factors that may affect the green innovation of enterprises and obtain a more reliable policy effect estimation result, we refer to Qi et al. (2018) to control the following firm-level variables: ① Enterprise size (Size); ② asset-liability ratio (Lev); ③ Return on assets (ROA); ④ Enterprise TobinQ (TobinQ); ⑤ Enterprise age (FirmAge). In addition, we also control for province fixed effects, firm individual fixed effects, and year fixed effects, which remove unobservable confounding factors at the regional and firm levels that do not change with time, and time factors that do not change with individuals, respectively, improving the credibility of policy effect estimates.
3.3 Data sources
This paper takes the establishment of the SME board in 2004 as the starting year of the research, and manually collects the green patent data of A-share listed companies from 2004 to 2021. Financial insurance and abnormal trading listed companies (ST and PT listed companies) are excluded, and samples of companies with serious missing variables are also removed. The data sources for this study mainly include two parts: The first is the characteristic data of listed companies. This part of the listed company’s financial situation, equity attributes, and other data comes from the CSMRA database, and the data of enterprise R&D investment comes from the Wind and Flush databases. The second is the patent data of listed companies. This part obtains the patent data (including green patents) of listed companies by matching the patent identification of listed companies in the China Research Data Service Platform (CNRDS) with the “Green List of International Patent Classification” issued by the World Intellectual Property Organization (WIPO) (Wang and Wang, 2021). By matching firm feature data with patent data, we end up with 42,161 observations. To eliminate the influence of extreme values, this paper performs a 1% winsorize treatment on the main variables.
3.4 Descriptive statistics
Table 1 shows the descriptive statistics of the main variables. The mean value of
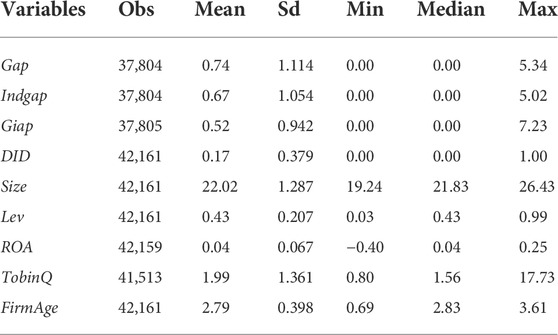
TABLE 1. Descriptive statistics.
4 Empirical results
4.1 Parallel trend test
The important premise of using the DID model to identify policy effects is that the policy treatment group and the control group have a significant parallel trend before policy implementation (Huang and Chen, 2022; Wang et al., 2021). That is, before 2013, the green innovation levels of listed companies on the SME board and non-SME board companies should have had a parallel time series trend. Based on the literature (Deschenes et al., 2017; Liu and Xiao, 2022), we use the event study method to carry out the parallel trend test. The model is as follows:
In model (3),
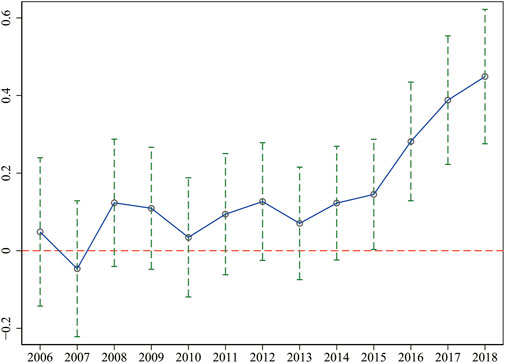
FIGURE 1. Parallel trend test.
4.2 Benchmark results
As shown in Table 2, columns (1)–(3) are estimated by the DID model without control variables without fixed effects, without control variables with fixed effects, with control variables without fixed effects, and DID models including control variables and multidimensional fixed effects. Average treatment effect results, where column (4) is the estimated result from the baseline model (1). By comparison, we can examine the difference in estimated results with or without control variables and with or without fixed effects. The results show that after controlling for enterprise-level control variables and fixed effects of the province, individual, and time, TAP shows a significant promoting effect on the number of green patents of listed companies on the small and medium-sized boards, and the estimated coefficient is significant at the 1% confidence level. The above benchmark regression results confirm for the first time that China’s TAP has significantly improved the green innovation of SMEs, which is consistent with the theoretical hypothesis H1, that is, the implementation of China’s TAP will help SMEs achieve green transformation and promote green innovation of SMEs.
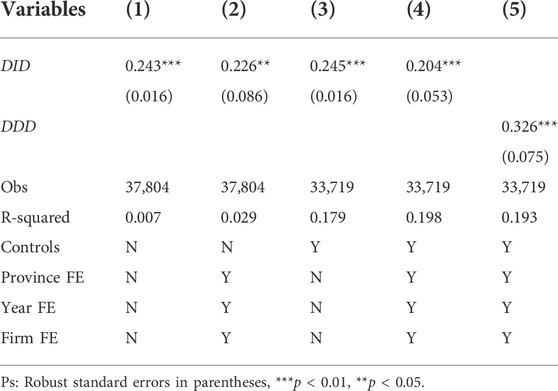
TABLE 2. Baseline regression results.
In addition, column (5) in Table 2 is the estimation result of the DDD model (2). It is not difficult to see that the green innovation of the three batches of technologically advanced enterprises announced by the Chinese government has been significantly promoted compared with non-technologically advanced enterprises. The coefficients of the DDD estimates are higher than those of the DID estimates, and the estimated results are significant at the 5% confidence level.
4.3 Robustness tests
4.3.1 Placebo test
To further exclude the influence of other unknown confounding factors on the estimation of policy effects, this study selected a virtual experimental group through 1,000 random samples, and also used a multidimensional fixed effect DID model to estimate the results of the placebo test. Figure 2 shows the distribution of DID term coefficients in the random sampling estimation results. It can be found that most of the sampling estimation coefficients still have a low pass rate at the 10% confidence level, that is, the significance of the placebo sampling results fails. It shows that the TAP effect does not exist significantly in the random sampling simulation, that is, the benchmark estimation results pass the placebo test.
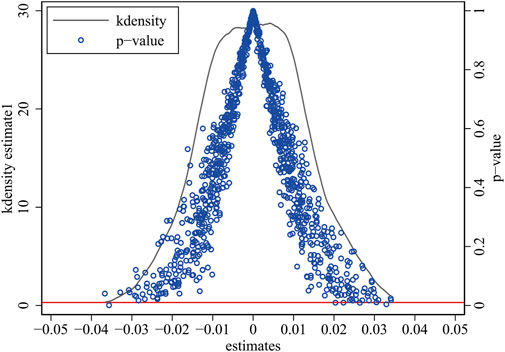
FIGURE 2. Placebo test.
4.3.2 Change the dependent variable
Based on Xu and Cui (2020), in addition to using the number of green patent applications in the current year as the dependent variable, this study also added three variables as dependent variables: the number of green patents applied for independently in the year (Indgap), the number of green inventions applied for in the year (Giap), and the proportion of green patents applied for in the year to the total number of patent applications (Gapratio), carried out a robustness test, and re-identified and estimated the benchmark model (1). This way of processing can exclude the influence of unobservable confounding factors that may be ignored by the use of the total number of green patents and the use of quantitative data alone.
The estimation results are shown in Table 3. Columns (2)–(4) are the analysis results of using the benchmark model (1) to estimate policy effects when Indgap, Giap, and Gapratio are used as dependent variables. Column (1) is the benchmark result as a control. It is not difficult to find that the estimated results of the three groups of dependent variables are significantly positive at the 1%, 5%, and 10% confidence levels, respectively. This shows that under a variety of dependent variables that measure the level of green innovation, the promotion effect of TAP on green innovation of SMEs is still significant, and the benchmark estimation results are robust, which verifies hypothesis H1 again.
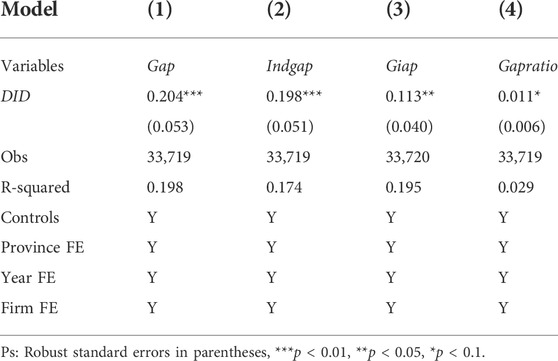
TABLE 3. Baseline regression with different dependent variables.
4.3.3 The difference-in difference-in-differences method
To further eliminate the confounding effects of other competing policies, such as the environmental inspection mechanism implemented in 2015, the carbon emissions trading system (CETS) implemented in 2011, and the emissions trading system (ETS) implemented in 2007, based on the research of Liu and Xiao (2022), we constructed the environmental supervision mechanism, policy dummy variables of CETS and ETS respectively. Incorporated into the benchmark model (1) to control for the confounding effects of the three policies, DID estimation of multi-dimensional fixed effects was performed, and the estimation results are shown in Table 4.
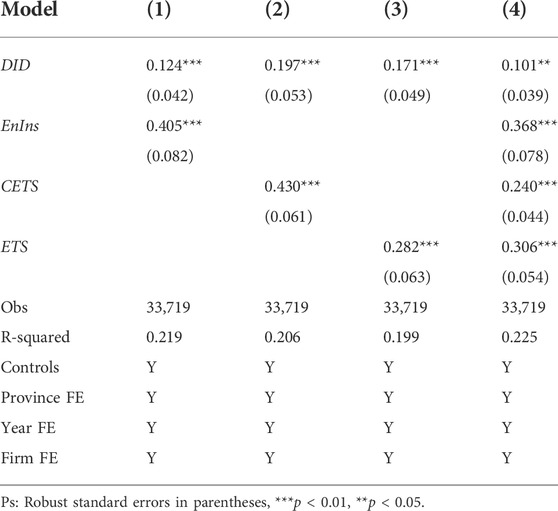
TABLE 4. DDD estmation result.
Columns (1)–(3) are the estimation results of adding the environmental supervision mechanism, CETS, and ETS policy dummy variables, respectively. The DID estimation results are all significantly positive at the 1% level, indicating that after controlling the above three possible confounding factors alone, TAP still has a positive effect on the green innovation of SMEs. Then, we incorporate the three policy interference factors into the control variables for benchmark estimation and get column (4). The results show that the green innovation effect of TAP’s SMEs is still significantly positive after controlling the three kinds of policy disturbances simultaneously, which verifies hypothesis H1 again and verifies the robustness of the benchmark estimation results.
5 Mechanism analysis
Since the specific measures of TAP are similar to those of China’s industrial policies, they are supportive economic policies. Therefore, we refer to the practice of Yu et al. (2016) which examines the mechanism of TAP’s role in promoting green innovation of SMEs from four aspects: government subsidy, tax reduction, credit financing, and market competition.
5.1 Government subsidy mechanism
Previous studies have shown that government subsidies in the Chinese government’s supportive economic policies are an important mechanism to promote the green innovation of enterprises (Li and Zheng, 2016; Yu et al., 2016). To test whether government subsidies in TAP achieve their policy goals, we constructed the following model to test hypothesis H2:
In the formula, the government subsidy variable for listed companies is calculated by
The estimated results are shown in Table 5. Columns (1)–(3) are the estimated results of the overall sample, the state-owned listed company sample, and the private listed company sample. The results show that the three
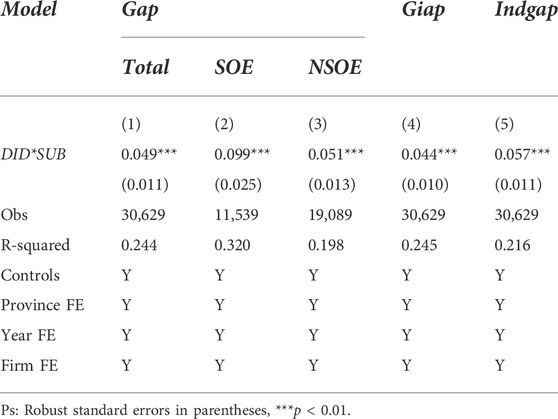
TABLE 5. Government subsidy mechanism estimation results.
This is consistent with the research of Li and Zheng (2016), that is, compared with private enterprises, state-owned enterprises are more likely to obtain government policy inclination and financial support. In addition, we also test the robustness of the government subsidy mechanism by changing the dependent variable. Columns (4) and (5) take the number of green invention patents applied for in the current year and the number of independent green patent applications in the current year as the dependent variables, and the estimated results of the robustness test according to the above model. In both test results, the
5.2 Tax reduction mechanism
Previous studies have shown that tax incentives are an important means for the Chinese government to effectively stimulate the innovation of economic entities (Chen and Yang, 2019). Based on the research of Yu et al. (2016), we use the effective tax rate
In theory, the reduction of the effective tax rate of listed companies will reduce the operating costs of enterprises, which in turn will indirectly promote the green innovation process of enterprises. Therefore, the
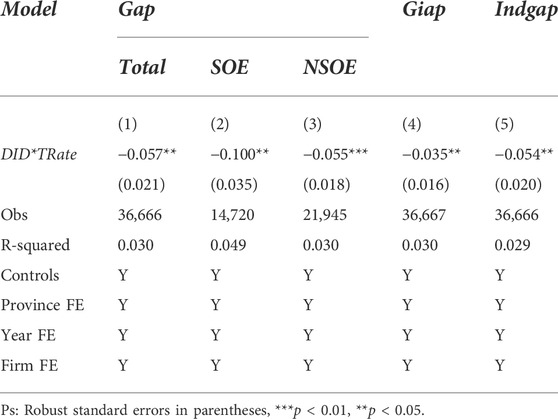
TABLE 6. Tax reduction mechanism estimation results.
It is different from Yu et al. (2016) results on the tax mechanism test in industrial policy and enterprise innovation, that is, compared with private enterprises, state-owned enterprises are more likely to obtain preferential tax policies from the government. In addition, we also test the robustness of the tax incentive mechanism by changing the dependent variable. Columns (4) and (5) take the number of green invention patents applied for in the current year and the number of independent green patent applications in the current year as the dependent variables, and the estimated results of the robustness test according to the above model. In both test results, the
5.3 Credit financing mechanism
In China, the credit financing policy, together with government subsidies and tax incentives, is an important measure for the government to stimulate the innovation of various economic entities (Hu et al., 2021). We use long-term loans
Theoretically, the Chinese government’s support for listed companies’ credit financing will ease corporate financing constraints, reduce corporate financing costs, and indirectly promote the green innovation process of companies. The estimated results are shown in Table 7. Columns (1)–(3) are the estimated results of the overall sample, the state-owned listed company sample, and the private listed company sample. The results show that the coefficients of columns (1) and (3) are both significantly positive at the 1% level, while the coefficient of the state-owned sample is positive but not significant. On the one hand, it is demonstrated that credit financing is an important mechanism for TAP to promote green innovation of enterprises, assuming that H3 is certified; On the other hand, it also shows that TAP can better promote green innovation of private SMEs through the credit financing mechanism.
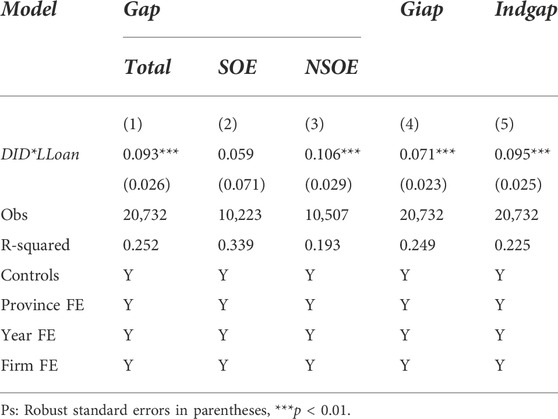
TABLE 7. Credit financing mechanism estimation results.
It is consistent with the research results of Yu et al. (2016), and Xu and Cui (2020), that is, compared with state-owned enterprises, private enterprises will face greater credit financing constraints in their daily production and operation, and their financing costs are generally higher than state-owned enterprises. Therefore, when faced with credit financing support in TAP, private SMEs are more sensitive and play a more significant stimulating role. Although we still doubt that in this mechanism, state-owned listed companies still receive government credit policies, due to the long-standing “financial discrimination” problem, private listed companies are more flexible with this policy support.
In addition, we also test the robustness of the credit financing mechanism by changing the dependent variable. Columns (4) and (5) use the number of green invention patents applied for in the current year and the number of independent green patent applications in the current year as the dependent variables, and the estimated results of robustness testing according to the above model. In both test results, the coefficients are significantly positive at the 1% level, which indicates that under a variety of dependent variables that measure the level of green innovation, the credit financing mechanism is still significant, and the validation estimates are robust.
5.4 Market competition mechanism
TAP not only includes policy support such as government subsidies, tax incentives, and credit financing but also includes many policies to improve the environment and enhance market competitiveness, which provides us with the option of the last mechanism test, that is, the market competitiveness mechanism. We use the Herfindahl-Hirschman Index (HHI) of listed companies to measure the level of market competitiveness of enterprises (the higher the HHI value, the lower the market concentration and the worse the market competitiveness). Then, investigate whether the market competitiveness mechanism also plays a role in the process of TAP promoting green innovation of SMEs. To test the above mechanism, namely hypothesis H4, we constructed the following model:
Theoretically, the lower the HHI value of the listed company, the better the market concentration measurement index, the higher the actual competitiveness level, the greater the operating income of the enterprise, and then indirectly promotes the green innovation process of the enterprise, so the multiplier coefficient should be negative. The estimated results are shown in Table 8. Columns (1)–(3) are the estimated results of the overall sample, the state-owned listed company sample, and the private listed company sample. The results show that the three
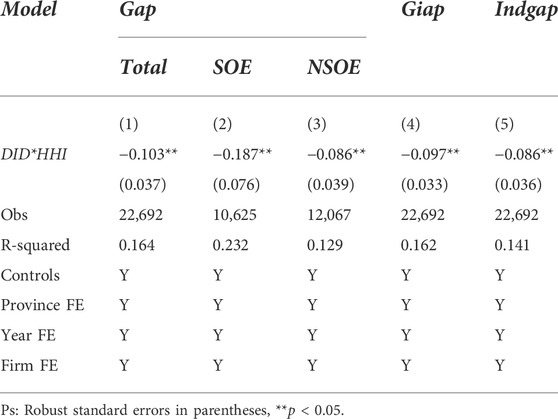
TABLE 8. Market competition mechanism estimation results.
It is different from the results of Yu et al. (2016) on the test of market competitiveness mechanisms in industrial policy and enterprise innovation, that is, compared with private enterprises, state-owned enterprises are more likely to gain more market competitiveness, which is more in line with China’s actual national conditions. In addition, we also test the robustness of the market competitiveness mechanism by changing the dependent variables. Columns (4) and (5) take the number of green invention patents applied for in the current year and the number of independent green patent applications in the current year as the dependent variables, and the estimated results of the robustness test according to the above model. In both test results, the
6 Heterogeneity analysis
6.1 Patent type heterogeneity
The green patents of listed companies are mainly divided into two categories: green invention patents and green utility model patents. Based on the benchmark model, we conduct a heterogeneity analysis of policy effects according to patent types and investigate the heterogeneity of the green innovation effect of TAP in terms of green patent types, and the estimated results are shown in Table 9.
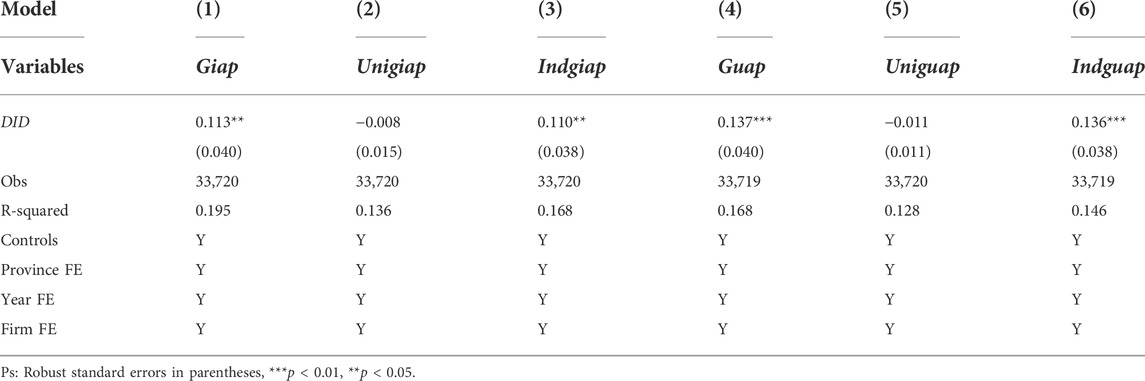
TABLE 9. Patent type heterogeneity estimation results.
In Table 9, columns (1)–(3) are the estimated results of the number of green invention patents applied for in the year, the number of green invention patents applied for jointly in the year, and the number of green invention patents applied for independently in the year as dependent variables. The estimation results show that the estimated coefficients of Giap and Indgiap are significantly positive at the 5% confidence level, which means that the specialization feature policy significantly promotes the number of green invention patents applied by small and medium-sized board listed companies and the green invention patents applied for independently, but the level of green invention patents applied for jointly is not significantly affected.
Columns (4)–(6) are the estimated results of the number of green utility model patents applied for in the year, the number of green utility model patents applied for jointly in the year, and the number of green utility model patents applied for independently in the year as the dependent variable. The estimation results show that the estimated coefficients of Guap and Indguap are significantly positive at the 1% confidence level. It means that the specialization feature policy significantly promotes the number of green utility model patents applied for by listed companies on the small and medium-sized boards and the green utility model patents applied for independently, but the level of green utility model patents applied for jointly has not been significantly affected.
This result shows that the green invention patents and green utility model patents independently applied for by SMEs listed companies are the keys for TAP to promote the green innovation of SMEs, while the two types of green patents jointly applied for do not show significant policy influence.
6.2 Ownership heterogeneity
China is a typical economy where the government intervenes in the economy, and the owner’s attribute is an important factor affecting the business development of enterprises. In addition, TAP is an important tool for the Chinese government to stimulate the transformation of SMEs into technologically advanced high-quality development. State-owned enterprises and private enterprises may enjoy different “treatments” in the face of specific stimulus tools introduced by the government. Therefore, we performed estimation analyses of all fabrications as significant sources of heterogeneity. Referring to the research of Jiang (2022), we construct a DDD estimation model to investigate whether TAP will have a heterogeneous green innovation effect on different types of listed companies. This model can not only directly show the difference in the policy effect coefficient between the state-owned and private groups, but can also be realized by testing HSOE:
The estimated results are shown in Table 10. Columns (1)–(3) take the total number of green patents applied for in the year, the number of green patents applied for independently in the year, and the number of green invention patents applied for in the year as dependent variables, respectively, and the estimated results of the policy effects of different ownership attributes. The results show that the policy effect coefficients of state-owned listed companies are larger than those of private listed companies under the three dependent variables, and all three HSOE:
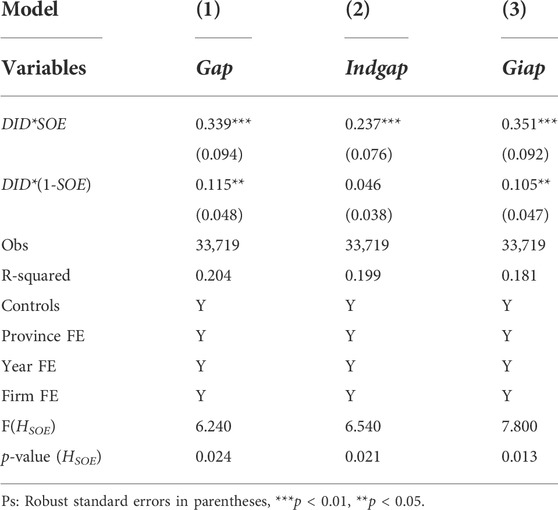
TABLE 10. Ownership heterogeneity estimation results.
For this difference in policy effects, the general explanation is that private enterprises are subject to “policy discrimination” in similar policies. Policy implementation and management units are more inclined to allocate policy resources to state-owned economic entities, and it is difficult for private economic entities to enjoy the same “policy treatment” as state-owned entities, which is closer to China’s actual national conditions.
6.3 Regional heterogeneity
Previous studies have shown that the policy effects of the Chinese government often have significant spatial heterogeneity. On the one hand, there are significant differences in humanistic, economic, and social development between regions in China, and on the other hand, there are also significant differences (financial and administrative levels) between local governments at all levels. Therefore, we divided China into four parts, namely the northeastern region, the eastern region, the central region, and the western region, to investigate whether there is significant spatial heterogeneity in the TAP effect. The estimated results are shown in Table 11:

TABLE 11. Regional heterogeneity estimation results.
Columns (1)–(4) are the estimation results for the eastern, northeastern, central, and western regions, respectively. The DID term coefficients in the eastern, central, and western regions are significantly positive at the levels of 1%, 10%, and 1% respectively, which indicates that the TAP in these three regions has played a policy effect in promoting green innovation of SMEs. However, the coefficient of DID term in Northeast China is not significant, indicating that TAP in this region does not play a significant role in green innovation. In addition, in the three regions where the policy effect is significantly positive, the DID term coefficient presents the ordering feature of “Western > Eastern > Central".
We believe that the possible reason is that the eastern and central regions are relatively developed regions of China’s market economy and have the vast majority of SMEs in China. Before the central government issued stimulus policies, local governments had built a relatively free and open market environment. However, the western region and the northeastern region are “heavy” state-owned economic regions, and the thought of a state-owned economy is deeply rooted in the hearts of the people. The development of SMEs lags far behind that of the eastern and central regions. When the central government introduced policies to stimulate the green innovation of SMEs, for the northeast and western regions where the development of SMEs was seriously lagging, the policy stimulus is more flexible, but due to the unspoken financial rule of “Investment does not go beyond Shanhaiguan”, it is difficult for SMEs in Northeast China to obtain financial support from capital within the customs. Therefore, the policy effects are more significant in the western region, however, not significant in the northeast region.
7 Conclusion and recommendation
Green innovation is the core concern of green development in the new development concept of the Chinese government, and an important starting point for the Chinese government to deal with climate change and environmental pollution. TAP is an important policy of the Chinese government trying to achieve “technologically advanced” development of SMEs and achieve high-quality development under the background of the new development concept. By taking “Guiding Opinions on Promoting the Development of Technologically Advanced Small and Medium-sized Enterprises” as the policy entry point, manually collecting and matching to get the green patent data of listed companies from 2004 to 2021, and applying the multi-dimensional fixed-effects DID model, we empirically investigate the effects, mechanisms, and heterogeneity of TAP on green innovation in SMEs for the first time. The estimation results found that TAP can significantly improve green innovation in SMEs. It enriches the literature on the influencing factors of SMEs’ green innovation and is consistent with other research conclusions on the promotion of green innovation by other policies (Bai et al., 2019; Xia et al., 2022; Zhu and Tan, 2022). Furthermore, based on Yu et al. (2016), we examined the mechanism of TAP’s role in promoting green innovation of SMEs from four aspects: government subsidy, tax reduction, credit financing, and market competition. The results demonstrated that state-owned SMEs have significant advantages in the government subsidy mechanism, and private SMEs have prominent advantages in the credit financing mechanism. This result is consistent with existing relevant research conclusions, that is, compared with private enterprises, state-owned enterprises are more likely to obtain government policy inclination and financial support (Li and Zheng, 2016). Private SMEs are more constrained by credit financing, so when faced with credit financing support in TAP, private SMEs are more sensitive and play a more significant role in stimulating (Yu et al., 2016; Xu and Cui, 2020). At the same time, different from the conclusion of Yu et al. (2016), our research results found that state-owned SMEs also have significant advantages in the two mechanisms of tax incentives and market competitiveness, that is, compared with private enterprises, state-owned enterprises are more likely to obtain preferential government tax policies and more market competitiveness blessings, which is also more in line with China’s actual national conditions. In addition, policy effects show significant heterogeneity in policy types, enterprise ownership attributes, and regional levels.
Although this research provided some valuable findings and enlightenment for the research in the field of TAP on SMEs’ green innovation, it inevitably has certain limitations. First of all, our research only considers the policy effects of China’s TAP on SMEs’ green innovation and does not analyze the policy effects of similar TAPs in other countries or regions, which makes the research conclusions limited in scope. Secondly, although we pointed out that state-owned enterprises received more policy support in the TAP, we did not conduct a more in-depth analysis of the possible reasons behind it. For example, whether there is corruption leading to this policy outcome. In this regard, future research can try to improve on the following aspects: Firstly, follow-up research can try to include the relevant policies of other emerging market economies and developed countries or regions, and to analyze and compare the effects of TAP policies in China, then can comprehensively examine the regional differences in the effects of major TAP policies. Secondly, the heterogeneity analysis can be carried out from the perspectives of the regional marketization index, government-business relationship, and the corruption of regional officials to deeply analyze the deep-seated reasons for the phenomenon of “state-owned enterprise inclination” and “private discrimination”.
In conclusion, the TAP of the Chinese government has achieved the goal of promoting green innovation and the development of SMEs from the perspective of policy objectives. However, there are still some problems with the existing policy measures in practice. From the empirical results of this study, it can be seen that the existing TAP effect has a significant policy preference for state-owned SMEs, and the “policy discrimination” suffered by private SMEs cannot be ignored. Accordingly, we propose the following policy recommendations: ①The government should continue and increase policy efforts in areas related to financial subsidies, tax incentives, credit financing, and the construction of a competitive market environment, pay attention to the evaluation of policy implementation effects and find a balance between policy practice and policy evaluation, which can better promote the development of SMEs. ②Pay attention to the development of private SMEs, analyze the root causes of the “policy discrimination” (“financial discrimination”) that private SMEs generally suffer in policy support, try to increase the policy preference for private SMEs in the future TAP reform, and improve the green innovation and development capabilities of private SMEs from the perspective of marketization. ③Pay attention to the influence of regional heterogeneity on the TAP effect, and effectively improve the spatial allocation efficiency of China’s central and local TAP resources through “city-specific policies".
Data availability statement
The raw data supporting the conclusion of this article will be made available by the authors, without undue reservation.
Author contributions
Conceptualization, GC, DH; methodology, GC; software, GC; validation, GC, DH; formal analysis, GC, DH; data curation, GC, DH; writing—original draft preparation, GC; writing—review and editing, GC; visualization, GC, DH; supervision, GC; project administration, GC, DH; funding acquisition, GC, DH. All authors have read and agreed to the published version of the manuscript.
Funding
We acknowledge the financial support from the Shenzhen Philosophy and Social Sciences Planning 2020 Project (No. SZ2020B012), and the Characteristic Innovation Project of General Colleges and Universities in Guangdong Province (No. 2020WTSCX237), Guangdong philosophy and Social Sciences Planning 2021 youth project (No. GD21YGL03). Sponsored by Guangdong Modern Industry & SME Development Research Center. All errors remain our own.
Conflict of interest
The authors declare that the research was conducted in the absence of any commercial or financial relationships that could be construed as a potential conflict of interest.
Publisher’s note
All claims expressed in this article are solely those of the authors and do not necessarily represent those of their affiliated organizations, or those of the publisher, the editors and the reviewers. Any product that may be evaluated in this article, or claim that may be made by its manufacturer, is not guaranteed or endorsed by the publisher.
References
An, T., Xu, C., and Liao, X. (2021). The impact of FDI on environmental pollution in China: Evidence from spatial panel data. Environ. Sci. Pollut. Res. 28 (32), 44085–44097. doi:10.1007/s11356-021-13903-9
Bai, Y., Song, S., Jiao, J., and Yang, R. (2019). The impacts of government R&D subsidies on green innovation: Evidence from Chinese energy-intensive firms. J. Clean. Prod. 233, 819–829. doi:10.1016/j.jclepro.2019.06.107
Card, D. A. D., and Krueger, A. B. (1994). Minimum wages and employment: A case study of the fast-food industry in New Jersey and Pennsylvania[J]. Am. Econ. Rev. 84 (4), 772–793.
Chen, L., and Yang, W. (2019). R&D tax credits and firm innovation: Evidence from China. Technol. Forecast. Soc. Change 146, 233–241. doi:10.1016/j.techfore.2019.05.018
Dai, R., Feng, H., Hu, J., Jin, Q., Li, H., Wang, R., et al. (2021). The impact of COVID-19 on small and medium-sized enterprises (SMEs): Evidence from two-wave phone surveys in China. China Econ. Rev. 67, 101607. doi:10.1016/j.chieco.2021.101607
Deschênes, O., Greenstone, M., and Shapiro, J. S. (2017). Defensive investments and the demand for air quality: Evidence from the NOx budget program. Am. Econ. Rev. 107 (10), 2958–2989. doi:10.1257/aer.20131002
Dong, Z. Y., and Li, C. M. (2021). The high-quality development trend and path choice of the superior small and Medium-sized enterprises[J]. Reform 10, 1–11.
Du, L., Lin, W., Du, J., Jin, M., and Fan, M. (2022). Can vertical environmental regulation induce enterprise green innovation? A new perspective from automatic air quality monitoring station in China. J. Environ. Manag. 317, 115349. doi:10.1016/j.jenvman.2022.115349
Ge, W., Deng, L., Wang, F., and Han, J. (2021). Quantifying the contributions of human activities and climate change to vegetation net primary productivity dynamics in China from 2001 to 2016. Sci. Total Environ. 773, 773145648. doi:10.1016/j.scitotenv.2021.145648
Goodman-Bacon, A. (2021). Difference-in-differences with variation in treatment timing. J. Econ. 225 (2), 254–277. doi:10.1016/j.jeconom.2021.03.014
Han, J. (2022). Promoting the sustainable and healthy development of "specialized, specialized, and new" small and medium-sized enterprises [J]. People's Trib. 2022 (07), 90–93.
Hu, G., Wang, X., and Wang, Y. (2021). Can the green credit policy stimulate green innovation in heavily polluting enterprises? Evidence from a quasi-natural experiment in China. Energy Econ. 98, 105134. doi:10.1016/j.eneco.2021.105134
Huang, D., and Chen, G. (2022). Can the carbon emissions trading system improve the green total factor productivity of the pilot cities?-A spatial difference-in-differences econometric analysis in China. Ijerph 19 (3), 1209. doi:10.3390/ijerph19031209
Iqbal, S., Akhtar, S., and Anwar, F. (2021). Linking green innovation performance and green innovative human resource practices in SMEs; a moderation and mediation analysis using PLS-SEM[J]. Curr. Psychol., 1, 18.
Jia, C., Tang, X., and Kan, Z. (2020). Does the nation innovation system in China support the sustainability of small and medium enterprises (SMEs) innovation? Sustainability 12 (6), 2562. doi:10.3390/su12062562
Jiang, T. (2022). Mediating effects and moderating effects in causal inference[J]. China Ind. Econ. 2022 (5), 100–120.
Li, J. H. (2021). The situation and outlet of the development of China's "little giant. Enterp. 10, 101–113.
Li, Q., and Wang, D. H. (2022). Fiscal and tax policies to support the innovation of small, medium and micro enterprises and their reference [J]. Res. Financial Econ. Issues 2022 (03), 72–82. doi:10.19654/j.cnki.cjwtyj.2022.03.008
Li, W. J., and Zheng, M. N. (2016). Is it substantive innovation or strategic innovation? ———impact of macroeconomic policies on micro-enterprises' innovation[J]. Econ. Res. J. 51 (04), 60–73.
Liu, J., and Xiao, Y. Y. (2022). China's environmental protection tax and green innovation: Incentive effect or crowding-out effect?[J]. Econ. Res. J. 57 (01), 72–88.
Min, Z., Sawang, S., and Kivits, R. A. (2021). Proposing circular economy ecosystem for Chinese SMEs: A systematic review. Ijerph 18 (5), 2395. doi:10.3390/ijerph18052395
Qi, S. Z., Lin, Q., and Cui, J. B. (2018). Do environmental rights trading schemes induce green innovation? Evidence from listed firms in China[J]. Econ. Res. J. 53 (12), 129–143.
Sizhen, P., Yan, L., Han, S., and Ping, Z. (2005). Studies on barriers for promotion of clean Technology in SMEs of China. Chin. J. Popul. Resour. Environ. 3 (1), 9–17. doi:10.1080/10042857.2005.10677398
Su, C. W., Li, W., Umar, M., and Lobonţ, O.-R. (2022). Can green credit reduce the emissions of pollutants? Econ. Analysis Policy 74, 205–219. doi:10.1016/j.eap.2022.01.016
Wang, R., and Kesan, J. P. (2022). Do tax policies drive innovation by SMEs in China? J. Small Bus. Manag. 60 (2), 309–346. doi:10.1080/00472778.2019.1709381
Wang, S., Chen, G., and Han, X. (2021). An analysis of the impact of the emissions trading system on the green total factor productivity based on the spatial difference-in-differences approach: The case of China. Ijerph 18 (17), 9040. doi:10.3390/ijerph18179040
Wang, X., and Wang, Y. (2021). Research on the green innovation promoted by green credit policies. [J]Journal Manag. World 37 (06), 173–188+11. doi:10.19744/j.cnki.11-1235/f.2021.0085
Xia, L., Gao, S., Wei, J., and Ding, Q. (2022). Government subsidy and corporate green innovation - does board governance play a role? Energy Policy 161, 112720. doi:10.1016/j.enpol.2021.112720
Xu, J., and Cui, J. B. (2020). Low-carbon cities and firms' green technological innovation [J]. China Ind. Econ. 12, 178–196. doi:10.19581/j.cnki.ciejournal.2020.12.008
Yu, J., and Fu, J. (2021). Credit rationing, innovation, and productivity: Evidence from small- and medium-sized enterprises in China. Econ. Model. 97, 220–230. doi:10.1016/j.econmod.2021.02.002
Yu, M. G., Fan, R., and Zhong, H. J. (2016). China's industrial policy and enterprise technological innovation[J]. China Ind. Econ. 12, 5–22. doi:10.19581/j.cnki.ciejournal.2016.12.002
Yuan, B., Li, C., Yin, H., and Zeng, M. (2022). Green innovation and China's CO2 emissions - the moderating effect of institutional quality. J. Environ. Plan. Manag. 65 (5), 877–906. doi:10.1080/09640568.2021.1915260
Zhang, B., Argheyd, K., Molz, R., and He, B. (2021). A new business ecosystem for SMEs development in China: Key-node industry and industrial net. J. Small Bus. Manag. 1, 31. doi:10.1080/00472778.2021.1970174
Zhang, F., Wang, Z. Q., and Yu, X. Y. (2022). Government support and the“Specialized and New”Transformation of SMEs——empirical evidence from quantifying provincial policy texts[J]. Finance Econ. 1, 116–132.
Zhao, J., Zhao, Z., and Zhang, H. (2021). The impact of growth, energy and financial development on environmental pollution in China: New evidence from a spatial econometric analysis. Energy Econ. 93, 104506. doi:10.1016/j.eneco.2019.104506
Zheng, Y., Li, C., and Liu, Y. (2021). Impact of environmental regulations on the innovation of SMEs: Evidence from China. Environ. Technol. Innovation 22, 101515. doi:10.1016/j.eti.2021.101515
Zhou, M., Govindan, K., Xie, X., and Yan, L. (2021). How to drive green innovation in China's mining enterprises? Under the perspective of environmental legitimacy and green absorptive capacity. Resour. Policy 72, 102038. doi:10.1016/j.resourpol.2021.102038
Zhu, Y., Wittmann, X., and Peng, M. W. (2012). Institution-based barriers to innovation in SMEs in China. Asia Pac J. Manag. 29 (4), 1131–1142. doi:10.1007/s10490-011-9263-7
Keywords: technologically advanced policy (TAP), small and medium-sized enterprises (SMEs), green innovation, difference-in-differences (DID), government subsidy, tax reduction, credit financing, market competition
Citation: Huang D and Chen G (2022) Can the technologically advanced policy achieve green innovation of small and medium-sized enterprises?—The case of China. Front. Environ. Sci. 10:964857. doi: 10.3389/fenvs.2022.964857
Received: 09 June 2022; Accepted: 25 July 2022;
Published: 25 August 2022.
Edited by:
Mihaela Onofrei, Alexandru Ioan Cuza University, RomaniaReviewed by:
Ionel Bostan, Ștefan cel Mare University of Suceava, RomaniaGheorghita Dinca, Transilvania University of Brașov, Romania
Copyright © 2022 Huang and Chen. This is an open-access article distributed under the terms of the Creative Commons Attribution License (CC BY). The use, distribution or reproduction in other forums is permitted, provided the original author(s) and the copyright owner(s) are credited and that the original publication in this journal is cited, in accordance with accepted academic practice. No use, distribution or reproduction is permitted which does not comply with these terms.
*Correspondence: Gang Chen, MTNiOTU2MDA1QHN0dS5oaXQuZWR1LmNu