 Zhiting Sang1
 Yan Xu
94% of researchers rate our articles as excellent or good
Learn more about the work of our research integrity team to safeguard the quality of each article we publish.
Find out more
ORIGINAL RESEARCH article
Front. Environ. Sci. , 19 August 2022
Sec. Land Use Dynamics
Volume 10 - 2022 | https://doi.org/10.3389/fenvs.2022.964403
This article is part of the Research Topic Sustainable Cultivated Land Use and Management View all 18 articles
The sustainable development and utilization of sandy areas in arid and semiarid regions is of strategic importance to ensure both food and ecological security. The unique geographical environment of these areas and uncontrolled exploitation by farmers lead to large amounts of fragmented cropland. Despite government management, the quantity and distribution of these fragmented croplands is unknown, and accurate identification of the region’s fragmented croplands can provide data to support the sustainable use of sandy areas. We propose a method for identifying fragmented cropland based on scale transformation. Small-scale fragmented cropland is approximately represented at larger scales, so we apply small-scale high-resolution remote sensing images to identify features and obtain information at a large scale, i.e., the ratio of fragmented cropland area. By correcting the cropland areas identified from low-resolution remote sensing images and using them as the basis for the resulting calculation, more accurate identification can be 1 at a large scale. In this study, this method was applied based on remote sensing images with 0.54 and 30 m resolutions that were acquired during the same period, using Horqin Zuoyihou Banner as the study area. The results showed that (1) there was 13,637.08 hm2 of fragmented cropland in Horqin Zuoyihou Banner due to precipitation and terrain topography, mainly in the central and western regions and 2) identification at the sample point scale and plot scale were positively correlated in area and showed a consistent distribution. Therefore, accurate and efficient identification of fragmented cropland can be achieved through scale transformation.
A large amount of fragmented cropland exists in arid and semiarid sandy regions. In addition to natural land fragmentation due to the sandy terrain, the lack of effective regulation and planning has created a large amount of fragmented cropland due to disorderly development and replenishment of cropland (Tan et al., 2006; Zhao, 2011; Jia and Petrick, 2014). Arid and semiarid areas are not only important food production bases in China (Li et al., 2021), but also ecologically fragile areas (Huang et al., 2019; Xu et al., 2021). Facing the dual needs of food security and ecological safety, mapping the amount and distribution of fragmented cropland is the basis for making decisions on the consolidation and removal of cropland (Xiong et al., 2020; Vijay and Armsworth, 2021), and it will also support the sustainable use of sandy areas (Lyu et al., 2020; Wang et al., 2021). The identification of fragmented cropland, which covers a small area but is very common, is limited in many ways, and the quantity and spatial distribution of fragmented cropland are not yet known. Therefore, the efficient and accurate acquisition of information about the quantity and distribution of fragmented cropland on a large scale, as the basis of sustainable use studies and site-specific studies (Wan and Ceng, 2001; Ye et al., 2004; Matton et al., 2015; Lu et al., 2018), is a key issue in land cover identification and is one of the important research directions for research on land cover identification.
Current identification methods for land cover types fall into three broad categories. The first identification method is based on manual mapping and user experience (Zhang et al., 2014; Qu et al., 2021): objects are discriminated based on experience combined with field calibration. This method relies on the empirical knowledge of the researcher, and the identification results have relatively high accuracy but limited applicability and suitability for larger study areas.
The second method is based on existing data processing, which means that results are obtained by processing remote sensing images or existing datasets (Chen Yuanyuan et al., 2012; Ren Yang et al., 2020; Feng et al., 2017; Li et al., 2017; Xiong et al., 2017; Feng et al., 2018). For example, Milbrandt analyzed and summarized data from the USGS 2006 National Land Cover Database to obtain information on the amount and distribution of marginal lands in the United State (Milbrandt et al., 2014). Similarly, Xue used the summary statistics (analysis) tool in ArcGIS 10.1 to calculate the total area of each land type based on the 2000 1 km × 1 km gridded dataset from the Earth System Science Data Sharing Infrastructure (http://www.geodata.cn/) (Xue et al., 2016). Compared with the first method, this approach is not limited in its scope of application. However, the spatial resolution of the images used in large-scale datasets is too low to obtain accurate results when identifying small objects.
The third method uses layer-by-layer screening, that is, in a study area, screening is carried out sequentially one layer at a time by selecting indicators to exclude areas that do not meet search requirements to identify research objects (Du et al., 2020). Fang et al. adopted satellite images with a 30 m resolution to identify marginal land by selecting indicators such as land use type and land cover type and considering environmental impact (Wang and Shi, 2015). Alternatively, Ben et al. used ZY-3 3D land-cover products and the Chinese soil database to exclude land unsuitable for cultivation, conduct screening based on relevant indicators of land quality and crop environment, and finally identify urban marginal land (Zhang et al., 2021). This approach reduces the limitations of the second method, with which results with relatively low accuracy are produced. However, there are still shortcomings when identifying objects with unclear characteristics, which may result in objects being screened out mistakenly.
These findings indicate that results based on manual empirical identification are the most accurate when compared to other identification methods, but this method is limited by the size of the study area that can be addressed. The results achieved by processing existing data address the study area size limitation, but they are still limited by the classification and spatial resolution of the original dataset. For example, when identifying fragmented cropland, original datasets may not contain this land cover type, and the relatively low spatial resolution of the data does not allow the identification of fragmented cropland. Although the layer-by-layer screening method improves on the first two methods, identification of objects with this approach relies on restrictive conditions. Generally, this approach is suitable for identifying relatively obvious characteristics. For example, when identifying an object that is easily confused with other features, such as fragmented cropland, it is difficult to choose a suitable index and establish screening rules for identification.
At present, the identification of fragmented cropland is mainly restricted by the size of the study area, spatial resolution of remote sensing images and feature interpretation characteristics. Methods that provide accurate identification are used in small areas but the remote sensing images used in the methods applied to large areas have low resolution, resulting in less accurate results. Identification based on high-resolution remote sensing images over large scales also faces challenges when identifying features with nonspecific characteristics, such as fragmented cropland.
The main purpose of this study is to explore how to identify fragmented cropland with nonspecific characteristics over a large scale by combining remote sensing images with two resolutions. Specifically, we first select samples in the identification area, which is divided into several sample areas and sample points. Then, we identified areas of fragmented cultivated land by integrating the interpretation of the remote sensing images with different resolutions at different scales. This study can provide an effective measurement method for the identification of fine-grained cropland in arid and semiarid areas, and provide a valuable reference for other regions and countries in the world.
Horqin Left Rear Banner, Tongliao city, Inner Mongolia Autonomous Region, was selected as the study area. It is located between 121°30′-123°42′E and 42°40′-43°42′N. This area is found at the intersection of the Horqin Sandy and Songliao Plains and the intersection of the East and West Liao Rivers, where there is an alluvial plain accounting for less than 3% of the total area. Except for the alluvial plain at the intersection of the East and West Liao Rivers, the rest of the landform is composed of sand dunes and meadows. Horqin Left Rear Banner is located on the border of the mid-temperate and subhumid areas, with a temperate continental monsoon climate. The spatial distribution of precipitation in the area varies greatly. The average annual precipitation is 414.9 mm, and precipitation amounts large enough to support rain-fed agriculture is usually concentrated from May to September, accounting for approximately 85% of the total annual precipitation. In 2019, the GDP of this region was 12.2×10⁹ RMB, the per capita income of urban residents was 29,025 RMB, the per capita income of rural pastoral areas was 13,671 RMB, and the permanent population amounted to 401,100 people.
In general, the area of Horqin Zuoyihou Banner is large, and the landforms and precipitation in the eastern and western regions of the banner vary greatly. During the research process, it was found that the typical topography and precipitation conditions of Horqin Zuoyihou Banner led to a fine-grained distribution of some cropland in the banner and that there is a large amount of fragmented cropland, making it an ideal study area for this study.
The data used in this study are mainly two contemporaneous remote sensing images of Horqin Left Rear Banner with different resolutions acquired by MapQuest: an image with a 0.54 m resolution acquired in 2021 and a remote sensing image with a 30 m resolution acquired in 2021. The 30 m resolution image was used for supervised classification in ENVI 5.3 to identify the cropland within the sample points and areas, and the 0.54 m resolution image was used for visual interpretation to identify the cropland within the sample points.
The method described in this paper is the identification of fragmented cropland based on scale transformation (IBST), that is, the distribution of cropland and fragmented cropland at a small scale is used to determine the distribution at a large scale, and the result is calculated based on cropland area weighting by obtaining the total cropland area in a large sample area. The key step is to identify all the cropland (including fragmented cropland) at the large scale and use it as a database for calculation. Therefore, we used the large-scale low-resolution identification data as the basis and adjusted the results according to the difference in the cropland area identified in the images with different resolutions to obtain an estimate of the total cropland at the large scale. We divided this method into three steps: 1) the construction of scale relationships and the establishment of sample points and sample areas, 2) the identification of cropland and fragmented cropland and 3) the calculation of fragmented cropland based on cropland area weighting (Figure 1).
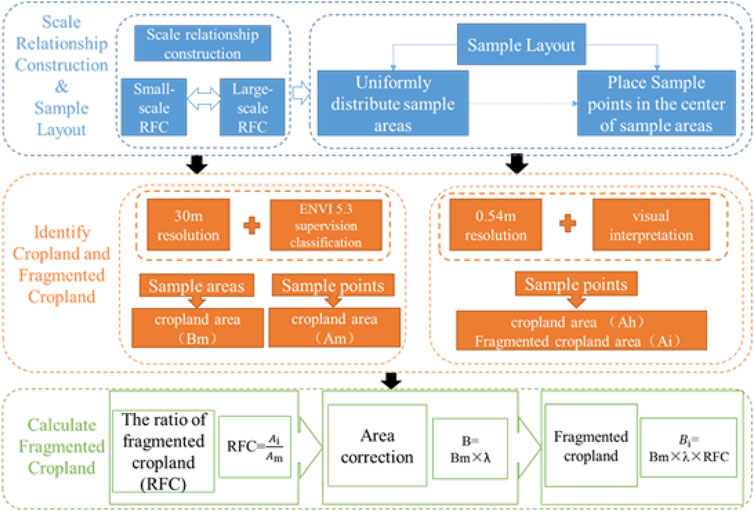
FIGURE 1. Research method framework.
There is some connection between the identification results at large and small scales within a given region (Tobler, 1970; Woodcock and Strahler, 1987; Xu et al., 2011; Wang and Shi, 2015; Wang et al., 2018; Ain and He, 2019), but the conversion between scales needs to be corrected according to the setting (Li et al., 2000; Zhu et al., 2018). We were able to extend patterns observed at smaller scales to larger scales, so the parameter ratio of fragmented cropland (RFC) was introduced to visualize the link between large and small scales, replacing the large scale with the ratio of fragmented cropland obtained from the small scale. Additionally, the parameter area correction coefficient λ was introduced to control the accuracy of the identification according to the setting.
To improve the accuracy of identification results over large areas, it is necessary to account for the scale conversion of subregions by establishing sample areas (unit level) and sample points (plot level) (Figure 2A). To reflect the differences and patterns in the distribution and number of recognition results, this method uses a uniform distribution of points to establish samples. The specific steps for establishing sample points and sample areas are as follows (Figure 2B).
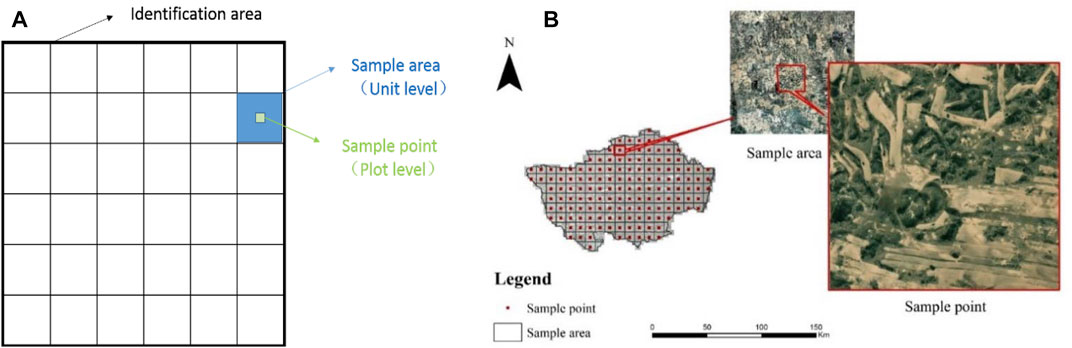
FIGURE 2. Diagram of the sample layout. (A) Scale construction; (B) sample layout.
After creating a 9 km × 9 km grid for uniform distribution, 144 sample areas covering the grid were selected in the Horqin Left Rear Banner, and a 1 km × 1 km sample point was selected in the center of each sample area. The distribution of identification targets within the sample points represents the distribution within the sample areas where they are located.
The main target of identification in this study was fragmented cropland, namely, cropland in woodland, grassland or intermountain zones that is sporadically cultivated. These areas are small (not identifiable in low- and moderate-resolution images but identifiable in high-resolution images; absolute area <2 ha) and varied in shape (mostly narrow or curved, multilateral, irregular plots). We found that most of the fragmented cropland is located next to large areas of cropland (cropland identified by low- and moderate-resolution images with absolute area ≥2 ha), and the area and distribution of large cropland can be used as a reference for determining the area and distribution of fragmented cropland. Thus, the identification of cropland based on low- and moderate-resolution remote sensing images at large scales can be used as the basis for scale transformation calculations.
Identification was performed in two steps. The first step was the identification of cropland and fragmented cropland within the sample points using high-resolution imagery. Based on the remote sensing images with a 0.54 m resolution, the areas of cropland and fragmented cropland within the sample points were obtained by visual interpretation. Through this process, we were able to accurately identify the cropland and fragmented cropland within the sample points, and these data were then used to calculate the RFC.
The second step was to identify cropland within the sample points and sample areas using moderate-resolution imagery. Based on the 30 m resolution images, the supervised classification tool in ENVI 5.3 was used to identify the cropland within each sample point and sample area. Through this process, we were able to identify the area of cropland in each sample point and sample area. The area of cropland within each sample point was used to calculate the area correction coefficient λ for the sample area in which it was located, and the area of cropland within the sample area was the basis for the scale transformation.
The calculation of the area of fragmented cropland was divided into three main steps. The first step was to calculate the RFC within each sample point. The RFC is the proportion of fragmented cropland to all the cropland within the sample point. Based on the assumptions of the scale transformation, the RFC within a sample point could be replaced with the RFC within the sample area, thus obtaining the actual RFC within the sample area. The RFC was calculated as
where Ai is the area of fragmented cropland within the ith sample point identified using the image with a 0.54 m resolution and Ah is the area of all the cropland within the ith sample point identified using the image with a 0.54 m resolution.
The second step is the cropland area correction in each sample area. To correct the cropland area within a sample area, the area correction coefficient λ for that sample area was first obtained. We assume that the difference in image recognition results between the two accuracies at the sample point scale can still be reflected at the sample area scale. Based on this assumption, we constructed the area correction coefficient λi for the ith sample area based on the proportion of the area of large cropland plots (excluding fragmented cropland) identified from the images with two resolutions within the sample points. λi is calculated as
where Am is the area of cropland within the ith sample point identified using remote sensing images with a 30 m resolution.
After obtaining the area correction coefficient of the sample area, we multiplied by the area of cropland within the sample area (Bm) to obtain the approximate total cropland area within the sample area (B). B is calculated as
The third step is to calculate the area of fragmented cropland in each sample area and in the study area. By multiplying the approximate total cropland in the sample area by the RFC of the sample area, we obtained the fragmented cropland area of the sample area (Bi). Bi is calculated as
The total area of fragmented cropland in the study area can be obtained by summing the area of fragmented cropland in all the sample areas. C is calculated as
where C is the total area of fragmented cropland in the study area.
Among the 144 sample points selected, 73 did not contain fragmented cropland and these points were mostly distributed in the eastern part of Horqin Left Rear Banner, within a large area of farmland. A total of 71 sample points contained fragmented cropland, and the total area of fragmented cropland in the sample points fluctuated from 0.3056 hm2 to 24.3425 h m2; the total area of fragmented cropland in each sample point was 195.9035 hm2. Among the sample points, the largest total area of fragmented cropland within the sample points was found in central Horqin Zuoyihou Banner, while the minimum was found in western Horqin Zuoyihou Banner (Figure 3A). Among the sample points containing fragmented cropland, the range of cropland area within a 100 hm2 sample point was between 1.83 hm2 and 95.75 h m2, with the maximum value occurring in south-central Horqin Zuoyihou Banner and the minimum value being found in western Horqin Zuoyihou Banner (Figure 3B). The quantitative distribution of the cropland within the sample points tended to coincide with that of the fragmented cropland.
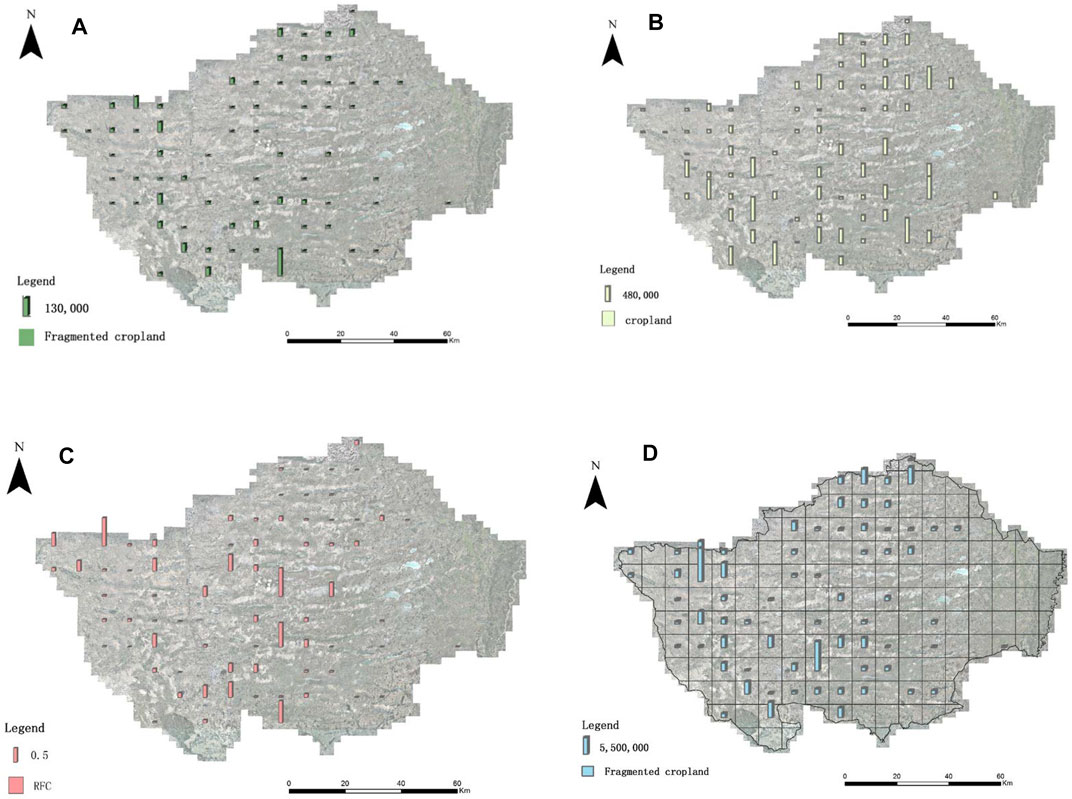
FIGURE 3. Identification results. (A) Area of fragmented cropland in the sample points; (B) area of cropland in the sample points; (C) RFC for each sample point; (D) area of fragmented cropland in the sample areas.
RFC reflects the degree of fragmentation of cropland in the sample points, and the larger the value is, the more fragmented the cropland in the sample points. RFC was divided into four cases: 1) there was no fragmented cropland, RFC was zero, and the percentage of finely fragmented cropland in a total of 73 sample points in Horqin Zuoyihou Banner was zero. 2) Only fragmented cropland was present, and RFC was equal to one; a total of two sample sites had an RFC of 1, and these sites were distributed in western and central Horqin Zuoyihou Banner. 3) In the case of small cropland area, the closer the RFC was to 1, the higher the degree of cropland fragmentation in the sample point; conversely, the closer the RFC was to 0, the lower the degree of cropland fragmentation. 4) In the case of larger cropland areas, the value of RFC was low; nevertheless, the closer the RFC was to 1, the higher the degree of cropland fragmentation in the sample points. Similarly, the closer the RFC was to 0, the lower the degree of cropland fragmentation in the sample points, which mostly occurred in southwestern Horqin Zuoyihou Banner.
Within the sample points where fragmented cropland exists, the RFC ranges between 0.004 and 1, with the highest value occurring in central and western Horqin Zuoyihou Banner and the smallest value occurring in eastern Horqin Zuoyihou Banner (Figure 3C). The RFC ranges from 0.005 to 0.036 in the eastern sample points, from 0.016 to one in the central sample points, and from 0.004 to one in the western sample points in Horqin Zuoyihou Banner. Overall, the degree of fine cropland fragmentation is low in the eastern part of Horqin Zuoyihou Banner and high in the central and western parts of Horqin Zuoyihou Banner.
The total area of fragmented cropland in Horqin Zuoyihou Banner is 13,637.08 h m2, the area of cropland is 293,145.54 h m2, and the fragmented cropland accounts for 4.65% of the cropland area. Currently, most of the fragmented cropland is not in the local governmental and national databases. In this study, a considerable amount of fragmented cropland was identified, and the compiled information on the distribution and quantity of these fragmented croplands provides support for cropland remediation and planning. In the sample area where the sample points with fragmented cropland exist, the total area of fragmented cropland ranges from 11.89 hm2 to 1108.80 h m2, and the maximum and minimum values are distributed in the western part of Horqin Zuoyihou Banner (Figure 3D). A comparison of the data revealed that the area of fragmented cropland at the sample points obtained based on the IBST method had a consistent distribution with the sample areas and that there was a positive correlation in quantity.
From east to west, the area and degree of fragmented cropland showed increasing trends, which is mainly caused by the topography of the area and distribution of water resources. The study area is characterized by high terrain in the west and low terrain in the east, and the topography redistributes water and heat so that less fragmented cropland exists in the flatter eastern region and more fragmented cropland exists in the central and western regions, which are interspersed with sand dunes and meadows. In addition, the eastern region is rich in water resources, and there are two rivers used for transit in the region (the Dongliao River and the Xiliao River), so the water resources required for cultivation are sufficient. Therefore, concentrated and continuous cropland is distributed in most of the eastern region, and the amount of fragmented cropland is very limited.
The fragmented cropland in Horqin Zuoyihou Banner accounts for 4.65% of the total cropland. Thus, the fragmented cropland occupies a large part of the cropland resources. The identification results obtained using the IBST method enabled us to determine the distribution and quantity of fragmented croplands, which provides a basis for estimating the carrying capacity of the land, availability of water resources and carrying out land remediation. Currently, arable land resources are limited, and fragmented cropland has become increasingly important in the integration and planning of cropland resources. Information on its quantity and distribution can also support the sustainable development of cropland in arid and semiarid areas with sandy land cover. In these situations, it is extremely important to perform highly precise identification over large areas.
The findings of this study show that IBST can efficiently and accurately identify fragmented cropland from a larger study area. To better understand this method, IBST was analyzed from two perspectives: the characteristics of the IBST method and the contribution of the IBST method to the existing identification methods.
One of the important features of the IBST method is that it introduces the concept of scale transformation, which enhances recognition efficiency. The accurate identification of the RFC at small scales is upscaled to large scales, simplifying identification at large scales. The second feature is that the IBST method corrects and controls results to improve the accuracy of the identification results. The IBST method introduces the area correction factor λ, which is an important parameter that corrects and controls the results according to the observed situation and improves the accuracy of the identification results.
The main contribution of this study is to introduce a new identification method using the idea of scale transformation so that the new method can complement existing identification methods. Existing identification methods seldom select identification targets with small areas, large quantities and unclear characteristics over large areas, and IBST provides a new approach to identifying such targets that takes into account efficiency and accuracy. The results of this study showed that this new approach is feasible and that IBST can effectively identify fragmented cropland over a large study area.
In this study, we applied the IBST method over a large scale and effectively used remote sensing images with two resolutions to create a new approach for the identification of irregular fragmented cropland with unclear characteristics. This article is mainly based on the idea that the patterns observed at small scales can be extended to large scales, and the IBST approach was proposed. We applied this method to Horqin Zuoyihou Banner. First, the study area was divided into 9 km × 9 km sample areas, and a 1 km × 1 km sample point was selected at the center of each sample area. Then, the high-resolution images were used to obtain the area of cropland and fragmented cropland within each sample point, from which the RFC was calculated. The area correction coefficient λ for each sample area was obtained using the difference between the two identification accuracies within the sample point for the results of large areas of cropland (excluding fine cropland). Finally, we corrected the area of cropland in each sample area obtained from the low-resolution images, calculated the area of fragmented cropland in each sample area by combining the corresponding RFCs, and summed the results to obtain the area of fragmented cropland in the whole study area. We found that the total area of fragmented cropland in Horqin Zuoyihou Banner is 13,637.08 h m2, the area of cropland is 293,145.54 h m2, and the fragmented cropland accounts for 4.65% of the cropland area.
In contrast to existing identification methods, the IBST method is a complement to existing identification methods. IBST is complementary to manual experience-based recognition, enabling the application of visual interpretation to a large study area. It can also improve the accuracy and efficiency of identification by combining existing data processing and layer-by-layer screening recognition methods.
The original contributions presented in the study are included in the article/Supplementary Material, further inquiries can be directed to the corresponding author.
YX and ZS designed the research; ZS wrote the main manuscript text; ZS, JL, and YL performed the data analysis and made figures and tables; ZS, HZ, KW, and YX provided conceptualization, investigation and methodology.
This research was funded by the Special Scientific Research of the Ministry of Land and Resources of China-Key Technology and Demonstration based on Protective Development of Sandy Land in Inner Mongolia (Grant Number 201411009) and the National Natural Science Foundation of China (Grant Number 41301614).
The authors declare that the research was conducted in the absence of any commercial or financial relationships that could be construed as a potential conflict of interest.
All claims expressed in this article are solely those of the authors and do not necessarily represent those of their affiliated organizations, or those of the publisher, the editors and the reviewers. Any product that may be evaluated in this article, or claim that may be made by its manufacturer, is not guaranteed or endorsed by the publisher.
Ain, Q., and He, J.-H. (2019). On two-scale dimension and its applications. Therm. Sci. 23, 1707–1712. doi:10.2298/tsci190408138a
Chen Yuanyuan, X. J., Li, J., Wang, Q., and Wang, X. (2012). Influence of the varied spatial resolution of remote sensing images on urban and rural residential information extraction. Resour. Sci. 34, 159.
Du, J., Quan, Z., Fang, S., Liu, C., Wu, J., Fu, Q., et al. (2020). Spatiotemporal changes in vegetation coverage and its causes in China since the Chinese economic reform. Environ. Sci. Pollut. Res. 27, 1144–1159. doi:10.1007/s11356-019-06609-6
Feng, Q., Chaubey, I., Cibin, R., Engel, B., Sudheer, K., Volenec, J., et al. (2018). Perennial biomass production from marginal land in the upper Mississippi river basin. Land Degrad. Dev. 29, 1748–1755. doi:10.1002/ldr.2971
Feng, Q., Chaubey, I., Engel, B., Cibin, R., Sudheer, K. P., Volenec, J., et al. (2017). Marginal land suitability for switchgrass, miscanthus and hybrid poplar in the upper Mississippi river basin (UMRB). Environ. Model. Softw. 93, 356–365. doi:10.1016/j.envsoft.2017.03.027
Huang, J., Ma, J., Guan, X., Li, Y., and He, Y. (2019). Progress in semi-arid climate change studies in China. Adv. Atmos. Sci. 36, 922–937. doi:10.1007/s00376-018-8200-9
Jia, L., and Petrick, M. (2014). How does land fragmentation affect off-farm labor supply: Panel data evidence from China. Agric. Econ. 45, 369–380. doi:10.1111/agec.12071
Li, C., Fu, B., Wang, S., Stringer, L., Wang, Y., Li, Z., et al. (2021). Drivers and impacts of changes in China’s drylands. Nat. Rev. Earth Environ. 2, 858–873. doi:10.1038/s43017-021-00226-z
Li, H., Wu, Y., Huang, X., Sloan, M., and Skitmore, M. (2017). Spatial-temporal evolution and classification of marginalization of cultivated land in the process of urbanization. Habitat Int. 61, 1–8. doi:10.1016/j.habitatint.2017.01.001
Li, X., Wang, J., and Strahler, A. (2000). Scale effects and scaling-up by geometric-optical model. Sci. China Ser. E-Technol. Sci. 43, 17–22. doi:10.1007/bf02916574
Lu, H., Xie, H., He, Y., Wu, Z., and Zhang, X. (2018). Assessing the impacts of land fragmentation and plot size on yields and costs: A translog production model and cost function approach. Agric. Syst. 161, 81–88. doi:10.1016/j.agsy.2018.01.001
Lyu, Y., Shi, P., Han, G., Liu, L., Guo, L., Hu, X., et al. (2020). Desertification control practices in China. Sustainability 12, 3258. doi:10.3390/su12083258
Matton, N., Canto, G. S., Waldner, F., Valero, S., Morin, D., Inglada, J., et al. (2015). An automated method for annual cropland mapping along the season for various globally-distributed agrosystems using high spatial and temporal resolution time series. Remote Sens. 7, 13208–13232. doi:10.3390/rs71013208
Milbrandt, A. R., Heimiller, D. M., Perry, A. D., and Field, C. B. (2014). Renewable energy potential on marginal lands in the United States. Renew. Sustain. Energy Rev. 29, 473–481. doi:10.1016/j.rser.2013.08.079
Qu, Y., Dong, X., Zhan, L., Zhu, W., Wang, S., Ping, Z., et al. (2021), Achieving rural revitalization in China: A suitable framework to understand the coordination of material and social space quality of rural residential areas in the plain. Growth and change.
Ren Yang, C. C., Liu, Y., and Hualou, L. (2020). Spatial-temporal characteristics of rural residential land use change and spatial directivity identification based on grid in the bohai rim in China. Geogr. Res. 34, 1077.
Tan, S., Heerink, N., and Qu, F. (2006). Land fragmentation and its driving forces in China. Land Use Policy 23, 272–285. doi:10.1016/j.landusepol.2004.12.001
Tobler, W. R. (1970). A computer movie simulating urban growth in the detroit region. Econ. Geogr. 46, 234. doi:10.2307/143141
Vijay, V., and Armsworth, P. (2021). in Proceedings of the national academy of sciences of the united states of america, Pervasive Cropland in Protected Areas Highlight Trade-Offs between Conservation and Food Security, 118.
Wan, G., and Cheng, E. (2001). Effects of land fragmentation and returns to scale in the Chinese farming sector. Appl. Econ. 33, 183–194. doi:10.1080/00036840121811
Wang, F., and Shi, X. (2015). Geospatial analysis for utilizing the marginal land in regional biofuel industry: A case study in guangdong province, China. Biomass Bioenergy 83, 302–310. doi:10.1016/j.biombioe.2015.10.005
Wang, S., Li, D., Li, T., and Liu, C. (2021). Land use transitions and farm performance in China: A perspective of land fragmentation. Land 10, 792. doi:10.3390/land10080792
Wang, X., Yu, D., Wang, C., Pan, Y., Pan, J., Shi, X., et al. (2018). Variations in cropland soil organic carbon fractions in the black soil region of China. Soil Tillage Res. 184, 93–99. doi:10.1016/j.still.2018.07.010
Woodcock, C. E., and Strahler, A. H. (1987). The factor of scale in remote sensing. Remote Sens. Environ. 21, 311–332. doi:10.1016/0034-4257(87)90015-0
Xiong, J., Thenkabail, P. S., Tilton, J. C., Gumma, M. K., Teluguntla, P., Oliphant, A., et al. (2017). Nominal 30-m cropland extent map of continental africa by integrating pixel-based and object-based algorithms using sentinel-2 and landsat-8 data on google Earth engine. Remote Sens. 9, 1065. doi:10.3390/rs9101065
Xiong, X., Hu, M., Wen, N., Liu, L., Xie, J., Lei, F., et al. (2020). Progress and prospect of cultivated land extraction research using remote sensing. J. Agric. Resour. Environ. 37, 856–865. (in Chinese).
Xu, L., Zheng, C., and Ma, Y. (2021). Variations in precipitation extremes in the arid and semi‐arid regions of China. Int. J. Climatol. 41, 1542–1554. doi:10.1002/joc.6884
Xu, N., Zhang, T., Wang, X., and Liu, H. (2011). Soil organic carbon storage changes in yangtze delta region, China. Environ. Earth Sci. 63, 1021–1028. doi:10.1007/s12665-010-0778-x
Xue, S., Lewandowski, I., Wang, X., and Yi, Z. (2016). Assessment of the production potentials of miscanthus on marginal land in China. Renew. Sustain. Energy Rev. 54, 932–943. doi:10.1016/j.rser.2015.10.040
Ye, G., Jiang, K., and Shi, J. (2004). Study on the consolidation potential of fragmentary land in farmland consolidation——cases study in yong chuan city, wan sheng district, Feng du xian, Wu Shan xian of chong qing city. China Land Sci., 33–38. ISBN 1001-8158. (in Chinese).
Zhang, B., Yang, J., and Cao, Y. (2021). Assessing potential bioenergy production on urban marginal land in 20 major cities of China by the use of multi-view high-resolution remote sensing data. Sustainability 13, 7291. doi:10.3390/su13137291
Zhang, B., Zhang, F., Gao, Y., Li, C., and Zhu, F. (2014). Identification and spatial differentiation of rural settlements' multifunction. Trans. Chin. Soc. Agric. Eng. 30, 216–224. (in Chinese).
Zhao, K. (2011). Land fragmentation and its quantitative measurement method. China Land Sci. 25, 35–39+88. (in Chinese).
Keywords: fragmented cropland, arid and semiarid areas, sandy land, scale transformation, identification method
Citation: Sang Z, Liang J, Zheng H, Wang K, Xu Y and Liu Y (2022) Identification of fragmented cropland in arid and semiarid sandy areas: a case study of horqin left rear banner. Front. Environ. Sci. 10:964403. doi: 10.3389/fenvs.2022.964403
Received: 08 June 2022; Accepted: 28 June 2022;
Published: 19 August 2022.
Edited by:
Jinlong Gao, Nanjing Institute of Geography and Limnology (CAS), ChinaReviewed by:
Fei Guo, Nanjing Normal University, ChinaCopyright © 2022 Sang, Liang, Zheng, Wang, Xu and Liu. This is an open-access article distributed under the terms of the Creative Commons Attribution License (CC BY). The use, distribution or reproduction in other forums is permitted, provided the original author(s) and the copyright owner(s) are credited and that the original publication in this journal is cited, in accordance with accepted academic practice. No use, distribution or reproduction is permitted which does not comply with these terms.
*Correspondence: Yan Xu, eHlhbkBjYXUuZWR1LmNu
Disclaimer: All claims expressed in this article are solely those of the authors and do not necessarily represent those of their affiliated organizations, or those of the publisher, the editors and the reviewers. Any product that may be evaluated in this article or claim that may be made by its manufacturer is not guaranteed or endorsed by the publisher.
Research integrity at Frontiers
Learn more about the work of our research integrity team to safeguard the quality of each article we publish.