 Zhanglan Wu
 Yantao Su
 Mingliang Xiong1
- 1School of Economics and Management, Huizhou University, Huizhou, China
- 2College Physics Teaching and Experiment Center, Shenzhen Technology University, Shenzhen, China
The Guangdong-Hong Kong-Macao Greater Bay Area (GBA) is one of the fastest growing and most dynamic regions in China. Changes in land comprehensive carrying capacity (LCCC) is of vital significance. In China, various studies have assessed LCCC, however, they majorly focused on single cities, with less studies focusing on urban agglomeration, particularly GBA. Based on social, economic, resource and technology aspects, we established an index system for evaluating LCCC by the entropy method. It analyses temporal and spatial evolution characteristics of LCCC from 11 cities in the GBA of China, 2009–2018. There are many social, economic, resource and technology differences among the 4 subsystems. We established that technology is the prominent factor in LCCC. With regards to LCCC, these cities have their respective strengths and weaknesses. On a temporal basis, there were rising trends in LCCC curves, with different degrees of the 11 cities. Spatially, LCCC is relatively high in central cities and it exhibits a declining pattern of the carrying capacity from the city center outwards. Therefore, regional collaborative efforts are vital for increasing LCCC.
Introduction
Since the reforms and opening up in 1978, China is experiencing unprecedented urbanization and rapid economic development. With regards to growth in size and complexity, cities are often compared to organisms, whereby during transition from infancy to adulthood, urban agglomerations undergo important and decisive maturing changes. The Guangdong-Hong Kong-Macau Greater Bay Area is also referred to as the Greater Bay Area (GBA). Comparatively, GBA is the largest and most populous bay area in the world. Due to its good economic growth, continually improving infrastructure, well-educated population and vast human resources, it is an ideal place for developing and implementing smart cities (SC). Cities in GBA give full play to their competitive advantages and continuously introduce new technologies, especially in artificial intelligence, robotics, biomedicine and healthcare technologies. AI (Artificial Intelligence) and IoT (Internet of Things) make it possible to create a digital architecture of a city to maintain health at the population level. A growing body of studies have used AI technology to analyze the spatiotemporal variation of each research object (Ghahramani et al., 2018; Ghahramani et al., 2021). Abstract digital technology plays an important role in achieving many of the sustainable development goals (Jones et al., 2017). These sectors play an active role in smart and sustainable urban development solutions (Zhang et al., 2016).
GBA encompasses 11 cities, including Guangzhou, Shenzhen, Zhuhai, Foshan, Dongguan, Zhongshan, Jiangmen, Huizhou, Zhaoqing, Hong Kong and Macau. Guangzhou, Shenzhen and Hong Kong are world-famous metropolises. The GBA is the largest and most economically developed area in South China. In 2020, the total GDP of GBA was US$1,806.6 billion, equivalent to 12% of mainland China’s GDP, making it the 12th largest economy in the world (Shi et al., 2018). As one of the most vibrant regions under “one country, two systems” in China, GBA exhibits some special demographic features. The GBA hosts 20 of China’s Fortune 500 companies, has the highest concentration in China, and hosts China’s most innovative technology companies, such as Huawei, ZTE, and DJI. Moreover, it has a rich ecosystem of startups, incubators, and accelerators in areas of agile tech, biotech, health tech and innovation. Generally, GBA is one of the most successful and dynamic economies, an emerging Silicon Valley in Asia (Yang et al., 2019).
Outline development plan for GBA is a national development strategy. The plan proposes that GBA will become a dynamic world-class urban agglomeration, an innovation and technology center with a global influence, an important support for the “Belt and Road” initiative, a display board for in-depth cooperation between the mainland and Hong Kong, and Macau. The GBA, a newly developed comprehensive economic and business district in China, has a population of 69 million (Leung et al., 2020). This population is estimated to grow to between 100 and 140 million (10% of China’s total population) by 2050, making GBA one of the largest metropolitan areas in the world. Globally, urbanization is a major issue (McKinney et al., 2006; Dobbs et al., 2011). With GBA’s rapid urbanization, challenges associated with land comprehensive carrying capacity (LCCC) have increased. These challenges include resource shortage, ecological pollution, population congestion, and traffic congestion. Once LCCC of a particular city is overloaded, sustainability of that city is compromised (Kluger et al., 2016; Ress et al., 1996). During urbanization, overload of LCCC is an urgent problem that should be solved (Oh et al., 2005; Wei et al., 2015; Wei et al., 2016; Chapman et al., 2018). In pursuit of sustainable urbanization, LCCC has been widely used to assess the effectiveness of resource management, urban planning and many other social activities (Gilandeh et al., 2018; Byron et al., 2011; Jia et al., 2018). Due to the ever-increasing population growth in GBA, the situation is worsening, which may threaten its sustainable development. Variations in carrying capacities are attributed to various factors, including technology, production and consumption structures (Arrow et al., 1995; Daily et al., 1996; Graymore et al., 2010). Therefore, evaluating the evolution of LCCC informs to what extent LCCC is overloaded in the process of urbanization. Nowadays, sustainable development of GBA and its related ecological environment, economy and resources have become focal areas of the community.
LCCC has become a major issue in environmental science research and policy. A lot of work has been done in this field during the last decades, but studies on Chinese urban agglomeration are limited. In particular, there is a lack of spatio-temporal analysis. Urban agglomerations are one of the main drivers of regional economic growth. Urban growth offers cities with more economic and social opportunities, but there are also many adverse effects, such as air and water pollution among others (Grimm et al., 2008; Al et al., 2012). With the growing human population and rising demand for energy, there is a great challenge to GBA. LCCC refers to the number of people in a region that can be sustained and the level of human activities that cannot cause land degradation (Ma et al., 2017). To protect the ecological environment from damage, urban development must be controlled in the LCCC (Fedor et al., 2019; Graymore et al., 2010). Therefore, it is essential to evaluate LCCC characteristics of GBA. Recently, many studies have evaluated the LCCC in China, but they have majorly focused on single cities, with less studies focusing on urban agglomeration, particularly the GBA. An increasing number of studies have been focused on the development of the GBA. However, the GBA is multifactorial, involving a complex interplay among one country, two systems and three currencies. Marked intra-city variations in land resource comprehensive carrying capacity exists due to differences in urbanization, population and socio-economic levels between and among districts. However, studies on this aspect are few. Thus, there is a need to analyze the characteristics and temporal as well as spatial patterns of LCCC in the GBA in China. The innovation of this study is that it evaluated LCCC in the GBA and compare the spatiotemporal differences among the 11 cities in this region. This study aims to explore a model for evaluating LCCC and thus to promote urban development.
We analyze spatial and temporal evolution of LCCC in the GBA. The structure of this paper is as follows: Section 2 provides the literature review. Section 3 introduces the data and methodology. Section 4 presents the results and experimental outcomes. Section 5 presents the conclusions and discussion.
Literature review
The concept of carrying capacity as a research subject first appeared in physical sciences. Carrying capacity can be defined as a species’ average population size in a particular habitat in ecology. The number of species is limited by environmental factors, such as adequate land, shelter, water and other available resources. If these needs cannot be met, the population will continue to decrease until resources are restored to meet the needs of the population (Yang et al., 2015). Studies use the concept of carrying capacity, including ecological environment carrying capacity, economic carrying capacity, social carrying capacity and material carrying capacity. Carrying capacity is an important human sustainable development aspect. Different types of indicators are assessed (Ma et al., 2017).
The body of research in this field is wide, with five main areas being assessed. First, the factors assessed in these studies involve single factor carrying capacities, such as water resources (Gong et al., 2009), land resources (Yan et al., 2017), environmental resources (Widodo et al., 2015), mineral resources (Wang et al., 2016), geological (Wang et al., 2019) and cultural factors (Cohen et al., 1997). Second, one of the research topics is evaluation of comprehensive carrying capacity. Comprehensive considerations include the environment, economic, social and physical (Hui et al., 2006) factors among others. The evaluation system conducts empirical research on LCCC from the perspective of multiple factors, and puts forward optimization suggestions on this basis. Third, studies have assessed recent applications of different technologies and models, such as GM (1,1) model (Peng et al., 2018), logistic model (Seidl et al., 1999), system dynamics modeling (SDM) (Wang et al., 2014) and ecological footprint (Wackernagel et al., 1994) in evaluating LCCC. Fourth, the methods and ideas of carrying capacity evaluation of regional urban agglomerations have been evaluated from the basis of classical approaches and theories, with the aim of determining how economic and environmental factors can be coordinated (Sun et al., 2020). Fifth, some studies focused on industries or sectors, such as transportation and tourism. By introducing the concept of traffic (or tourism) environmental capacity, the evaluation index system and model of traffic (or tourism) environmental carrying capacity are respectively constructed for quantitative evaluation.
The UNESCO defines LCCC as “the intensity of human activities that can be carried by a region while maintaining an acceptable standard of living” (Carey et al., 1993). Therefore, LCCC refers to the extreme value of human activities that a city can maintain without causing irreversible land damage under certain land resource constraints. Human activities include population growth, economic development, construction and ecological activities, etc (Shi et al., 2019). Comprehensive land carrying capacity explains whether regional land resources are effectively used to support economic activities and accommodate populations (Qian et al., 2015). Globally, one in five people live in cities with a population of more than one million, and the population is relatively concentrated. About 60% of the world’s population will live in settlements by 2030 (Angeliki et al., 2020). In a contemporary society, LCCC research topics have become increasingly important. Along with rapid urbanization, as a space carrier, urban entities accommodate a certain amount of population who consume land resources and indulge in social and economic activities. The LCCC of a region is the maximum population size at a time that can be sustained in that specific environment, which is defined as the environment’s maximal load.
Previous LCCC studies mostly focused on tests of population challenges under food restrictions, however, an additional research focus has now been placed on human economic and social sustainable development under the restriction of resources and the environment. With advances in research, influencing factors have gradually changed from single natural factors to economic factors, social factors and environmental factors (Shen et al., 2008; Chen et al., 2015). The LCCC is an important factor for promoting the urban comprehensive capacity instead of considering only single capacity. Many models have been proposed to describe the definition and indicators of carrying capacity. Based on previous studies, this study is located against the background of the GBA. We established an evaluation index system for the LCCC, which is based on aspects of urban economic and social development, land resources, local ecological environment, and science and technology for nearly 10 years, and quantified their change in time and space.
Methods and data sources
Indicator system and data source
LCCC evaluation provides basic data and useful information for sustainable development of cities, and is an important theoretical basis for cities to formulate environmental protection and sustainable development (Hou et al., 2015; Guo et al., 2016). Scientific and reasonable indicator selection is the foundation of evaluation. LCCC has a broader connotation, a wider range and more complex composition. LCCC is not a simple relationship, but a complex interactive relationship that includes other variables, such as economic factors. The system must exchange matter and energy with the outside world, as demonstrated in Figure1.
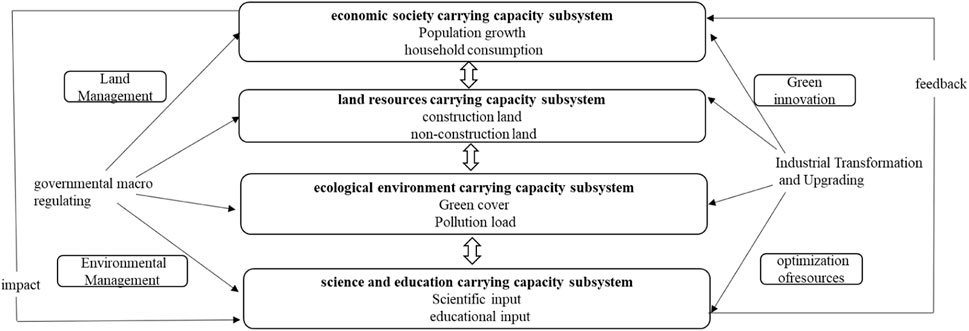
FIGURE 1. Interactions among economic society, land resources, ecological environment and science education.
The LCCC is unlikely to ever occur entirely independently of other factors. To improve the applicability of the method, the economic society, land resources, ecological environment and science education systems are all considered. Referring to the relevant literature (Lan et al., 2011; Yu et al., 2015) and “The National Programmer for General Planning of the national Land (2016–2030)” “Green development index system” and “Assessment objective system of ecological civilization construction” of China, we propose an evaluation index system of LCCC, which consists of 4 first-level indicators and 24 second-level indicators based on the principles of objectivity and data transparency. As a result, 24 LCCC indicators are selected for the study, as shown in Table 1.
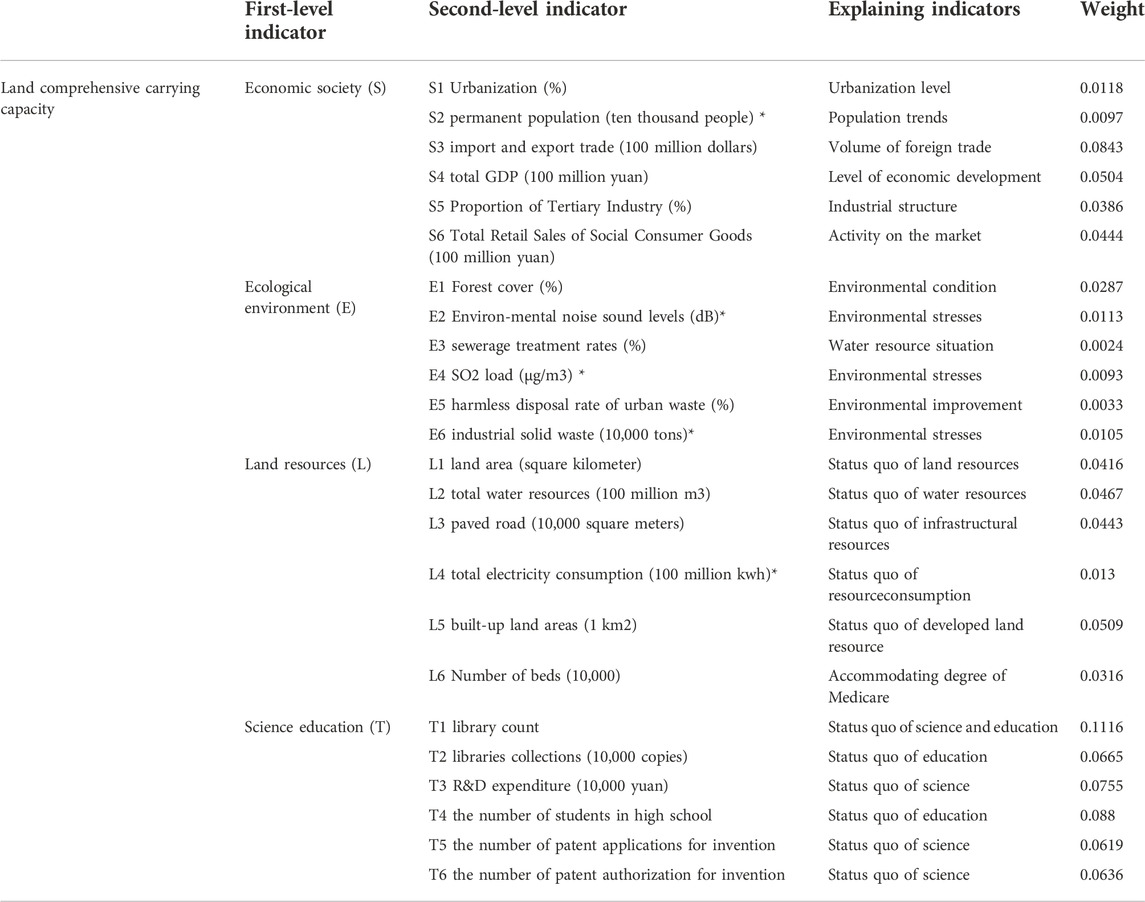
TABLE 1. Evaluation system of LCCC.
To reduce the influence of human subjective factors on weight determination, we used the entropy method to determine the weight value of each evaluation index. Weights of the indicators were calculated using entropy method and are shown in Table 1. Ecological environment carrying capacity and land resource carrying capacity are basic support carrying capacities. Economic society carrying capacity and science education carrying capacity are development capacities. Of these, the negative indicators include: permanent population, environmental noise sound levels, SO2 load, industrial solid waste, total electricity consumption (denoted by*). Others were in the positive direction. Positive direction reflects the supply ability of the direction. The greater the supply ability, the greater the ability of accommodation, and the greater the LCCC. In contrast, negative indicators reflect a negative growth rate, a weakened carrying capacity. Negative indicators also reflect the demand ability of the direction. The greater the demand ability, the greater the binding of the urban expansion, and the smaller the LCCC. We established that the highest % weighting was for science education.
The data collected in this paper was mainly obtained from “China Urban Statistical Yearbook,” “Guangdong Statistical Yearbook,” “National Economic and Social Development Statistical Bulletin” and “Environmental Status Bulletin.” The geographic data was obtained from the “National Geographic Information Resource Directory Service System,” while the missing data in the text was estimated using the average annual growth rate method, which does not affect the overall empirical analysis.
Methods and research design
Various analysis methods are used to study LCCC (Jie et al., 2019). The improved entropy weight model is used to evaluate the performance level of LCCC of the GBA in China from 2009 to 2018. The coefficient of variation is used to evaluate differences in time series. The ArcGIS is used to evaluate differences in structure and spatial distribution. Many studies used two methods, Analytic Hierarchy Process (AHP) (Gupta et al., 2018) and Delphi methods, to determine index weights, however, these two methods are subjective. In this study, the more objective entropy weight can discover the information implicit in the index data and avoid the problems encountered in the analysis due to inconsistencies between indicators. Since the entropy method has strong objectivity and practicality, it overcomes a lot of human interference, therefore, the evaluation results are more reliable and truer. Entropy weight is specifically calculated as:
Construction of the judgment matrix X. where xij is the initial value of the indicator in j years.
Normalization of data.
Calculation of indicator entropy value. where Hj is the entropy value of index j.
Entropy weight can be calculated using the formula: where wj is the entropy value of index j.
Construction of weighted normalized matrix R.
Determination of positive and negative ideal solutions. where
Quantitative calculation of the distance between the evaluated object and the positive ideal and virtual worst solution. Distance to the positive ideal solution
The value range is set from 0 to 1 to calculate the proximity, which represents closeness between the evaluation index and the best target. The lower the degree of closeness
Results
Spatial-temporal variation characteristics
Based on evaluation of LCCC, we can conclude the time trends and geographical distribution of LCCC in the GBA. Three standard statistical methods, mean, standard deviation (SD) and coefficient of variation (CV), were used in this paper (Figure 2). Annual averages represent annual trends across years over a longer period of time. The SD reflects the absolute difference of LCCC while the CV represents the degree of dispersion of the data set. Therefore, we measured differences in LCCC between cities.

FIGURE 2. Differences in LCCC trends in 2009–2018.
The means of LCCC in the GBA for the 2009–2018 period was evaluated. The annual LCCC increased from 0.1976 in 2009 to 0.3050 in 2018. Across cities, differences in LCCC levels were significant. The SD increased from 0.0913 in 2009 to 0.1775 in 2018. This indicates that absolute differences in LCCC between cities was due to a significant upward trend from 2009. The CV increased from 0.4622 in 2009 to 0.5819 in 2018, which shows a slowly increasing trend. Overall, the level of LCCC varied within the region. There was a differential increase in admission trends of LCCC between cities. Most cities in the GBA enact strict laws and regulations to improve traffic conditions. The industrial structure has been constantly optimized and improved. Proposals for further spatial integration of regional development and strengthening of ecological environment protection are put forward. Urban infrastructure is under continuous improvement. Government efforts are aimed at raising the quality of the population. Many three-high enterprises, including high consumption, high emission and high pollution, were transferred to economically backward areas. Therefore, synthesis indicators of LCCC in GBA increased year by year. Besides, there is a large disparity in economy, resources and environment, and the development of city economy is extremely unbalanced. Particularly under “one country, two systems”, LCCC is relatively high in central cities and it exhibits a declining pattern of the carrying capacity from the city center outwards.
Differences in regional characteristics
Taking urban agglomeration of the GBA as the research object, the comprehensive index of LCCC is analyzed from a quantitative perspective, and the comprehensive index of land carrying capacity and its spatial distribution map are calculated. Four years (2009, 2012, 2015, and 2018) were chosen as the study period (Figure 3). We used the ArcGIS natural fracture method to divide the LCCC of the GBA into four levels (Figure 4). As we can see from Figures 3, 4, In space, LCCC was established to be unevenly spread, and regional differences were significant. In the central city, LCCC was more spatially accessible, and rich city was more spatially accessible. The distribution pattern indicates that LCCC is decreasing from the center to the periphery. This is because there are many ports for foreign trade and transportation, and high technological corporations that allow a lot of well-educated people to live in the central and rich city. Such cities have a strong economic strength, superior educational resources, conspicuous technical strength, and developed transportation information. Moreover, the manufacturing link in the product life cycle is usually the pollution link. The peripheral cities undertake the manufacturing of many central cities. In other words, they undertake the pollution of many central cities, which has a great impact on the environment. So, the LCCC value is quite low.
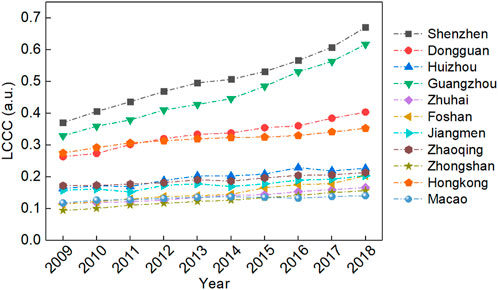
FIGURE 3. LCCC in 2009–2018.
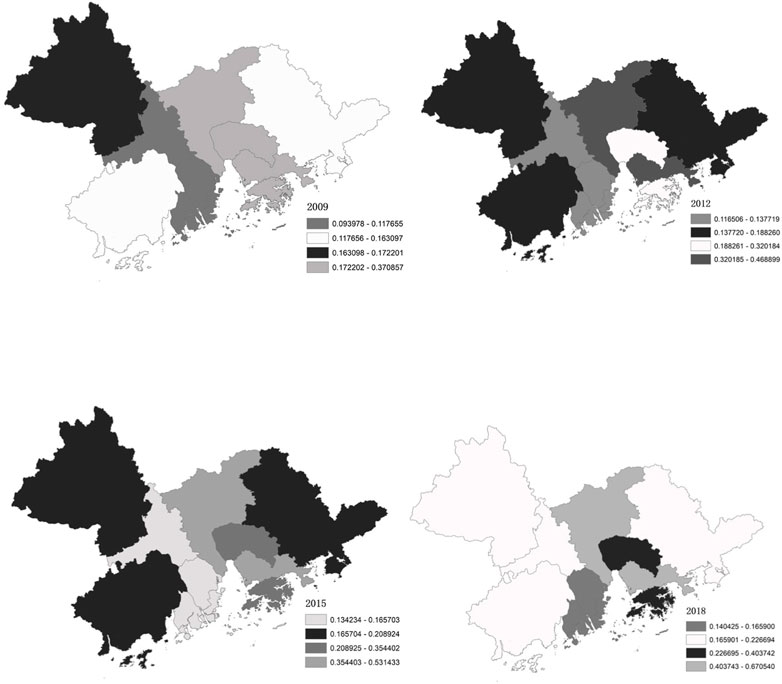
FIGURE 4. The LCCC and spatial distributions in 2009–2018.
The LCCC within the urban zones of Guangzhou, Dongguan and Shenzhen city were extremely high. Shenzhen is characterized by high-tech industries and foreign trade. Shenzhen is implementing industrial adjustment and transforming from traditional industries to high efficiency and low energy consumption. It is changing the mode of urban economic growth, improving the efficiency of urban land use and realizing sustainable development. Since China's reform and opening up, Shenzhen is the first special economic zone and is also one of the most economically powerful and dynamic cities in China. Guangzhou is the capital city of Guangdong Province. Information technology and pharmaceutical industry are developing at a fast pace. It has advanced manufacturing agglomeration and generated a positive effect of agglomeration.
It has also promoted service industry development by improving the industrial structure, promoting continuous optimization of the internal structure of secondary industries, and facilitated establishment of clean industries with low pollution and low energy consumption by enterprises. The growth rate of secondary industry in Dongguan is much higher than that of primary industries and tertiary industries. The manufacturing industry constitutes more than 90% of the city’s total industrial output. There are also academia-industry partnerships in Dongguan. In addition, smart towns with distinctive features were build which are likely to enhance agglomeration radiation belt significantly.
Dongguan has more than 4000 factories and densely populated cities. Under the current government administration, the coverage rate of the protected area is about 40%. The quantity of timber harvesting in Dongguan has reduced, whereas the forest area and stocking levels have gradually increased. Strategies to reduce timber production, maintain forest resources, and achieve double growth in the area and stock of forest resources have been implemented. The quality of observational research in Zhongshan, Zhuhai, and Macau towns was ranked as the lowest compared to other cities in GBA. These cities are relatively small with high-density population. Therefore, the LCCC of these cities is also weak compared to other cities. Macau had the lowest LCCC. With a size of only 32.9 square kilometers, Macau is one of the smallest cities in GBA. Thus, the city has limited capacity to accommodate a large population. Currently, the Gambling industry has grown to be a major industry in Macau. Another factor accounting for the low LCCC in Macau is the lack of technology.
Spatially, cities near the sea and with good deep-water ports have stronger economic systems with good externality and inclusiveness. In addition, such cities have good technological, natural, and cultural environments. They, therefore, can accommodate more people hence have high LCCC. LCCC is not evenly distributed and varies intrinsically across the urban fabric. It was found that high LCCC was more concentrated in center city. Edge cities needs further improvement.
Single factor carrying capacity evaluation
To gain more insight into the possible reasons for LCCC of the GBA, four single factor carrying capacity were calculated. The evolution trend of LCCC was described as shown in Table 2.
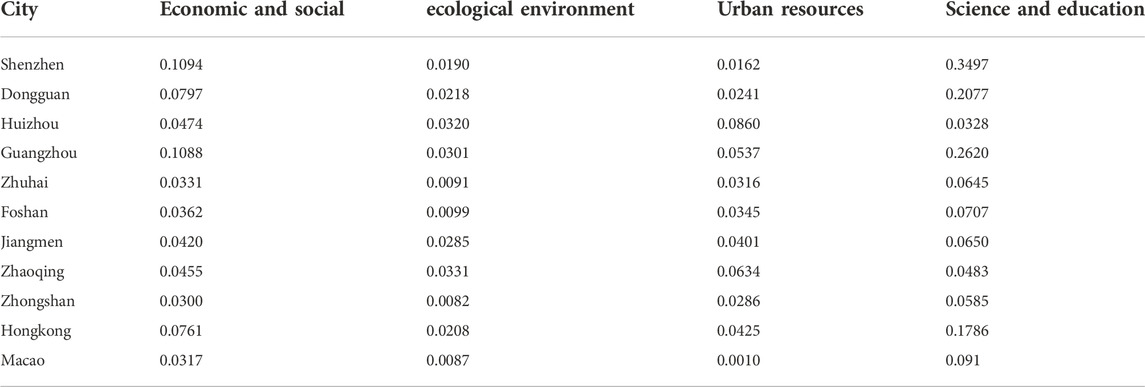
TABLE 2. Comprehensive carrying capacity of four subsystems for 11 cities in GBA.
The highest economic social single factor carrying capacity was obtained in Shenzhen with a value of degree of 0.1094. Shenzhen is the first special economic zone since initiation of China’s reform and opening up policy, and it is also one of the most economically powerful and economically dynamic cities in China. Guangdong is the first large economy and most populous province in China. Guangzhou is the capital city of Guangdong, the southern province of Chinese mainland, and is known for its rapid economic growth with value of degrees of 0.1088, which is close to the number of seconds. Since the initiation of the reform and opening up policy, Dongguan has attracted a large number of workers from mainland and has become a popular manufacturing base, as a close third, with a value of degree of 0.0797. Hong Kong is very urbanized, commercialized, and is a financial center of the world. The service industry has a significant contribution to Hong Kong’s GDP. Hong Kong has high economic social single factor carrying capacity at the 4th position. Its value of degree is 0.0761. Zhuhai, Zhongshan, and Macau are relatively small urban areas with small GDP, and have the lowest economic resources carrying capacity. The value of degree of Zhongshan is 0.0300. Zhongshan is a relatively less-technologically advanced city in GBA, and has a small economy. Its economy is largely reliant on tourism and agriculture.
The highest ecological single factor carrying capacity was observed in Zhaoqing with a value of degree of 0.0331. Zhaoqing is relatively big urban area, occupying 1/3 of the GBA region. It has large forest cover that has been increasing in recent years. Its ecological environment is good and its population is small. The pollution level in Zhaoqing is relatively low. This city has witnessed the fastest increase in population and daily activities compared to other cities. Zhaoqing has the highest ecological single factor carrying capacity, followed by Huizhou and Guangzhou. In Guangzhou, high ecological factor carrying capacity and an effective environmental governance system are inextricably linked. The lowest ecological single factor carrying capacity was observed in Zhongshan. Zhongshan has a relatively dense population, implying that it has a high energy consumption. Moreover, numerous high energy consumption, high pollution and high emissions enterprises in Zhongshan, which suggests that consumption of fossil fuels in the city is high.
The highest resource single factor carrying capacity was observed in Guangzhou, Zhaoqing, and Huizhou. These regions have large land area and many rivers. They have large natural environment under agricultural use, forest cover, and with many public resources such as land and water. The lowest resource single factor carrying capacity was observed in Macau. This is because Macau has the smallest total land area in GBA and relatively high population density compared to Shenzhen and Gongguan. In addition, the level of urbanization in the urban district is higher, but with high population density which exerts pressure on land resources and infrastructure.
The highest technology single factor carrying capacity was observed in Shenzhen which had a value of degree of 0.3497. The city has numerous types of R&D institutions, including universities and research institutes. These research centers attract many highly talented individuals and high-tech enterprises. The technology single factor carrying capacity of Guangzhou and Hong Kong are strong as well. The technology carrying capacities of Zhaoqing and Huizhou are weaker compared to other cities. Compared with urban areas in GBA, medical resources, investment in science, economy, and education levels are generally weaker in these two cities.
Conclusion and discussion
From 2009 to 2018, LCCC has been increasing all cities in GBA. The disparities in LCCC between the cities are modest. The cities within the GBA present a relatively balanced development state. However, there are local variations in development state. Spatially, rich cities are more spatially accessible and LCCC is high in city centers. Analysis of the distribution pattern indicates that LCCC decreases from the center to the periphery. The differences in LCCC are mainly due to factors such as economic society, land resource, technology, and attention to environmental protection. The subsystem carrying capacity in GBA is vast and unevenly developed. For instance, Shenzhen has a high GDP and developed economy carrying capacity. Inland cities of the GBA have generally medium GDP and their economy is developing. However, the cost to the ecological environment of achieving economic growth is increasing, which has led to serious deterioration of the ecological environment that continues to intensify. This indicates that the relationships among subsystems are synergistic and complicated. The present results imply that the carrying capacity of a city can be improved by controlling excessive growth of space economy and protecting the ecological environment.
In summary, we conclude that significant differences existed in economic strength, technological strength, land area, and population density in cities of GBA. The short board effect of various cities is different. Consequently, the first step to improving the comprehensive carrying capacity of a city is to identify the main factors affecting the comprehensive carrying capacity of the city. Moreover, regional collaborative strategies should be pursued to improve the urban comprehensive carrying capacity. Development should be coordinated in a collaborative manner at regional and subregional levels on the basis of science and technology to ensure sustainability in neighboring cities under “One Country, Two Systems” context. This will increase the complementary advantages among member cities and improve resource allocation. It will also enable cities learn from each other and develop together. To promote all-round development of a city, urban policy makers should identify comprehensive solutions which address all aspects of city development to improve the comprehensive carrying capacity of the system and promote sustainable development of a city.
It was also recognized that each city should identify its strengths and leverage on them to promote development. Shenzhen has been the forerunner in aspects of urbanization and socioeconomic development in China. Guangzhou serves as a provincial capital model for other cities. Hong Kong is the center for international finance and trade, and is an international aviation hub. Macau offers high-quality tourism services. Huizhou and Zhaoqing require high investment in science and technology to promote development. Overall, with the promotion of GBA strategy, Guangzhou, Shenzhen, and Hong Kong are expected to become the core cities in the entire GBA. Governments at all levels should break the administrative monopolies and achieve cross-regional cooperation in the field of environmental protection.
Data availability statement
Publicly available datasets were analyzed in this study. This data can be found here: The data collected in this paper was mainly obtained from “China Urban Statistical Yearbook,” “Guangdong Statistical Yearbook,” “National Economic and Social Development Statistical Bulletin” and “Environmental Status Bulletin.” The geographic data was obtained from the “National Geographic Information Resource Directory Service System.”
Author contributions
ZW and YS conceived and designed the experiments; MX contributed materials; ZW wrote the paper.
Funding
Financial support by the Education Science Research Foundation of Guangdong Province (2022GXJK082 2022GXJK079, 2020GXJK153 and 2019GXJK068), The Philosophy and Social Science Research Foundation of Huizhou (XJ2022000101), and The Professorial and Doctoral Scientific Research Foundation of Huizhou University (2020JB071) are acknowledged.
Conflict of interest
The authors declare that the research was conducted in the absence of any commercial or financial relationships that could be construed as a potential conflict of interest.
Publisher’s note
All claims expressed in this article are solely those of the authors and do not necessarily represent those of their affiliated organizations, or those of the publisher, the editors and the reviewers. Any product that may be evaluated in this article, or claim that may be made by its manufacturer, is not guaranteed or endorsed by the publisher.
References
Al-Mulali, U., Sab, C. N. B. C., and Fereidouni, H. G. (2012). Exploring the bi-directional long run relationship between urbanization, energy consumption, and carbon dioxide emission. Energy 46 (1), 156–167. doi:10.1016/j.energy.2012.08.043
Arrow, K., Bolin, B., Costanza, R., Dasgupta, P., Folke, C., Holling, C., et al. (1995). Economic growth, carrying capacity, and the environment. Ecol. Econ. 15 (2), 91–95. doi:10.1016/0921-8009(95)00059-3
Byron, C., Link, J., Costa-Pierce, B., and Bengtson, D. (2011). Calculating ecological carrying capacity of shellfish aquaculture using mass-balance modeling: Narragansett Bay, Rhode Island. Ecol. Model. 222 (10), 1743–1755. doi:10.1016/j.ecolmodel.2011.03.010
Carey, D. I. (1993). Development based on carrying capacity: A strategy for environmental protection[J]. Glob. Environ. Change 3 (2), 140–148. doi:10.1016/0959-3780(93)90002-3
Chapman, E. J., and Byron, C. J. (2018). The flexible application of carrying capacity in ecology. Glob. Ecol. conservation 13, e00365. doi:10.1016/j.gecco.2017.e00365
Chen, X., Zhang, L., and Liu, G. Analyzing industrial pollution emissions from the yangtze river delta with a 3D framework[J]. Res. Environ. Sci., 2015. 10, 150–157. doi:10.13198/j.issn.1001-6929.2015.10.21
Cohen, J. E. (1997). Population, economics, environment and culture: An introduction to human carrying capacity. J. Appl. Ecol. 34 (6), 1325–1333. doi:10.2307/2405250
Daily, G. C., and Ehrlich, P. R. (1996). Socioeconomic equity, sustainability, and earth's carrying capacity. Ecol. Appl. 6 (4), 991–1001. doi:10.2307/2269582
Dobbs, R., Smit, S., Remes, J., Manyika, J., Roxburgh, C., Restrepo, A., et al. (2011). Urban world: Mapping the economic power of cities. Kiev, Ukraine: McKinsey Global Institute.
Fedor, P., and Zvaríková, M. (2019). “Biodiversity indices,” in Encyclopedia of ecology. Editor B. Fath. second ed. (Oxford: Elsevier), 337–346.
Ghahramani, M., Zhou, M. C., and Hon, C. T. (2018). Extracting significant mobile phone interaction patterns based on community structures. IEEE Trans. Intell. Transp. Syst. 20 (3), 1031–1041. doi:10.1109/tits.2018.2836800
Ghahramani, M., Zhou, M., Qiao, Y., and Wu, N. (2021). Spatiotemporal analysis of mobile phone network based on self-organizing feature map. IEEE Internet Things J. 9 (13), 10948–10960. doi:10.1109/jiot.2021.3127203
Gilandeh, A. G., Behjou, F. K., and Yarmohammadi, K. (2018). Evaluation of ardabil city carrying capacity using DPSIR method and ELECTRE model. Glob. J. Agric. Innov. Res. Dev. 5, 15–23. doi:10.15377/2409-9813.2018.05.2
Gong, L., and Jin, C. (2009). Fuzzy comprehensive evaluation for carrying capacity of regional water resources. Water Resour. manage. 23 (12), 2505–2513. doi:10.1007/s11269-008-9393-y
Graymore, M. L. M., Sipe, N. G., and Rickson, R. E. (2010). Sustaining human carrying capacity: A tool for regional sustainability assessment. Ecol. Econ. 69 (3), 459–468. doi:10.1016/j.ecolecon.2009.08.016
Grimm, N. B., Faeth, S. H., Golubiewski, N. E., Redman, C. L., Wu, J., Bai, X., et al. (2008). Global change and the ecology of cities. science 319 (5864), 756–760. doi:10.1126/science.1150195
Guo, B., Zhou, Y., Zhu, J., Liu, W., Wang, F., Wang, L., et al. (2016). Spatial patterns of ecosystem vulnerability changes during 2001–2011 in the three-river source region of the Qinghai-Tibetan Plateau, China. J. Arid. Land 8 (1), 23–35. doi:10.1007/s40333-015-0055-7
Gupta, P., Mehlawat, M. K., Aggarwal, U., and Charles, V. An integrated AHP-DEA multi-objective optimization model for sustainable transportation in mining industry[J]. Resour. Policy, 74, 2018: 101180, doi:10.1016/j.resourpol.2018.04.007
Hou, K., Li, X., and Zhang, J. (2015). GIS analysis of changes in ecological vulnerability using a SPCA model in the loess plateau of northern shaanxi, China. Int. J. Environ. Res. Public Health 12 (4), 4292–4305. doi:10.3390/ijerph120404292
Hui, C. (2006). Carrying capacity, population equilibrium, and environment's maximal load. Ecol. Model. 192 (1-2), 317–320. doi:10.1016/j.ecolmodel.2005.07.001
Jia, Z., Cai, Y., Chen, Y., and Zeng, W. (2018). Regionalization of water environmental carrying capacity for supporting the sustainable water resources management and development in China. Resour. Conservation Recycl. 134, 282–293. doi:10.1016/j.resconrec.2018.03.030
Jie, L. I. Spatiotemporal differentiation of land comprehensive carrying capacity and diagnosis of obstacle factors in the Yangtze River economic belt[J]. East China Econ. Manag., 2019, 33(8): 67–75.
Jones, P., Wynn, M., Hillier, D., and Comfort, D. (2017). The sustainable development goals and information and communication technologies. ijsam. 1 (1), 1–15. doi:10.28992/ijsam.v1i1.22
Kluger, L. C., Taylor, M. H., Mendo, J., Tam, J., and Wolff, M. (2016). Carrying capacity simulations as a tool for ecosystem-based management of a scallop aquaculture system. Ecol. Model. 331, 44–55. doi:10.1016/j.ecolmodel.2015.09.002
Lan-Tu, L. I., Chen, W. K., and Sun, L. N., Analysis of tempers spatial variations of the land’s comprehensive carrying capacity in Jiangsu province[J]. Res. soil water conservation, 2011(01):12–16.
Leung, A. Y. M., Molassiotis, A., Zhang, J., Deng, R., Liu, M., Van, I. K., et al. (2020). Dementia literacy in the greater bay area, China: Identifying the at-risk population and the preferred types of mass media for receiving dementia information. Int. J. Environ. Res. Public Health 17 (7), 2511. doi:10.3390/ijerph17072511
Ma, B. Literature review on land carrying capacity of the coordinated development of population, resources, environment and economy[J]. AIP Conf. Proc., 2017, 1890(1):1–7.doi:10.1063/1.5005308
Ma, B. (2017). Literature review on land carrying capacity of the coordinated development of population, resources, environment and economy AIP Conference Proceedings. AIP Publ. LLC 1890 (1), 040106.
McKinney, M. L. (2006). Urbanization as a major cause of biotic homogenization. Biol. Conserv. 127 (3), 247–260. doi:10.1016/j.biocon.2005.09.005
Oh, K., Jeong, Y., Lee, D., Lee, W., and Choi, J. (2005). Determining development density using the urban carrying capacity assessment system. Landsc. urban Plan. 73 (1), 1–15. doi:10.1016/j.landurbplan.2004.06.002
Peng, B., Wang, Y., Elahi, E., and Wei, G. (2018). Evaluation and prediction of the ecological footprint and ecological carrying capacity for yangtze river urban agglomeration based on the grey model. Int. J. Environ. Res. Public Health 15 (11), 2543. doi:10.3390/ijerph15112543
Peponi, Angeliki, and Morgado, Paulo (2020). Smart and regenerative urban growth: A literature network analysis. Int. J. Environ. Res. Public Health 17 (7), 2463. doi:10.3390/ijerph17072463
Qian, Y., Tang, L., Qiu, Q., Xu, T., and Liao, J. (2015). A comparative analysis on assessment of land carrying capacity with ecological footprint analysis and index system method. PloS one 10 (6), e0130315. doi:10.1371/journal.pone.0130315
Ress, W. E., and Wackernagel, M. Ecological footprints and appropriated carrying capacity: Measuring the natural capital requirements of the human economy[J]. Focus, 1996, 6(1): 45–60.
Seidl, I., and Tisdell, C. A. (1999). Carrying capacity reconsidered: From malthus’ population theory to cultural carrying capacity. Ecol. Econ. 31 (3), 395–408. doi:10.1016/s0921-8009(99)00063-4
Shen, W., Wu, J., Grimm, N. B., and Hope, D. (2008). Effects of urbanization-induced environmental changes on ecosystem functioning in the phoenix metropolitan region, USA. Ecosystems 11 (1), 138–155. doi:10.1007/s10021-007-9085-0
Shi, L., Taubenböck, H., Zhang, Z., Liu, F., and Wurm, M. (2017). Urbanization in China from the end of 1980s until 2010 – spatial dynamics and patterns of growth using EO-data[J]. Int. J. Digital Earth, 2018:12, 1–17. doi:10.1080/17538947.2017.1400599
Shi, Y., Shi, S., and Wang, H. (2019). Reconsideration of the methodology for estimation of land population carrying capacity in Shanghai metropolis. Sci. Total Environ. 652, 367–381. doi:10.1016/j.scitotenv.2018.10.210
Sun, M., Wang, J., and He, K. (2020). Analysis on the urban land resources carrying capacity during urbanization-A case study of Chinese YRD. Appl. Geogr. 116, 102170. doi:10.1016/j.apgeog.2020.102170
Wackernagel, M. (1994) .Ecological footprint and appropriated carrying capacity: A tool for planning toward sustainability[D]. Vancouver, Canada: University of British Columbia.
Wang, R., Cheng, J., Zhu, Y., and Xiong, W. (2016). Research on diversity of mineral resources carrying capacity in Chinese mining cities. Resour. Policy 47, 108–114. doi:10.1016/j.resourpol.2015.12.003
Wang, S., Xu, L., Yang, F., and Wang, H. (2014). Assessment of water ecological carrying capacity under the two policies in Tieling City on the basis of the integrated system dynamics model. Sci. Total Environ. 472, 1070–1081. doi:10.1016/j.scitotenv.2013.11.115
Wang, Z., Wang, Y., Wang, L., Zhang, T., and Tang, Z. (2019). Research on the comprehensive evaluation system of eco-geological environmental carrying capacity based on the analytic hierarchy process. Clust. Comput. 22 (3), 5347–5356. doi:10.1007/s10586-017-1242-4
Wei, Y., Huang, C., Lam, P. T. I., Sha, Y., and Feng, Y. (2015). Using urban-carrying capacity as a benchmark for sustainable urban development: An empirical study of beijing. Sustainability 7 (3), 3244–3268. doi:10.3390/su7033244
Wei, Y., Huang, C., Li, J., and Xie, L. (2016). An evaluation model for urban carrying capacity: A case study of China's mega-cities. Habitat Int. 53, 87–96. doi:10.1016/j.habitatint.2015.10.025
Widodo, B., Lupyanto, R., Sulistiono, B., Harjito, D., Hamidin, J., Hapsari, E., et al. (2015). Analysis of environmental carrying capacity for the development of sustainable settlement in yogyakarta urban area. Procedia Environ. Sci. 28, 519–527. doi:10.1016/j.proenv.2015.07.062
Yan, H., Liu, F., Liu, J., Xiao, X., and Qin, Y. (2017). Status of land use intensity in China and its impacts on land carrying capacity. J. Geogr. Sci. 27 (4), 387–402. doi:10.1007/s11442-017-1383-7
Yang, C., Li, Q., Hu, Z., Chen, J., Shi, T., Ding, K., et al. (2019). Spatiotemporal evolution of urban agglomerations in four major bay areas of US, China and Japan from 1987 to 2017: Evidence from remote sensing images. Sci. Total Environ. 671, 232–247. doi:10.1016/j.scitotenv.2019.03.154
Yang, G., and Chen, Z. (2015). RS-based fuzzy multiattribute assessment of eco-environmental vulnerability in the source area of the Lishui River of northwest Hunan Province, China. Nat. Hazards (Dordr). 78 (2), 1145–1161. doi:10.1007/s11069-015-1762-2
Yu, G. H., and Sun, C. Z. (2015). Land carrying capacity spatiotemporal differentiation in the Bohai Sea coastal areas[J]. Acta Ecol. Sin., 35: 4860–4870. doi:10.5846/stxb201311302853
Keywords: land comprehensive carrying capacity (LCCC), the Guangdong-Hong Kong-Macau greater bay area (GBA), entropy weight method, index system, China
Citation: Wu Z, Su Y and Xiong M (2022) Land comprehensive carrying capacity and spatio-temporal analysis of the guangdong-Hong Kong-Macau Greater Bay Area. Front. Environ. Sci. 10:964211. doi: 10.3389/fenvs.2022.964211
Received: 08 June 2022; Accepted: 01 November 2022;
Published: 01 December 2022.
Edited by:
Yanpeng Cai, Guangdong University of Technology, ChinaReviewed by:
Valentina Ilija Janev, Institut Mihajlo Pupin, SerbiaMohammadhossein Ghahramani, Birmingham City University, United Kingdom
Copyright © 2022 Wu, Su and Xiong. This is an open-access article distributed under the terms of the Creative Commons Attribution License (CC BY). The use, distribution or reproduction in other forums is permitted, provided the original author(s) and the copyright owner(s) are credited and that the original publication in this journal is cited, in accordance with accepted academic practice. No use, distribution or reproduction is permitted which does not comply with these terms.
*Correspondence: Yantao Su, c3V5YW50YW9Ac3p0dS5lZHUuY24=