 Baoguo Shi
 Renwang Wang
 Ru Zhe
 Ziqian Zhai
94% of researchers rate our articles as excellent or good
Learn more about the work of our research integrity team to safeguard the quality of each article we publish.
Find out more
ORIGINAL RESEARCH article
Front. Environ. Sci., 23 August 2022
Sec. Environmental Economics and Management
Volume 10 - 2022 | https://doi.org/10.3389/fenvs.2022.963960
This article is part of the Research TopicThe Role of Fiscal Decentralization in Achieving Environmental Sustainability in Developing and Emerging EconomiesView all 19 articles
Applying the panel data of 16 districts in Beijing, China from 2009 to 2020 as the research object, this study measures and analyzes the carbon emission intensity and the level of industrial structure upgrading. Based on the above results, a spatial econometric model is established to analyze the spatial spillover effect of industrial structure upgrading on carbon emission intensity. Conclusions are drawn as follows: (a) In 2009, 2015 and 2020, the carbon emission intensity in most districts of Beijing has decreased, and in some areas even decreased significantly. The upgrading of industrial structure in all districts has been improved (b). According to the results of spatial autocorrelation, the carbon emission intensity in Beijing shows significant positive spatial autocorrelation in 2009 and 2020, while negative spatial autocorrelation in 2015; The upgrading of industrial structure in Beijing shows significant positive spatial autocorrelation in 2009, 2015 and 2020 (c). The regression results of the spatial econometric model show that industrial structure upgrading not only reduces the carbon emission intensity of the region, but also decreases the carbon emission intensity of the surrounding areas.
Carbon dioxide emissions and global warming have raised concern in various countries in recent years once again with the increasing number of extreme weather events (Paul and Bhattacharya, 2004). The increase of carbon dioxide emissions led to a series of natural disasters, forcing the countries to jointly call for the reduction of carbon emissions, which puts forward new requirements for national and regional industrial development and thus, promoting industrial development and transformation to become a crucial link in national strategic development (IPCC, 2007). On 22 September 2020, Chinese President Xi Jinping announced to the world at the General Debate of the 75 sessions of the United Nations General Assembly that China will scale up its Intended Nationally Determined Contribution by adopting more vigorous policies and measures, aiming to peak CO2 emissions before 2030 and achieving carbon neutrality before 2060. As the world’s largest energy producer and consumer, China has been actively promoting industrial restructuring and energy structure optimization since the 11th Five-Year Plan period in order to achieve sustainable and high-quality economic development. As the second largest first-tier city in terms of GDP in China, Beijing has experienced a constant evolution of urban function positioning and has the biggest tertiary industry as a proportion of GDP among all Chinese cities. Beijing has played an exemplary role in actively implementing the industrial structure upgrading and emission reduction among Chinese cities. Especially, a large number of enterprises with high pollution and high energy consumption have been closed down or transferred since 2014, achieving the industrial structure upgrading from the industrial economy to the service economy. Meanwhile, Beijing has been actively responding to the call of carbon emission reduction work by the central government and achieved remarkable results in the field. In addition, CO2 emissions are mainly concentrated in urban areas, accounting for 70% of global CO2 emissions. China is the largest carbon emitter in the world, and Beijing, as the capital and first-tier city of China, has attracted great attention from the world. Does the industrial structure upgrading promote the reduction of carbon emission intensity? The empirical research from 16 districts in Beijing may provide a reference for China to achieve the “carbon peaking and carbon neutrality goals” as scheduled, and also for other countries to formulate industrial policies and reduce carbon emission intensity.
On the issue of carbon emission intensity, some scholars have carried out a large number of studies to explore the factors affecting carbon emission intensity from different perspectives. Hanif et al. (2019) conclude that FDI is a significant source of CO2 emissions for developing countries (Hanif et al., 2019). The relationship between economic development level and carbon emission intensity has been frequently discussed. A large number of studies show that the economic development level has a significant impact on carbon emission intensity in China (Li, 2010; Meng et al., 2011; Zhang and Lin, 2012). Auffhammer and Carson (2008) analyze the influencing factors of carbon emission intensity in 25 provinces of China during 1985–2004 and find that there is an inverted U-shaped relationship between carbon emission intensity and per capita GDP in China (Auffhammer and Carson, 2008). (Fan et al., 2007) empirically analyze the influencing factors of carbon emission intensity and reveal that carbon emission intensity in China generally showed a downward trend from 1980 to 2003 (Fan et al., 2007).
In addition, more and more scholars are paying attention to the relationship between industrial structure and carbon emissions since China is in a critical period of industrial structure transformation and upgrading. Plentiful literatures reveal that carbon emissions are closely related to industrial structure, energy structure, and energy intensity. Ang et al. (1998) study the relationship between CO2 emission and industrial energy consumption in China during 1985–1990 by using the logarithmic mean Divisia index (LMDI) method. Their results show a large positive effect associated with the change in industrial production and a large negative effect associated with the change in sectorial energy intensity (Ang et al., 1998). The research results of Zhang (2000) show that, without the policies and measures toward energy conversation, it would be difficult for China to contribute to a significant decline in carbon emission intensity given its economic growth rate (Zhang, 2000). Zhang J. et al. (2018) empirically find that industrial structure optimization can significantly inhibit carbon emissions. Cheng Z. et al. (2018) study the effects of the industrial structure upgrading in China on carbon emission intensity, finding that both the carbon emission intensity in China and the industrial structure upgrading show a significant positive spatial autocorrelation, and industrial structure upgrading reduces the carbon emission intensity of the region (Cheng et al., 2018). Through reviewing the relevant literature, it is found that there are plentiful studies on the influence relation between industrial structure upgrading and carbon emission intensity in China at the national level, but few studies at the urban level. This paper innovatively explores the relation from the perspective of “small scale in big city” to offer a closer look at this field.
Although extensive studies have examined the factors affecting carbon emissions, especially those on the impact of industrial structure on carbon emissions are springing up, there are still some perspectives that remain insufficiently analyzed. The previous literature mostly studies the impact of industrial structure on total carbon emissions rather than carbon emission intensity, which can better reflect the concept of low-carbon economy. Few of the existing literatures have analyzed the relationship between industrial structure upgrading and carbon emission intensity from a spatial perspective. Besides, the existing studies mostly have focused on the relationship between industrial structure and carbon emissions at the provincial level but not considered the relationship between the two at a city level. This article aims to measure and analyze the carbon emission intensity and the level of industrial structure upgrading with appropriate indicators in each district of Beijing and then builds a spatial econometric model to discuss the spatial spillover effect of industrial structure upgrading on carbon emission intensity.
The first section of this paper introduces the research background and current status of relevant research. Methods introduces data sources and research methods. Then in Statistical analysis we select the relevant data of each district in Beijing to calculate and analyze the carbon emission intensity and industrial structure upgrading level. The next we analyze the spatial correlation and heterogeneity of the two, then study the impact of industrial structure upgrading on carbon emission intensity in Beijing by SDM model. Based on the interpretation of the results of spatial analysis, a discussion is presented in Discussion. Lastly, the conclusion is summarized and relevant policy recommendations are put forward in Conclusion.
Beijing is located in northern China with a population of 21.886 million and an area of 16,410 square kilometers. The per capita GDP in Beijing was 164,200 yuan by the end of 2020, ranking first in China. Our research object is the 16 municipal districts of Beijing from 2009 to 2020 and the original data are collected from Beijing Statistical Yearbook1 (Beijing Municipal Bureau of Statistics and NBS Survey Office in Beijing, 2009–2020) and EPS database2. The dependent variable is set as carbon emission intensity and the core explanatory variable is industrial structure upgrading. According to the relevant literatures, investment level, economic development level, consumption level and labor input are the major factors affecting carbon emission intensity. The indicator of investment level is measured by regional actual utilized foreign direct investment/regional GDP (fdi). The indicator of economic development level is measured by per capita GDP (pgdp). The indicator of consumption level is measured by per capita personal consumption expenditure (pcon). And the indicator of labor force is measured by total sum of on-duty employees’ wages (lab). Appendix A displays the definitions and descriptive statistics of the above variables. Figure 1 shows the location and administrative boundaries of districts in Beijing. The symbols of 16 districts in Figure 1 are the phonetic initials of each district. The projection method used in Figure 1 is CGCS_2000. The same below.
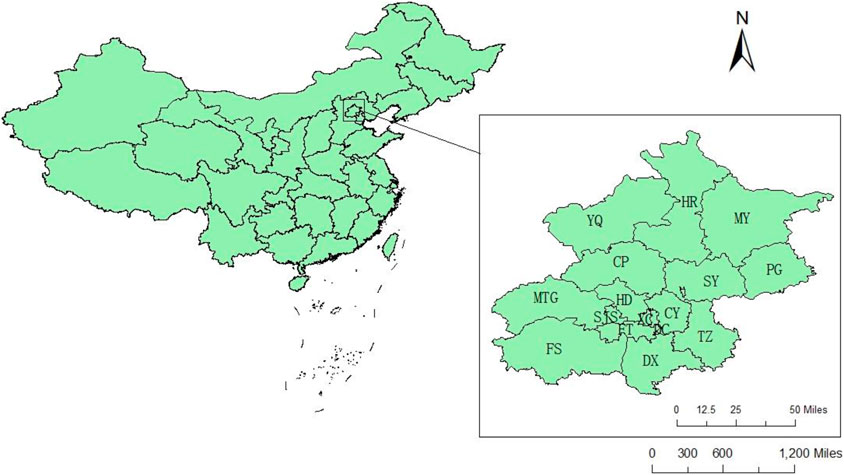
FIGURE 1. Location of each administrative district in Beijing.
This study uses spatial autocorrelation to explore the spatial pattern of carbon emission intensity and industrial upgrading. Spatial autocorrelation refers to the statistical correlation between the spatial proximity among observational units and the numeric similarity among their values. In general, the closer the distance, the greater the correlation between the two values. Moran’s I and Local Moran Index are usually introduced to measure global and local spatial correlation. The former is a method of global clustering test, which tests the similarity (spatial positive correlation) and dissimilarity (spatial negative correlation) or mutual independence of adjacent areas in the whole research area; The latter is used to test whether similar or different observations have been collected locally. Moran’s I index is generally used for global spatial autocorrelation (Moran, 1950). In this study, global Moran’s I value is used to analyze the degree of spatial correlation as a whole and the calculation formula is as follows:
Where N is the total number of districts in Beijing;
Where
Local spatial autocorrelation refers to the Local Moran Index of a region (Pinto et al., 2014), which is used to measure the degree of association between region I and its adjacent regions. Our study applies LISA as a local metric of spatial autocorrelation (Anselin, 1995) to identify clusters and outliers, such as districts which have higher or lower carbon intensity or industrial upgrading values than expected. The accumulation of j in the formula does not involve the district I itself, that is, j ≠i. We use LISA agglomeration map to analyze the characteristics of local agglomeration. LISA agglomeration map consists of four quadrants, namely, the first quadrant, the second quadrant, the third quadrant and the fourth quadrant. The first quadrant (HH) represents the high-value region surrounded by the high-value regions; the second quadrant (LH) represents the low-value region surrounded by the high-value regions; the third quadrant (LL) represents the low-value region surrounded by the low-value regions; and the fourth quadrant (HL) represents the high-value region surrounded by the low-value regions.
Where N is the total number of districts in Beijing;
This study utilizes mainly spatial regression models, such as Spatial Autoregressive Model (SAR), Spatial Autocorrelation Model (SAC) and Spatial Durbin Model (SDM).
The Spatial Autoregressive Model (Anselin, 2013)proposed by Cliff and Ord (1981) is the most widely used method in spatial econometrics (Cliff et al., 1981). Spatial Autoregressive Model is used for examining spatial dependence between dependent variables, mainly considering the interaction between regions with spillover effects, excluding the interaction of independent variables. The formula is as follows:
Where Y is the dependent variable of order N×t; X is the independent variable of order N×t; W is the spatial weight matrix;
SAC model (Dormann C et al., 2007) does not consider the spatial interaction effect among explanatory variables, compared with Spatial Durbin Model. It should be noted that SAC model can only be constructed on the basis of fixed effects model, so the specific calculation formula is as follows:
Where
The Spatial Durbin Model comprehensively considers both exogenous and endogenous interaction effects, the calculation formula as follows:
Where
Carbon emission intensity is calculated according to energy consumption. The formula is as follows:
Where E is the total amount of carbon emission, ETCE is energy consumption (standard coal); EF is the transition coefficient between energy consumption and carbon emission intensity; and C is carbon emission intensity. The district-level energy consumption data of Beijing come from Beijing Regional Statistical Yearbook (Beijing Municipal Bureau of Statistics). According to the transition coefficient developed by Zheng et al. (2019), EF is 2.204 kg CO2/kg TCE.
The level of industrial structure upgrading can be evaluated by various indexes, such as Proportional Weight Method of Industrial Structure, Technical Complexity Method and Included Angle Cosine Method. Proportional Weight Method of Industrial Structure is suitable to measure the rationalization process and upgrading process of industrial structure change. Technical Complexity Method has such critical requirements for data that the process is often difficult to implement. Included Angle Cosine Method expresses the improvement degree of industrial structure by studying the angle of geometric vector. According to both data availability and the limitations, this study adopts the method developed by Fu (2010) to measure the industrial structure upgrading. Fu (2010) introduces the angle of three-dimensional vectors in space instead of simple and rough subjective assignment, and his approach has been widely adopted as a main research method by many Chinese scholars. This method is also called “Angle Method of Space Vectors”. The first step is to measure the ratio of the output value of primary industry, secondary industry and tertiary industry to GDP as a component of the spatial vectors to form a set of 3-dimensional vectors
j = 1,2,3.
The formula of industrial structure upgrading (W) is as follows:
In order to understand the change of carbon emission intensity in each district of Beijing from 2009 to 2020, we conduct analysis on the data of the years of 2009, 2015 and 2020. The color changing from green to red in Figures 2–4 indicates the value getting larger. As can be seen from Figures 2–4, the carbon emission intensity of all districts in Beijing was low on the whole, while that of some districts was high, such as Mentougou District, however, with a downward trend. From the perspective of spatial distribution, the carbon emission intensity of Dongcheng District, Xicheng District and its surrounding ones was significantly lower than that of other districts. The districts with higher carbon emission intensity were mainly the outer suburbs of Beijing and the carbon emission intensity of most areas in Beijing was at the medium level. As shown in Table 1, except Fangshan District, Shunyi District and Daxing District, carbon emission intensity of other districts experienced a decline in 2009, 2015 and 2020, among which Mentougou District witnessed the most significant downturn of 92.018. The carbon emission intensity of Xicheng District dropped below 1 for the first time in the year of 2015. And in 2020, the carbon emission intensity of Dongcheng District, Xicheng District, Chaoyang District and Haidian District dropped below 1, with the lowest value of 0.580 in Xicheng District. Besides, Mentougou District recorded the highest carbon emission intensity in 2009 and 2015 and Fangshan District in 2020 in Beijing.
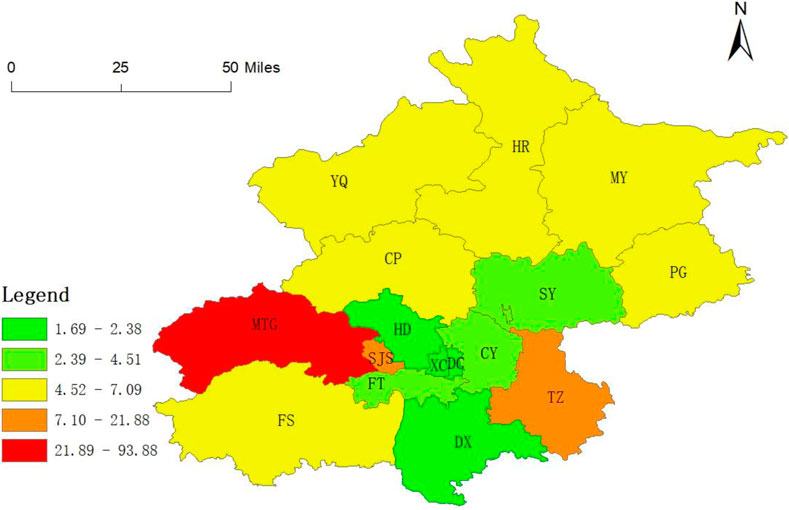
FIGURE 2. Distribution of carbon emission intensity in 2009.
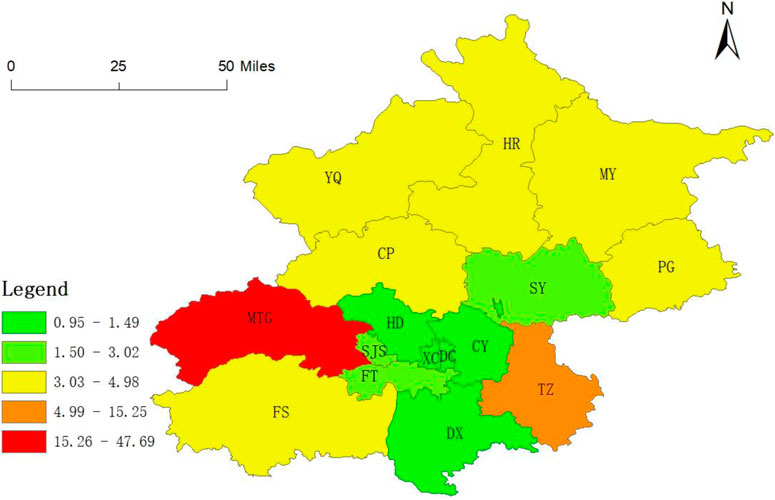
FIGURE 3. Distribution of carbon emission intensity in 2015.
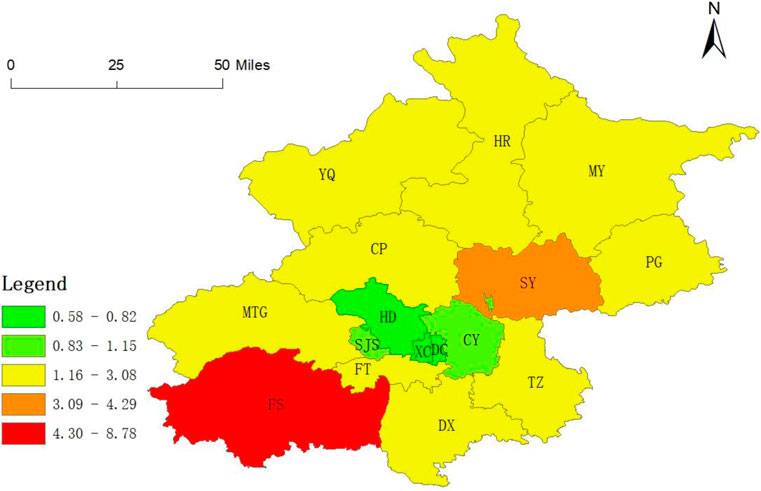
FIGURE 4. Distribution of carbon emission intensity in 2020.
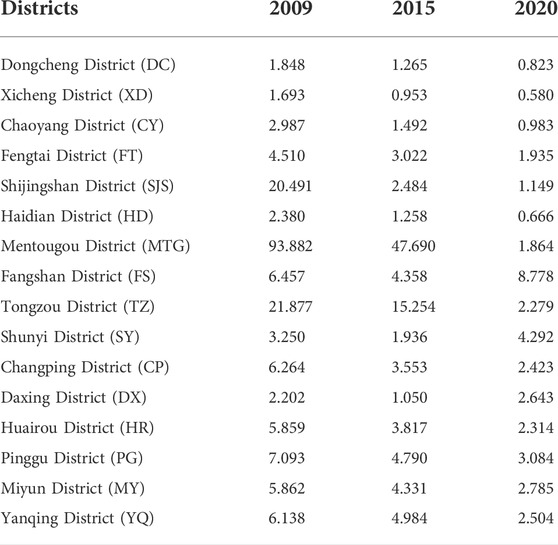
TABLE 1. Carbon emission intensity of each district in Beijing in 2009, 2015 and 2020.
In order to understand the changes of industrial structure upgrading level in each district of Beijing from 2009 to 2020, we conduct analysis on the data of the years of 2009, 2015 and 2020. In Figures 5–7, the value is getting higher with color from red to green. As can be seen from Figures 5–7, the industrial structure upgrading level of Beijing radiated gradually from the center to the surrounding areas: the closer to the center, the higher the upgrading level; the further to the center, the lower. In general, the industrial structure upgrading of Beijing was on the rise in the 3 years. In 2009, 2015 and 2020, the upgrading level of central areas, such as Dongcheng District, Xicheng District, Chaoyang District, Haidian District, Fengtai District and Shijingshan District was at a high level, while that of surrounding areas was at a low level. As shown in Table 2, the industrial structure upgrading level of each district in Beijing has been improved to some extent in 2009, 2015 and 2020. The industrial structure upgrading level of Dongcheng District has exceeded 7.8 in all 3 years whereas that of Xicheng District exceeded 7.8 for the first time in 2020. Also in 2020, the industrial structure upgrading level of Chaoyang District and Haidian District was between 7.7 and 7.8 while that of Fengtai District and Shijingshan District was between 7.6 and 7.7, which was followed by that of Mentougou District, Shunyi District and Yanqing District, between 7.4 and 7.5; meanwhile the industrial structure upgrading level of Changping District, Daxing District, Fangshan District, Huairou District, Miyun District, Pinggu District and Tongzhou District was lower than 7.4. The results show the significant effect of industrial transformation of each district in Beijing and the industrial structure upgrading level of Beijing has been remarkably improved.
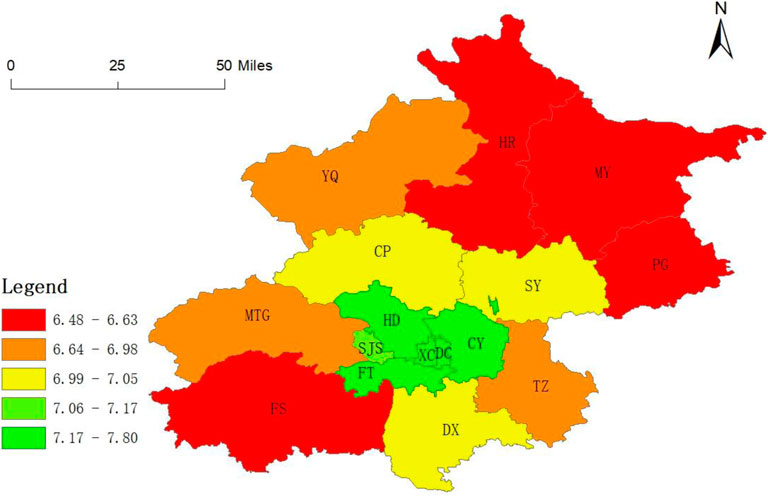
FIGURE 5. Distribution of industrial structure upgrading level of Beijing Districts in 2009.
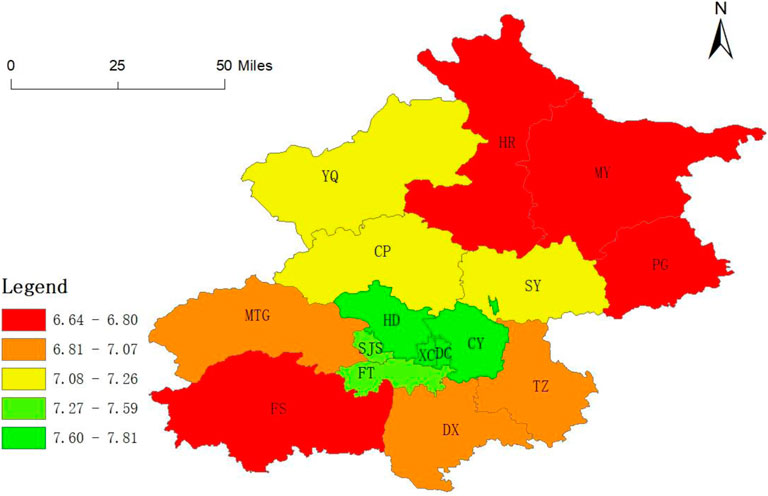
FIGURE 6. Distribution of industrial structure upgrading level of Beijing Districts in 2015.
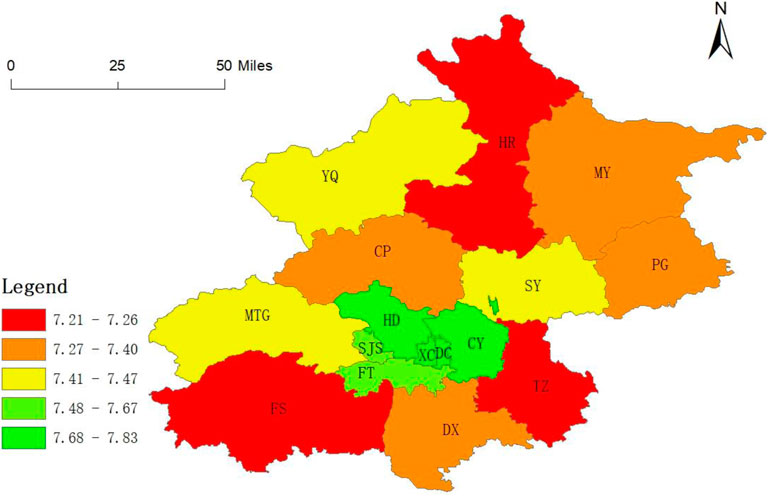
FIGURE 7. Distribution of industrial structure upgrading level of Beijing Districts in 2020.
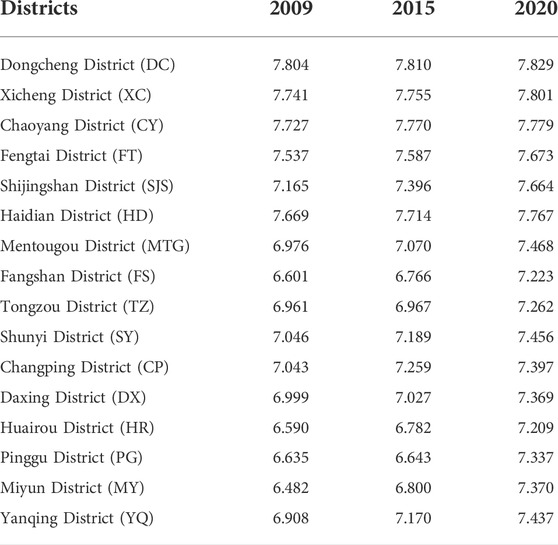
TABLE 2. Industrial structure upgrading level of each district in Beijing in 2009, 2015 and 2020.
This study utilizes Moran scatterplot to explore the spatial agglomeration of carbon emission intensity and industrial structure upgrading in each district of Beijing. The results are shown from Figures 8,–13.
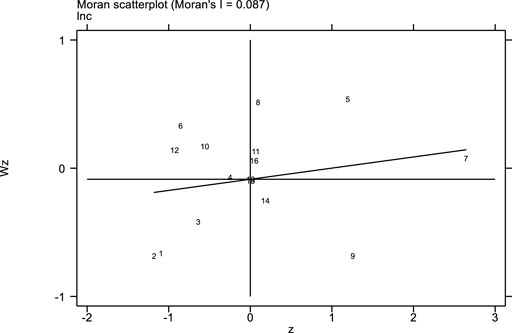
FIGURE 8. Moran scatterplot of carbon emission intensity in 2009.
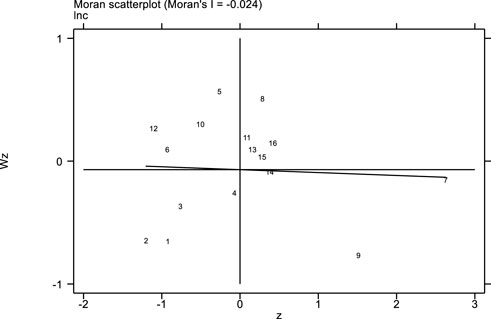
FIGURE 9. Moran scatterplot of carbon emission intensity in 2015.
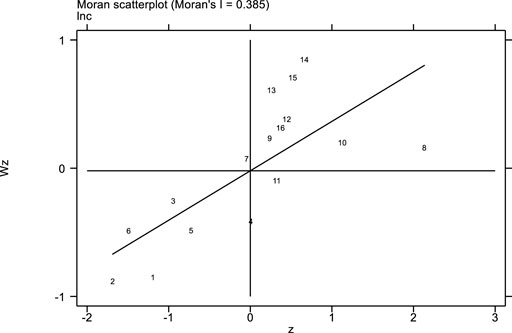
FIGURE 10. Moran scatterplot of carbon emission intensity in 2020.
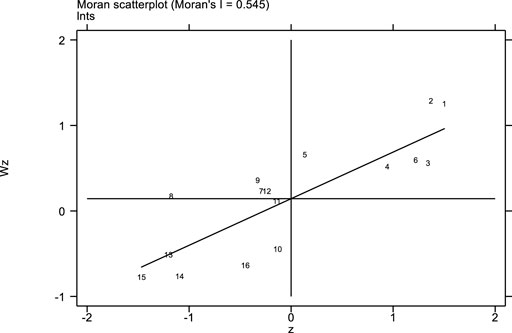
FIGURE 11. Moran scatterplot map of industrial structure upgrading in 2009.
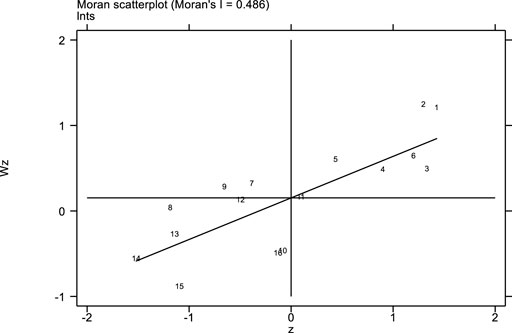
FIGURE 12. Moran scatterplot map of industrial structure upgrading in 2015.
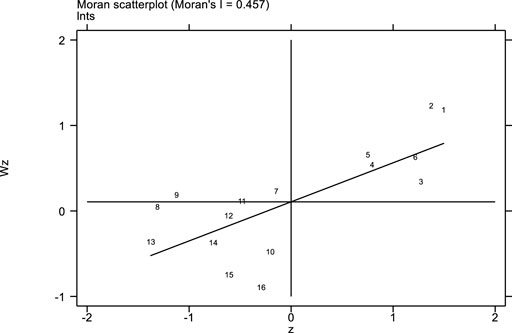
FIGURE 13. Moran scatterplot map of industrial structure upgrading in 2020.
According to our study, the carbon emission intensity of most districts of Beijing was high-high or low-low agglomeration, while that of several districts was high-low or low-high agglomeration. It should be noted that in 2020, the industrial structure upgrading of all the districts was basically high-high and low-low agglomeration. Specifically, in 2009, Dongcheng District, Xicheng District and Chaoyang District were in low-low agglomeration areas, that is, carbon emission intensity of these areas and their neighboring areas was low. Shijingshan District, Mentougou District, Fangshan District, Changping District and Yanqing District were in high-high agglomeration area, that is, these areas and their adjacent areas had higher carbon emission intensity. The carbon emission intensity of Haidian district, Shunyi District and Daxing District was in low-high agglomeration area, that is, the carbon emission intensity of these areas was low but that of neighboring areas was high. The regions such as Tongzhou District and Pinggu District were in the high-low agglomeration area, that is, the carbon emission intensity of these regions was high while the carbon emission intensity of their neighboring regions was low. The change in 2015 was not very obvious compared with that in 2009. It is worth mentioning that the spatial correlation in 2015 was negatively correlated. In 2020, the spatial agglomeration type of each district in Beijing has changed greatly and the agglomeration was obvious, mainly low-low and high-high agglomeration. The carbon emission intensity of Dongcheng District, Xicheng District, Chaoyang District, Shijingshan District and Haidian District was in low-low agglomeration area, that is, the carbon emission intensity of both these areas and their neighboring areas was low. The carbon emission intensity of Fangshan district, Tongzhou District, Shunyi District, Daxing District, Huairou District, Pinggu District, Miyun District and Yanqing District was in high-high agglomeration area, that is, the carbon emission intensity of both these areas and their neighboring areas was high.
Note: the figures representing the districts of Beijing as follows: 1 Dongcheng District, 2 Xicheng District, 3 Chaoyang District, 4 Fengtai District, 5 Shijingshan District, 6 Haidian District, 7 Mentougou District, 8 Fangshan District, 9 Tongzhou District, 10 Shunyi District, 11 Changping District, 12 Daxing District, 13 Huairou District, 14 Pinggu District, 15 Miyun District, 16 Yanqing District. The Same below.
Then the spatial agglomeration of industrial structure upgrading in each district of Beijing is analyzed. On the whole, most regions were in the areas of high-high and low-low agglomeration, a few regions were in low-high agglomeration area and no region was in high-low agglomeration area. Specifically, in 2009, Dongcheng District, Xicheng District, Chaoyang District, Fengtai District, Shijingshan District and Haidian District were in high-high agglomeration areas, that is, these areas and their adjacent areas had a high level of industrial structure upgrading; Mentougou District, Fangshan District, Tongzhou District and Daxing District were in low-high agglomeration areas, that is, the industrial structure upgrading level of these areas was lower while that of their neighboring areas was higher. Shunyi District, Changping District, Huairou District, Pinggu District, Miyun District and Yanqing District were in low-low agglomeration area, that is, both these areas and their neighboring areas had a lower level of industrial structure upgrading. In 2015, Mentougou District and Tongzhou District were in low-high agglomeration area, while other areas were in high-high or low-low agglomeration area. In 2020, there was no significant change in the spatial agglomeration of industrial structure upgrading in each district of Beijing since there was no significant change in terms of district and number of districts in each quadrant.
Columns 2 to 6 of Table 3 show the estimation results of fixed effect by Spatial Durbin Model, random effect estimation by Spatial Durbin Model, fixed effect estimation by Spatial Autocorrelation Model, fixed effect estimation by Spatial Autoregressive Model, and random effect estimation by Spatial Autoregressive Model respectively. The spatial weight matrix used for the estimated results in the table is Spatial Adjacency Matrix (Queen Adjacency). The same below.
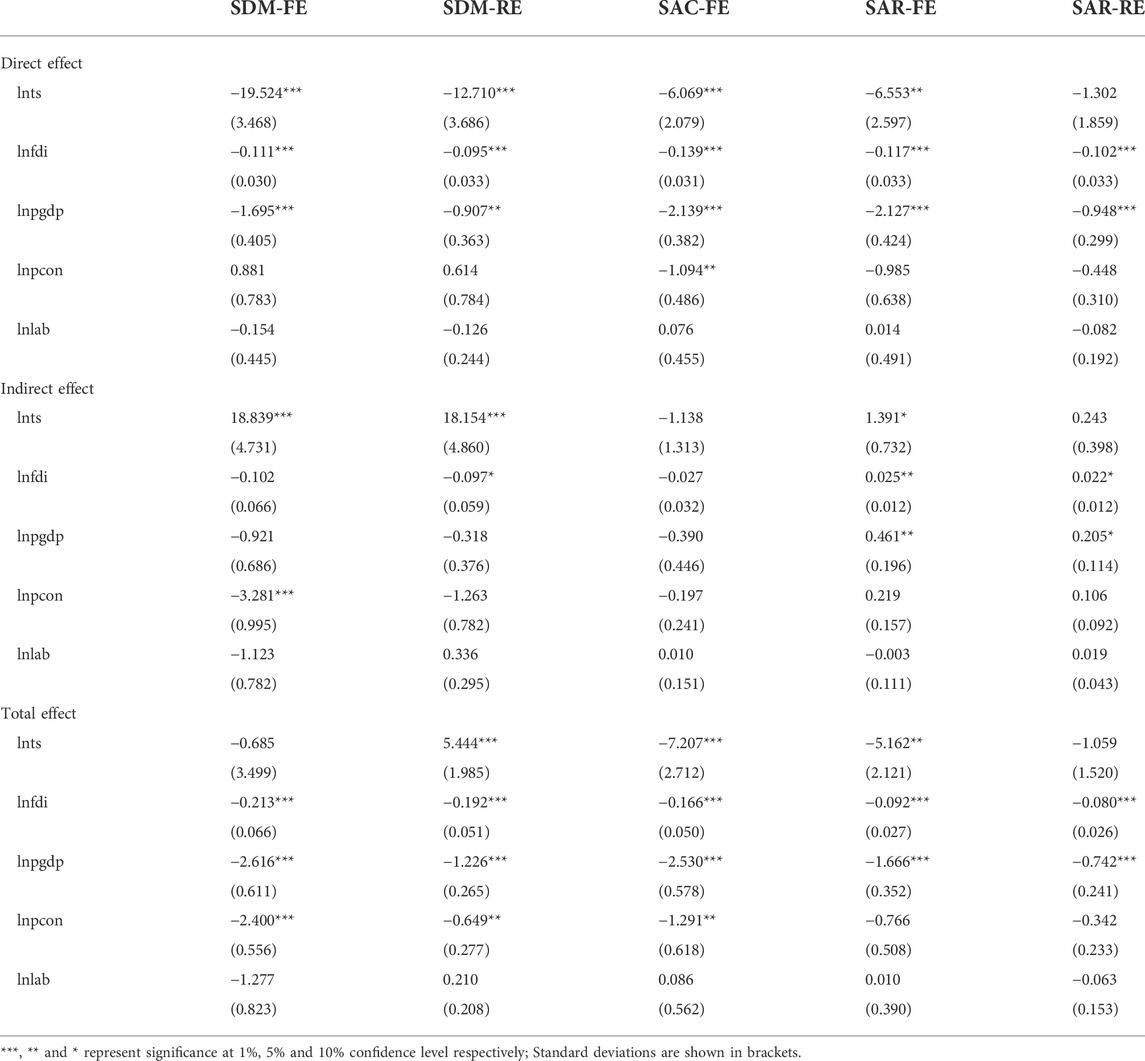
TABLE 3. Estimated results of spatial spillover.
In the five spatial models, the regression coefficient of the direct effect of industrial structure upgrading on carbon emission intensity is negative and significant at different levels, indicating that the industrial structure upgrading in a certain region has a significant inhibitory effect on the local carbon emission intensity. In terms of indirect effect of the five models, those of SDM-FE, SDM-RE and SAR-FE models are positively significant at different levels, indicating that the industrial structure upgrading in neighboring areas has a significant promoting effect on local carbon emission intensity. In terms of total effect, that of the five models presents positive or negative significance, indicating that the industrial structure upgrading levels of local and neighboring areas influence local carbon emission intensity at the same time, and the actual impact should be judged by the specific levels of the two.
Investment level and economic development level have similar effects on carbon emission intensity, therefore this study only selects investment level for analysis. In the five models, the direct effect of investment level on carbon emission intensity is significantly negative at the significance level of 1%, indicating that the increase of investment level has a significant inhibitory effect on local carbon emission intensity. The indirect effect of investment level on carbon emission intensity has both positive and negative coefficients in the five models and the significance level is not obvious, indicating that the improvement of investment level in neighboring areas has no obvious effect on the carbon emission intensity in this region. The total effect of investment level on carbon emission intensity is negative in the five models and passed the significance level test, indicating that investment level has a significant inhibitory effect on local carbon emission intensity under the combined influence of local and neighboring areas.
Among the five models, the direct effect of consumption level on carbon emission intensity is significantly negative only in SAC-FE model, and there is no significant effect in other models. In term of indirect effect, only in the SDM-FE model consumption level has a significantly negative effect on carbon emission intensity, while in the other models it has no significant effect. In term of total effect, the regression results of all the five models show that the influence coefficient of consumption level on carbon emission intensity is negative and is significant only in SDM-FE, SDM-RE and SAC-FE models.
The direct effect, indirect effect and total effect of labor input level on carbon emission intensity are not significant in the regression results of the five models and there are both positive and negative regression coefficients, indicating that the improvement of labor input level in both local and neighboring regions has no obvious inhibitory effect on local carbon emission intensity.
After the regression results of five spatial econometric models shown in Table 3, we conduct a model test to select the model suitable for this study. Fixed-effect models are more suitable since the research objects of spatial econometrics are mostly uninterrupted Spatio-Temporal data. Therefore, this study selects from SDM-FE, SAR-FE and SAC-FE econometric models and the test results are shown in Table 4. First, we use the LR test and Wald test to select between SDM-FE and SAR-FE. The test results reject the null hypothesis that SDM could degenerate into SAR, indicating that SDM-FE should be chosen out of the two. Then we make choice between SDM-FE and SAC-FE by AIC and BIC information criteria. The results show that both the AIC value and BIC value of SDM-FE are less than the estimated value of SAC-FE. Therefore SDM-FE is more suitable for this study.
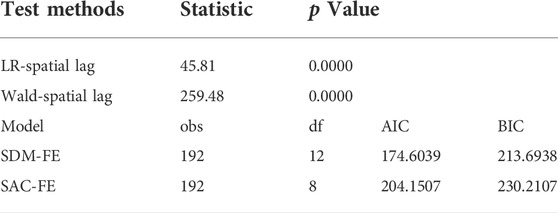
TABLE 4. Model selection test.
Since the regression results of the spatial econometric model are largely influenced by the spatial weight matrix, the robustness test is carried out by replacing the spatial weight matrix. The above results are obtained based on the Adjacency Space Weight Matrix. In order to prove the reliability of the conclusion, this study uses economic geographic matrix, distance matrix and inverse distance matrix for model estimation. The economic geographic matrix is calculated based on the per capita GDP of each district in Beijing in 2020. The distance matrix and inverse distance matrix are calculated with Euclidean Distance. As shown in Table 5, the direct effect, indirect effect and total effect of the core explanatory variables are significant, which is consistent with the conclusion above and the control variables do not change significantly, proving that the conclusion of this study is reliable.
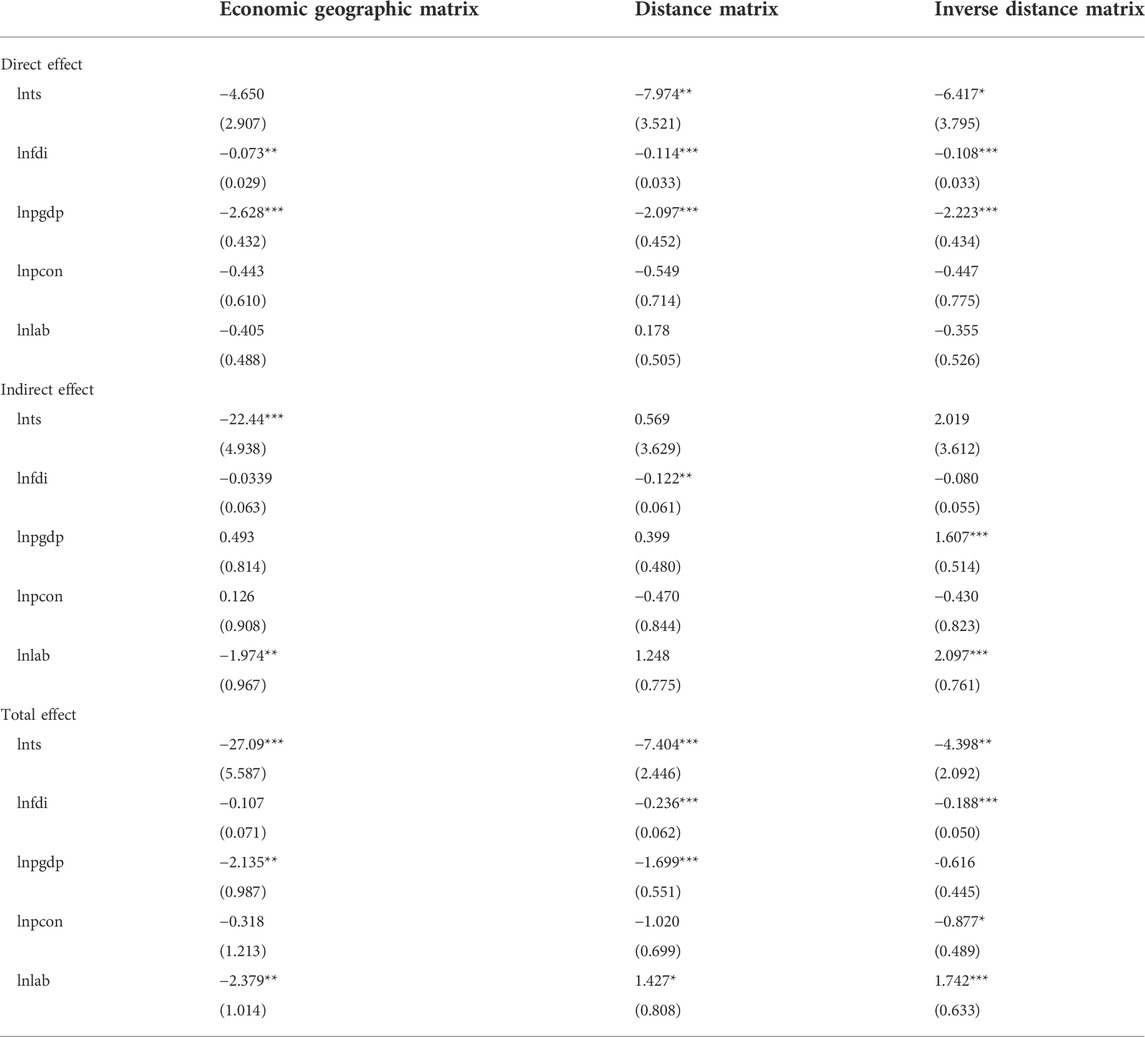
TABLE 5. Robustness test results.
Based on the panel data of each district in Beijing from 2009 to 2020, this study measures and analyzes the carbon emission intensity and industrial structure upgrading. On this basis, control variables are added to analyze the spatial spillover effect of industrial structure upgrading on carbon emission intensity, and the research conclusions are as follows:
First, the carbon emission intensity and industrial structure upgrading of each district in Beijing showed an obvious spatio-temporal evolution pattern from 2009 to 2020. The spatial distribution of carbon emission intensity and industrial structure upgrading in 16 districts of Beijing are shown in Figures 2,–7. More specifically, in the 3 years of 2009, 2015 and 2020, the carbon emission intensity in most areas showed a downward trend, indicating that Beijing has achieved phased results in carbon emission reduction. The carbon emission intensity dropped remarkably in some districts, indicating that the carbon emission reduction reform in Beijing has achieved significant results. The industrial structure upgrading level in all districts has been improved to some extent, indicating that the industrial transformation in China has also achieved remarkable results. From the perspective of space, both the carbon emission intensity and the industrial structure upgrading of Beijing showed a radial pattern of development. The areas with low carbon emission intensity in Beijing were mainly agglomerated in Dongcheng District, Xicheng District and their adjacent districts. Then the carbon emission intensity gradually increased towards the surrounding areas. The industrial structure upgrading of Beijing had similar distribution characteristics as carbon emission intensity with radial pattern: the central area was better than the surrounding ones. Through the analysis of data of these three years, it can be inferred that all of the districts of Beijing have been constantly reducing carbon emissions and optimizing the industrial structure.
Second, spatial spillover regression results show that the local industrial structure upgrading has significant inhibitory effect on local carbon emission intensity; the industrial structure upgrading in neighboring areas plays a significant role in decreasing local carbon emission intensity; the industrial structure upgrading levels of local and neighboring areas influence local carbon emission intensity at the same time and the actual impact should be judged by the specific levels of the two. The improvement of local investment level and economic development level has a significant inhibitory effect on local carbon emission intensity, while the improvement of neighboring investment level and economic development level has no obvious effect on local carbon emission intensity. The increase of local consumption level has no obvious inhibitory effect on local carbon emission intensity, while the increase of neighboring consumption level has a significantly negative effect on local carbon emission intensity. The direct effect, indirect effect and total effect of labor input level on carbon emission intensity are not significant in the regression results of the model and there are both positive and negative regression coefficients, indicating that the improvement of local and neighboring labor input level has no obvious inhibitory effect on local carbon emission intensity. According to the analysis results of spatial spillover effect, the influence of industrial structure upgrading on carbon emission intensity in Beijing varies among the districts and presents obvious spatial spillover effect.
However, this study has two limitations. First, this study takes the districts of Beijing as the research object which does not take into account the influence of surrounding provinces and cities on Beijing. And it is impossible to exclude these influencing factors from the study. Second, the impact of industrial structure upgrading on carbon emission intensity in each district of Beijing from 2009 to 2020. However, there is impact difference in different development stages and this study does not conduct in-depth discussion on this impact difference.
In response to the global climate change, it is a vital challenge for China to coordinate economic development, industrial transformation and environmental protection on its way to “carbon peaking and carbon neutrality goals”. Beijing is the center of scientific and technological innovation and the leading area of the reform and development of industrial structure in China. To some extent, the development of the industrial structure of Beijing can represent the reform direction of other regions in China in the future. The industrial structure upgrading and the optimization of carbon emission intensity in Beijing have important reference significance for China to achieve the goal of “carbon peaking and carbon neutrality goals”. Based on the above analysis results, suggestions are proposed as follows:
First, the carbon emission intensity and industrial structure upgrading of Beijing have a fair development condition. In 2020, the carbon emission intensity of most districts in Beijing is below 3, and the industrial structure upgrading level of them is above 7.2. It is worth mentioning that the carbon emission reduction in Mentougou District from 2009 to 2020 is remarkable, and other cities may use the experience of this district for reference in policy-making. Therefore, it is necessary to continuously develop low-carbon technologies and promote scientific and technological innovation of traditional energy industry, thus effectively promoting the green and low-carbon transformation of the industry and improving the use efficiency and economic value of energy. For the surrounding areas of Beijing, the policymakers should put focus on optimizing the industrial structure through promoting clean production and changing the energy consumption structure dominated by high consumption and high pollution, then they can achieve the goal of the substantive transformation of economic growth mode. For the central area of Beijing, the cultivation and development of emerging industries and circular economy should be continued, realizing the green and low-carbon growth goals with equal emphasis on quality and efficiency.
Second, each district in Beijing should continue to speed up the pace of transformation and upgrading of industry. On the one hand, the transformation and upgrading of traditional industries should be encouraged to improve the industry efficiency so that the “low energy consumption-high output” can be achieved as soon as possible. Meanwhile, it is necessary to speed up the formation of knowledge- and technology-intensive industry, such as the strategic emerging industries and high technology industries. On the other hand, investment in scientific and technological research and development should be increased to improve the current energy structure. In this way, the optimization of industrial structure of Beijing can be facilitated to drive the reduction of carbon emission intensity through a coupling effect.
Third, the government of Beijing should fully play the role of macro-control and match each district with specific carbon reduction policies according to the regional economic development and industrial structure level. At the same time, the spatial interaction of carbon intensity should also be considered to achieve a reasonable and orderly pattern of central area driving the development of surrounding areas. In this way, the completion of “carbon peaking and carbon neutrality goals” can be effectively guaranteed while developing the economy.
The descriptive statistics of the original data presented in the study is included in the appendix of the paper. For further inquiries, please contact the corresponding author.
BS: Conceptualization, Methodology, Software, Formal analysis, Investigation, Writing—original draft, Writing—review and editing, Visualization, Supervision. RW: Methodology, Formal analysis, Data curation, Writing—original draft, Writing—review and editing. RZ: Conceptualization, Formal analysis, Investigation, Writing—original draft, Writing—review and editing, Visualization, Supervision. ZZ: Literature retrieval, writing-original draft.
This research was funded by Humanities and Social Sciences Foundation of Ministry of Education of China (Grant No. 19YJCGAT004), National Social Science Foundation of China (Grant No. 20BGJ026), and the project of “Culture, Port Culture and the Land Port Areas in Consolidating the Sense of Community for the Chinese Nation’’ by Minzu University of China (MUC) (Grant No. 2021MDZL15).
We thank all participants enrolled in this study for their collaboration. All authors have read and agreed to the published version of the manuscript.
The authors declare that the research was conducted in the absence of any commercial or financial relationships that could be construed as a potential conflict of interest.
All claims expressed in this article are solely those of the authors and do not necessarily represent those of their affiliated organizations, or those of the publisher, the editors and the reviewers. Any product that may be evaluated in this article, or claim that may be made by its manufacturer, is not guaranteed or endorsed by the publisher.
1http://tjj.beijing.gov.cn/tjsj_31433/
2https://www.epsnet.com.cn/index.html#/Index
Ang, B. W., Zhang, F. Q., and Choi, K. H. (1998). Factorizing changes in energy and environmental indicators through decomposition. Energy 23, 489–495. doi:10.1016/s0360-5442(98)00016-4
Anselin, L. (1995). Local indicators of spatial association—Lisa. Geogr. Anal. 27, 93–115. doi:10.1111/j.1538-4632.1995.tb00338.x
Anselin, L. (2013). Spatial econometrics: Methods and models. Berlin/Heidelberg: Springer Science & Business Media.
Auffhammer, M., and Carson, R. T. (2008). Forecasting the path of China’s CO2 emissions using province-level information. J. Environ. Econ. Manage. 55, 229–247. doi:10.1016/j.jeem.2007.10.002
Cheng, Z., Li, L., and Liu, J. (2018). Industrial structure, technical progress and carbon intensity in China's provinces. Renew. Sustain. Energy Rev. 81, 2935–2946. doi:10.1016/j.rser.2017.06.103
Cliff, A. D., Ord, J. K., Cliff, A., and Ord, J. K. (1981). Spatial processes, models and applications, 1981. London: Pion. Chapter 2.
Dormann C, F., McPherson J, M., Araújo M, B., Bivand, R., Bolliger, J., Carl, G., et al. (2007). Methods to account for spatial autocorrelation in the analysis of species distributional data: a review. Ecography 30 (5), 609–628. [J]. doi:10.1111/j.2007.0906-7590.05171.x
Fan, Y., Liu, L. C., Wu, G., Tsai, H. T., and Wei, Y. M. (2007). Changes in carbon intensity in China: Empirical findings from 1980–2003. Ecol. Econ. 62 (3-4), 683–691. doi:10.1016/j.ecolecon.2006.08.016
Fu, L. H. (2010). Empirical research on industrial structure and economic growth. Stat. Res. 27 (8), 79–81. [J]. doi:10.19343/j.cnki.11-1302/c.2010.08.011
Hanif, I., Raza, S. M. F., Gago-de-Santos, P., and Abbas, Q. (2019). Fossil fuels, foreign direct investment, and economic growth have triggered CO2 emissions in emerging asian economies: some empirical evidence. Energy 171 (3), 493–501. doi:10.1016/j.energy.2019.01.011
IPCC (2007). Climate change 2007: the physical science basis of climate change, contribution of working group I to the fourth assessment report of the intergovernmental panel on climate change. Geneva, Switzerland: Intergovernmental Panel on Climate Change.
LeSage, J., and Pace, R. K. (2009). Introduction to spatial econometrics. London, UK: Chapman and Hall/CRC. [M].
Li, M. (2010). Decomposing the change of CO2 emissions in China: a distance function approach. Ecol. Econ. 70, 77–85. doi:10.1016/j.ecolecon.2010.07.034
Meng, L., Guo, J. E., Chai, J., and Zhang, Z. K. (2011). China’s regional CO2 emissions: characteristics, inter-regional transfer and emission reduction policies. Energy Policy 39, 6136–6144. doi:10.1016/j.enpol.2011.07.013
Moran, P. A. (1950). A test for the serial independence of residuals. Biometrika 37, 178–181. doi:10.1093/biomet/37.1-2.178
Paul, S., and Bhattacharya, R. N. (2004). CO2 emission from energy use in India: a decomposition analysis. Energy Policy 32, 585–593. doi:10.1016/s0301-4215(02)00311-7
Pinto, E. S. O., Santos, G. R., and Oliveira, F. L. P. (2014). Análise espaço-temporal aplicada às ocorrências de hipertensão e diabetes nos municípios do estado de Minas Gerais. Rev. Bras. Biom. 32, 238–266.
Yu, N., De Jong, M., Storm, S., and Mi, J. (2013). Spatial spillover effects of transport infrastructure: evidence from Chinese regions. J. Transp. Geogr. 28, 56–66. doi:10.1016/j.jtrangeo.2012.10.009
Zhang, C. G., and Lin, Y. (2012). Panel estimation for urbanization, energy consumption and CO2 emissions: a regional analysis in China. Energy Policy 49, 488–498. doi:10.1016/j.enpol.2012.06.048
Zhang, J., Jiang, H., Liu, G., and Zeng, W. (2018). A study on the contribution of industrial restructuring to reduction of carbon emissions in China during the five Five-Year Plan periods. J. Clean. Prod. 176, 629–635. doi:10.1016/j.jclepro.2017.12.133
Zhang, Z. (2000). Decoupling China’s carbon emissions increase from economic growth: An economic analysis and policy implications. World Dev. 28 (4), 739–752. doi:10.1016/s0305-750x(99)00154-0
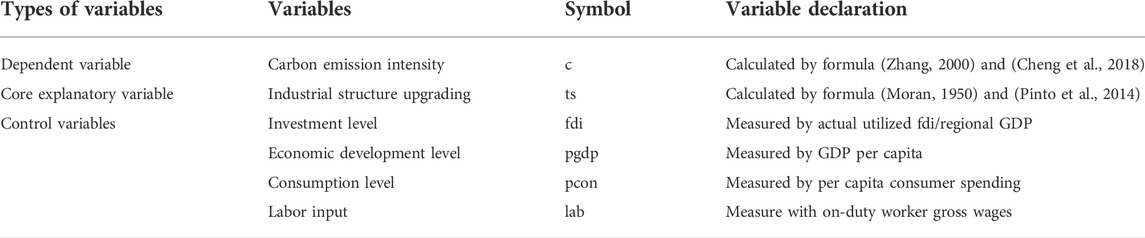
TABLE A1. Appendix A is Variable declaration.
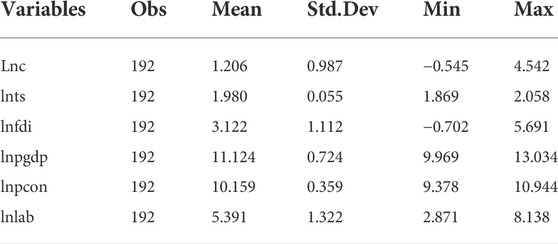
TABLE B1. Appendix B is Statistical description of variables.
Keywords: industrial structure upgrading, carbon emission intensity, spatial spillover effect, spatial econometric model, moran scatterplot
Citation: Shi B, Wang R, Zhe R and Zhai Z (2022) Spatial spillover effect of industrial structure upgrading on carbon emission intensity: panel data evidences from Beijing, China. Front. Environ. Sci. 10:963960. doi: 10.3389/fenvs.2022.963960
Received: 08 June 2022; Accepted: 04 July 2022;
Published: 23 August 2022.
Edited by:
Fuzhong Chen, University of International Business and Economics, ChinaReviewed by:
Asif Razzaq, Ilma University, PakistanCopyright © 2022 Shi, Wang, Zhe and Zhai. This is an open-access article distributed under the terms of the Creative Commons Attribution License (CC BY). The use, distribution or reproduction in other forums is permitted, provided the original author(s) and the copyright owner(s) are credited and that the original publication in this journal is cited, in accordance with accepted academic practice. No use, distribution or reproduction is permitted which does not comply with these terms.
*Correspondence: Ru Zhe, emhlcnVAbXVjLmVkdS5jbg==
Disclaimer: All claims expressed in this article are solely those of the authors and do not necessarily represent those of their affiliated organizations, or those of the publisher, the editors and the reviewers. Any product that may be evaluated in this article or claim that may be made by its manufacturer is not guaranteed or endorsed by the publisher.
Research integrity at Frontiers
Learn more about the work of our research integrity team to safeguard the quality of each article we publish.