 Liang Caiyi
 Li Xiaoyong
 Liu Zhenyu1
95% of researchers rate our articles as excellent or good
Learn more about the work of our research integrity team to safeguard the quality of each article we publish.
Find out more
ORIGINAL RESEARCH article
Front. Environ. Sci. , 07 September 2022
Sec. Environmental Economics and Management
Volume 10 - 2022 | https://doi.org/10.3389/fenvs.2022.963264
This article is part of the Research Topic Green Energy Technologies for Environmental Sustainability: Drivers, Challenges, and Future Aspects View all 27 articles
The growth of the e-commerce industry brings considerable waste. The Chinese government has begun to pay attention to the development of green e-commerce. We first analyze the nexus between China’s e-commerce industry and solid waste and hope to provide some insights into the development of green e-commerce. Considering the cross-sectional dependence of panel data, we adopt the second-generation panel unit root and cointegration tests. Furthermore, the empirical results from the DOLS show that the EKC quadratic curve exists in Whole & Eastern & Central & Western China. In Whole & Central & Western China, FDI will increase solid-waste emissions. In Central China, the market can significantly increase solid-waste emissions, and trade openness can reduce solid-waste emissions. The proportion of Eastern China’s secondary industry will substantially increase solid-waste emissions. Most of the eight major economic zones conform to the quadratic EKC curve except for three economic zones. The situation is as follows, In the Middle Reaches of the Yellow River, the development of e-commerce brings monotonically increasing solid-waste discharge. The EKC relationship does not exist in the Yangtze River’s middle reaches and Northwest Economic Zones. Research findings provide a perspective and basis for China to make regional green regulations to reduce the discharge of solid waste from e-commerce and open the pathway of green development of e-commerce.
Online shopping in China has become indispensable to people’s daily activities. According to the China Bureau of statistics, in 2018, China’s online retail sales of physical goods reached 7,019.8 billion yuan, accounting for 18% of the total retail sales of consumer goods in society. China’s e-commerce industry is booming and has become an essential source of China’s economic growth. At the same time, it also has considerable potential to reduce solid waste pollution. The application of big network data has promoted the business model and increased the participation of e-commerce platform customers (Sun et al., 2016; Huang and Benyoucef 2013), resulting in a surge in online transactions (Chiu et al., 2014). Although people’s life has been much more convenient, it has brought a vast increment of solid waste. With the rapid development of e-commerce in China and the increasingly diversified consumer demand, excessive packaging is very serious. In all aspects of warehousing, transportation, and sales, merchants must provide protective packaging to cope with bumps and bad weather during logistics and transportation. But over-packaging is usually a deliberate attempt by merchants to showcase the value of their products with beautiful packaging. Excessive packaging has become a significant contributor to everyday waste. The volume of some commodities is originally small. However, the packaging is several times or dozens of times the volume of the commodity itself, resulting in unnecessary waste. Especially e-commerce, a small thing, a big package is coming. It reduces the cost of physical stores but increases the contribution to social solid waste, which has attracted the attention of the Chinese government.
The development of online shopping has led to the rapid growth of the express industry. Four of every five Express items sent or received by Chinese people are related to online shopping (Greenpeace, 2019). The express industry is the biggest beneficiary of China’s fast-growing online shopping industry chain, and the output and use of express packaging have also surged simultaneously. The enormous environmental cost behind the growth miracle of China’s e-commerce and express industry has attracted the attention of three ecological protection organizations, including Greenpeace, to get rid of plastic binding and China Environmental Protection Federation (Greenpeace, 2019). Greenpeace (2020) combed the existing packaging waste data of the e-commerce industry.
About 99% of express plastic packaging is not recycled but mixed with domestic waste and buried or incinerated. Taking the tape as an example, the winding amount of carton wrapping tape is about 1.5–2 m, and most of them are wound repeatedly. In 2018, the total tape consumption in China exceeded 39.8 billion meters, with 81,000 tons, and 440 million tape cores were indirectly consumed, weighing 21,000 tons. The consumption of various express packaging materials in China increased from 21,000 tons in 2000 to 9.412 million tons in 2018. In China’s megacities, the increment of express packaging waste has accounted for 93% of domestic waste and 85–90% in some large cities. Suppose adequate control measures are not implemented, according to the current development speed of the express industry. In that case, China’s consumption of express packaging materials will reach 41.27 million tons by 2025, bringing a considerable resource burden and environmental pressure. According to the investigation and research of the project team, cartons account for about 44% (by pieces) of express packaging materials, and plastic bags are the packaging materials second only to cartons, accounting for 34%. The rest includes cartons (plastic bags with cartons), woven bags, foam boxes, and file bags1. Clothing has the highest retail proportion in the e-commerce industry (Greenpeace, 2017). The seller’s storage of goods will also produce a certain amount of solid waste pollution. For example, waste clothes sold at low prices due to e-commerce platform marketing methods are also a huge source of pollution.
Chinese e-commerce is different from western. Its supply chain is based in the Chinese market, so a transaction surge will encourage manufacturers to increase production, affecting the industry behind e-commerce and even the country’s industrial structure. On the surface, the e-commerce industry includes e-commerce platform enterprises because users purchase products with demands and need to solve their demands for users. The process of serving users belongs to the category of the service industry. Although e-commerce platform enterprises do not belong to high pollution, the whole transaction process relies on the Internet to complete. A large amount of electronic data will be generated before, during, and after the transaction. The storage and processing of these data need a large number of electrical equipment to complete, producing a large amount of electronic solid waste pollution. In addition, in the logistics link of the transaction, there will be many express delivery orders and packages, which are important sources of solid waste pollution for e-commerce platform enterprises. But China’s e-commerce industry is more than that. It is a comprehensive industry. On the surface, it looks like the tertiary industry, namely the sales and service industry. Behind it, the tertiary industry has a wider scope (such as the tourism industry), and it also involves the primary and secondary industries.
As a result, irrational shopping by Chinese consumers leads to excessive mass production on the production side (Greenpeace, 2017), which in turn consumes resources and generates waste pollution. On the consumer side, frequent shopping due to low prices leads to massive castoff (for example, clothing occupying the giant plate of the online shopping platform brings a large number of second-hand clothing). In terms of express packaging, front-end e-commerce platforms, express companies, and sites generally tend to be over-packaged; At the back end, the carton recycling system of express stations is not sound. Elderly residents, cleaning personnel, and mobile waste pickers are the main recycling forces of paper express packaging. Plastic express packaging with a low recycling price is unused but mixed with household garbage into landfills or incinerators. From the perspective of the cost and benefit of landfill and incineration treatment, express packaging combined with domestic waste treatment causes a surge in social management costs. No matter landfill or incineration, it cannot solve the increasingly urgent problem of waste growth. The direct and indirect solid waste pollution (industrial solid waste, municipal solid waste, and hazardous waste) caused by e-commerce is beyond imagination. It is not limited to the excessive express delivery packaging, which is enough to cause a severe “explosive” environmental burden.
On the other hand, under the guidance of China’s green e-commerce policy, the e-commerce platform is also trying to realize the environmental protection policy. Reverse logistics recover electronic products, waste clothes, and waste furniture from second-hand goods, gradually build a recycling system of renewable resources, encourage the green behavior of the consumption end of the platform, and call on the green operation of the sale platforms. These behaviors of e-commerce platforms reduce solid waste pollution to a certain extent.
China’s sustainable development has always been a research hotspot (Khan et al., 2020; Hu et al., 2021; Jin and Chen, 2022). There is no research on China’s e-commerce on solid waste emission from the macro level. The research at the macro level has a particular guiding significance for decision-makers in implementing green e-commerce policy. There are significant differences between China and the West regarding the e-commerce environment and distribution modes (Hu et al., 2021), such as logistics system (Zhang and Zhang 2013), packaging process, and promotion mode. Due to the unique characteristics of the Chinese economy, western research does not apply to China. Significant differences exist in China’s economic development level and network penetration.
Given the above, we limit China’s perspective and summarize the rules from a regional perspective. The Environmental Kuznets Curve (EKC) is one of the required fields of environmental economics research. It has become a general tool for investigating the relationship between economic growth and environmental quality within different frameworks (Halliru et al., 2020; Hu et al., 2021). Due to the heterogeneity of China’s provinces (Ye et al., 2022), this paper attempts to summarize the rules from a regional perspective for the first time and use panel data to explore the EKC relationship between China’s e-commerce industry and solid-waste emission, divided into eastern, central, Western, and eight economies. The research results only apply to China’s e-commerce and may not be relevant to western countries. In this paper, we explore whether EKC between e-commerce and solid waste emission exists and at what stage of development. The industrial sector tries to improve environmental protection without compromising economic competitiveness (Lin et al., 2022; Romero-Castro et al., 2022). The e-commerce industry promotes China’s economic growth; we try to explain it by examining the quantitative relationship between e-commerce and solid-waste emission. These issues are crucial for Chinese policymakers in clarifying the impact of e-commerce on the regional environment and economic growth.
It is widely accepted that B2C e-commerce is terrible for the environment, especially using cardboard packaging. Packaging materials used for product realization and delivery in logistics networks is one of the critical points of waste generation in e-commerce (Fichter, 2002). At the same time, trucks, air freight, packaging, fuel production, and book production also produce hazardous waste (Matthews et al., 2001). Traditional bookstores require less packaging to distribute books than online bookstores (Borggren et al., 2011). The number of wasted products and the number of returned products brought by B2C e-commerce (Mokhtarian, 2004; Guo et al., 2017), and the amount of packaging required for various types of transport (Pålsson et al., 2017) (for example, domestic delivery of frozen products or fragile products). Many individual packages are mailed directly to customers or returned to merchants upon return (Srivastava, 2007) and required a great deal of protective packaging (Borggren et al., 2011; van Loon et al., 2015). Handling large quantities of small deliveries and returns increases the complexity of receiving and packaging activities and has corresponding negative environmental impacts (Sui and Rejeski, 2002). Consumers tend to buy different goods from different websites, which requires independent distribution (Carling et al., 2015). Even purchasing various items from one retailer can result in other shipments because the items are shipped from different warehouses (as opposed to offline channels, where the items are purchased once). This buying mode has caused an increase in the packaging and transportation of goods compared with offline shopping. The main areas of e-commerce logistics operations contribute to sustainability-related impacts: transportation planning and management, warehousing, packaging, and distribution network design.
On the other hand, e-commerce has a positive impact on the environment. It can be used to mitigate the potential adverse effects of environmental pollution on human development (Asongu et al., 2017) when digital downloads replace physical products (such as music CDS) (Weber et al., 2010). E-commerce may also reduce the amount of solid waste pollution. And the Internet has made possible new business models: entrepreneurs are creating electronic marketplaces and offering online services to expand product use and recycling. In e-commerce and reverse e-logistics, waste can be reduced. Restore the electronic market for surplus materials, debris, and recycled second-hand good (Mattos Nascimento et al., 2019). E-waste emission reduction may be effective if efforts are focused on the practical implementation of e-waste policies, directives, and regulations, such as expanding producer responsibility (EPR) and prepayment back charge (ARF) (Garg, 2021). E-commerce provides win-win solutions and combines business opportunities with eco-efficient services.
Reviewing the past, we can see that the research conclusions on the impact of e-commerce on waste purification are mixed. E-commerce has negative and positive effects, but the adverse effects are apparent. Green e-commerce is the trend. Scholars consider how to improve the damage and pollution caused by e-commerce from different perspectives. For example, Transportation planning and management are the most frequently covered areas in the literature (Mangiaracina et al., 2015), as e-commerce packaging patterns (Li et al., 2015; Escursell et al., 2021), logistics and transportation patterns (Muoz-Villamizar et al., 2021), consumer purchasing behavior (Rai, 2021), green closed-loop supply chain system (Guo et al., 2020). However, there is no macro-level advice for policymakers. Time series data from other fields can better summarize this phenomenon and law. However, many empirical studies on the environmental Kuznets curve (EKC). EKC tests explore an inverted U-shaped or N-shaped relationship between economic growth and solid-waste emissions, rarely involving specific industries.
Many studies have been conducted to verify whether EKC exists in different industries in different countries and emphasized the importance of green technology in the coordinated development of the environment and economy, which has always been a hot topic in academic circles. Panel data have been commonly used for EKC tests by scholars. Khan et al. (2021) investigate the validity of the U.S. Environmental Kuznets curve (EKC). A new dynamic excited autoregressive distributed lag (ARDL) model was used to investigate the validity of the EKC hypothesis in the U.S. in the short and long term. Solaymani (2022) examined the Environmental Kuznets Curve (EKC) hypothesis for Malaysia’s transport sector. It is shown that energy and environmental policymakers need to pay more attention to improving energy efficiency as Malaysia progresses towards the highest levels of income and welfare. Latif et al. (2022) explore the environmental Kuznets curve between financial development and carbon emissions in Regional Comprehensive Economic Partnership (R.C.E.P.) economies, using slope inhomogeneity, cross-sectional dependence, second-generation panel unit root test, and panel data cointegration method, results emphasize the energy efficiency brought by green technologies. Using panel cointegration and causality tests, Fareed and Pata (2022) investigated the impact of renewable and non-renewable energy consumption on economic growth in the top 10 renewable energy-consuming countries from 1970 to 2019. The findings show that green technologies for renewable energy positively impact economic growth in Brazil, UK and France. Fareed et al. (2022) studied the moderating relationship between innovation activities on financial inclusion and environmental degradation. They adopted fully modified ordinary least squares (OLS), fixed effect OLS and dynamic OLS as alternative methods to conduct robustness tests. The result emphasizes innovation activities’ role in reducing the harmful effects of aupsurge in economic activities.
To the researchers’ knowledge, there is currently no EKC test set focused on e-commerce, which could help determine the relationship between e-commerce and resource waste in this study. It may provide a reference value for the green development of e-commerce. Therefore, based on this literature, we will conduct EKC verification on the e-commerce of waste recycling.
Grossman and Krueger (1991) first explained the relationship between income inequality and economic growth with an inverted U-shaped curve. At the early stages of development, environmental pollution increased with the increase in per capita GDP; At the later stage, when income reaches the turning point, the relationship reaches a certain critical point (inflection point) and is reversed. As per capita income increases, the degree of environmental pollution gradually slows down, and the environmental quality improves (Grossman and Krueger, 1991; Selden and Daqing, 1994). Since the EKC hypothesis was put forward, many scholars have tried to verify the EKC hypothesis when studying the relationship between GDP and pollution, financial development, and pollution emissions. Scholars have used empirical analysis to prove the existence of the EKC hypothesis, and some scholars have used data from different regions or different years to verify the correctness of the EKC hypothesis. Due to various countries’ differences in economic development and structure, the conclusions obtained are different, “N" type and “U" type, researchers question their effectiveness in other countries. The particular form is as follows:
There has been a wealth of literature in the past decade based on this theory (Omri et al., 2015; Alshehry and Belloumi, 2017; Antonakakis et al., 2017; Nasir et al., 2019; Adedoyin et al., 2020). At the same time, most of EKC’s empirical research is mainly to verify the relationship between economic growth and environmental quality, and there has been a trend of extending to demonstrate the relationship between the development of specific industries and ecological quality, such as the tourism industry (Gao and Zhang, 2019).
It seems that the e-commerce industry will increase China’s solid waste emissions. We put the relationship between the two into the EKC framework to verify whether the impact of the e-commerce industry on solid waste emissions conforms to which relationship, monotonous increase or decrease, inverted U-shaped relationship, or N-shaped relationship. At the same time, we added the main control variables (lnGDP, lnpFDI, IS, and TR), and the models are as follows:
Where
Since 2000, China’s e-commerce has entered a period of stable development. Although the growth rate of the e-commerce industry has slowed as the penetration rate of e-commerce has gradually increased, with the annual growth rate of the domestic express delivery business dropping to around 25% from 50% before 2016, the growth rate is still impressive. In the country’s express delivery business, e-commerce components surged from 28 percent in 2007 to 72% in 2016. In other words, four out of every five packages sent or received by Chinese people are related to online shopping. Considering the stable period of China’s e-commerce development and the availability of e-commerce express volume data, we selected China’s panel data for 17 years. From 2001 to 2017, due to the difficulty in obtaining Tibetan data, we selected 30 provinces as samples. The data samples are from the China Statistical Yearbook (CSY) and Statistical Bulletin of Postal Industry Development (SBPID). The indicator description and data source are shown in Table 1.
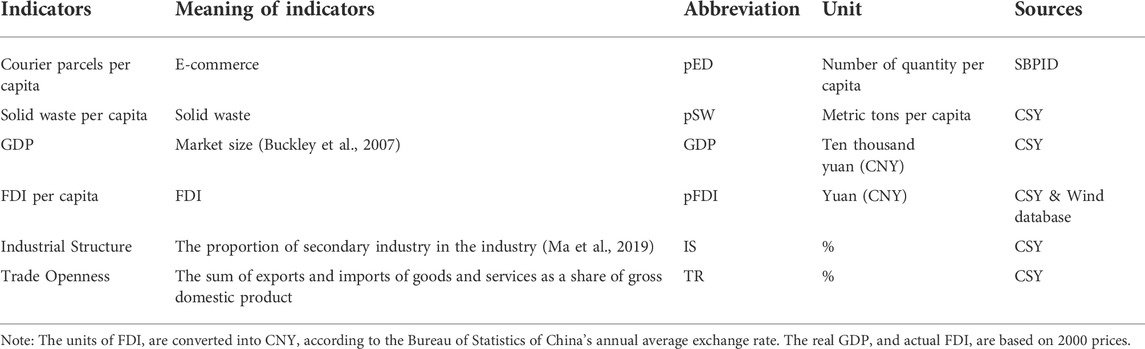
TABLE 1. Data description and sources.
China is an economic superpower. Coastal areas and inland areas have different development degrees and system environments. At present, there are some division methods. The traditional division is China’s eastern, central and western regions, as shown in Table 2. During the 11th Five-Year Plan period, the Development Research Center of the State Council (DRC) pointed out a more scientific division and issued a report. The report puts forward the concrete idea that the mainland can be divided into four blocks: eastern, central, western, and northeast, and the four blocks can be divided into eight comprehensive economic zones, as shown in Table 3.
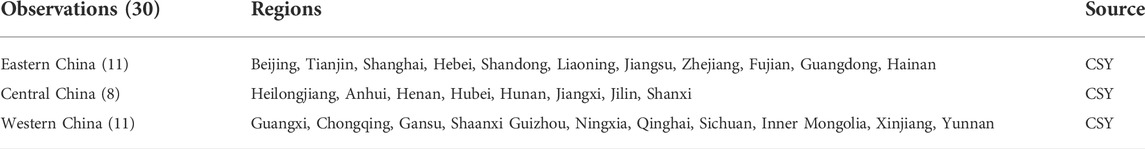
TABLE 2. The traditional division in China under investigation (excluding Tibet).
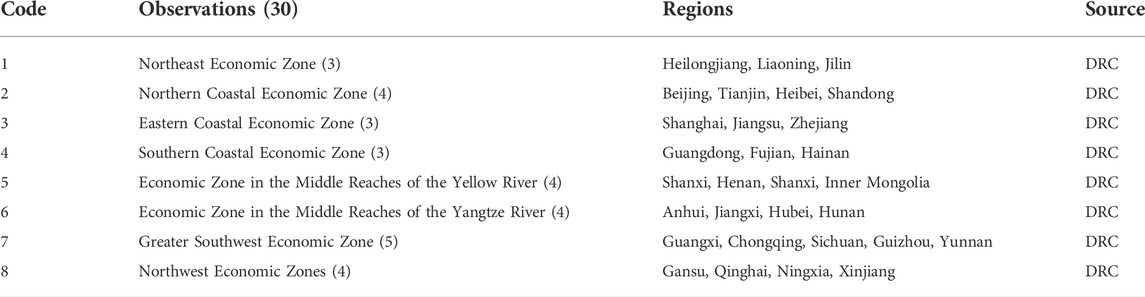
TABLE 3. Eight comprehensive economic zones in China under investigation (excluding Tibet).
As shown in Table 4, the mean solid-waste emissions per capita, carrier parcels per capita, GDP, and FDI per capita are 2.05 (metric tons), 5.39 (number of parcels), 10,008.99 (ten thousand yuan), and 898.2 (yuan), respectively.
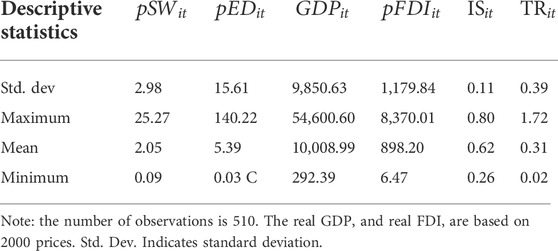
TABLE 4. Summary statistics, panel (before taking the logarithm), 2001–2017.
Most panel data is heterogeneous. Therefore, the cross-sectional independence (CD) test explores whether the error term is cross-sectionally related (Pesaran 2004). We think that the sample data may have a cross-sectional correlation, so we perform a CD test, and the test equation is as follows:
Among them, T is the period, N is the sample size, and
Time series can predict the future situation from the root of the past. Panel data has more surface and time-series data characteristics than time-series data. The unit test refers to checking whether a unit is in the series. If it is the unit root, it is a non-stationary time series. Panel unit root test continues the theory of the time-series unit root test and can more accurately test the existence of unit root (Maddala and Wu, 1999; Levin et al., 2002; Im et al., 2003).
We accepted the four first-generation unit root, LLC, IPS, Fisher ADF, and Fisher PP tests, for a real prototype. We performed panel tests under different unit root conditions. The second-generation panel unit root verifies panel data’s general heterogeneity and general plane correlation. These two problems are verified by the enlarged cross-section Dickey-Fuller (CADF) unit root test and the enlarged cross-section segmented CIPS (CIPS) unit root test. We expect CADF and CIPS tests to produce reliable results in cross-sectional dependence and heterogeneity between sample regions. It is worth noting that CADF and CIPS tests have reliable cross-sectional dependence and heterogeneity between sample countries.
The cointegration test tests whether there is a long-term equilibrium relationship between multiple unit root variables due to some economic force (Johanse, 1991; Mackinnon, 1996; Mackinnon et al., 1999; Dritsakis, 2004). A long-term equilibrium relationship means that if multiple unit root sequences have a “common random trend”, they can eliminate the random trend through the linear combination to obtain a stable linear combination (Engle and Granger, 1987). Among variables, it is not certain that there is a cointegration relationship. The cointegration relationship is also different. Multivariate cointegration tests can determine the long-term equilibrium relationship. Considering the data is heterogeneous panels, we use the Pedroni cointegration test, Kao cointegration test, and Westerlund panel cointegration test.
There are 7 test statistics in the Pedroni panel cointegration test (Pedroni, 1999; Pedroni, 2004). The Kao panel cointegration test (Kao, 1999) follows a procedure similar to the Pedroni test but includes the homogeneous cross coefficient of the first stage regressor. Westerlund panel cointegration test uses a model to take the cross-section dependence (Westerlund, 2005). The model has two panel-specific autoregressive (AR) parameters (panel-specific ar test statistics and the same ar test statistics) (Paramati et al., 2017). If there is a cointegration relationship, we can more accurately explore the existence of CKC through regression.
A cointegration test can only prove a long-term equilibrium relationship between variables. We need to get the coefficient estimation of the long-term relationship through regression. The panel cointegration relationship is only a long-term equilibrium, not a specific estimate (Kao and Chiang, 2000). proposed that the traditional OLS method be further improved in estimating non-standard distribution and error due to endogeneity and sequence correlation. FOLS is a full correction proposed by Phillips and Hansen (1990). The estimation deviation caused by system disturbance autocorrelation is solved by introducing correction factors. Dynamic OLS method (dols) is estimated by Stock and Watson (1993) panel cointegration. Introducing different leading and lagging explanatory variables into the regression equation overcomes the possible sequence correlation and endogenous problems. The estimation equation of the dynamic least squares (DLS) estimation method is given as follows:
where
The cross-section independence (CD) test tests the cross-sectional dependence of panel data. The test results are shown in Table 5. The CD values of all variables reject the original hypothesis, which indicates a cross-sectional correlation. Therefore, we adopted the first-generation unit root test (LLC, IPS, Fisher ADF, and Fisher PP tests) and the second-generation unit root test (CADF and CIPS tests) to carry out the unit root test. The results can be more reliable. Table 6 reports the results of the first-generation unit root test, which shows that all variables have unit roots but tend to be stable after the first-order difference. Table 7 reports the results of the second-generation unit root test (CADF and CIPS tests). Both tests consider cross-sectional dependence and heterogeneity, so the results are more reliable. Both tests indicate that the variables have unit roots but tend to be stable after the first-order difference and significant at the 1% level.
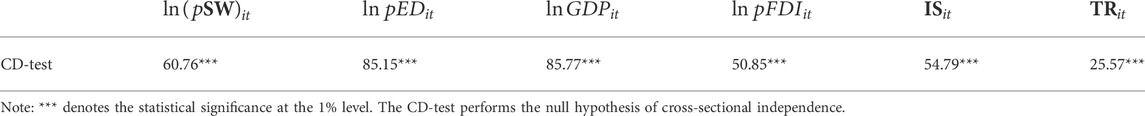
TABLE 5. Results from cross-sectional independence test.
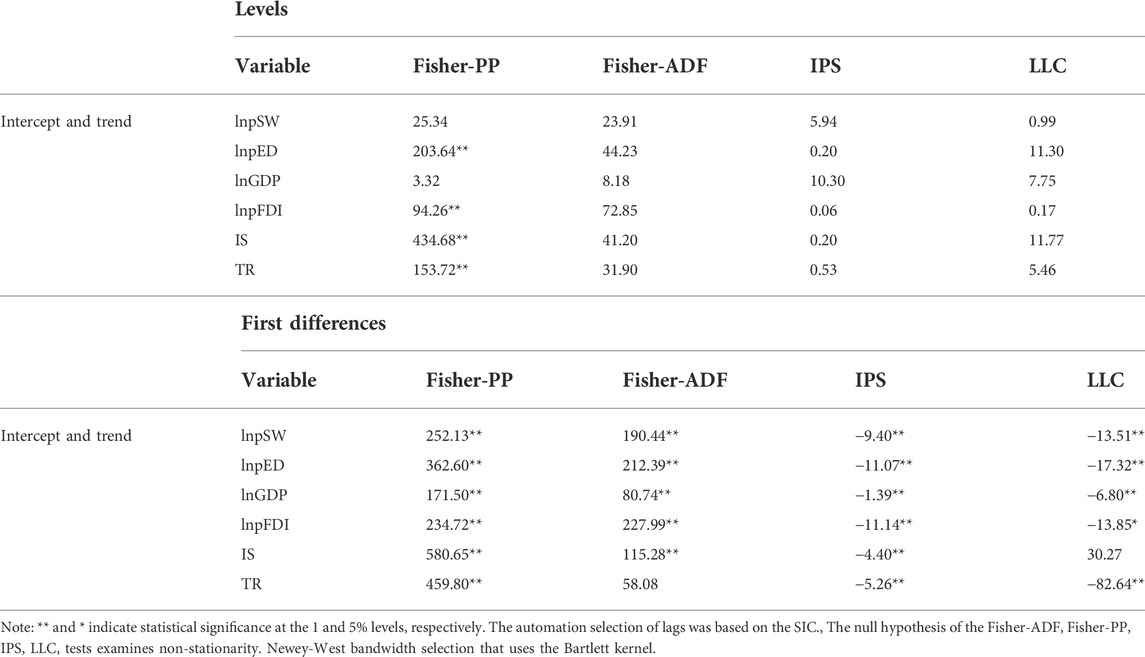
TABLE 6. Results from panel unit root test.
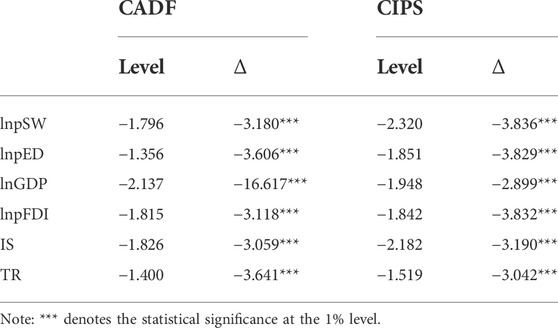
TABLE 7. Results from panel unit root tests.
Since lnpSW, lnpED, lnpFDI, lnGDP, IS, and TR have unit roots and meet the conditions of the cointegration test, and belong to a heterogeneous panel, to further verify whether the variables have statistical and economic significance, we successively adopt Kao panel cointegration test, Pedroni panel cointegration test, Westerlund panel cointegration test was used to verify the long-term relationship between variables. The Pedroni panel cointegration test is the first-generation panel unit root test. Considering the heterogeneity of sample data but not the cross-sectional correlation, the Kao panel cointegration test is the second-generation panel unit root test. It is used in many works of literature with the Pedroni panel cointegration test, but the cross-sectional correlation of data is not considered. Westerlund panel cointegration test is the second generation of the panel unit root test. Considering sample data’s heterogeneity and cross-sectional dependence, we expect such a test to bring more reliable results.
Kao panel cointegration test results are shown in Table 8. The analyzed variables are cointegrated and have long-run relationships, which rejects the null hypothesis at 1% significance (Pesaran 2007). Pedroni panel cointegration test results are shown in Table 9. A total of seven test results show the Westerlund panel cointegration test results in Table 10. lnpSW, lnpED, lnGDP, lnpFDI, IS, and TR have a cointegration relationship. The three-panel cointegration tests show a long-term correlation between the analyzed variables. The conclusion of cointegration is robust and reliable.
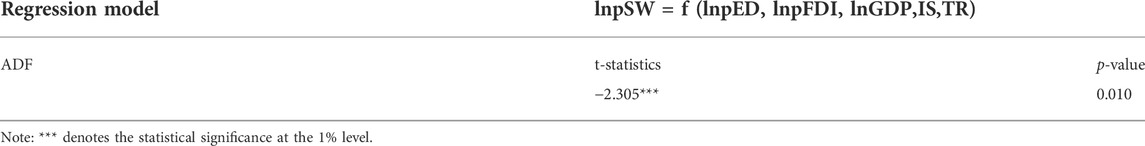
TABLE 8. The Kao panel cointegration test results.
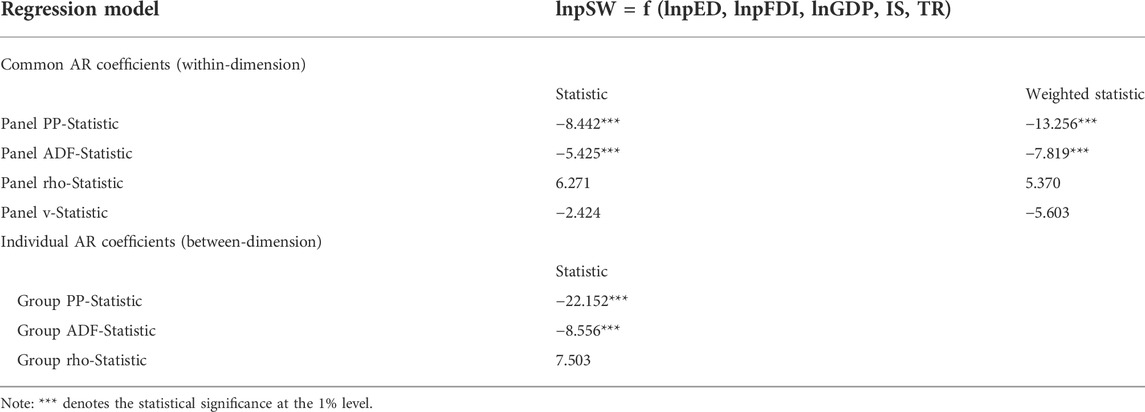
TABLE 9. The Pedroni cointegration test results.
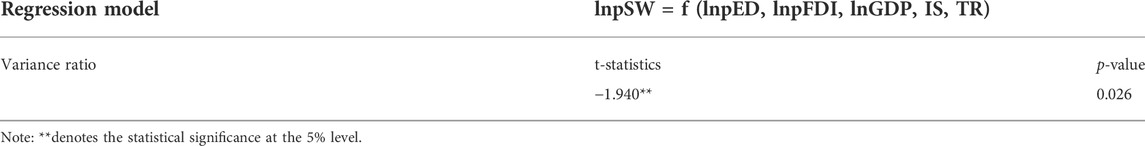
TABLE 10. The Westerlund test results.
We find a cointegration relationship between lnpSW, lnpED, lnGDP, lnpfdi, IS, and TR. Therefore, we further want to determine the coefficient value of the long-term relationship between variables ((lnpED)3 (lnpED)2, lnpED, lnGDP, lnpfdi, IS, and TR). DOLS are more suitable for shorter time frames of panel data (Stock and Watson, 1993). The data length in this paper is not long, so it is more appropriate to use DOLS to estimate long-term relationships between variables. The results differ in Model 1, Model 2, and Model 3. We selected the significant and best-fitting models, as listed in Table 11. EKC quadratic curve exists in Whole, Eastern, Central, and Western China. FDI does not influence solid waste emissions in Eastern China. However, in Whole, Central, and Western China, increasing FDI will increase solid-waste emissions, and the impact is the strongest in Western China. In Central China, GDP development will significantly increase solid-waste emissions, and trade openness can reduce solid-waste emissions. The proportion of Eastern China’s secondary industry will increase substantially solid-waste emissions.
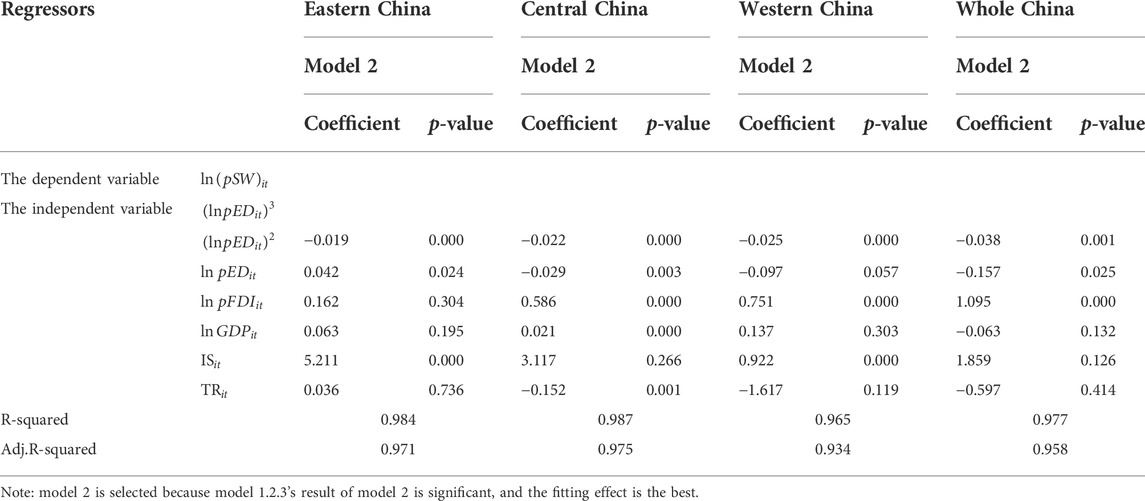
TABLE 11. The weighted DOLS results, Whole &Eastern & Central & Western China, 2001–2017.
As displayed in Table 12, we compared the results of Model 1, Model 2, and Model 3 and selected the model with significant and optimal fitting. Most of the eight economic zones conform to the EKC curve relationship of quadratic power, such as North Economic Zone, northern coastal economic zone, eastern coastal economic zone, and southern coastal economic zone. In the Yellow River’s Middle economic area. The development of e-commerce brings monotonous and increasing solid-waste emissions. In the Economic Zone in the Middle Reaches of the Yangtze River and Northwest Economic Zones, there is no EKC relationship between e-commerce and solid-waste emissions.
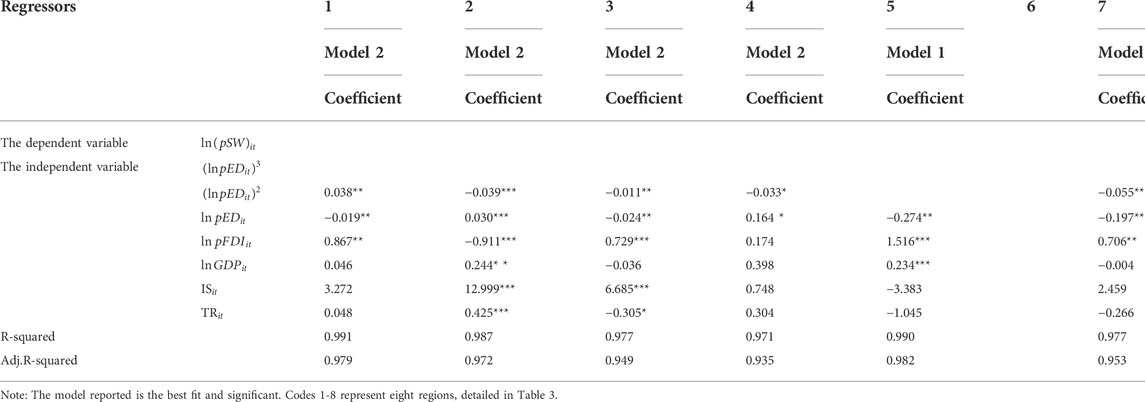
TABLE 12. The weighted DOLS results, China’s eight major economic regions, 2001–2017.
E-commerce and express delivery have been included in the solid waste pollution law enterprises. The government is paying more attention to the solid pollution of the e-commerce industry. We hope this study can provide some reference value for the government’s designated policies. We discuss the relationship between the e-commerce industry and solid waste emission under the framework of EKC. Through the CD test, unit root test, and cointegration test, the coefficient value of the long-term relationship is finally estimated based on the panel data of 30 provincial samples in China (2001–2017). Our conclusions and policy opinions are as follows:
Pesaran’s CD test conclusion shows that the samples have heterogeneity and data face. The results are consistent. The analyzed variables are non-stationary at their level but stationary after the first-order difference. Therefore, three cointegration tests (Pedroni, Kao, and Westerlund’s cointegration test). The results show that the analyzed variables are cointegrated and have a long-term relationship.
We used the DOLS method to estimate the long-term relationship between variables. The results show that the relationship between solid waste emissions and e-commerce development conforms to the EKC theoretical model, showing an inverted U-shape in China, the East, the Middle, and the West. Among the eight major regions in China, not all regions conform to the EKC theoretical model. Five major economic zones conform to the EKC curve, including the Northeast Economic Zone, the Northern Coastal Economic Zone, the Eastern Coastal Economic Zone, and the Southern Coastal Economic Zone. Promote the green development of e-commerce in these areas.
However, In the Middle Reaches of the Yellow River, the development of e-commerce brings monotonically increasing solid-waste discharge. In the Middle Reaches of the Yangtze River and Northwest Economic Zones, there is no EKC relationship between e-commerce and solid-waste emissions. Therefore, while promoting the development of e-commerce in these three regions, pay special attention to solid waste discharge, develop green e-commerce as much as possible, and reduce solid waste pollution from other channels, such as building a green and synergistic upstream and downstream industrial chain, improving online and offline commodity delivery environment, and participating in constructing the whole society’s renewable resource recycling system. The digital supply chain collects big data, using various AI algorithms to guide supply chain prediction, planning, execution, decision-making, and other activities. Realize more efficient internal and external results response, and realize the low-carbon operation of the supply chain of the e-commerce industry by lactonization, platformization, coordination, intelligence, and digitalization.
FDI does not affect solid waste emissions in Eastern China. However, in Whole & Central & Western China, the increase in FDI will promote the expansion of solid-waste emissions. In introducing FDI in central and western China, great attention should be paid to the spillover effect of green technology, and the introduction of high-polluting enterprises should be avoided as far as possible.
Market share will significantly increase solid waste emissions in the central region, and trade openness will reduce solid waste emissions. In China and the eastern region, the increase of secondary industry will significantly increase solid waste emissions. According to the findings, we suggest adjusting the industrial structure, reducing the secondary industry proportion and reducing the pressure of solid waste discharge. Increase trade openness and improve the green technology efficiency of regional production by actively introducing green technology.
From the perspective of green technology, we suggest the following perspectives: Adopt organic solid waste harmless resource recycling technology, improve the resource conversion rate of solid waste brought by e-commerce platforms, and turn solid waste into renewable resources of “oil, gas and carbon". Platform enterprises are encouraged to create “green logistics” through technological innovation and vigorously promote innovation in electronic invoices, new energy trucks and packaging materials. Using big data and cloud computing optimization system, intelligent logistics, green logistics of carton and other second-hand materials recovery.
Starting from the actual situation of Green Governance of e-commerce platform enterprises, the current actual governance effect has not kept up with the development speed of the e-commerce industry. It is not common for e-commerce and expresses delivery companies to take measures to green their packages and improve the packaging recycling system. Only e-commerce platforms and express companies can limit the growing environmental footprint of express packaging. We suggest that the government should pay attention to publicity, guidance and supervision and give full play to the platform’s advantages to call for Green Governance of e-commerce platform enterprises. Specifically, we should implement the green management responsibility of e-commerce platforms and guide platform operators to reduce and replace the use of disposable plastic products by formulating platform rules and services. The agreement implements publicity and promotion measures and publicizes the implementation to the public.
Guide e-commerce platform enterprises to regularly investigate the use and recycling of disposable plastic products by operators in the platform and report and evaluate the situation according to regulations. Encourage e-commerce platforms to actively connect with green packaging suppliers, provide network collection services for operators on the platform, and promote replaceable, recyclable and degradable products. Guide the e-commerce platform to carry out publicity and education activities with the theme of green environmental protection, such as replacing the old with the new, spreading the concept of green environmental protection, and improving consumers’ understanding of green products. Considering the product’s whole life cycle, we can effectively reduce the consumption of packaging consumables and improve the proportion of reusable packaging by starting with packaging design, packaging material replacement and packaging algorithm optimization.
Implementing green management responsibilities for e-commerce platforms. Supervise and guide e-commerce platforms to report the use and recycling of plastic bags and other disposable plastic products generated by their self-operated businesses, guide operators on the platforms to reduce and replace the use of disposable plastic products by formulating platform rules, service agreements, and carrying out publicity and promotion measures, and release the implementation status to the society. Guide e-commerce platform enterprises to conduct regular investigations on the use and recycling of disposable plastic products of operators on the platform and report and evaluate the situation as required. Encourage e-commerce platforms to actively connect with green packaging suppliers, provide network collection services for operators on the platform, and promote alternative recyclable products, easy to recycle and degradable. Guide e-commerce platforms to carry out promotional and educational activities themed with green environmental protection, such as trade-in of old products, to spread the concept of green environmental protection and increase consumers’ awareness of green products. Buying a ticket considers the product’s whole life cycle, starting from packaging design, packaging material replacement, and packaging algorithm optimization effectively reduces the consumption of packaging consumables and increases the proportion of reusable packaging. Only e-commerce platforms and express delivery companies are likely to limit the growing environmental footprint of express packaging.
Give full play to the platform’s advantages and foster a green development ecology. Encourage e-commerce platforms to carry out green public welfare activities to improve consumers’ environmental protection awareness. Encourage e-commerce platforms to establish reward points, credit scoring and other mechanisms to guide consumers to buy green goods, use green packaging or reduce packaging, and participate in packaging recycling. We will improve the green credit mechanism, strengthen incentives for green consumption, and promote reduced-volume, recyclable and biodegradable green packaging. We will expand sales of green products. We will support e-commerce platforms in expanding the sale of energy-saving, environment-friendly, green products, set up exclusive areas for green products, and strengthen centralized display and publicity. We will guide e-commerce platforms to tap green consumer demand, cooperate with brand owners to carry out the green design of products and packaging and build green brands.
From the perspective of pollution payment, the first is to revise relevant laws on solid waste, formulate relevant mandatory regulations to restrict excessive packaging and upgrade publicity policies and standards to truly binding or encourage policies and regulations as soon as possible. For example, if the packaging of this product is larger than how many times, it is excessive packaging, and there should be some corresponding penalties. The second is to levy packaging and processing fees on e-commerce. Sewage treatment now charges a sewage treatment fee; garbage disposal does not charge a garbage disposal fee. It should be collected from the e-commerce trash because e-commerce sales are increasing and will soon overtake brick-and-mortar store sales. Effectively promote the implementation of the new “plastic restriction order”, increase the supervision of white pollution control, “adopt financial subsidies, tax control, set up research projects, promote takeaway, express delivery, and encourage packaging manufacturers to adopt advanced technologies to produce green packaging. Certain preferential policies, taxes, etc., are given to improve the competitiveness of green packaging products in actual circulation. Traditional plastic product producers implement a progressive tax system according to weight and quantity. E-commerce enterprises are encouraged to fulfill their social responsibilities for ecological and environmental protection actively. Establish a statistical evaluation system, actively publicize alternative plans to reduce the amount of disposable plastic packaging, and consciously accept public and social supervision.
The original contributions presented in the study are included in the article/Supplementary Material, further inquiries can be directed to the corresponding author.
All authors contributed to the study’s conception and design. LC and LX performed material preparation, data collection, and analysis. LC wrote the first draft of the manuscript and all authors commented on previous versions of the manuscript. All authors read and approved the final manuscript.
The authors declare that the research was conducted in the absence of any commercial or financial relationships that could be construed as a potential conflict of interest.
All claims expressed in this article are solely those of the authors and do not necessarily represent those of their affiliated organizations, or those of the publisher, the editors and the reviewers. Any product that may be evaluated in this article, or claim that may be made by its manufacturer, is not guaranteed or endorsed by the publisher.
1CNNIC. 2021, http://www.199it.com/archives/1302411.html.
Adedoyin, F. F., Bekun, F. V., Driha, O. M., and Balsalobre-Lorente, D. (2020). The effects of air transportation, energy, ICT and FDI on economic growth in the industry 4.0 era: Evidence from the United States. Technol. Forecast. Soc. Change 160, 120297. doi:10.1016/j.techfore.2020.120297
Alshehry, A. S., and Belloumi, M. (2017). Study of the environmental Kuznets curve for transport carbon dioxide emissions in Saudi Arabia. Renew. Sustain. Energy Rev. 75, 1339–1347. doi:10.1016/j.rser.2016.11.122
Antonakakis, N., Chatziantoniou, I., and Filis, G. (2017). Energy consumption, CO 2 emissions, and economic growth: An ethical dilemma. Renew. Sustain. Energy Rev. 68 (1), 808–824. doi:10.1016/j.rser.2016.09.105
Asongu, S. A., Le Roux, S., and Biekpe, N. (2017). Environmental degradation, ICT and inclusive development in Sub-Saharan Africa. ENERGY POLICY 111, 353–361. doi:10.1016/j.enpol.2017.09.049
Borggren, C., Moberg, A., and Finnveden, G. (2011). Books from an environmental perspective-Part 1: Environmental impacts of paper books sold in traditional and Internet bookshops. Int. J. Life Cycle Assess. 16 (2), 138–147. doi:10.1007/s11367-011-0254-1
Buckley, P. J., Clegg, L. J., Cross, A. R., Liu, X., Voss, H., and Zheng, P. (2007). The determinants of Chinese outward foreign direct investment. J. Int. Bus. Stud. 38 (2), 499–518.
Carling, K., Han, M., Hakansson, J., Meng, X., and Rudholm, N. (2015). Measuring transport related CO2 emissions induced by online and brick-and-mortar retailing. Transp. Res. Part D Transp. Environ. 40, 28–42. doi:10.1016/j.trd.2015.07.010
Chiu, C.-M., Wang, E. T. G., Fang, Y.-H., and Huang, H.-Y. (2014). Understanding customers’ repeat purchase intentions in B2C e-commerce: the roles of utilitarian value, hedonic value and perceived risk. Information Systems Journal 24 (1), 85–114. doi:10.1111/j.1365-2575.2012.00407.x%/WILEY
Dritsakis, N. (2004). Cointegration analysis of German and British tourism demand for Greece. Tour. Manag. 25 (1), 111–119. doi:10.1016/s0261-5177(03)00061-x
Engle, R. F., and Granger, C. (1987). Cointegration and error-correction: Representation, estimation and testing. Econometrica 55 (2), 251–276. doi:10.2307/1913236
Escursell, S., Llorach-Massana, P., and Blanca Roncero, M. (2021). Sustainability in e-commerce packaging: A review. J. Clean. Prod. 280, 124314. doi:10.1016/j.jclepro.2020.124314
Fareed, Z., and Pata, U. K. (2022). Renewable, non-renewable energy consumption and income in top ten renewable energy-consuming countries: Advanced Fourier based panel data approaches. Renew. Energy 194, 805–821. doi:10.1016/j.renene.2022.05.156
Fareed, Z., Rehman, M. A., Adebayo, T. S., Wang, Y., Ahmad, M., and Shahzad, F. (2022). Financial inclusion and the environmental deterioration in Eurozone: The moderating role of innovation activity. Technol. Soc. 69, 101961. doi:10.1016/j.techsoc.2022.101961
Fichter, K. (2002). E-commerce: Sorting out the environmental consequences. J. Industrial Ecol. 6 (2), 25–41. doi:10.1162/108819802763471762
Gao, J., and Zhang, L. (2019). Exploring the dynamic linkages between tourism growth and environmental pollution: New evidence from the mediterranean countries. Curr. ISSUES Tour. 24, 49–65. doi:10.1080/13683500.2019.1688767
Garg, C. P. (2021). Modeling the e-waste mitigation strategies using grey-theory and DEMATEL framework. J. Clean. Prod. 281, 124035. doi:10.1016/j.jclepro.2020.124035
Greenpeace, I. (2019). Environmental groups: Green packaging in e-commerce and express delivery industries is urgently needed. [Online]. Available: https://www.greenpeace.org.cn/news/ (Accessed 922 2021, 2021).
Greenpeace, I. (2017). Greenpeace released a report on the environmental impact of online shopping. [Online]. Available: https://www.greenpeace.org.cn/news/ (Accessed 2020-5-17) in Chinese 2020.
Greenpeace, I. (2020). Plastic Limit 2.0: Focus on the source, separate scenarios, orderly progress, and new challenges regarding biodegradable plastics. [Online]. Available: https://www.greenpeace.org.cn/news/ (Accessed 922 2021, 2021).
Grossman, G., and Krueger, A. (1991). Environmental impacts of a North American free trade agreement. National Cambridge %\ 2020-08-28 16:43:00.
Guo, J., Wang, X., Fan, S., and Gen, M. (2017). Forward and reverse logistics network and route planning under the environment of low-carbon emissions: A case study of shanghai fresh food E-commerce enterprises. Comput. INDUSTRIAL Eng. 106, 351–360. doi:10.1016/j.cie.2017.02.002
Guo, J., Yu, H., and Gen, M. (2020). Research on green closed-loop supply chain with the consideration of double subsidy in e-commerce environment. Comput. INDUSTRIAL Eng. 149, 106779. doi:10.1016/j.cie.2020.106779
Halliru, A. M., Loganathan, N., Hassan, A. A. G., Mardani, A., and Kamyab, H. (2020). Re-Examining the environmental kuznets curve hypothesis in the economic community of west african states: A panel quantile regression approach. J. Clean. Prod. 276, 124247. doi:10.1016/j.jclepro.2020.124247
Hu, Y., Yu, Y., and Mardani, A. (2021). Selection of carbon emissions control industries in China: An approach based on complex networks control perspective. Technol. Forecast. Soc. Change 172, 121030. doi:10.1016/j.techfore.2021.121030
Huang, Z., and Benyoucef, M. (2013). From e-commerce to social commerce: A close look at design features. Electronic Commerce Research and Applications 12 (4), 246–259. doi:10.1016/j.elerap.2012.12.003%/ELSEVIER
Im, K. S., Pesaran, M. H., and Shin, Y. (2003). Testing for unit roots in heterogeneous panels. J. Econ. 115 (1), 53–74. doi:10.1016/s0304-4076(03)00092-7
Jin, Y. M., and Chen, B. (2022). Comparison of potential CO2 reduction and marginal abatement costs across in the China and Korea manufacturing industries. J. Innovation Knowl. 7 (2), 100172. doi:10.1016/j.jik.2022.100172
Johanse, S. (1991). Estimation and hypothesis testing of cointegration vectors in Gaussian vector autoregressive models. Econometrica 59 (6), 1551–1580. doi:10.2307/2938278
Kao, C. (1999). Spurious regression and residual-based tests for cointegration in panel data. J. Econ. 90, 1–44. doi:10.1016/s0304-4076(98)00023-2
Kao, C. W., and Chiang, M. H. (2000). On the estimation and inference of a cointegrated regression in panel data. Adv. ECOOMETRICS 15 (15), 179–222. doi:10.1016/S0731-9053(00)15007-8
Khan, M. I., Kamran Khan, M., Dagar, V., Oryani, B., Akbar, S. S., Salem, S., et al. (2021). Testing environmental kuznets curve in the USA: What role institutional quality, globalization, energy consumption, financial development, and remittances can play? New evidence from dynamic ARDL simulations approach. Front. Environ. Sci. 9, 789715. doi:10.3389/fenvs.2021.789715
Khan, S. A. R., Yu, Z., Belhadi, A., and Mardani, A. (2020). Investigating the effects of renewable energy on international trade and environmental quality. J. Environ. Manag. 272, 111089. doi:10.1016/j.jenvman.2020.111089
Latif, Y., Ge, S. Q., Fareed, Z., Ali, S., and Bashir, M. A. (2022). Do financial development and energy efficiency ensure green environment? Evidence from RCEP economies. Econ. Research-Ekonomska Istraz. 22, 1. doi:10.1080/1331677x.2022.2066555
Levin, A., Lin, C. F., and Chu, C. (2002). Unit root tests in panel data: Asymptotic and finite-sample properties. J. Econ. 108, 1–24. doi:10.1016/s0304-4076(01)00098-7
Li, F., Mascheroni, E., and Piergiovanni, L. (2015). The potential of NanoCellulose in the packaging field: A review. Packag. Technol. Sci. 28 (6), 475–508. doi:10.1002/pts.2121
Lin, W. R., Xiao, Y., Yu, H. J., and Shen, S. W. (2022). Does vertical environmental protection pressure promote convergence of urban air pollution? J. Innovation Knowl. 7 (2), 100186. doi:10.1016/j.jik.2022.100186
Ma, M., Cai, W., Cai, W., and Dong, L. (2019). Whether carbon intensity in the commercial building sector decouples from economic development in the service industry? Empirical evidence from the top five urban agglomerations in China. J. Clean. Prod. 222, 193–205. doi:10.1016/j.jclepro.2019.01.314
Mackinnon, J. G., Haug, A. A., and Michelis, L. (1999). Numerical distribution functions of likelihood ratio tests for cointegration. J. Appl. Econ. Chichester. Engl. 14 (5), 563–577. doi:10.1002/(sici)1099-1255(199909/10)14:5<563::aid-jae530>3.0.co;2-r
Mackinnon, J. G. (1996). Numerical distribution functions for unit root and cointegration tests. J. Appl. Econ. Chichester. Engl. 11 (6), 601–618. doi:10.1002/(sici)1099-1255(199611)11:6<601::aid-jae417>3.0.co;2-t
Maddala, G. S., and Wu, S. W. (1999). A comparative study of unit root tests with panel data and a new simple test. Oxf. Bull. Econ. Stat. 61 (SI), 631–652. doi:10.1111/1468-0084.0610s1631
Mangiaracina, R., Marchet, G., Perotti, S., and Tumino, A. (2015). A review of the environmental implications of B2C e-commerce: A logistics perspective. Int. J. Phys. Distribution Logist. Manag. 45 (6), 565–591. doi:10.1108/ijpdlm-06-2014-0133
Matthews, H. S., Hendrickson, C. T., Soh, D. L., and Trb, (2001). “Environmental and economic effects of e-commerce - a case study of book publishing and retail logistics,” in Multimodal and marine freight transportation issues: Freight transportation; Marine Transportation (Washington, DC: Transportation Research Board Natl Research Council), 6–12.
Mattos Nascimento, D. L., Alencastro, V., Goncalves Quelhas, O. L., Gusmao Caiado, R. G., Garza-Reyes, J. A., Lona, L. R., et al. (2019). Exploring Industry 4.0 technologies to enable circular economy practices in a manufacturing context A business model proposal. J. Manuf. Technol. Manag. 30, 607–627. doi:10.1108/jmtm-03-2018-0071
Mokhtarian, P. L. (2004). A conceptual analysis of the transportation impacts of B2C e-commerce. Transportation 31 (3), 257–284. doi:10.1023/B:PORT.0000025428.64128.d3
Muoz-Villamizar, A., Velázquez-Martínez, J., Haro, P., Ferrer, A., and Carvalho, A. (2021). The environmental impact of fast shipping ecommerce in inbound logistics operations: A case study in Mexico. J. Clean. Prod. 283, 125400. doi:10.1016/j.jclepro.2020.125400
Nasir, M. A., Toan, L. D. H., and Huong, T. X. T. (2019). Role of financial development, economic growth & foreign direct investment in driving climate change: A case of emerging asean. J. Environ. Manag. 242, 131–141. doi:10.1016/j.jenvman.2019.03.112
Omri, A., Daly, S., Rault, C., and Chaibi, A. (2015). Financial development, environmental quality, trade and economic growth: What causes what in MENA countries. ENERGY Econ. 48, 242–252. doi:10.1016/j.eneco.2015.01.008
Pålsson, H., Pettersson, F., and Winslott Hiselius, L. (2017). Energy consumption in e-commerce versus conventional trade channels - insights into packaging, the last mile, unsold products and product returns. J. Clean. Prod. 164, 765–778. doi:10.1016/j.jclepro.2017.06.242
Paramati, S. R., Alam, M. S., and Chen, C. F. (2017). The effects of tourism on economic growth and CO2 emissions: A comparison between developed and developing economies. J. Travel Res. 56 (6), 712–724. doi:10.1177/0047287516667848
Pedroni, P. (1999). Critical values for cointegration tests in heterogeneous panels with multiple regressors. Oxf. Bull. Econ. Stat. 61 (S1), 653–670. doi:10.1111/1468-0084.61.s1.14
Pedroni, P. (2004). Panel cointegration: Asymptotic and finite sample properties of pooled time series tests with an application to the PPP hypothesis. Econ. Theory 20 (3), 597–625. doi:10.1017/s0266466604203073
Pesaran, M. H. (2004). General diagnostic tests for cross section dependence in panels. Cambridge Working Papers in Economics 69 (7), 1240.
Phillips, P., and Hansen, B. E. (1990). Statistical inference in instrumental variables regression with I(1) processes. Rev. Econ. Stud. 57 (1), 99–125. doi:10.2307/2297545
Rai, H. B. (2021). The net environmental impact of online shopping, beyond the substitution bias. J. Transp. Geogr. 93, 103058. doi:10.1016/j.jtrangeo.2021.103058
Romero-Castro, N., Lopez-Cabarcos, M. A., and Pineiro-Chousa, J. (2022). Uncovering complexity in the economic assessment of derogations from the European industrial emissions directive. J. Innovation Knowl. 7 (1), 100159. doi:10.1016/j.jik.2021.11.001
Selden, T. M., and Daqing, S. (1994). Environmental quality and development: Is there a kuznets curve for air pollution emissions? J. Environ. Econ. Manag. 27 (2), 147–162. doi:10.1006/jeem.1994.1031
Solaymani, S. (2022). CO2 emissions and the transport sector in Malaysia. Front. Environ. Sci. 9. doi:10.3389/fenvs.2021.774164
Srivastava, S. K. (2007). Green supply-chain management: A state-of-the-art literature review. Int. J. Manag. Rev. 9 (1), 53–80. doi:10.1111/j.1468-2370.2007.00202.x
Stock, J. H., and Watson, M. W. (1993). A simple estimator of cointegrating vectors in higher-order integrated systems. ECONOMETRICA 61 (4), 783–820. doi:10.2307/2951763
Sui, D. Z., and Rejeski, D. W. (2002). Environmental impacts of the emerging digital economy: The E-for-environment E-commerce? Environ. Manag. 29 (2), 155–163. doi:10.1007/s00267-001-0027-X
Sun, Y., Wei, K. K., Fan, C., Lu, Y., and Gupta, S. (2016). Does social climate matter? On friendship groups in social commerce. Electronic Commerce Research and Applications 18, 37–47. doi:10.1016/j.elerap.2016.06.002%/ELSEVIER
van Loon, P., Deketele, L., Dewaele, J., McKinnon, A., and Rutherford, C. (2015). A comparative analysis of carbon emissions from online retailing of fast moving consumer goods. J. Clean. Prod. 106, 478–486. doi:10.1016/j.jclepro.2014.06.060
Weber, C. L., Koomey, J. G., and Matthews, H. S. (2010). The energy and climate change implications of different music delivery methods. J. Ind. Ecol. 14 (5), 754–769. doi:10.1111/j.1530-9290.2010.00269.x
Westerlund, J. (2005). New simple tests for panel cointegration. Econ. Rev. 24, 297–316. doi:10.1080/07474930500243019
Ye, Y. F., Chen, S. L., and Li, C. N. (2022). Financial technology as a driver of poverty alleviation in China: Evidence from an innovative regression approach. J. Innovation Knowl. 7 (1), 100164. doi:10.1016/j.jik.2022.100164
Keywords: e-commerce, solid waste, EKC, FDI, cross-sectional dependence, DOLS
Citation: Caiyi L, Xiaoyong L and Zhenyu L (2022) The nexus between e-commerce growth and solid-waste emissions in china: Open the pathway of green development of e-commerce. Front. Environ. Sci. 10:963264. doi: 10.3389/fenvs.2022.963264
Received: 07 June 2022; Accepted: 08 August 2022;
Published: 07 September 2022.
Edited by:
Magdalena Radulescu, University of Pitesti, RomaniaReviewed by:
Dervis Kirikkaleli, European University of Lefka, TurkeyCopyright © 2022 Caiyi, Xiaoyong and Zhenyu. This is an open-access article distributed under the terms of the Creative Commons Attribution License (CC BY). The use, distribution or reproduction in other forums is permitted, provided the original author(s) and the copyright owner(s) are credited and that the original publication in this journal is cited, in accordance with accepted academic practice. No use, distribution or reproduction is permitted which does not comply with these terms.
*Correspondence: Li Xiaoyong, bGl4aWFveW9uZ3ZpcEBvdXRsb29rLmNvbQ==
Disclaimer: All claims expressed in this article are solely those of the authors and do not necessarily represent those of their affiliated organizations, or those of the publisher, the editors and the reviewers. Any product that may be evaluated in this article or claim that may be made by its manufacturer is not guaranteed or endorsed by the publisher.
Research integrity at Frontiers
Learn more about the work of our research integrity team to safeguard the quality of each article we publish.