
95% of researchers rate our articles as excellent or good
Learn more about the work of our research integrity team to safeguard the quality of each article we publish.
Find out more
ORIGINAL RESEARCH article
Front. Environ. Sci. , 17 August 2022
Sec. Atmosphere and Climate
Volume 10 - 2022 | https://doi.org/10.3389/fenvs.2022.963145
This article is part of the Research Topic Anthropogenic Trace Gases and their Linkages to Meteorology and Climate Change View all 8 articles
 Rama Krishna Karumuri1
 Hari Prasad Dasari1
 Harikishan Gandham1
 Yesubabu Viswanadhapalli2
 Venkat Ratnam Madineni2
 Ibrahim Hoteit1*
Lockdowns imposed across the world to combat the spread of the COVID-19 pandemic also reduced the anthropogenic emissions. This study investigates the changes in the anthropogenic and natural pollution levels during the lockdown over the Arabian Peninsula (AP), a region where natural pollutants (mineral dust) dominate. In-situ and satellite observations, reanalysis products, and Weather Research and Forecasting model (WRF) coupled with Chemistry module (WRF-Chem) simulations were analyzed to investigate the influence of COVID−19 lockdown on the aerosols (PM2.5, PM10, and AOD) and trace gases (NO2 and SO2). WRF-Chem reasonably reproduced the satellite and in-situ measurements during the study period, with correlation coefficients varying between 0.6–0.8 (0.3–0.8) for PM10 (NO2 and SO2) at 95% confidence levels. During the lockdown, WRF-Chem simulations indicate a significant reduction (50–60%) in the trace gas concentrations over the entire AP compared to the pre-lockdown period. This is shown to be mostly due to a significant reduction in the emissions and an increase in the boundary layer height. An increase in the aerosol concentrations over the central and northern parts of the AP, and a decrease over the north-west AP, Red Sea, and Gulf of Aden regions are noticeable during the lockdown. WRF-Chem simulations suggest that the increase in particulate concentrations over the central and northern AP during the lockdown is mainly due to an increase in dust concentrations, manifested by the stronger convergence and upliftment of winds and warmer surface temperatures (15–25%) over the desert regions. The restricted anthropogenic activities drastically reduced the trace gas concentrations, however, the reduction in particulate concentration levels is offset by the increase in the natural processes (dust emissions).
Economic activities were strongly disrupted around the world during the COVID-19 pandemic (coronavirus 2019 disease). The first COVID-19 case was reported on November 2019 in Wuhan City, the capital of Hubei Province in China (Zhou et al., 2020; Zhu et al., 2020), and thereafter it spread all over the world. As of 7 July 2022, COVID-19 infected nearly about 550 million people globally and 6 million people in the Arabian Peninsula (AP) (https://www.worldometers.info/coronavirus). Many countries have implemented preventive measures to combat COVID-19, such as social distancing, lockdown, movement restrictions etc., to minimize the spread of the virus. This has led to a significant reduction in the global emissions and accordingly an improvement in the air quality index over many regions around the world. Shakoor et al. (2020) investigated the changes in the pollutant’s concentrations during the pre and post-lockdown periods over the United States and China. They reported a reduction during the lockdown in carbon monoxide (CO), nitrogen dioxide (NO2), and particulate matter (PM2.5) concentrations by 19%, 37%, and 1.1%, respectively, over the United States, and 27%, 39%, 18%, 18%, and 38% reduction in CO, NO2, sulphur dioxide (SO2), PM2.5, and PM10 concentrations, respectively, over China. Le Quéré et al. (2020) reported a global CO2 reduction of about 17% compared to 2019 levels due to COVID-19 restrictions. 20–70% reductions in NOx concentrations were also reported over several countries due to the lockdowns (e.g., Broomandi et al., 2020; Siciliano et al., 2020; Bauwens et al., 2020; Matthias et al., 2021; Misra et al., 2021; Kang et al., 2022).
Apart from the emission sources, the meteorological conditions (temperature, rainfall, boundary layer height, winds, etc.) play a vital role in modulating the pollutants levels over a region through washout, advection and dispersion processes (e.g., Ma et al., 2020; Ratnam et al., 2020; Sachin et al., 2020). A few studies (e.g., Krishna et al., 2019; Wang et al., 2019; Dasari et al., 2020; Le et al., 2020) have indeed indicated an increase in the concentrations of pollutants associated with the local and synoptic meteorological conditions. More recently Ratnam et al. (2021) emphasized the role of natural processes in increasing particulate pollution over central India during the lockdown period.
Over the Middle-East, Anil and Alagha. (2020) reported reductions in NO2 (12–86%), CO (5.8–55%), SO2 (8.7–30%), and PM10 (21–70%) between March and June 2020 over the eastern parts of the Kingdom of Saudi Arabia (KSA). Over Iran, Broomandi et al. (2020) observed that the primary pollutants decreased by ∼5–28% in SO2, 1–33% in NO2, 5–41% in CO, whereas ozone (O3) and PM2.5 concentrations were increased by ∼0.5–103% and 2–50%, respectively. Faridi et al. (2020) also suggested 16.5% and 20.5% increase in PM10 and PM2.5 concentrations respectively during the period of COVID-19 outbreak in Tehran, which they attributed to the failure of the administration at enforcing the lockdown measures.
The Gulf countries i.e., KSA, United Arab Emirates, Bahrain, Iran, Iraq, Kuwait, Oman, and Qatar, share nearly 60% of world oil reserves, and about 40% of the world natural gas reserves (Riazi et al., 2007), and all involve extensive industrial activities in oil and natural gas production and export. Several studies (e.g., Dix et al., 2020; Filonchyk et al., 2020) argued that the major anthropogenic emissions over the AP are produced by activities related to fossil fuel combustion, electricity generation, water desalination plants, oil and gas production. Day-to-day activities of oil refinery operations, power generation, and water desalination produce mainly NO2 and SO2 emissions (Barkley et al., 2017), which are then converted to nitrate and sulfate aerosols by gas-to-particle conversion and contribute to the PM2.5 concentrations (Barkley et al., 2017). These activities were significantly affected by the lockdown measures in the AP and globally.
The first positive COVID-19 case in KSA was reported on 2nd March 2020 (Anil and Alagha., 2020). The KSA government started implementing the lockdown measures at different stages. Workplace attendance was halted from 15th March, a complete suspension on entry to the two holy mosques in Mecca and Medina from 20th March, a suspension of all domestic and international flights from 21st March, a nation-wide curfew between 7 p.m. and 6 a.m. from 23rd March, and a 24-hour curfew implemented from 6th April. A few days later, most of the AP countries announced complete lockdowns until 20th June, after which the restrictions were gradually eased. The lockdown over the KSA and surrounding Gulf countries took place mainly between 23rd March and 1st May; 15th February—15th March is considered as the pre lockdown period. The COVID-19 lockdown offered an unprecedent opportunity to investigate the impact of natural and anthropogenic pollutant concentrations over this region.
This study investigates the effect of COVID-19 lockdown on the changes in air pollutants over the AP using available observations and Weather Research Forecasting model coupled with Chemistry module (WRF-Chem, Grell et al., 2005; Skamarock et al., 2008) simulations. Section 2 describes the model configuration, and datasets. Section 3 presents WRF-Chem validation results against in-situ and satellite measurements, and analyzes the changes in aerosols and trace gases concentrations during the pre-lockdown and lockdown periods and the relative role of local meteorological conditions. The main findings of the study are outlined and discussed in Section 4.
WRF-Chem version 3.9.1 (Grell et al., 2005; Skamarock et al., 2008) was implemented to simulate the meteorological and atmospheric chemistry conditions over the AP. This model is widely used to study the spatio-temporal distribution of aerosols, air quality, cloud-chemistry interactions, trace gas reactions, transport, deposition, chemical transformations, and photolysis at regional scales (e.g., Grell et al., 2011; Spiridonov et al., 2019; Ghude et al., 2020; Ukhov et al., 2020). WRF-Chem was configured here with 90 vertical levels extending up to 10 hPa, and a 10 km horizontal resolution (495 × 395 grid points) covering the AP (27°E−65°E, 8°N−40°N). The model was integrated from 0000 UTC of 10 February 2020 to 0000 UTC of 01 May 2020 using atmospheric initial and boundary conditions from the National Center for Environmental Prediction (NCEP) Final analysis data available at 1o × 1o resolution. The boundary conditions were updated at 6-hourly intervals. Time-varying sea surface temperature fields from the Real-Time Global High-Resolution data (Genmill et al., 2007) was imposed as the sea surface boundary conditions. The first 5 days of the model simulation was considered as a spin up time and was therefore not included in the analysis. The following parametrization schemes were selected: Lin scheme (Lin et al., 1983) for cloud microphysics, Mellor Yamada Janjic (MYJ) scheme (Janjic, 2001) for PBL parameterization, new Grell scheme for cumulus convection, NOAH MP scheme (Niu et al., 2011) for the land surface processes, and the RRTMG radiation scheme (Iacono et al., 2008) for both longwave and shortwave.
To simulate the gas phase chemical processes, we employed the Regional Atmospheric Chemistry Mechanism (RACM) (Stockwell et al., 1997), coupled with the aerosol scheme Goddard Chemistry Aerosol Radiation and Transport (GOCART) (Ginoux et al., 2001). The chemical initial and boundary conditions are extracted from the Whole Atmosphere Community Climate Model dataset (WACCM; Marsh et al., 2013). The chemical boundary conditions were updated at 6-hourly interval, and the monthly varying anthropogenic emissions from Emission Database for Global Atmospheric Research (EDGAR) Hemispheric Transport of Air Pollution (EDGAR-HTAP-v2). The EDGAR monthly varying global emissions were generated at a spatial resolution of 0.1 ° × 0.1 ° by combing local, regional, and national reported emissions (Janssens-Maenhout et al., 2015).
To account for the impact of COVID-19 lockdown measures on the anthropogenic emissions in WRF-Chem, we reduced different emission sectors by scaling factors as outlined in Table 1 based on the recent studies of Anil and Alagha. (2020) and Aljahdali et al. (2021), the COVID-19 measures by the government of KSA and surrounding countries over the AP, and also from observational evidences. Francis et al. (2022) reported a decrease in the pollutant concentrations by up to 40% over the UAE following the reduction in emissions. These scale factors were adopted by considering the reduction of emissions in the industries, power plants, transportation, etc., to estimate the relative changes in anthropogenic emissions during the lockdown period compared to normal conditions. Reduced/updated anthropogenic emissions were then used as emissions scenarios during the lockdown. These scaling factors do not represent the real emission scenarios that prevailed during the COVID-19 lockdown, which requires a coordinated national effort, but it provides us a near realistic framework to investigate the impact of emission reduction during the COVID-19 lockdown.

TABLE 1. Sector wise percent reduction in anthropogenic emissions over Arabian Peninsula during DLD.
The global daily tropospheric columnar dataset of NO2 and SO2 derived from the TROPOspheric Monitoring Instrument (TROPOMI) onboard Sentinel-5 is used to examine changes in the pollutants and further to validate the WRF-Chem simulated fields. TROPOMI is equipped with a nadir-viewing imaging spectrometer, which allows it to collect data at a high spectral resolution (covered between ultraviolet-shortwave infrared). TROPOMI data is available at a high spatial resolution of 3.5 × 5.5 km2 with an average estimated error of about 5% (van Geffen et al., 2020). The algorithm used to derive NO2 from TROPOMI is basically adopted from the OMI instrument (van Geffen et al., 2020). The vertical column of SO2 is retrieved in near-real time (i.e., typically 3 h after measurement) using the Differential Optical Absorption Spectroscopy (DOAS) technique (Veefkind et al., 2012.).
The simulated aerosol concentrations are also compared against the corresponding AOD estimates from the Moderate Resolution Imaging Spectroradiometer (MODIS) onboard Terra satellite (MOD04_L2) C6.1 Level 2 (Levy and Hsu., 2015).
We further used 42 air quality monitoring stations (AQMS) measurements of surface PM10, NO2, and SO2 with hourly concentrations during 15th February—1st May 2020 to evaluate the WRF-Chem outputs. The AQMS observations distributed over KSA are managed by the General Authority for Meteorology and Environmental Protection (GAMEP). The AQMS stations are equipped with MP101M (measurement Method ISO 10473), AC32M (Environmental S.A), AF22M (Environmental- S.A) sensors for measuring PM10, NO2, and SO2 respectively. Anil and Alagha. (2020) used this dataset to study air quality during the lockdown period over the Eastern Province of KSA.
Boundary layer height (BLH), temperature, zonal and meridional wind components from the fifth generation European Centre for Medium-Range Weather Forecasts (ECMWF) ERA-5 reanalysis (Hersbach and Dee., 2018) available at every hour with a horizontal resolution of 0.25° × 0.25° were used to validate the WRF-Chem simulated meteorological parameters.
We first validate the WRF-Chem simulated NO2, SO2, PM10, AOD, and different meteorological parameters against the observations collected during the two study periods: 1) Pre-lockdown (PLD) i.e., between 15th February and 15th March, 2020, and 2) Lockdown (DLD) i.e., between 23rd March and 01st May, 2020. Once validated, we analyzed the model simulated fields to study the effects of lockdown on the aerosols distributions and trace gases concentrations, and analyzed their variations with the meteorological conditions.
Figures 1, 2 indicate that the mean observed NO2, SO2, and PM10 concentrations over KSA during PLD and DLD are overall well simulated by WRF-Chem, albeit slightly overestimated (Figures 1, 2). The model was also able to reproduce the observed hotspot regions of high NO2 concentrations (∼5–20 ppb) located over the major cities along the Red Sea coast, and central and eastern KSA. The simulated spatial distributions of the mean concentrations of PM10, NO2, and SO2 during PLD (DLD) range between 170–460 μg/m3 (110–700 μg/m3), 0.7–18 ppbv (0.2–12 ppbv), and 1–29 ppbv (0.3–12 ppbv), compared to the observed ranges 90–490 μg/m3 (70–720 μg/m3), 1.4–24 ppbv (0.6–15 ppbv) and 2–28 ppbv (0.3–12 ppbv), respectively during PLD (DLD) (Figures 1, 2). WRF-Chem exhibits a positive bias of about 10–15% in the simulation of NO2 over the central and eastern KSA, and a negative bias of about 5–10% in the simulation of SO2 over the northwest KSA in both PLD and DLD. The spatial distributions of observed PM10 concentrations and WRF-Chem simulations during PLD and DLD show similar patterns, with the highest values over the eastern KSA, followed by the northwest KSA. A significant increase in PM10 concentration is noticeable during DLD in both observations and WRF-Chem simulations.
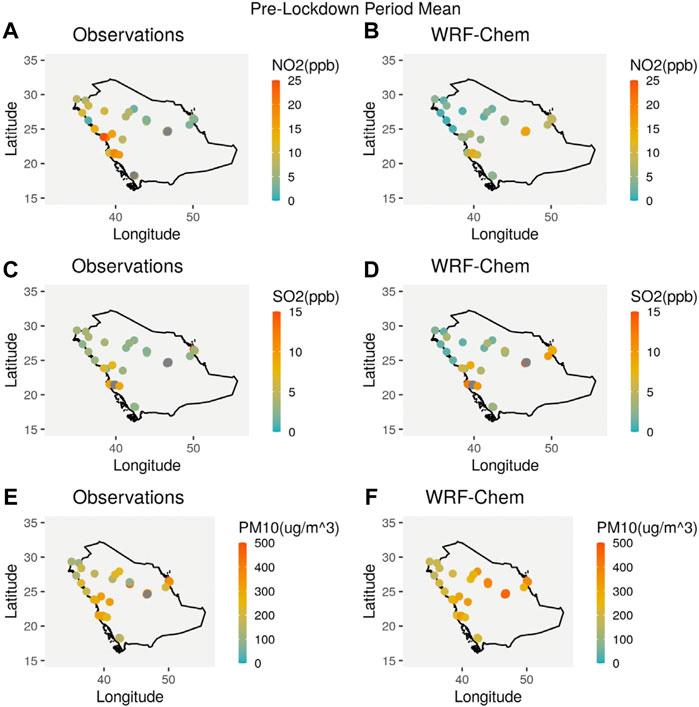
FIGURE 1. Comparison of pollutants NO2, SO2 and PM10 between ground-based observations (A, C, E) over different regions in KSA and WRF-chem simulations (B, D, F) during PLD.
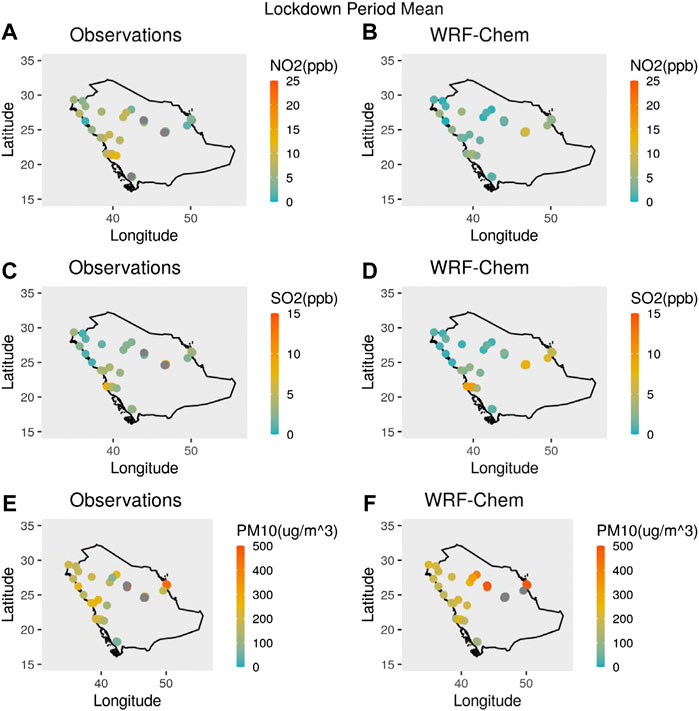
FIGURE 2. Comparison of pollutants NO2, SO2 and PM10 between ground-based observations (A, C, E) over different regions in KSA and WRF-chem simulations (B, D, F) during DLD.
The modeled PM10 suggests high correlation between 0.6–0.8 with the ground-based observations (Supplementary Figure S1C). The correlation coefficients between the model and observed trace gases (NO2 and SO2) vary between 0.2 and 0.8, relatively lower than those of PM10 (Supplementary Figures S1A,B). This shows that the adjusted anthropogenic emissions used in WRF-Chem simulations during the lockdown were relatively well tuned and provided reasonable estimates of the air pollutant concentrations. We have also noticed (not shown) a slight time-lag in the simulated WRF-Chem peaks of aerosols and trace gases compared to the observed peaks. However, at the majority of the locations, the correlations are significant at 95% confidence level for PM10, NO2, and SO2, indicating that the WRF-Chem is able to reproduce the observed variations during PLD and DLD over the KSA.
The time-averaged spatial distributions of the total column NO2 and SO2 simulated by WRF-Chem compared well with these inferred from the satellite measurements during PLD and DLD (Figures 3, 4). WRF-Chem and TROPOMI identified similar hotspots regions of NO2 over central KSA (∼6 mol/cm2), west-central KSA (∼5 mol/cm2), Arabian Gulf (∼4 mol/cm2), Iran (∼7 mol/cm2), and the eastern Mediterranean coast (Beirut and Cairo regions) (∼5–7 mol/cm2). The model also successfully identified the SO2 hotspots (Figure 4A) over Iran and Iraq (∼24 mol/cm2), Kuwait (∼17.5 mol/cm2), and west-central KSA regions (∼25 mol/cm2). Most of the NO2 and SO2 hotspot regions are located in the regions of high fossil fuels combustion and power generation industries (Alyemeni and Almohisen, 2014; Simpson et al., 2014; Barkley et al., 2017).
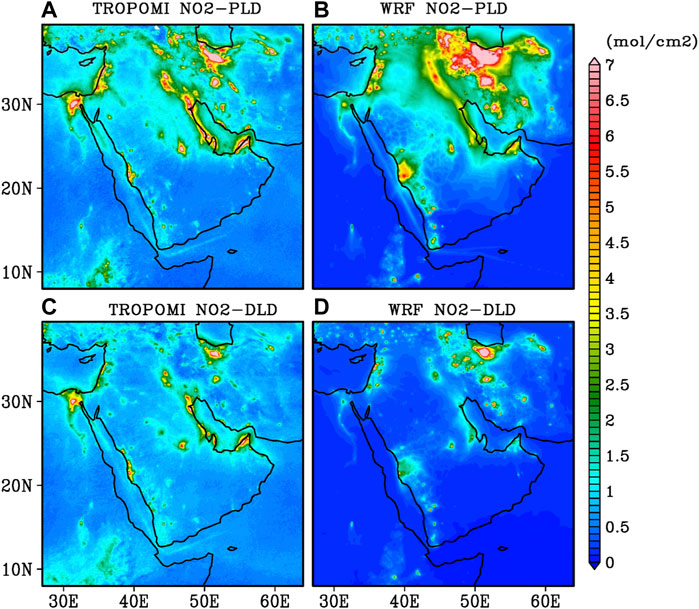
FIGURE 3. Time averaged spatial distribution of NO2 as inferred from TROPOMI during (A) PLD and (C) DLD periods. (B, D) are the same as (A, C) but from WRF-Chem simulations.
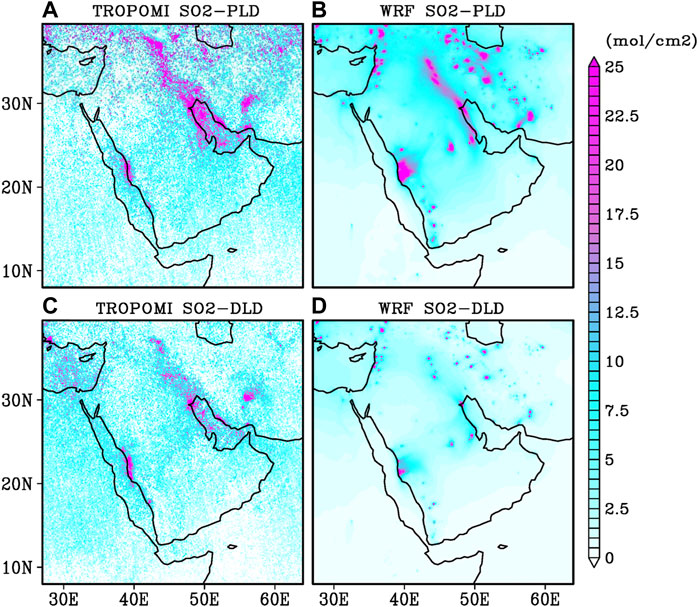
FIGURE 4. Time averaged spatial distribution of SO2 as inferred from TROPOMI during (A) PLD and (C) DLD periods. (B, D) are the same as (A, C) but from WRF-Chem simulations.
As expected, during the lockdown the observed intensity of NO2 and SO2 over the hotspot regions are reduced due to reduced industrial and transport activities (Figures 3C, 4C). The changes in NO2 and SO2 hotspots and their spatial distributions (Figures 3, 4) as observed by TROPOMI over the north-western AP, Jeddah and Riyadh between PLD and DLD periods are generally well reproduced by WRF-Chem.
The spatial distribution of AOD and surface winds from WRF-Chem are compared against those of MODIS satellite and ERA-5 reanalysis, respectively (Figure 5). The AP is one of the world’s largest dust source regions (Ginoux et al., 2001) and experiences the highest dust concentrations between March to September due to frequent passages of dust storms (e.g., Kunchala et al., 2018, 2019; Dasari et al., 2019; Gandham et al., 2020, 2022; Karumuri et al., 2022). The spatial distribution of MODIS AOD exhibits high values over the southern Red Sea and central AP during PLD (Figure 5A), mainly associated with the presence of an anticyclonic circulation over the central AP. Strong southeasterlies winds favor the transport of dust from the central AP towards the southern Red Sea and the convergence of winds over this region favors the accumulation of dust over the southern Red Sea. During DLD, a large increase in the AOD is noticeable throughout the AP and the Arabian Gulf regions, while a reduction is observed over the southern Red Sea (Figure 5C). The increase in the AOD levels during the lockdown is mainly due to the dust activity mediated by the convergence and associated uplift of winds (Supplementary Figure S2) and also due to the presence of Arabian heat low over the Rub'-al-Khali (The largest desert in AP) (Attada et al., 2019a; Attada et al., 2019b). The spatial distributions of the AOD as simulated by WRF-Chem (Figures 5B,D) are in good agreement with those of MODIS, except over the north-eastern parts of AP where the AOD is increased. During DLD, WRF-Chem is able to simulate the enhanced AOD over the central and north-eastern parts of AP as seen in MODIS. The vertical distribution time series of aerosol extinction coefficient and winds averaged over the central AP during PLD and DLD periods (Supplementary Figure S2) indicate that the thick aerosol layers observed during the DLD period is associated with strong low-level convergence and upliftment of winds, which contributed to the increase in AOD. Between PLD and DLD, a decrease (increase) of approximately 30–50% (50–60%) in the AOD is observed over the southern Red Sea and Gulf of Aden regions (central and northern parts of AP).
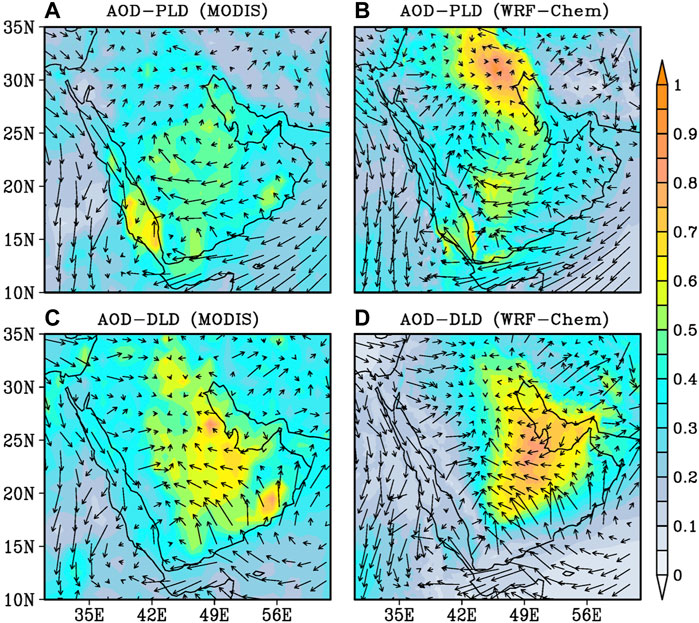
FIGURE 5. Time averaged spatial distribution of AOD over AP obtained from MODIS overlaid with surface winds from ERA-5 reanlysis, during (A) PLD and (C) DLD periods, (B) and (D) are the same as (A) and (C), but simulated by WRF-Chem simulations.
The simulated particulate matter PM2.5 and PM10 concentrations over the AP and surrounding regions during PLD and DLD show (Figure 6) similar spatial distributions. However, an increase in the particulate matter concentrations is observed from PLD to DLD over the central AP and Arabian Gulf. This is mainly due to an increase in dust activity over the Rub'-al-Khali during DLD following the seasonal changes. An increase in particulate matter (both fine and coarse modes) concentrations is observed over the central AP. During this season (March–April), the dust emissions are higher over the AP (Notaro et al., 2013; Kunchala et al., 2019).
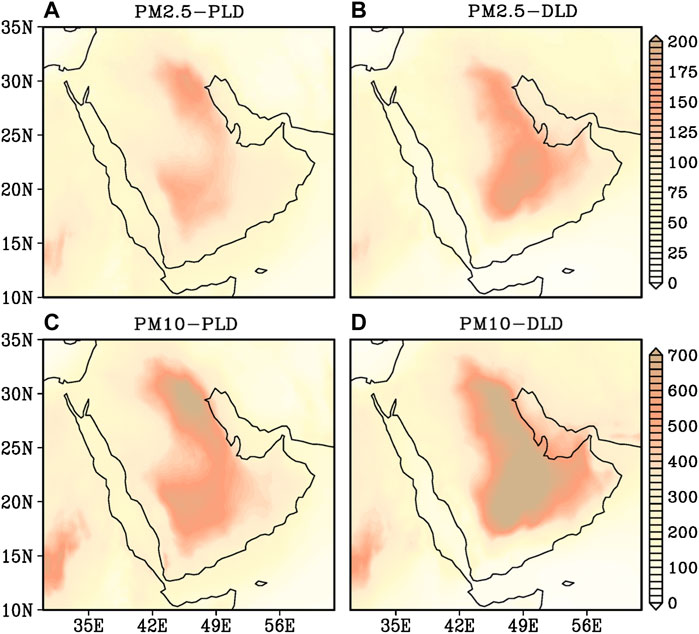
FIGURE 6. Time averaged spatial distributions of PM2.5 and PM10 during PLD and DLD periods as simulated by WRF-Chem.
To assess the changes in particulate and trace gases concentrations from the lockdown, we estimated the percentage change of these concentrations from WRF-Chem outputs between PLD and DLD as:
The percentage difference in the particulate matter (PM2.5 and PM10) between PLD and DLD (Figures 7A,B) suggests a decrease (increase) by approximately 30–60% (20–80%) over the southern Red Sea, northwestern parts of the AP and the Gulf of Aden regions (central AP, Arabian Gulf and northeastern parts of the AP). The percentage changes in trace gas concentrations (Figures 7C,D) also shows a decrease of approximately 50–60% in the NO2 concentrations during the lockdown over the entire AP. The SO2 levels decreased by 40–50% over several parts of the AP, however few hotspots of NO2 and SO2 persist over the Mediterranean and Tokar gap regions.
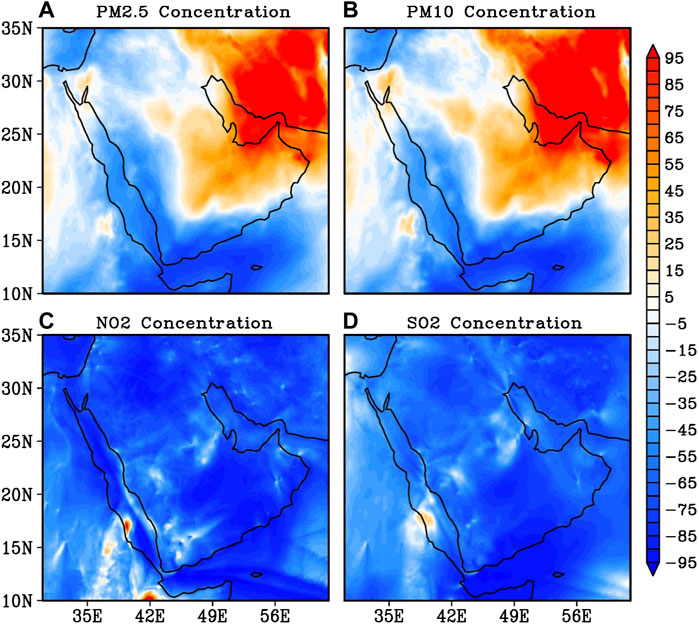
FIGURE 7. Percentage differences in (A) PM2.5, (B) PM10, (C) NO2, (D) SO2 between the mean PLD and DLD periods based on WRF-Chem simulations.
To further assess the contributions from local and long-range transport of different pollutants during DLD, we present the spatial distributions of aerosol pollutants PM2.5, PM10 and their ratios, OC, BC, Sulfate and sea salt (Figure 8). In general, high (low) values of the PM2.5/PM10 ratios indicate the dominance of anthropogenic (natural) contributions to the particulate levels. (Khodeir et al., 2012; Sugimoto et al., 2016; Munir 2017; Xu et al., 2017). The results reveal high concentrations of PM2.5 (Figure 8A), PM10 (Figure 8B) and low PM2.5/PM10 ratio (Figure 8C) over the permanent dust source regions. High PM2.5/PM10 ratio values (0.5–0.7) are observed over the Arabian sea, Mediterranean and Southern Red Sea regions, which are far from the main dust sources. Coarse particles cannot be transported far from the source regions because of their short lifetime (gravitational settlement and dry deposition processes). This suggests that the increased ratio values over the Red Sea are probably due to fine dust particles transported by south-westerly winds from North Africa dust source regions.
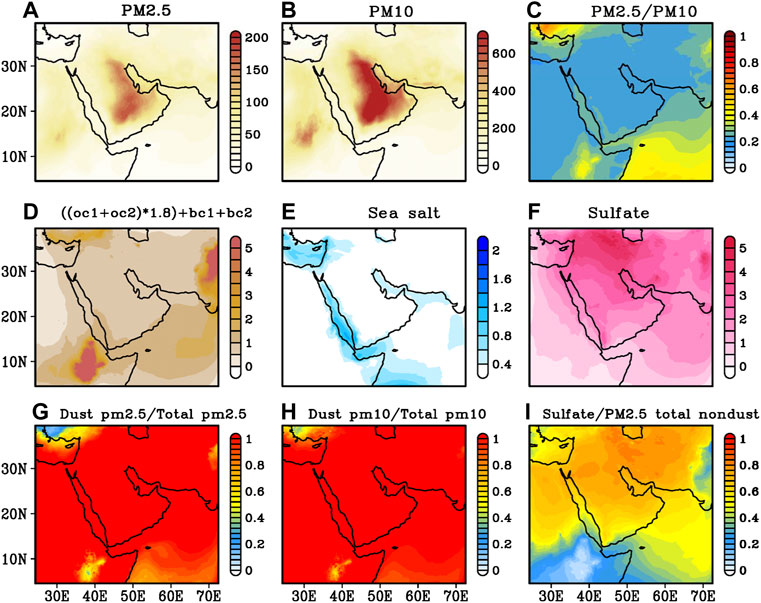
FIGURE 8. Spatial distributions of (A) PM2.5, (B) PM10, (C) ratio between PM2.5 and PM10, (D) organic matter and black carbon ((OC hydrophobic + OC hydrophilic) x OC mass fraction (1.8) + BC hydrophobic + BC hydrophilic, (E) Sea salt, (F) Sulfate, (G) ratio between dust PM2.5 and total PM2.5, (H) ratio between dust PM10 and total PM10, and (I) ratio between sulfate and PM2.5 total non-dust as simulated by WRF-Chem during the DLD period. All concentrations are in μgm-3 except for ratios.
The sum of surface concentrations of organic matter and black carbon shows (Figure 8D) lower values over the northern AP. High concentrations of sea salt (Figure 8E) are noticeable over the Red Sea, Arabian Sea and Mediterranean Sea regions and high sulfate concentrations (Figure 8F) over the industrial regions of Iran, Iraq, and Arabian Gulf. As particulate matter is composed of dust and non-dust particles (OC, BC, and sea salt), the ratio of dust PM2.5 concentration to total (natural dust + anthropogenic) PM2.5 concentration, and the ratio of dust PM10 concentration to total (natural dust + anthropogenic) PM10 concentration (Figures 8G,H) provide an idea on the contributions of dust. High dust contribution (>80%) are found near the dust source regions and relatively low (30–60%) dust contribution over the Arabian sea and the Mediterranean Sea. The ratio between the concentration of sulfate aerosol with respect to the total non-dust aerosols of PM2.5 concentrations is relatively high (> 0.6) over the northern AP (Iran and Iraq regions) during DLD (Figure 8I).
The reduction in trace gas concentrations is likely related to the reduction in anthropogenic emissions during the lockdown, but also to seasonal variations in atmospheric circulation. To address this, we have performed a WRF-Chem simulation in which we reduced the anthropogenic emissions and compared them against the outputs of an identical model simulation but using the default anthropogenic emissions from EDGAR-HTAP (Section 2.1). This enables to assess the impact of anthropogenic emissions changes on the changes in the air-quality over the AP. Overall, the results indicate (Supplementary Figure S3) that the reduced emissions lead to a 10% reduction in the aerosol concentration (PM2.5 and PM10), and about 40–50% reduction in the trace gases (NO2, and SO2) concentrations over the AP and surrounding regions. The detailed results are provided in the supplementary material.
We have also examined the percentage changes between the PLD and DLD periods in the meteorological variables, such as boundary layer height (BLH), and surface temperature, from WRF-Chem and ERA-5 reanalysis to examine the role of meteorological conditions on the air quality during the lockdown. The results suggest that the surface temperatures increased by 20% over the central AP and about 35% over the northern parts of AP during the DLD period. The increased surface temperatures enhanced the surface heating and caused an increased in BLH by about 40–75% (Figure 9A,D) during DLD. Strong winds during DLD were also noticeable, blowing from south east and west directions and converging over the central AP desert region (Figure 4) were also noticeable, which enhanced the dust activity. The changes in temperatures, BLH, and wind speeds increased the dust loading over the AP, causing an increase in the surface particulate concentration during the DLD period.
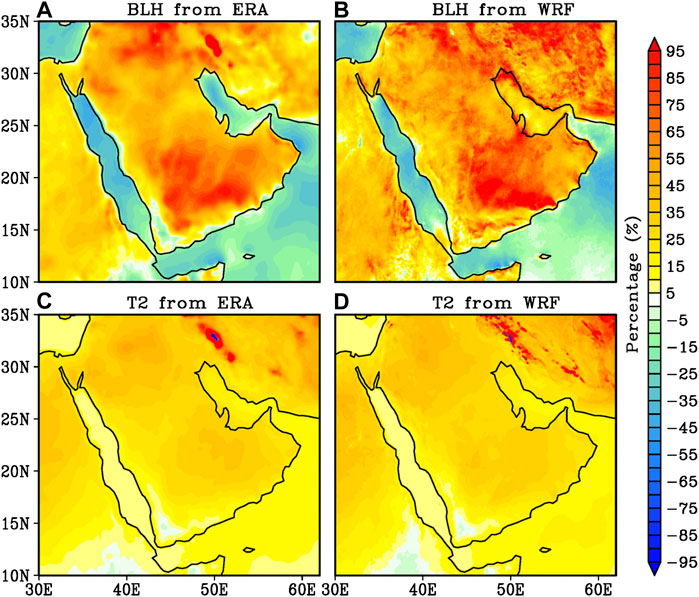
FIGURE 9. Percentage differences between DLD and PLD periods for BLH, and 2 m Temperature from ERA-5 reanalysis (A, C) and WRF-chem simulations (B, D).
This study investigated the effect of COVID−19 lockdown on the aerosol (PM2.5, PM10, and AOD) and trace gases (NO2 and SO2) concentrations over the Arabian Peninsula (AP). The AP is the largest dust region and a major producer of petroleum products, contributing significant amounts of natural and anthropogenic pollution. We use in-situ and satellite observations to investigate the changes in natural and anthropogenic pollutants during the pre-lockdown (PLD) and lockdown (DLD) periods between February and April 2020. We conducted WRF-Chem simulations to study the observed features of air-quality due to COVID-19 lockdown and to identify the possible mechanisms behind noticeable increases, or decreases, in the natural and anthropogenic pollutants during the PLD and DLD periods over the AP. The main findings of this study can be summarized as follows:
1) WRF-Chem simulations of trace gases (NO2 and SO2) and PM10 concentrations exhibited a good correlation with the ground-based observations over KSA during the DLD and PLD periods. This suggests that the adjusted anthropogenic emissions in the WRF-Chem simulations were well tuned and relatively well reproduced the observed changes in the air pollutant concentrations during COVID-19 lockdown.
2) Both WRF-Chem and in-situ measurements show an increase in the PM10 concentration by 30–70% over the central and northern parts of AP, and a reduction in trace gas concentrations by 50–60% over KSA between DLD and PLD.
3) WRF-Chem simulations with and without reduction of emissions during DLD indicate a reduction in the pollutants concentration due to reduced emissions (lockdown). A 10% reduction in aerosol concentrations and 40–50% reduction in the trace gases (NO2, and SO2) concentrations were observed over the AP and surrounding regions.
4) Surface temperatures, wind speeds, and boundary layer heights increased over the major dust source regions during DLD. The enhanced surface heating associated with the increased surface temperatures favored an increase in the boundary layer height and stronger winds over the central AP. This generated dust loading and favored an enhancement of dust aerosols and particulate concentrations during DLD over the central and northern AP.
The reported results suggest that the reduction in the anthropogenic activity during COVID lockdown significantly reduced the trace gases concentrations. However, it had a little impact on the particulate concentrations over the central and northern AP, due to the dominant contribution of the dust emissions to the particulate concentrations. COVID-19 helped to setup a unique opportunity to investigate the role of anthropogenic and natural pollution sources and their impact on the regional air quality. This analysis proves that a reduction in anthropogenic emissions over the AP will reduce the concentration of gaseous pollutants, as expected. Nevertheless, it may not improve the particulate air quality due to the important dust activity over the region, as has been shown in this study. It is therefore prudent to conclude that dust emissions and large-scale dynamics play an important role in particulate pollution levels over the AP.
The original contributions presented in the study are included in the article/Supplementary Material, further inquiries can be directed to the corresponding author.
RK, HD, and IH identified the problem and designed the work to meet the objective. RK conducted the model simulations. RK, HG, HD, and YV analyzed the model outputs and observational datasets. RK, HD, HG, VM, YV, and IH wrote the manuscript.
This study was funded by the Office of the Vice President of Research at King Abdullah University of Science and Technology (KAUST) under the Virtual Red Sea Initiative (Grant # REP/1/3268-01-01). WRF-Chem simulations were conducted on the KAUST Super Computational Facility SHAHEEN.
The authors declare that the research was conducted in the absence of any commercial or financial relationships that could be construed as a potential conflict of interest.
All claims expressed in this article are solely those of the authors and do not necessarily represent those of their affiliated organizations, or those of the publisher, the editors and the reviewers. Any product that may be evaluated in this article, or claim that may be made by its manufacturer, is not guaranteed or endorsed by the publisher.
The Supplementary Material for this article can be found online at: https://www.frontiersin.org/articles/10.3389/fenvs.2022.963145/full#supplementary-material
Aljahdali, M. O., Alhassan, A. B., and Albeladi, M. N. (2021). Impact of novel coronavirus disease (COVID-19) lockdown on ambient air quality of Saudi Arabia. Saudi J. Biol. Sci. 28 (2), 1356–1364. doi:10.1016/j.sjbs.2020.11.065
Alyemeni, M. N., and Almohisen, I. A. A. (2014). Traffic and industrial activities around Riyadh cause the accumulation of heavy metals in legumes: A case study. Saudi J. Biol. Sci. 21, 167–172. doi:10.1016/j.sjbs.2013.09.007
Anil, I., and Alagha, O. (2020). The impact of COVID-19 lockdown on the air quality of Eastern Province, Saudi Arabia. Air Qual. Atmos. Health 14, 117–128. doi:10.1007/s11869-020-00918-3
Attada, R., Dasari, H. P., Chowdary, J. S., Yadav, R. K., Knio, O., and Hoteit, I. (2019a). Surface air temperature variability over the Arabian Peninsula and its links to circulation patterns. Int. J. Climatol. 39 (1), 445–464. doi:10.1002/joc.5821
Attada, R., Dasari, H. P., Parekh, A., Chowdary, J. S., Langodan, S., Knio, O., et al. (2019b). The role of the Indian Summer Monsoon variability on Arabian Peninsula summer climate. Clim. Dyn. 52 (5), 3389–3404. doi:10.1007/s00382-018-4333-x
Barkley, M. P., González Abad, G., Kurosu, T. P., Spurr, R., Torbatian, S., and Lerot, C. (2017). OMI air-quality monitoring over the Middle East. Atmos. Chem. Phys. 17, 4687–4709. doi:10.5194/acp-17-4687–2017
Bauwens, M., Compernolle, S., Stavrakou, T., Müller, J. F., van Gent, J., Eskes, H., et al. (2020). Impact of coronavirus outbreak on NO2 pollution assessed using TROPOMI and OMI observations. Geophys. Res. Lett. 47 (11), e2020GL087978. doi:10.1029/2020GL087978
Broomandi, P., Karaca, F., Nikfal, A., Jahanbakhshi, A., Tamjidi, M., and Kim, J. R. (2020). Impact of COVID-19 event on the air quality in Iran. Aerosol Air Qual. Res. 20, 1793–1804. doi:10.4209/aaqr.2020.05.0205
Dasari, H. P., Desamsetti, S., Langodan, S., Attada, R., Kunchala, R. K., Viswanadhapalli, Y., et al. (2019). High-resolution assessment of solar energy resources over the Arabian Peninsula. Appl. Energy 248, 354–371. doi:10.1016/j.apenergy.2019.04.105
Dasari, H. P., Desamsetti, S., Langodan, S., Karumuri, R. K., Singh, S., and Hoteit, I. (2020). Atmospheric conditions and air quality assessment over NEOM, kingdom of Saudi Arabia. Atmos. Environ. X. 230, 117489. doi:10.1016/j.atmosenv.2020.117489
Dix, B., Bruin, J., Roosenbrand, E., Vlemmix, T., Francoeur, C., Gorchov‐Negron, A., et al. (2020). Nitrogen oxide emissions from U.S. Oil and gas production: Recent trends and source attribution. Geophys. Res. Lett. 47 (1). doi:10.1029/2019GL085866
Faridi, S., Yousefian, F., Niazi, S., Ghalhari, M. R., Hassanvand, M. S., and Naddafi, K. (2020). Impact of SARS-CoV-2 on ambient air particulate matter in tehran. Aerosol Air Qual. Res. 20, 1805–1811. doi:10.4209/aaqr.2020.05.0225
Filonchyk, M., Hurynovich, V., Yan, H., Gusev, A., and Shpilevskaya, N. (2020). Impact assessment of COVID-19 on variations of SO2, NO2, CO and AOD over East China. Aerosol Air Qual. Res. 20, 1530–1540. doi:10.4209/aaqr.2020.05.0226
Francis, D., Fonseca, R., Nelli, N., Teixido, O., Mohamed, R., and Perry, R. (2022). Increased Shamal winds and dust activity over the Arabian Peninsula during the COVID-19 lockdown period in 2020. Aeolian Res. 55, 100786. doi:10.1016/j.aeolia.2022.100786
Gandham, H., Dasari, H. P., Karumuri, A., Ravuri, P. M. K., and Hoteit, I. (2022). Three-dimensional structure and transport pathways of dust aerosols over West Asia. npj Clim. Atmos. Sci. 5 (1), 45–15. doi:10.1038/s41612-022-00266-2
Gandham, H., Dasari, H. P., Langodan, S., Karumuri, R. K., and Hoteit, I. (2020). Major changes in extreme dust events dynamics over the Arabian Peninsula during 2003–2017 driven by atmospheric conditions. J. Geophys. Res. Atmos. 125 (24). doi:10.1029/2020jd032931
Gemmill, W., Katz, B., and Li, X. (2007). Daily real-time, global sea surface temperature high-resolution analysis: RTG_SST_HR, 22. Science Application International Corporation, and Joint Center for Satellite Data Assimilation Tech., Note 260.
Ghude, S. D., Karumuri, R. K., Jena, C., Kulkarni, R., Pfister, G. G., Sajjan, V. S., et al. (2020). What is driving the diurnal variation in tropospheric NO2 columns over a cluster of high emission thermal power plants in India? Atmos. Environ. X 5, 100058. doi:10.1016/j.aeaoa.2019.100058
Ginoux, P., Chin, M., Tegen, I., Prospero, J. M., Holben, B., Dubovik, O., et al. (2001). Sources and distributions of dust aerosols simulated with the GOCART model. J. Geophys. Res. 106, 20255–20273. doi:10.1029/2000JD000053
Grell, G. A., Peckham, S. E., Schmitz, R., McKeen, S. A., Frost, G., Skamarock, W. C., et al. (2005). Fully coupled “online” chemistry within the WRF model. Atmos. Environ. X. 39, 6957–6975. doi:10.1016/j.atmosenv.2005.04.027
Grell, G., Fast, J., Gustafson, W. I., Peckham, S. E., McKeen, S., Salzmann, M., et al. (2011). “On-line chemistry within WRF: Description and evaluation of a state-of-the-art multiscale air quality and weather prediction model,” in Integrated systems of meso-meteorological and chemical transport models (Springer Berlin Heidelberg), 41–54. doi:10.1007/978-3-642-13980-2_3
Iacono, M. J., Delamere, J. S., Mlawer, E. J., Shephard, M. W., Clough, S. A., and Collins, W. D. (2008). Radiative forcing by long-lived greenhouse gases: Calculations with the AER radiative transfer models. J. Geophys. Res. 113, D13103. doi:10.1029/2008JD009944
Janić, Z. I. (2001). Nonsingular implementation of the Mellor-Yamada level 2.5 scheme in the NCEP Meso model, 437. Boulder, Colorado: National Centers for Environmental Prediction, 61.
Janssens-Maenhout, G., Crippa, M., Guizzardi, D., Dentener, F., Muntean, M., Pouliot, G., et al. (2015). HTAP_v2.2: A mosaic of regional and global emission grid maps for 2008 and 2010 to study hemispheric transport of air pollution. Atmos. Chem. Phys. 15, 11411–11432. doi:10.5194/acp-15-11411-2015
Kang, M., Zhang, J., Cheng, Z., Guo, S., Su, F., Hu, J., et al. (2022). Assessment of sectoral NO x emission reductions during COVID‐19 lockdown using combined satellite and surface observations and source‐oriented model simulations. Geophys. Res. Lett. 49 (3), 2021GL095339. doi:10.1029/2021GL095339
Karumuri, R. K., Kunchala, R. K., Attada, R., Dasari, H. P., and Hoteit, I. (2022). Seasonal simulations of summer aerosol optical depth over the Arabian Peninsula using WRF‐Chem: Validation, climatology, and variability. Int. J. Climatol. 42 (5), 2901–2922. doi:10.1002/joc.7396
Khodeir, M., Shamy, M., Alghamdi, M., Zhong, M., Sun, H., Costa, M., et al. (2012). Source apportionment and elemental composition of PM2.5 and PM10 in Jeddah city, Saudi Arabia. Atmos. Pollut. Res. 3, 331–340. doi:10.5094/apr.2012.037
Krishna, R. K., Ghude, S. D., Kumar, R., Beig, G., Kulkarni, R., Nivdange, S., et al. (2019). Surface PM2.5 estimate using satellite-derived aerosol optical depth over India. Aerosol Air Qual. Res. 19, 25–37. doi:10.4209/aaqr.2017.12.0568
Kunchala, R. K., Attada, R., Dasari, H. P., Vellore, R. K., Abualnaja, Y., Ashok, K., et al. (2019). On the recent amplification of dust over the arabian Peninsula during 2002–2012. JGR. Atmos. 124, 13220–13229. doi:10.1029/2019JD030695
Kunchala, R. K., Attada, R., Dasari, H. P., Vellore, R. K., Langodan, S., Abualnaja, Y. O., et al. (2018). Aerosol optical depth variability over the arabian Peninsula as inferred from satellite measurements. Atmos. Environ. X. 187, 346–357. doi:10.1016/j.atmosenv.2018.06.011
Le Quéré, C., Jackson, R. B., Jones, M. W., Smith, A. J., Abernethy, S., Andrew, R. M., et al. (2020). Temporary reduction in daily global CO2 emissions during the COVID-19 forced confinement. Nat. Clim. Chang. 10, 647–653. doi:10.1038/s41558-020-0797-x
Le, T., Wang, Y., Liu, L., Yang, J., Yung, Y. L., Li, G., et al. (2020). Unexpected air pollution with marked emission reductions during the COVID-19 outbreak in China. Science 369, 702–706. doi:10.1126/science.abb7431
Levy, R., and Hsu, C. (2015). MODIS Atmosphere L2 aerosol product. NASA MODIS adaptive processing system. USA: Goddard Space Flight Center. doi:10.5067/MODIS/MOD04_L2.006
Lin, Y. L., Farley, R. D., and Orville, H. D. (1983). Bulk parameterization of the snow field in a cloud model. J. Clim. Appl. Meteor. 22, 1065–1092. doi:10.1175/1520-0450(1983)022<1065:bpotsf>2.0.co;2
Ma, Y., Zhao, Y., Liu, J., He, X., Wang, B., Fu, S., et al. (2020). Effects of temperature variation and humidity on the death of COVID-19 in Wuhan, China. Sci. Total Environ. 724, 138226. doi:10.1016/j.scitotenv.2020.138226
Marsh, D. R., Mills, M. J., Kinnison, D. E., Lamarque, J. F., Calvo, N., and Polvani, L. M. (2013). Climate change from 1850 to 2005 simulated in CESM1(WACCM). J. Clim. 26, 7372–7391. doi:10.1175/JCLI-D-12-00558.1
Matthias, V., Quante, M., Arndt, J. A., Badeke, R., Fink, L., Petrik, R., et al. (2021). The role of emission reductions and the meteorological situation for air quality improvements during the COVID-19 lockdown period in central Europe. Atmos. Chem. Phys. 21 (18), 13931–13971. doi:10.5194/acp-21-13931-2021
Misra, P., Takigawa, M., Khatri, P., Dhaka, S. K., Dimri, A. P., Yamaji, K., et al. (2021). Nitrogen oxides concentration and emission change detection during COVID-19 restrictions in North India. Sci. Rep. 11 (1), 9800. doi:10.1038/s41598-021-87673-2
Munir, S. (2017). Analysing temporal trends in the ratios of PM2.5/PM10 in the UK. Aerosol Air Qual. Res. 17, 34–48. doi:10.4209/aaqr.2016.02.0081
Niu, G. Y., Yang, Z. L., Mitchell, K. E., Chen, F., Ek, M. B., Barlage, M., et al. (2011). The community noah land surface model with multiparameterization options (Noah-MP): 1. Model description and evaluation with local-scale measurements. J. Geophys. Res. 116, D12109. doi:10.1029/2010JD015139
Notaro, M., Alkolibi, F., Fadda, E., and Bakhrjy, F. (2013). Trajectory analysis of Saudi Arabian dust storms. J. Geophys. Res. Atmos. 118, 6028–6043. doi:10.1002/jgrd.50346
Ratnam, V., Hari Prasad, D., Rama Krishna, K., Yesubabu, V., Prasad, P., and Ibrahim, H. (2021). Natural processes dominate the pollution levels during COVID-19 lockdown over India. Sci. Rep. 11, 15110. doi:10.1038/s41598-021-94373-4
Ratnam, V., Prasad, P., Akhil Raj, S. T., and Ibrahim, H. (2020). Effect of lockdown due to COVID-19 on the aerosol and trace gases spatial distribution over India and adjoining regions. Aerosol Air Qual. Res. 21, 200397. doi:10.4209/aaqr.2020.07.0397
Riazi, M. R., Al-Haddad, A. A., and Mansoori, G. A. (2007). An update on the developments in petroleum production research in the Middle East. J. Pet. Sci. Eng. 55 (1), 1–5. doi:10.1016/j.petrol.2006.04.009
Sachin, G. S., Swain, B., Patra, S. S., and Amte, A. (2020). On the global trends and spread of the COVID-19 outbreak: Preliminary assessment of the potential relation between location-specific temperature and UV index. J. Public Health 30, 219–228. doi:10.1007/s10389-020-01279-y
Shakoor, A., Chen, X., Farooq, T. H., Shahzad, U., Ashraf, F., Rehman, A., et al. (2020). Fluctuations in environmental pollutants and air quality during the lockdown in the USA and China: Two sides of COVID-19 pandemic. Air Qual. Atmos. Health 13, 1335–1342. doi:10.1007/s11869-020-00888-6
Siciliano, B., Dantas, G., da Silva, C. M., and Arbilla, G. (2020). Increased ozone levels during the COVID-19 lockdown: Analysis for the city of Rio de Janeiro, Brazil. Sci. Total Environ. 737, 139765. doi:10.1016/j.scitotenv.2020.139765
Simpson, I. J., Aburizaiza, O. S., Siddique, A., Barletta, B., Blake, N. J., Gartner, A., et al. (2014). Air quality in Mecca and surrounding holy places in Saudi Arabia during Hajj: Initial survey. Environ. Sci. Technol. 48, 8529–8537. doi:10.1021/es5017476
Skamarock, W. C., Klemp, J. B., Dudhi, J., Gill, D. O., Barker, D. M., Duda, M. G., et al. (2008). A description of the advanced research WRF version 3. Boulder, Colorado: Technical Report. doi:10.5065/D6DZ069T
Spiridonov, V., Jakimovski, B., Spiridonova, I., and Pereira, G. (2019). Development of air quality forecasting system in Macedonia, based on WRF-Chem model. Air Qual. Atmos. Health 12, 825–836. doi:10.1007/s11869-019-00698-5
Stockwell, W. R., Kirchner, F., Kuhn, M., and Seefeld, S. (1997). A new mechanism for regional atmospheric chemistry modeling. J. Geophys. Res. 102, 25847–25879. doi:10.1029/97jd00849
Sugimoto, N., Shimizu, A., Matsui, I., and Nishikawa, M. (2016). A method for estimating the fraction of mineral dust in particulate matter using PM2.5-to- PM10 ratios. Particuology 28, 114–120. doi:10.1016/j.partic.2015.09.005
Ukhov, A., Mostamandi, S., da Silva, A., Flemming, J., Alshehri, Y., Shevchenko, I., et al. (2020). Assessment of natural and anthropogenic aerosol air pollution in the Middle East using MERRA-2, CAMS data assimilation products, and high-resolution WRF-Chem model simulations. Atmos. Chem. Phys. 20, 9281–9310. doi:10.5194/acp-20-9281-2020
van Geffen, J., Boersma, K. F., Eskes, H., Sneep, M., ter Linden, M., Zara, M., et al. (2020). S5P TROPOMI NO2 slant column retrieval: Method, stability, uncertainties and comparisons with OMI. Atmos. Meas. Tech. 13, 1315–1335. doi:10.5194/amt-13-1315-2020
Veefkind, J. P., Aben, I., McMullan, K., Förster, H., De Vries, J., Otter, G., et al. (2012). TROPOMI on the esa sentinel-5 precursor: A gmes mission for global observations of the atmospheric composition for climate, air quality and ozone layer applications. Remote Sens. Environ. 120, 70–83. doi:10.1016/j.rse.2011.09.027
Wang, H., Li, J., Peng, Y., Zhang, M., Che, H., and Zhang, X. (2019). The impacts of the meteorology features on PM2.5 levels during a severe haze episode in central-east China. Atmos. Environ. X. 197, 177–189. doi:10.1016/j.atmosenv.2018.10.001
Xu, G., Jiao, L., Zhang, B., Zhao, S., Yuan, M., Gu, Y., et al. (2017). Spatial and temporal variability of the pm2.5/PM10 ratio in wuhan, central China. Aerosol Air Qual. Res. 17, 741–751. doi:10.4209/aaqr.2016.09.0406
Zhou, P., Yang, X. L., Wang, X. G., Hu, B., Zhang, L., Zhang, W., et al. (2020). A pneumonia outbreak associated with a new coronavirus of probable bat origin. Nature 579 (7798), 270–273. doi:10.1038/s41586-020-2012-7
Keywords: COVID-19, lockdown, Arabian Peninsula, air pollutants, WRF-chem, TROPOMI
Citation: Karumuri RK, Dasari HP, Gandham H, Viswanadhapalli Y, Madineni VR and Hoteit I (2022) Impact of COVID-19 lockdown on the ambient air-pollutants over the Arabian Peninsula. Front. Environ. Sci. 10:963145. doi: 10.3389/fenvs.2022.963145
Received: 07 June 2022; Accepted: 15 July 2022;
Published: 17 August 2022.
Edited by:
Ravi Yadav, Indian Institute of Tropical Meteorology (IITM), IndiaReviewed by:
Prashant Rajput, Banaras Hindu University, IndiaCopyright © 2022 Karumuri, Dasari, Gandham, Viswanadhapalli, Madineni and Hoteit. This is an open-access article distributed under the terms of the Creative Commons Attribution License (CC BY). The use, distribution or reproduction in other forums is permitted, provided the original author(s) and the copyright owner(s) are credited and that the original publication in this journal is cited, in accordance with accepted academic practice. No use, distribution or reproduction is permitted which does not comply with these terms.
*Correspondence: Ibrahim Hoteit, aWJyYWhpbS5ob3RlaXRAa2F1c3QuZWR1LnNh
Disclaimer: All claims expressed in this article are solely those of the authors and do not necessarily represent those of their affiliated organizations, or those of the publisher, the editors and the reviewers. Any product that may be evaluated in this article or claim that may be made by its manufacturer is not guaranteed or endorsed by the publisher.
Research integrity at Frontiers

Learn more about the work of our research integrity team to safeguard the quality of each article we publish.