- 1Department of Economics, University of Lagos, Lagos, Nigeria
- 2School of Economics and Management, Chang’an University, Xi’an, China
- 3Department of Business Administration, ILMA University, Karachi, Pakistan
- 4College of Law, Prince Sultan University, Riyadh, Saudi Arabia
- 5Prince Sultan University, Riyadh, Saudi Arabia
This study investigates the impact of trade facilitation though costs, documents, and time to import and export—on agricultural sector performance (ASP) for a panel of 33 Sub-Saharan African (SSA) countries from 2005 to 2019. The empirical analysis is based on a dynamic system of generalized method of moments. The following findings are established. First, higher import costs, documents, and time significantly improve ASP, while exports negatively impact ASP. Second, while import costs promote trade in agricultural products through substitution effects, export costs impede it. Third, among other factors, improvements in human capital, gross fixed capital formation, population growth, and trade openness significantly improve agricultural sector performance. Fourth, the results of the robustness check further emphasize the importance of TF on ASP from various dimensions. The study concludes that improving TF procedures by reducing costs, documents, and time in cross-border trade remains crucial to boosting agriculture sector performance in SSA.
1 Introduction
It is now widely known in the literature that trade significantly drives economic growth and development (Ahmed et al., 2022; Keho et al., 2017). The effects of international trade on economic growth have gained much attention and have equally stimulated an increasing body of literature since the works of Grossman and Krueger (1991). Notably, most scholars have pointed out that countries that are open to trade and accompanied by tariff reduction and removal of institutional barriers are more likely to perform better than countries that do otherwise (Zahonogo, 2016). The performance metric is not restricted to economic growth only but also cuts across issues relating to poverty alleviation, price stability, and reduction in unemployment (Figueiredo, & Lima, 2022; Sakyi et al., 2017). Consequently, developing economies have resorted to trading policies as tools that can spur development objectives such as creating employment and alleviating poverty (Ratna and Ferracane, 2013; Ngouhouo and Nchofoung, 2021; Kim and Lin, 2022). The renewed interest in trade-led growth has been accompanied by a tremendous increase in trade volume globally. Today, approximately one-fourth of total global production is exported (Esteban et al., 2018).
Similarly, country-level and regional data in the last half-century confirm the criticality of trade to sustainable growth (Tiwari et al., 2022; Wang and Zhang, 2021; Esteban et al., 2018). In light of the growing importance of trade, measures to actively facilitate it are gaining popularity. Promoting measures that ease trading has become an effective tool to help countries in developing regions such as Sub-Saharan Africa expand their trade and benefit from the dividends of globalization (Ibrahim & Ajide, 2022). Most countries in sub-Saharan Africa (SSA, hereafter) rank low in trade facilitation indicators compared to others from Asia and Europe (Ibrahim and Ajide, 2020). This is because economies in this region are characterized by a higher trading environment than their developed counterparts (de Melo and Twum, 2021).
To resolve this low-performance rating syndrome in developing regions, efforts have been made to facilitate trade. These include harmonizing nontariff barriers (NTBs) to trade through the minimization of documents required for exports and imports, increasing infrastructural facilities to promote port efficiency, enhancing custom modernization with the associated ease of border crossing, upgrading logistics and transport services, and significantly reducing days of delay in the ports. Most of these efforts are significant for the growth of the agricultural sector, with the region’s strength, most prominent provider of income and employer of labor. In addition, available statistics reveal that over 63% of the total population in SSA lives in rural areas where agriculture constitutes the primary source of income and employment (World Bank, 2014). In addition, International Labour Organization (ILO) data between 2000 and 2008 also show that the SSA region created over 73 million jobs, of which 80% emanated from both the agriculture and manufacturing sectors (Alemayehu, 2014). In light of the preceding narratives, focusing on SSA’s agricultural landscape becomes a novel decision owing to the empirical confirmation of a strong synergy between agribusiness, agricultural performance, and poverty reduction in the region.
Being predominant in SSA, agriculture has enjoyed a significant boost in production and growth rates annually. Data from the Food and Agricultural Organization (OECD/FAO, 2016, 2016) shows that agricultural production has been rising, with estimated gross outputs valued at $142 m in 2000 and $225 m in 2016. However, the sector is not free from declining revenue and unstable merchandise exports (% of GDP). According to records, the earnings in 2008, which stood at 37.8%, fell to 24.3% in 2014. A detailed comparison of the region’s merchandise exports as a share of GDP with the Asian Tigers reveals that the region lags in revenue or income from the agricultural output (OECD/FAO, 2016). Many of these problems relate to the agricultural supply chain issue in SSA. The reason is that trading procedures in the region are highly complicated and uncertain, resulting from a diverse nature of players involved, too many standards, protocols, a high level of corruption, and procedures to which agricultural goods are subjected at the port (Ibrahim & Ajide, 2020).
Similarly, available data show that most SSA agro exporters are victims of the bureaucratic nature of clearing agencies (Charles, 2016). The OECD trade facilitation indicators (2018) report equally shows that most SSA countries are ranked lower than other countries in trade facilitation efficiencies. The aftermath of these burdensome trading procedures might force farmers out of Business and eventually reduce agricultural commodities’ production and distribution processes.
1.1 Research Objectives
The present study seeks to probe how trade facilitation impacts agricultural sector performance in SSA. Although several studies exist on the nexus between trade facilitation and selected indicators such as economic growth, manufacturing capacity, household welfare, and poverty (Cadogan et al., 2006; Ratnayake et al., 2013; Hoekman and Shepherd, 2015; Seck, 2017), studies considering the impact of trade facilitation on agriculture performance are just evolving.
1.2 Research Contributions
This study is a step further toward increasing knowledge of the agricultural effects of trade facilitation in SSA. Hence, the study avails the extant literature with the following novelties. First, of all the studies conducted on trade facilitation for SSA, the agriculture sector is often neglected despite the massive reliance of the region on the sector. Thus, evaluating the impact of trade facilitation (TF) on the agricultural sector in SSA is a novel decision with immense prospects for the region’s growth path. Second, this study uses disaggregated measures of TF on agricultural value-added. This decision is necessary to implement specific policy suggestions in resolving the highlighted challenges rather than applying one cap-fits-all approach. Third, the study addresses econometric concerns such as endogeneity issues, simultaneity bias, and reverse causality using a dynamic System Generalized Method of Moments estimator.
2 Stylized Facts About Trade Facilitation and Agriculture Sector Performance in Sub-Saharan Africa
This section presents an apt analysis of stylized facts on trade facilitation indicators for sub-Saharan Africa relative to other regions. The study considers regions such as sub-Saharan Africa, Asia, and the European Union. The average TF values between 2005 and 2019 on six indicators (cost, documents, and time to import or export) are used. According to these indicators, SSA constitutes the most expensive trading environment (Figure 1). The overall trading cost in Figure 2 is a replica of the individual indicators.
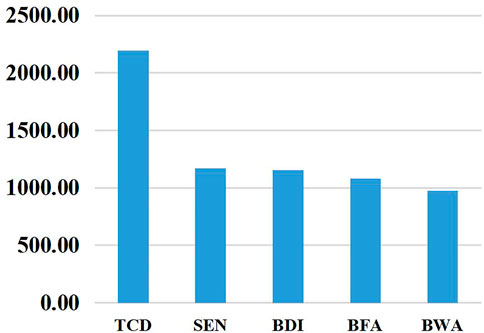
FIGURE 1. Highest (inefficient). country-specific business environment in SSA. note: TCD, Chad; SEN, Senegal; BDI, Burundi; BFA, Burkina Faso; BWA, Botswana; NAM, Namibia; ZWE, Zimbabwe; GNQ, Equatorial Guinea; NER, Niger; GHA, Ghana. Trends are measures on averages of the six indicators of TF [costs, documents, and time (to import and export)]. Source: Author’s computation with data from World Bank WDI (2018).
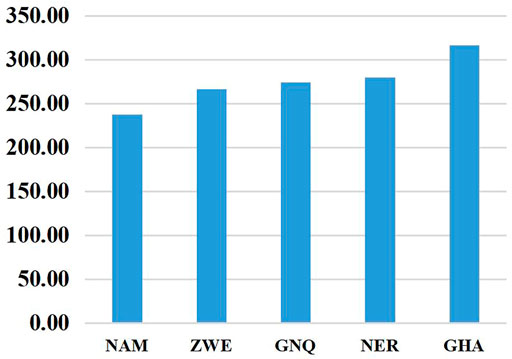
FIGURE 2. Lowest (inefficient). country-specific business environment in SSA. note: TCD, Chad; SEN, Senegal; BDI, Burundi; BFA, Burkina Faso; BWA, Botswana; NAM, Namibia; ZWE, Zimbabwe; GNQ, Equatorial Guinea; NER, Niger; GHA, Ghana. Trends are measures on averages of the six indicators of TF [costs, documents, and time (to import and export)]. Source: Author’s computation with data from World Bank WDI (2018).
Another issue observable from the figures is that the averages for SSA are equally above the world averages for all the indicators and their aggregates. In specific terms, while it takes approximately 1,983 USD (2,547.7 USD) to export (import) in SSA, it only takes 817 USD (809 USD) in East Asia & Pacific and less than 1,500 USD to export (import) in other regions. A similar trend is evident in documents 8 and 9, and approximately 33 and 39 days are required to process exports and imports in sub-Saharan Africa; their counterparts in Europe and Asia require less.
The analyses reported in Tables 1, 2 agree with the empirical findings, which note that, in terms of trading environments and reducing the bottlenecks around international trade, there is still much to improve in SSA (Sakyi et al., 2017; Ibrahim & Ajide, 2022).
Figures 1, 2 show the nature of the business environment in selected SSA countries based on trade facilitation indicators, which rank them as highest (most expensive) and lowest (least expensive). Based on the figure, Chad is ranked as the most expensive trading environment in the region. Chad’s economy is agriculturally based on emerging efforts in services that have seen exports primarily based on cattle, oil, cotton, and Arabic gum (International Trade Center (ITC), 2014). From a global view, the country ranks 152 of the 155 countries in trade logistics efficiency according to the World Bank Logistics Performance Index (LPI) (2012). This is primarily worsened by the rate of inefficient TF procedures in the country, where it takes 72 days (31 days) and costs USD 6,615 (USD 2,108) to export (import) one standard container of goods (World Bank 2014). Being landlocked, time-consuming days of trading, lack of legal frameworks on standards and technical regulations, and non-membership to international standard organizations such as the International Standardization Organization are significant challenges hindering TF efficiency in the country (International Trade Center, 2014; African Development Bank, 2009). Next to Chad on the rank is Senegal. The country is located in the West African region and borders the North Atlantic Ocean between Guinea-Bissau and Mauritania. The country was ranked 178 on the Ease of Doing Business in 2014 and ranked 110th out of 155 countries in trade logistics efficiency (World Bank Logistics Performance Index, (LPI, 2012)). In terms of high trading environments, the next country is the Republic of Burundi, which falls within the low-income group. It was rated 131 out of 132 economies based on statistics from the World Economic Forum (WEF) Enabling Trade Index (2012). Similarly, according to LPI criteria, it ranked lowest among 155 economies scoring significantly below the averages of Sub-Saharan African and low-income countries (LPI, 2012). Burkina Faso is a low-income and least developed country (LDC). WF (2014) rated it 133rd out of 138 among other African countries and equally ranked 98th out of 155 countries (LPI, 2012). The fifth economy on the list in terms of foreign market access, Botswana, is ranked 124 out of 132 countries (International Trade Center, 2014) and 91 out of 170 countries with ease of doing business (Doing business report, 2013).
Namibia, a vast and meagerly populated country located on Africa’s southwest coast, is noted as one of Africa’s most steady and peaceful political environments. Its basic infrastructures, ranging from roads to rail, air, energy, and telecommunications, are relatively well developed and recent. The economy is export-driven, mainly in the mining, tourism, fishing, and agriculture industries. According to the Doing Business 2017 report, the country ranks 108 out of 190 economies for overall ease of doing Business, down four places from its 2016 rank1.
Figure 3 presents the contribution of agriculture to GDP across the selected regions of the world from 1996 to 2015. As evident from the figure, despite the predominance of the agricultural sector in SSA, its contributions to GDP still lag behind South Asia. In addition, it is apparent that while the performance of the agriculture sector in SSA surpassed that in other regions and the world, excluding South Asia, the persistent decline witnessed in the region calls for concern. This decline in agricultural value-added can be attributed to decreased agrarian commodity prices, low demand, and currency depreciation in SSA. Although the region has enjoyed a tremendous increase in the sector’s contribution to growth, more is to be done in value addition and global competitiveness.

FIGURE 3. Agriculture contribution to GDP. note: EAS, East Asia and Pacific; ECS, Europe and Central Asia; LCN, Latin America and Caribbean; MEA, Middle East and North Africa; SAS, South Asia; SSF, Sub-Saharan Africa; Trade costs are the summation of costs, documents, and time to trade. Source: WDI (2018).
The challenges eluding the agriculture sector’s potential in SSA are traceable to trade-related barriers. Consequently, exporting agricultural produce in the region is characterized by a high degree of inefficiencies, invariably translating to increased costs for farmers in SSA. This increase in production costs translates to a rise in price compared to products from other regions, thereby reducing farmers’ competitiveness in the global market. Another problem is that most agricultural products do not meet international quality and standards. For example, it was reported that due to the inability of Nigeria to meet global food and feed safety standards, in June 2015, the European Union rejected and outrightly banned some exported food from the country for a year (Ojoye, 2017).
We can infer plausible points from the stylized facts. First, the trading environment in SSA, which constitutes the most expensive among the other selected regions, can be attributed to the inefficient TF procedures in the region. Second, the inefficient TF procedures coincide with declining agriculture sector performance. Could inefficient TF procedures be responsible for the decline in agriculture sector performance over the years? Providing empirically based evidence to answer the question remains the core of interest in the subsequent paragraphs of this paper.
3 Literature Review
Recent times have recorded unprecedented improvements in the rate of interconnectedness among economies, and these have resorted to an increase in cross-border trade in goods and services. In essence, several research studies have been conducted to identify the factors that promote cross-border trade, of which trade facilitation stands out. This section will review the empirical studies based on trade facilitation impacts on different macroeconomic variables.
Nguyen (2013), in a cross-country analysis, examined the nexuses of trade facilitation (TF), poverty, and inequality in low- and middle-income countries. TF measures bothering on export and import documents and days are employed. The results, however, reveal that improved trade facilitation positively impacts exports and GDP per capita but negatively affects poverty and inequality. The study further shows that countries with fewer trading procedures will likely record lower poverty and inequality rates. Despite the exciting results in the study, its analyses are limited to two of the three categories of trade facilitation (TF) indicators from the World Bank Doing Business database. Specifically, the study focused on documents and time to import and export and ignored costs to import and export. It is important to note that with the consideration of TF effects on poverty and inequality, trading costs become highly important because of their importance and influence on the income levels of different businesses and household consumers. In the same vein, Laping (2013) examines the association between trade facilitation and poverty reduction in Chinese and ASEAN regions. The study focuses on port efficiency indicators of trade facilitation measures and uses regional panel data analysis covering the manufacturing sectors in these regions. The findings show that a 1% increase in port efficiency leads to a corresponding decrease in the poverty index. The study further indicates that the improvement in trade facilitation processes in the region increases the volume of agricultural exports, which positively affects the alleviation of rural poverty in China. Finally, the findings show that agricultural imports negatively correlate with poverty alleviation. A significant limitation of this study is its inability to measure trade facilitation using reliable indicators such as regulation, customs procedures, and electronic commerce. This is because TF indicators became sufficiently available in 2004. Due to this constraint, the paper relied on the elasticity of ports on trade and poverty reduction in its regression analyses, which do not capture TF procedures. The findings in Laping (2013) are consistent with the empirical outcomes in Prabir and Ajitava (2013).
Tambunan (2013) evaluates the impact of trade facilitation on small and medium enterprises in Indonesia by employing a field survey. The findings reveal that trade facilitation benefits do not accrue to small- and medium-scale enterprises but are accessible by large-scale firms. It further shows that the information asymmetry of market conditions, regulations and trade policies are significant barriers to small and medium-sized enterprises (SMEs) gaining from trade facilitation. The TF measures employed in this study are based on subjective views given the survey nature of the data source. This is not sufficient to generalize the effects of TF (a macro indicator) on SMEs in Indonesia.
To ascertain the impact of trade facilitation on agriculture, Liapis (2015) conducted a study on agricultural-specific trade facilitation indicators. The study confirms that countries have improved their commitment to trade facilitation agreements, especially low- and lower-middle-income countries, although there is still room for progress. In addition, the result shows that the major constraint to agricultural trade remains the high cost of trading. The study relied on descriptive statistics in all the analyses presented, limiting the empirical validity of the advanced policy implications. Similarly, Charles (2016) examines the connection between trade facilitation and agricultural standard product compliance on export performance in Cameroon. Using the OLS technique, the study rejected the null hypothesis that standard compliance does not impact cocoa exports in Cameroon. The study also stresses the need for the government to focus more on compliance through improvements in trade facilitation policies. Insufficient data limited the research to support its empirical submissions because of the unavailability of data on Cameroon’s cocoa compliance. There are no clear indications of what is obtainable in the agricultural sector, mainly as it affects farmers through the study.
The research interest of Sakyi et al. (2017) centers around the nexuses among trade, trade facilitation, and economic growth in selected economies in Africa. The study finds that trade facilitation is a significant channel through which trade impacts economic growth in the region. The study also reveals that improving regulations, customs clearance, and infrastructure affects a firm’s participation in trade. It also notes that firms in Africa are more adaptive to changes in a business environment. The lacuna identifiable in this study is that the scope of the analyses covers the post-financial crisis events (2010–2014), while the prior periods are ignored despite the availability of data. Subashini et al. (2017) investigate the nexuses of South Asia’s trade facilitation, economic development, and poverty alleviation. The study results show that poor trade facilitation policies have contributed to trade restrictions and increased trade transaction costs among countries in South Asia. It also states that landlocked countries are the most affected in terms of earlier effects. The study submits that an efficient trade facilitation process will allow countries in the region to participate freely in international trade. The study’s limitation is evident in data sourced through an online database. There is no gainsaying that data points collected through survey design are best suited for microanalysis and not for macro, let alone focusing on regional study. The need to evaluate whether social welfare responds to trade facilitation prompts the research objective in Sakyi et al. (2018) for forty African countries. The findings reveal that well-harmonized trading procedures lead to improved social welfare on the continent. As much as this study provides convincing empirical contributions, two main limitations are evident. First, the paper could not examine the channels of effects of TF through increasing trade volumes and revenues, price of imported goods, domestic firms’ competitiveness, and employment enhancement, which were part of the study’s objectives. Second, analyses of the study rely on restricted sample size (forty countries within 5 years).
Bonuedi et al. (2020) investigate how relaxing cross-border trade measures impact food security (FS) in 45 African economies from 2006 to 2015. The study employs the system generalized method of moments (Sys-GMM), and the empirical results show that inefficient TF measures exacerbate food insecurity on the continent. Consequently, promoting policies to reduce administrative barriers in terms of border and documentary compliance is suggested to improve food security in Africa. Fontagné et al. (2020) examine the heterogeneous impacts of TF on small firms’ exports. The study observes divergence in the effects of TF measures on the exportation of commodities. In terms of limitation, data unavailability constitutes the most challenging because analyses in the study cover 1 year (2010). Gillson & Saez (2020) investigate the effects of TF on trade in services by focusing on the tripartite role of institutions, transparency, and governance. The empirical outcomes reveal that the impacts of TF procedures are higher than those of other restriction policies. Ismail (2020) evaluates the dimensional effects of digital procedures on trade performance in the Asian region. The three dimensions of digital exploration are digital usage, security, and infrastructure, with 20 selected trade partners. The estimation technique focuses on the gravity model from 2003 to 2017. The empirical outcomes show that digitalizing and enhancing security help to improve trading procedures.
Tang (2021) assesses the interconnection between trade facilitation and tourism inbound efficiency from 2011 to 2017. The findings show that higher growth rates are recorded when procedures are relaxed for sightseeing tourists. Consequently, strengthening Japan’s weakness in inbound tourism is highly recommended for the Asian market. The limitation of this study is that it focuses on the influence of TF on inbound tourism in Japan without providing background information on the nature of TF in the country. Providing such information is necessary because the nature of TF (relaxed or stringent) determines the direction of its effects on inbound tourism and other macroeconomic indicators. Hendy and Zaki (2021) test the association between administrative trade barriers and firm exports in Egypt from 2005 to 2016. The findings reveal that time to trade negatively affects performance in the agriculture and manufacturing sectors. The major lacuna that is obvious in the study is that TF indicators on cost and documentation are not considered in the analyses, whereas only time variables are employed. The findings reveal that TF significantly promotes environmental quality in SSA. Ibrahim and Ajide (2021) examine the association between TF and foreign direct investment (FDI) in 26 selected African countries from 2004 to 2014. The findings reveal that TF impedes the inflow of FDI to the nation. A major limitation of this study is its assumption of homogeneous FDI inflows. The study did not state which type of FDI inflows TF hinders since FDI flows to different sectors in every economy. The environmental impacts of trade facilitation constitute the core research interest for Ibrahim and Ajide (2022) in forty-eight sub-Saharan African (SSA) countries from 2005 to 2014. The study employs the pooled mean group and system generalized method of moments to evaluate how TF measures deter or enhance the environment.
The review of the existing studies on the impacts of trade facilitation in the preceding paragraphs highlights some notable gaps in the literature. First, a strand of extant studies has successfully provided evidence for the effects of TF on some macroeconomic variables, such as economic growth, poverty rate, inequality, and social welfare (Sakyi et al., 2017; Subashini et al., 2017; Prabir and Ajitava 2013). Another strand assessed the impact of TF on firms’ productivity (Seck, 2017; Hoekman and Shepherd, 2015; Tulus, 2015). That notwithstanding, the effects of TF at the sector level are still budding. While a few studies have evaluated the impacts of TF on manufacturing, service, and agriculture, an assessment of such effects in the SSA context is scarce, especially for the agricultural sector. Since agriculture remains the mainstay of economic activities in SSA, evaluating the impacts of TF on the sector’s performance becomes very important. In addition, this study employs disaggregated TF measures on different agricultural sector performance indicators. This decision becomes necessary to enable a specifically tailored policy action. Third, the study addresses econometric concerns such as endogeneity issues, simultaneity bias, and reverse causality using a dynamic System Generalized Method of Moments estimator.
4 Methodology
This section presents the method adopted in this study to explain the functional relationship between trade facilitation and agriculture sector performance in SSA. To achieve this objective, two subsections are presented, which comprise strategic modeling and the estimation technique.
4.1 Strategic Modeling
The extent to which trade facilitation hinders or enhances the performance of the agriculture sector in SSA is examined by specifying a standard dynamic panel equation:
Where lnASPit is the log of agriculture performance (proxy by agriculture value-added, constant 2010 US$).
4.2 Estimation Technique
In estimating the functional relationship between trade facilitation (TF) and agriculture sector performance (ASP), as illustrated in the models above, endogeneity often arises, raising many concerns about the reliability and validity of the parameter estimates. Such circumstances may occur due to the likely reaction of the outcome variable to the explanatory variables (Sakyi et al., 2018). For instance, countries with better trade facilitation policies and programs, such as good agricultural policies, increased subsidies to farmers, and a high contribution of agriculture to GDP, are usually characterized by high productivity, economic prosperity, and advanced TF measures that stimulate positive effects on growth in the agriculture sector.
Another issue of pertinence to estimating Eq. 1 revolves around the lagged value of the outcome variable, which is specified among regressors. This is particularly an issue of concern in a dataset constituted by T and large N, making it vulnerable to first- and second-order autoregressive terms (AR1 and AR2). The illustrated circumstances are hard to account for in ordinary least squares and within-group methods, resulting in inconsistent and biased estimates. Conventionally, employing instrumental variables for the explanatory variables has proven efficient in resolving the identified issues. For instance, in a related study that focuses on trade facilitation and food security in Africa, Bonuedi et al. (2020) used distance to Frontier as an instrument for trade facilitation.
Drawing from the above narratives, the current relies on the novel system generalized method of moment estimator -GMM following extant studies (Bonuedi et al., 2020; Ibrahim and Ajide, 2022). This technique accounts for the potential estimation issues stemming from endogeneity, simultaneity, and reverse causality. Consistent with Ibrahim & Ajide (2022) and Asongu and Odhiambo (2019), the system GMM estimator is specified below.
Where the variables in Eq. 2 are as previously defined, identification and exclusion restrictions criteria are employed to advance the system’s validity and reliability of the system GMM outputs. The exclusion restriction assumes endogeneity or predetermination of the explanatory variables under the assumption of strict exogenous variables (Tchamyou et al., 2019; Boateng et al., 2018; Tchamyou and Asongu, 2017). This proposition is consistent with Roodman (2009), who advanced that it is infeasible to take time-invariant variables to be endogenously determined after a first difference. Consequently, the null hypothesis of the difference in the Hansen test (DHT) should be accepted to validate the exclusion restriction conditions. Based on the IV approach, failure to reject the overidentifying null hypothesis suggests that the strictly exogenous variables moderately estimate the explained variable (Asongu and Nwachukwu 2016). In other words, the applicability of the exclusion restriction assumption is subject to the acceptance of the null hypothesis of the DHT.
4.3 Data Requirements and Sources
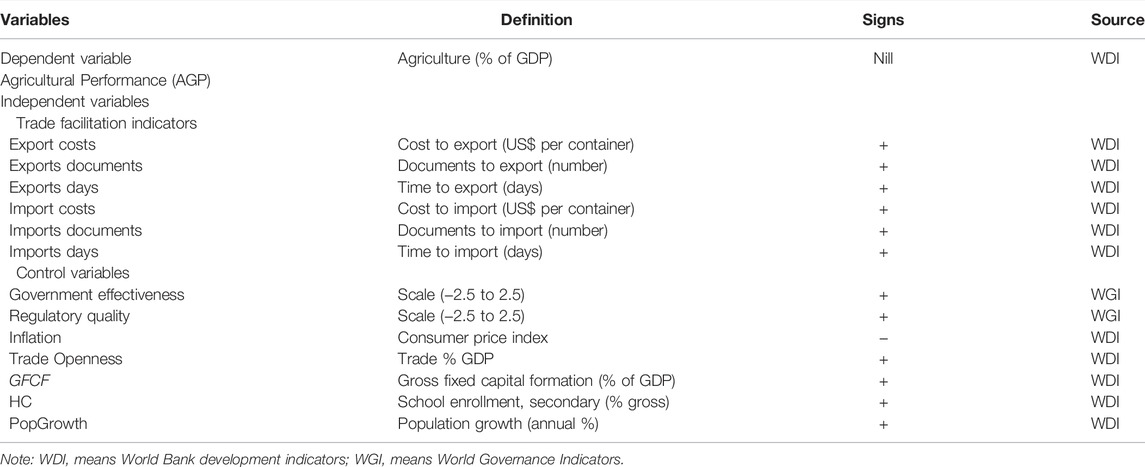
The analysis in the current study covers from 2005 to 2019 across 33 sub-Saharan African economies. The data used are sourced from World Bank’s Development Indicators (WDI) and World Governance Indicators (WGI) statistics. The coverage of countries and period are influenced by the availability of data on all relevant variables. The dependent variable is agriculture sector performance, while the explanatory variables include trade facilitation indicators and other control variables. A thorough definition of the independent and the explained variables is provided in Table 3.
4.4 Descriptive Analysis
Table 4 details the descriptive statistics of the study. The table shows that agriculture sector’s performance maintains a positive mean value of 23.38%. However, the standard deviation (SD) stands at 15.3%, which is not too far from the mean. This intuitively portrays how volatile the sector is to both internal and external shocks2. Considering the various components of trade facilitation (TF), it will be observed that, from both ends of costs, documents and time, it takes more to import (7.24, 8.43, and 37.27) than export (7.23, 7.24, and 27.7), respectively. This could imply that aside from the administrative hurdles of TF, other barriers to trade, such as taxes and quotas, add more to the costs of imports than exports. Moreover, while exporters (farmers) may enjoy some waivers from the government to boost production activities in the local sectors, the reverse could apply to importers in the form of high tariff measures and sanctions on imported products. Assessing the covariates, it is interesting to note that population growth has a low deviation (0.88%) from its mean, which supports the population structure in SSA as one with surplus labor in the agriculture sector.
On the other hand, the deviation of human capital (25.1%) from its mean is higher, which explains the vulnerability of the agriculture sector to skilled labor. A logical explanation for this scenario is that the agriculture sector employs more unskilled laborers in rural areas. As these laborers gain more skills, they move to the urban area for jobs with more wages. Above all, the descriptive statistics show that while agriculture performance seems to be vulnerable, on the one hand, the operating environments in terms of the indicators of trade facilitation are equally inefficient. The inefficient nature of TF is more evident in imports (consumption) than exports (production).
5 Presentation of Empirical Results
5.1 Main Results
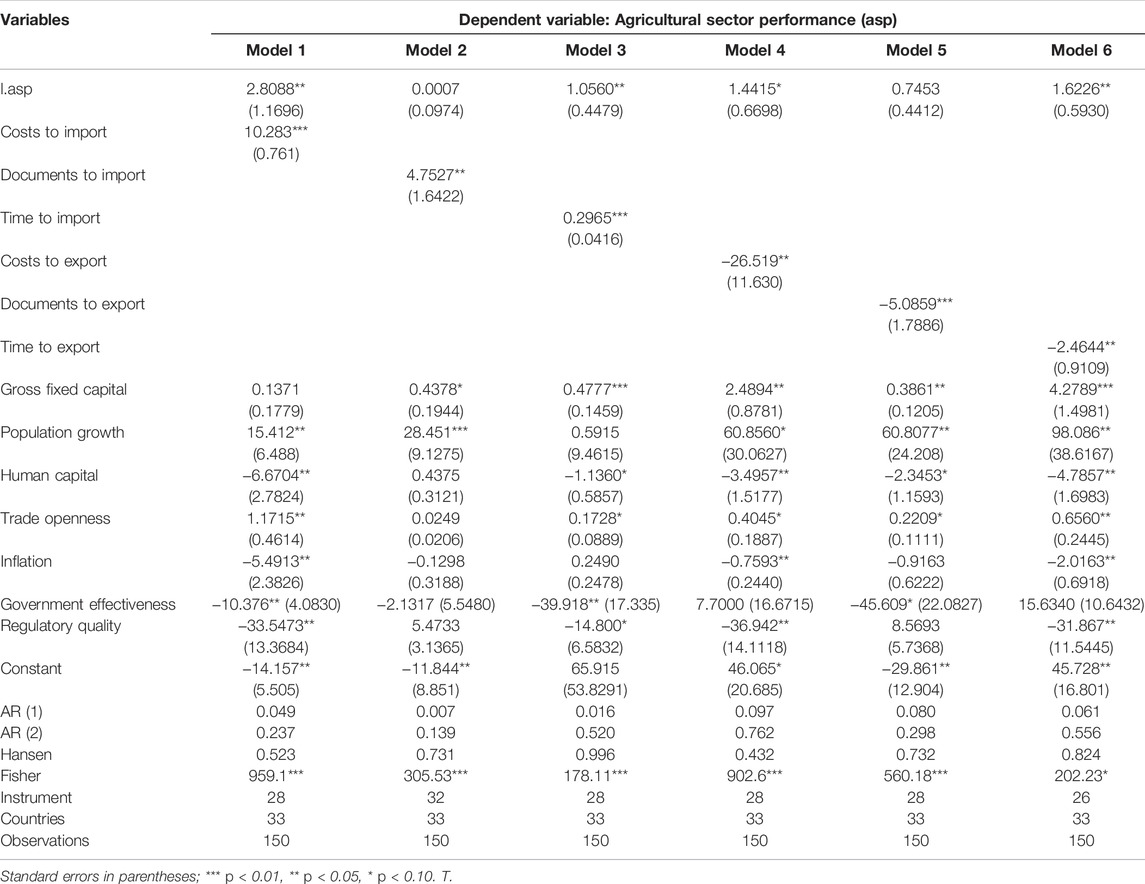
The findings from the estimated model are in Table 5. The lagged agricultural sector performance values exert positive and significant impacts across the four models. This shows that the performance of the agriculture sector in the previous year tends to overlap with that in the current year positively. Furthermore, absolute convergence is validated since these positive values stand between 0 and 1 with statistical significance. This convergence implies that SSA economies with lower agricultural sector performance are catching up with others whose performance is higher.
Regarding the principal variables in the model, costs, documents, and time positively predict agricultural sector performance (ASP). This result implies that, all things being equal, a percentage increase in costs, documents, and time required to import will result in a significant rise in agriculture output by 10.2, 4.7, and 0.30%, respectively. An economic intuition that can justify this result is that the volumes of agricultural products imported into SSA countries will decrease with an increase in costs, documents, and time to import. Prices will increase since the processing costs can be shifted to the final consumers. When foreign agricultural goods are scarce, and prices are higher than local products, a rational consumer will shift his demands to local products (substitution effects). This decision by consumers of agricultural products will increase production in the economy’s agriculture sector, which will subsequently lead to an increase in the sector’s performance in terms of total outputs. This result reflects the operating environment of SSA in a situation where restrictive import measures are being embarked on imported agricultural products to protect the domestic market. This result is consistent with Louise and Thomas (2020), who noted that SSA had recorded an increase in the rate of agricultural production since 2000, while imports have decreased significantly.
The opposite is evident in the indicators of export costs, which are all negatively signed and statistically significant. Consequently, a 1% increase in export costs, documents, and time result in 26.5, 5.1, and 2.5% decrease in agriculture sector outputs. The high costs to export lead to increased production costs, which can generally reduce agricultural outputs, escalate prices of agricultural products, lessen the income of farmers/investors, and, at the extreme, cause food insecurity. In addition, the administrative procedures involved in completing all documentation in exporting agricultural products add more to the overall costs. The significance of time to export can be adjudged as plausible and applicable, going by the fact that most agriculture outputs are perishable, requiring instantaneous supply upon completion of processing. In addition, since the inventory system and infrastructure facilities in SSA are equally poor, any further delay at the ports will affect the exchange of agricultural products. The preceding could be categorized as the direct effects of TF on agriculture sector performance. On the other hand, the results could, by extension, discourage investors from investing in agribusinesses, which is the indirect effect.
Considering other factors that could also affect agriculture sector performance, the feedback from gross fixed capital formation, population growth rate, and trade openness promote an increase in agricultural outputs, while infrastructure, human capital, government effectiveness, and regulatory quality reduce it. While the spur factors are understandable owing to their contributions to increasing agricultural productivity, on the one hand, we find the prospects of the sector to be regressing rather than progressing from the deterrent factors on the other hand. For instance, human capital development attenuates the value of the agricultural sector, as indicated by its negative priors. The result seems logical since most of the agricultural sector workforces are unskilled labor with low salary schemes. However, as more skills are acquired through investment in health and education, they seek better-paid jobs in the city. This scenario leads to a shortage of workforce in the agriculture sector (the dual-sector model)3. The validity and reliability of the estimated models are ascertained using post estimation statistics of first- and second-order correlation tests, Hansen tests, and the Fisher. Furthermore, the serial correlation test did not equally reject the null of no second-order autocorrelation, while it rejects the null of no first-order autocorrelation.
5.2 Robustness Checks
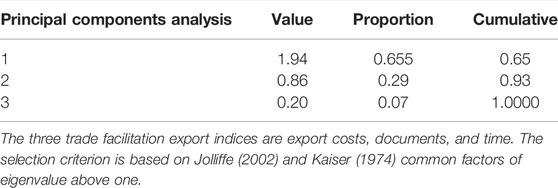
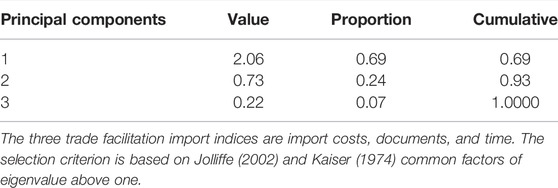
To broaden our understanding of the present study, we resort to a robustness check, which, according to Lu and White. (2014), is an empirical exercise conducted to evaluate how exact the essential parts of regression coefficient estimates react due to modifications in the model by adding or removing key variables. Consistent with Sakyi et al. (2017), we unbundled the indicators of TF into three categories, namely, import costs (cost, documents, and days to import), export costs (costs, documents, and days to export), and trade costs (costs, documents and days to import and export), using principal component analysis (PCA) with the results presented in the Appendix. This is necessary to inquire whether the aggregation of TF impacts will be consistent with the disaggregated indicators in terms of the sign, magnitude, and significance.
5.2.1 Case of Agricultural Trade
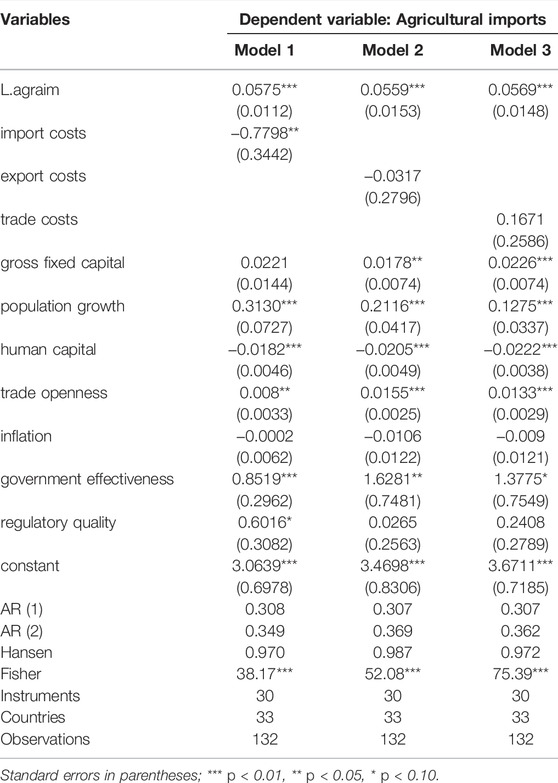
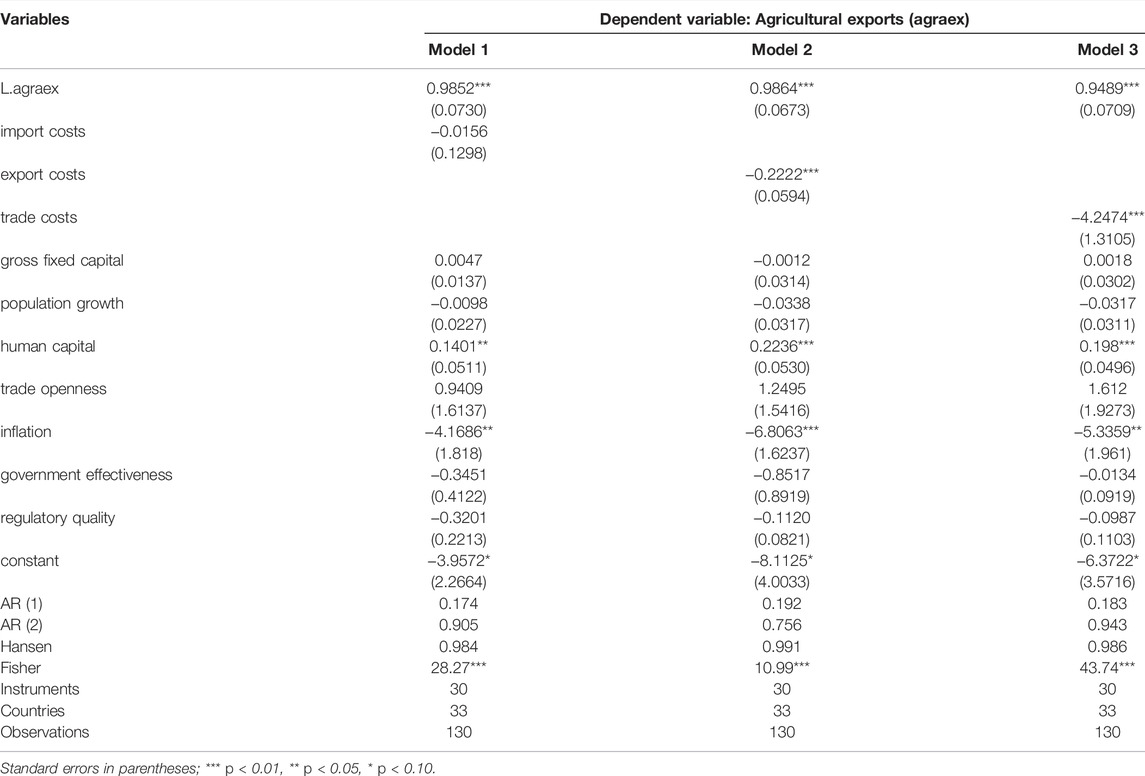
The first set of robustness checks involves accounting for the impacts of TF on agricultural trade from import and export angles. Tables 6, 7 present the effects of TF on agricultural imports and exports, respectively. The two tables show that import costs negatively affect agricultural imports (Table 6), and a similar sign is evident for export costs (Table 7). The implications of the results are that cumbersome administrative procedure in terms of unnecessary delays at the ports, excessive numbers of document requirements that are often repeated, and high charges that farmers are subjected to restrict the importation and exportation of agricultural products. Similarly, the impacts of trade costs are equally negative from ends (imports and exports).
Among the control variables (Table 6), gross fixed capital formation, population growth, trade openness, government effectiveness, inflation, and regulatory quality negatively impact it. For the results on gross fixed capital formation, the economic meaning that can be given to these results could imply that lack of sufficient farm buildings, machinery and equipment, plantations, land improvements, and livestock, among others, reduce agricultural outputs, which create supply shortages. To meet the demand of the growing population, the option of import becomes inevitable. By doing so, imports are indirectly enhanced. The positive impacts of population growth imply that an increase in population creates pressures on local food production and other agricultural products, thereby making importation a perfect supplemental option. The positive effects of trade openness mean that openness to global markets enhances the importation of agricultural products. In addition, when regulations intended to protect small farm holders and other agribusinesses from foreign competitors are not strictly enforced, importation of agricultural products with local substitutes thrives. The positive effects of inflation can be explained from the viewpoint of substitution effects through price differences between local and foreign products. That is, the increase in the price of local farm products stimulates consumers’ choice to shift to demand imported products. The adverse effects of human capital could imply that improvements in farmers’ skills and productivity reduce the importation of agricultural goods.
The statistically significant control variables in Table 7 are human capital and inflation with positive and negative signs, respectively. These results imply that improvements in labor skills and efficiency promote trade in the sector’s goods through exportation, while inflation rates impede it.
5.2.2 The Case of Annual % Growth of the Agriculture Value-Added
The second robustness check considers the impacts of TF on the agriculture growth rate in Table 8. The overall impacts are consistent with previous results regarding the adverse effects of TF on agricultural trade (Tables 5, 7). Specifically, import costs, export costs, and trade costs impede the growth rates of the agriculture sector. The results are intuitive because high costs in trading environment occasioned by inefficient TF would lead to an increase in the price of agriculture products, leading to a reduction in demand at local and foreign markets. Lack of competitiveness of the agriculture products would frustrate farmers’ efforts and discourage foreign investors, thus resulting in deterioration of the sector and impeding desirable growth.
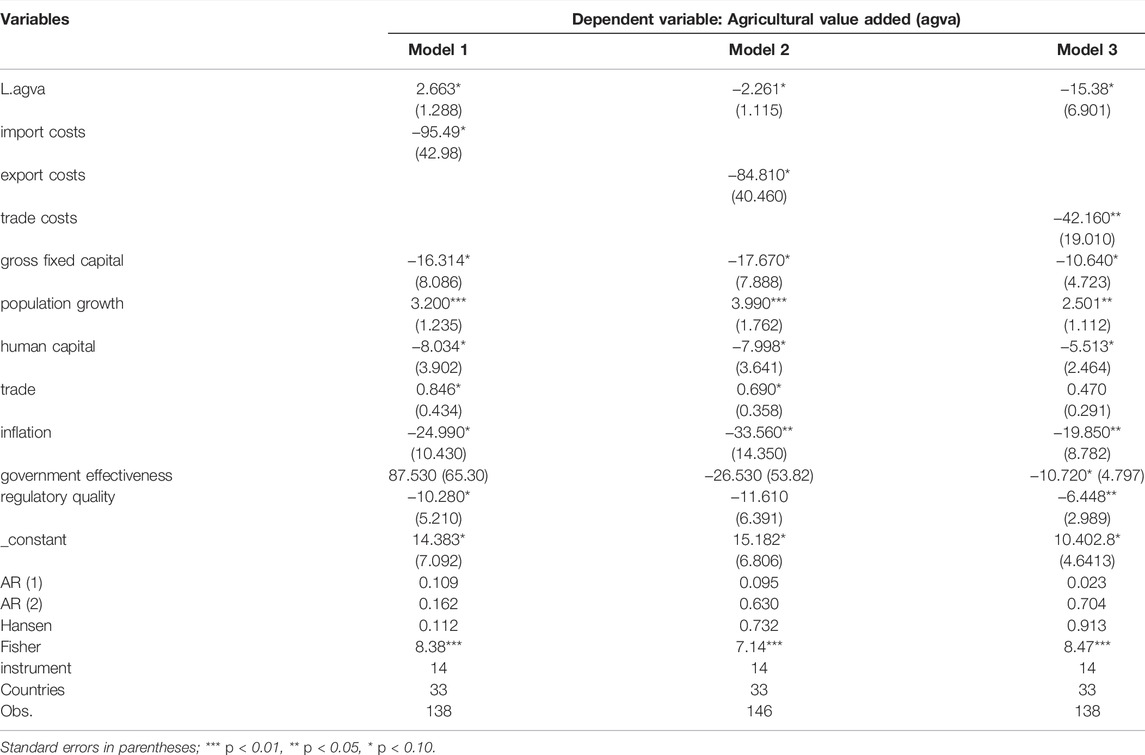
TABLE 8. Robustness check using the annual % growth for the calculation of the agriculture value-added.
5.2.3 The Case of Labor Productivity
The third robustness check is conducted by altering the outcome variables, focusing on labor productivity proxy by per worker value added to the agriculture sector. The value-added per worker is an effective measure of labor productivity. The prime objective here is to examine how TF enhances or distorts agricultural labor productivity. This is necessary given the large share of agriculture to GDP in the region and the abundance of available workforce in the sector. The results in Table 9 conform with previous outcomes and are equally intuitive for the region. This is obvious from the negative impacts of import, export, and trade costs on labor productivity. By implication, a percentage increase in a trading environment in SSA results in corresponding labor productivity in the agriculture sector. Intuitively, the impacts of TF on agriculture products lead to a reduction in demand for them due to the high price, and investors are disincentive, given the increased risks of the perishable nature of agriculture products coupled with the long days of delay in the port. These undesirable conditions halt production expansion and thus reduce the average productivity of every additional labor employed in the sector.
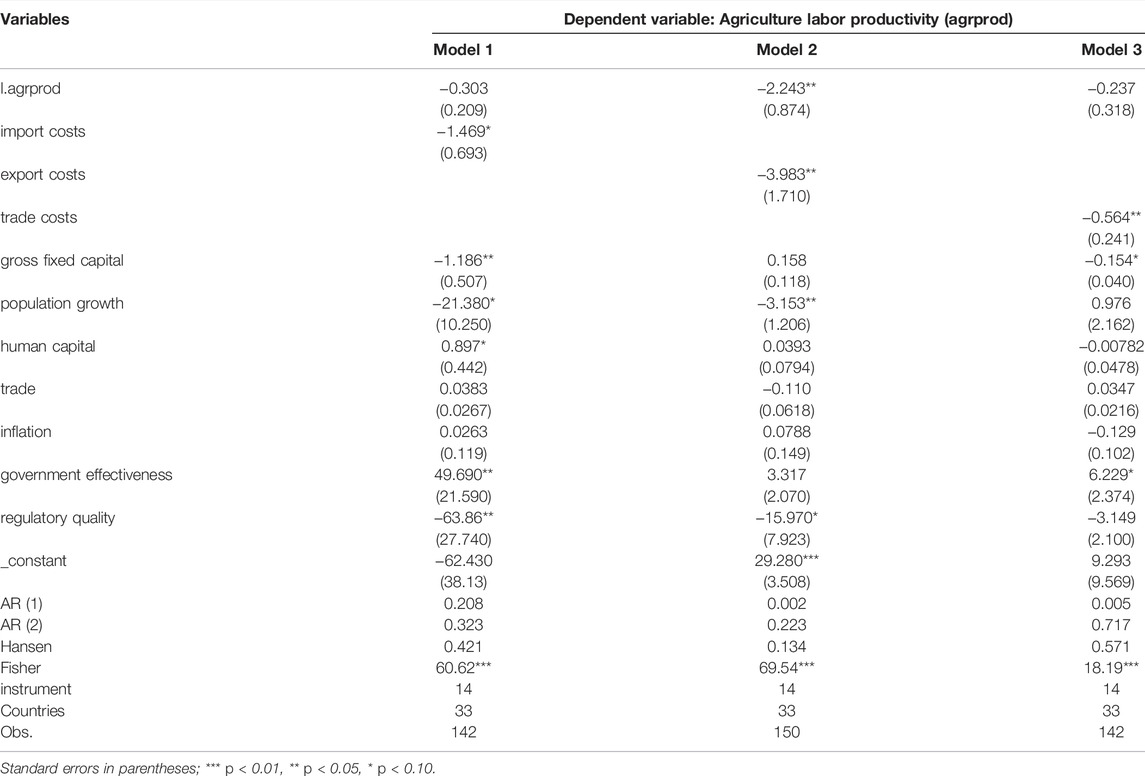
TABLE 9. Robustness check using labor productivity for the calculation of the agriculture value-added.
6 Conclusion and Policy Recommendation
This study investigated the impact of trade facilitation (TF) on agriculture sector performance (ASP) by utilizing annual data covering 2005 to 2019 in a panel of thirty-three Sub-Saharan African countries. The study used six trade facilitation indicators comprising costs, documents, and days to import and export. These TF measures are examined on agriculture value added (% of GDP). The empirical model is estimated based on the Dynamic System of Generalized Method of Moments technique with the following outcomes. First, the indicators of TF on import procedures significantly and positively affect ASP. Second, the trade facilitation measures regarding exports involving costs, documents, and time exert significant negative impacts on ASP. Third, substantial effects are reported from the control variables such as human capital, gross fixed capital formation, population growth, trade openness, regulatory quality, and government effectiveness on agricultural sector performance. On the policy front, overhauling trade facilitation procedures for efficiency and effectiveness purposes and strengthening institutional frameworks are potentially required antidotes to enhance agriculture and other agrobusiness metrics. Going forward, ascertaining the threshold levels of TF required to combat poor performance in the agriculture sector remains a potential area for future research.
The analyses in this study are constrained in two ways. First, considering the other factors that affect the agriculture sector fails to cater to whether the indicators rainfall and temperature are fundamental to driving productivity in the sector. Future studies can consider this cavity. Second, the study did not consider the multidimensional nature of the SSA region in estimating the effects of TF on agriculture sector performance. Considering the nature of TF in the various subregions in SSA, such as the Eastern, Western, Southern, and Northern regions, could further reveal a new dimension to the inquiry.
Data Availability Statement
The raw data supporting the conclusions of this article will be made available by the authors, without undue reservation.
Author Contributions
RI, ZY, and SH contributed to conception and design of the study. RI organized the database. RI performed the statistical analysis. ZY, KA, MT, and AK wrote the first draft of the manuscript. RI, ZY, SH, KA, MT, and AK wrote sections of the manuscript. All authors contributed to manuscript revision, read, and approved the submitted version.
Funding
This research is partially supported by the Beijing Key Laboratory of Urban Spatial Information Engineering (NO. 20210218).
Conflict of Interest
The authors declare that the research was conducted in the absence of any commercial or financial relationships that could be construed as a potential conflict of interest.
Publisher’s Note
All claims expressed in this article are solely those of the authors and do not necessarily represent those of their affiliated organizations, or those of the publisher, the editors and the reviewers. Any product that may be evaluated in this article, or claim that may be made by its manufacturer, is not guaranteed or endorsed by the publisher.
Acknowledgments
The authors are thankful to Governance and Policy Design Research Lab (GPDRL) and Prince Sultan University for providing APC for this publication.
Footnotes
1For details about other countries, see; http://www.intracen.org/default.aspx
2This is understandable as the sector's core output is the primary product that is highly vulnerable to internal and external shocks.
3The Lewis model (1954) explains the nature of a developing country's growth regarding the transition of labor between the capitalist and subsistence sectors. The model posits that a developing economy has a surplus of unskilled labor in the agricultural sector enticed by higher wages in the manufacturing sector.
References
Ahmed, F., Kousar, S., Pervaiz, A., Trinidad-Segovia, J. E., del Pilar Casado-Belmonte, M., and Ahmed, W. (2022). Role of Green Innovation, Trade and Energy to Promote Green Economic Growth: a Case of South Asian Nations. Environ. Sci. Pollut. Res. 29 (5), 6871–6885. doi:10.1007/s11356-021-15881-4
Alemayehu, K. K. (2014). Agribusiness in Sub-saharan Africa: Pathways for Developing Innovative Programs for Youth and The Rural Poor. Washinton, D.C: Working Paper for Mastercard Foundation.
Asongu, S. A., and Nwachukwu, J. C. (2016). The Mobile Phone in the Diffusion of Knowledge for Institutional Quality in Sub-Saharan Africa. World Dev. 86, 133–147. doi:10.1016/j.worlddev.2016.05.012
Asongu, S. A., and Odhiambo, N. M. (2019). How Enhancing Information and Communication Technology Has Affected Inequality in Africa for Sustainable Development: An Empirical Investigation. Sustain. Dev. 27 (4), 647–656. doi:10.1002/sd.1929
Boateng, G. O., Neilands, T. B., Frongillo, E. A., Melgar-Quiñonez, H. R., and Young, S. L. (2018). Best Practices for Developing and Validating Scales for Health, Social, and Behavioral Research: a Primer. Front. Public Health 6, 149. doi:10.3389/fpubh.2018.00149
Bonuedi, I., Kamasa, K., and Opoku, E. E. O. (2020). Enabling Trade across Borders and Food Security in Africa. Food Sec. 12 (5), 1121–1140. doi:10.1007/s12571-020-01095-y
Cadogan, J. W., Cui, C. C., Morgan, R. E., and Story, V. M. (2006). Factors Facilitating and Impeding the Development of Export Market-Oriented Behavior: A Study of Hong Kong Manufacturing Exporters. Ind. Mark. Manag. 35, 634–647. doi:10.1016/j.indmarman.2005.06.014
Charles, F. M. (2016). The Impact of Trade Facilitation on Agricultural Products Standard Compliance in Relation to Cameroon's Export Performance. J. Food Process Technol. 7, 624. doi:10.4172/2157-7110.1000624
de Melo, J., and Twum, A. (2021). Prospects and Challenges for Supply Chain Trade under the Africa Continental Free Trade Area. J. Afr. Trade. 8, 49–61. doi:10.2991/jat.k.210105.001
Figueiredo, E., and Lima, L. R. (2022). Unintended Consequences of Trade Integration on Child Labor. J. Econ. Behav. Organ. 194, 523–541. doi:10.1016/j.jebo.2021.12.024
Fontagné, L., Orefice, G., and Piermartini, R. (2020). Making Small Firms Happy? The Heterogeneous Effect of Trade Facilitation Measures. Rev. Int. Econ. 28 (3), 565–598. doi:10.1111/roie.12463
Gillson, I., and Saez, S. (2020). Trade Facilitation in Services: Concepts and Empirical Importance. Northwest Washington D.C: World Bank Policy Research Working Paper. doi:10.1596/1813-9450-9233
Grossman, G. M., and Krueger, A. B. (1991). Environmental Impacts of a North American Free Trade Agreement. Natl. Bureau Econ. Res. 3914. doi:10.3386/w3914
Hendy, R., and Zaki, C. (2021). Trade Facilitation and Firms Exports: Evidence from Customs Data. Int. Rev. Econ. Finance 75, 197–209. doi:10.1016/j.iref.2021.03.023
Hoekman, B., and Shepherd, B. (2015). Who Profits from Trade Facilitation Initiatives? Implications for African Countries☆. J. Afr. Trade. 2, 51–70. doi:10.1016/j.joat.2015.08.001
Ibrahim, R. L., and Ajide, K. B. (2021). Is Trade Facilitation a Deterrent or Stimulus for Foreign Direct Investment in Africa? Int. Trade J. 36, 77–101. doi:10.1080/08853908.2021.1937407
Ibrahim, R. L., and Ajide, K. B. (2022). Trade Facilitation and Environmental Quality: Empirical Evidence from Some Selected African Countries. Environ. Dev. Sustain 24 (1), 1282–1312. doi:10.1007/s10668-021-01497-8
Ibrahim, R. L., and Ajide, K. B. (2020). Trade Facilitation, Institutional Quality, and Sustainable Environment: Renewed Evidence from Sub-Saharan African Countries. J. Afr. Bus. 23, 281–303. doi:10.1080/15228916.2020.1826886
International Trade Center (2014). Trade Impacts for Good-Annual 2014 Report. Available at https://www.intracen.org/uploadedFiles/AR2014.pdf (Accessed on September 20, 2021).
Ismail, N. W. (2020). Digital Trade Facilitation and Bilateral Trade in Selected Asian Countries. Stud. Econ. Finance. 38, 257–271. doi:10.1108/sef-10-2019-0406
Keho, Y. (2017). The Impact of Trade Openness on Economic Growth: The Case of Cote d'Ivoire. Cogent Econ. Finance 5 (1), 1332820. doi:10.1080/23322039.2017.1332820
Kim, D.-H., and Lin, S.-C. (2022). Trade Openness and Environmental Policy Stringency: Quantile Evidence. Sustainability 14 (6), 3590. doi:10.3390/su14063590
Laping, W. (2013). Trade Facilitation and Poverty Reduction: China-ASEAN Region CaseStudy A Study by The Asia-Pacific Research and Training Network on Trade (ARTNET). Available at: https://repository.unescap.org/handle/20.500.12870/1415 (Accessed May 23, 2022)
Liapis, P. (2015). “Agricultural Specific Trade Facilitation Indicators,” in OECD Food Agriculture and Fisheries Papers (Paris: OECD Publishing). doi:10.1787/5js4wzp09q6f-en
Louise, F., and Thomas, S. J., (2020). Unlocking the Misconceptions about Africa Food Imports. Available at https://www.brookings.edu/blog/africa-in-focus/2020/12/14/unpacking-the-misconceptions-about-africas-food-imports/ a=. (Accessed September 9, 2021.
Lu, X., and White, H. (2014). Robustness Checks and Robustness Tests in Applied Economics. J. Econ. 178 (P1), 194–206. doi:10.1016/j.jeconom.2013.08.016
Ngouhouo, I., and Nchofoung, T. N. (2021). Does Trade Openness Affects Employment in Cameroon? Foreign Trade Rev. 56 (1), 105–116. doi:10.1177/0015732520961307
Nguyen, V. C. (2013). Poverty, Inequality and Trade Facilitation in Low- and Middle-Income Countries. Asia-Pacific Res. Train. Netw. Trade 2013, 37–80. doi:10.18356/e428e6c6-en
OECD/FAO (2016). International Regulatory Co-operation and International Organizations: The Case of the Food and Agriculture Organization of the United Nations (FAO)”. Paris: OECD and FAO. Available at: https://www.oecd.org/gov/regulatory-policy/FAO_Full-Report.pdf (Accessed May 20, 2022).
Ojoye, T. (2017). EU Rejects 67 Nigerian Food in Two Years. Available at https://punchng.com/eu-rejects-67-nigerian-foods-two-years/ (Accessed January, 2022).
Prabir, D., and Ajitava, R. (2013). “Trade Facilitation and Poverty Reduction in Asia and the Pacific:A Case Study of a South Asian Economic Corridor,” in A Study by The Asia-Pacific Research and Training Network on Trade (ARTNET) (Northwest Washington DC).
Ratna, R. S., and Ferracane, M. F. (2013). Trade Facilitation and Poverty Reduction: Literature Review and Framework Impacts of Trade Facilitation Measures on Poverty and Inclusive Growth: Case Studies from Asia. Bangkok: ESCAP.
Ratnayake, R., Ratna, R. S., Ferracane, M. F., and Duval, Y. (2013). “Impacts of Trade Facilitation Measures on Poverty and Inclusive Growth: Case Studies from Asia,” in A Study by The Asia-Pacific Research and Training Network on Trade (ARTNeT) (Bangkok: ESCAP).
Roodman, D. (2009). A Note on the Theme of Too Many Instruments. Oxf. Bull. Econ. statistics 71 (1), 135–158. doi:10.1111/j.1468-0084.2008.00542.x
Sakyi, D., Bonuedi, I., and Opoku, E. E. O. (2018). Trade Facilitation and Social Welfare in Africa. J. Afr. Trade 5 (1-2), 35–53. doi:10.1016/j.joat.2018.08.001
Sakyi, D., Villaverde, J., Maza, A., and Bonuedi, I. (2017). The Effects of Trade and Trade Facilitation on Economic Growth in Africa. Afr. Dev. Rev. 29 (2), 350–361. doi:10.1111/1467-8268.12261
Seck, A. (2017). Trade Facilitation and Trade Participation: Are Sub-Saharan African Firms Different?. J. Afr. Trade. 3, 23–39. doi:10.1016/j.joat.2017.05.002
Subashini, P., Siriwardana, M., and Mounter, S. (2017). “Trade Facilitation, Economic Development and Poverty Alleviation: South Asia at a Glance,” in Poverty, Inequality and Policy (Rijeka, Croatia: IntechOpen). doi:10.5772/intechopen.69948
Tambunan, T. T. (2013). Ongoing Trade Facilitation Improvement: Its Impact on Export-Oriented Small and Medium-Sized Enterprises in Indonesia ARTNeT Working Paper Series. Asia-Pacific Bangkok: Research and Training Network on Trade.
Tang, R. (2021). Does Trade Facilitation Promote the Efficiency of Inbound Tourism? The Empirical Test Based on Japan. Int. J. Tour. Res. 23 (1), 39–55. doi:10.1002/jtr.2390
Tchamyou, V. S., and Asongu, S. A. (2017). Information Sharing and Financial Sector Development in Africa. J. Afr. Bus. 18 (1), 24–49. doi:10.1080/15228916.2016.1216233
Tchamyou, V. S., Erreygers, G., and Cassimon, D. (2019). Inequality, ICT and Financial Access in Africa. Technol. Forecast. Soc. Change 139, 169–184. doi:10.1016/j.techfore.2018.11.004
Tiwari, A. K., Nasreen, S., and Anwar, M. A. (2022). Impact of Equity Market Development on Renewable Energy Consumption: Do the Role of FDI, Trade Openness and Economic Growth Matter in Asian Economies? J. Clean. Prod. 334, 130244. doi:10.1016/j.jclepro.2021.130244
Wang, Q., and Zhang, F. (2021). The Effects of Trade Openness on Decoupling Carbon Emissions from Economic Growth - Evidence from 182 Countries. J. Clean. Prod. 279, 123838. doi:10.1016/j.jclepro.2020.123838
World Bank (2014). Health, Nutrition and Population Statistics Database. Washington DC, UN:: World Bank.
Zahonogo, P. (2016). Trade and Economic Growth in Developing Countries: Evidence from Sub-Saharan Africa. J. Afr. Trade 3 (1-2), 41–56. doi:10.1016/j.joat.2017.02.001
Appendix
Keywords: trade facilitation, agricultural sector performance, economic sustainability, Sub-Saharan African countries, policy implications
Citation: Ibrahim RL, Yu Z, Hassan S, Ajide KB, Tanveer M and Khan AR (2022) Trade Facilitation and Agriculture Sector Performance in Sub-Saharan Africa: Insightful Policy Implications for Economic Sustainability. Front. Environ. Sci. 10:962838. doi: 10.3389/fenvs.2022.962838
Received: 06 June 2022; Accepted: 20 June 2022;
Published: 26 July 2022.
Edited by:
Jean Vasile Andrei, Universitatea Petrol Si Gaze Ploiesti, RomaniaReviewed by:
Muddassar Sarfraz, Putra Malaysia University, MalaysiaShehzad Ahmed, University of the West of Scotland, United Kingdom
Copyright © 2022 Ibrahim, Yu, Hassan, Ajide, Tanveer and Khan. This is an open-access article distributed under the terms of the Creative Commons Attribution License (CC BY). The use, distribution or reproduction in other forums is permitted, provided the original author(s) and the copyright owner(s) are credited and that the original publication in this journal is cited, in accordance with accepted academic practice. No use, distribution or reproduction is permitted which does not comply with these terms.
*Correspondence: Zhang Yu, emhhbmd5dTE5QGZveG1haWwuY29t
 Ridwan Lanre Ibrahim
 Zhang Yu
 Shafiqul Hassan
 Kazeem Bello Ajide1
 Muhammad Tanveer

