 C. Calero Preciado
 V. Soria-Carrasco2
 J. Boxall
 I. Douterelo
- 1Pennine Water Group, Department of Civil and Structural Engineering, University of Sheffield, Sheffield, United Kingdom
- 2Department of Animal and Plant Sciences, University of Sheffield, Sheffield, United Kingdom
Climate change will increase the temperature of water in our drinking-water distribution systems, impacting the biofilms that grow in these vast infrastructure systems and hence the quality and safety of drinking water at the tap. Using a full-scale laboratory-controlled facility, we studied the impact of such temperature increase and the impacts of different control strategies. Our results show that increasing the temperature from 16 to 24°C changed the biofilm community structure and increased the potential for discoloration. Interventions of flushing only or flushing supplemented with hyperchlorination showed a similar reduction in discoloration potential and reduced the abundance of microorganisms that can compromise water quality and safety such as the bacteria Flavobacterium or Sphingobium and the fungi Fusarium and Cladosporium. However, there was no difference between the interventions, suggesting no benefit from adding hyperchlorination. This study provides useful understanding to inform strategies for managing biofilms within chlorinated HDPE DWDS, understanding and mitigating the impact of increasing temperature due to climate change.
1 Introduction
Drinking water is treated by different processes to remove contaminants and microbes to make it safe for consumption. However, microorganisms can survive treatment and disinfection processes and inhabit drinking-water distribution systems (DWDS) (Szewzyk et al., 2000; Chaves Simões and Simões, 2013). Most of the microorganisms living in DWDS are attached to pipe surfaces, forming biofilms, which is an advantageous way of life when compared with planktonic cells (Berry et al., 2006; Henne et al., 2012). Biofilms are inevitable on the vast internal surfaces of DWDS, where they can and do contribute significantly to the deterioration of water quality, especially if they are mobilized into the bulk water when the shear stress on the pipe wall increases (Husband and Boxall, 2011). The presence of biofilms and/or their metabolic activities can produce discoloration, taste, or odor problems; it can promote the corrosion or the obstruction of pipes; and can compromise water safety by acting as a reservoir of pathogens (Batté et al., 2003; Wingender and Flemming, 2011; Chaves Simões and Simões, 2013). Environmental factors affect biofilm development in DWDS, including source water characteristics, hydraulic regimes, pipe material, disinfection residual, and temperature (Douterelo et al., 2013; Gomez-Alvarez et al., 2015; Ren et al., 2015; Fish et al., 2020; Calero Preciado et al., 2021). Temperature is of particular concern, as it is a variable outside our control, is changing due to climate change, and impacts many other important environmental factors. In drinking-water-related systems, increasing temperature increases the rate of most reactions including increasing disinfectant decay and reducing dissolved oxygen (Monteiro et al., 2017; WHO, 2017; Li et al., 2018); thus, higher temperatures promote biofilm development and structural changes in the DWDS microbiome (Calero Preciado et al., 2021).
Water companies use different operational and management strategies to clean pipes of DWDS (Ellison, 2003; Vreeburg, 2007; Garcia de Carellan et al., 2012). While these are not often directly motivated by the consideration of biofilms as the root cause, they do mitigate the risks directly associated with biofilms, for example, discoloration as a biofilm-mediated process (Husband et al., 2016). Cleaning strategies based on chemical methods have been demonstrated to be effective for the control of planktonic communities in the water column, but biofilms are more resistant and tolerate higher concentrations (Bridier et al., 2011). Free chlorine is the most commonly used disinfectant, and it has been observed to attenuate bacterial biofilm cell concentrations. However, previous research found that it was not effective to avoid biofilm formation in the pipe walls and that even high concentrations can favor its development (Srinivasan et al., 2008; Fish and Boxall, 2018; Inkinen et al., 2018; Zhang et al., 2019). Additionally, it has been shown that certain biofilm microorganisms, especially eukaryotes such as fungi, have a high tolerance to chlorine concentrations (Hageskal et al., 2012; Wang et al., 2014; Fish and Boxall, 2018).
Internationally, mechanical methods are the most commonly used techniques to control biofilms in DWDS, including flushing, water/air scouring, and pigging (Vreeburg, 2007; Vreeburg and Boxall, 2007). Of these, flushing is the most common and widely applied method for reducing the risk from material accumulations within pipes worldwide. Flushing consists of increasing the water flow to produce an increase in the shear stress (although usually managed by pipe diameter-specific velocity targets) at the pipe wall mobilizing material, including biofilms, attached to the pipe surfaces (Boxall et al., 2001; Friedman et al., 2003; Vreeburg, 2007). In operational networks, planned flushing regimes are carried out to manage a clean waterfront through the network, sequentially targeting pipe lengths by closing selected valves and opening hydrants (Ellison, 2003; Vreeburg and Boxall, 2007). Sometimes, flushing can be applied in conjunction with high concentrations of disinfectant (i.e., hyperchlorination) for more effective system cleaning, especially after pipes burst and are repaired (Chaves Simões and Simões, 2013; van Bel et al., 2019). These cleaning methods are known not to completely eliminate biofilm in the networks but remove weaker attached material that is commonly associated with the greatest risk to water quality, including discoloration (Douterelo et al., 2013; Fish, 2013). It is also known that the microorganisms remaining attached to the pipe wall can contribute to biofilm regrowth (Douterelo et al., 2014a). Understanding the impacts of cleaning strategies is vital to select and apply them effectively and, hence, to guarantee the safety of the water that reaches consumers’ taps. As climate change leads to higher temperatures and, hence, accelerated rates of biofilm growth and other pipe fouling, it is increasingly important that we understand this.
The objectives of this study were to understand the combined effect of increasing temperature with management strategies on biofilm characteristics and its implication for water quality. The management strategies tested included (Szewzyk et al., 2000) cleaning based on the combination of mechanical and chemical disinfection (i.e., flushing events combined with hyperchlorination); (Chaves Simões and Simões, 2013) only mechanical treatment (i.e., flushing); and (Berry et al., 2006) not applying any mechanical or chemical treatment (i.e., microbial community transition between temperatures, effective control). This new understanding will provide valuable information to adapt, target, and/or improve biofilm management strategies under scenarios of increasing temperature, thus helping to ensure the supply of safe drinking water.
2 Materials and methods
2.1 Experimental DWDS facility and operational conditions
To generate fully representative results, but with suitably controlled conditions, the study was carried out in a full-scale experimental DWDS facility located at the University of Sheffield (United Kingdom). The facility has three independent loops made of high-density polyethylene (HDPE) pipes (PE100 SDR17) with an internal diameter of 79.3 mm and a length of 9.5 × 21.4 m coils (Figure 1A). Local drinking water is supplied using individual enclosed reservoir tanks of an approximate capacity of 0.486 m3, from where the water is recirculated in the system using individual variable speed pumps. System flow and pressure are computer controlled (LabVIEW, version 8.2, National Instrument Corporation, United Kingdom) by the opening of a final control valve and the speed of the pump, enabling the simulation of hydraulic demand patterns during the tests and flushing flows. Each loop of the experimental facility also includes several other monitoring equipment installed in situ: ATi A15/76 turbidity meters (ATi, Delph, United Kingdom), ATi Q45H-79 chlorine meters (ATi, Manchester, United Kingdom), pressure transducers (GemsTM Sensors and Controls, US), and flow meters (Flownetix, United Kingdom). The facility is within a temperature-controlled room. The temperature increase was additionally facilitated by immersion heaters installed in each tank (Redring P27DC, United Kingdom). All monitors provide and record continuous measurements through the duration of the experiments of flow, pressure, turbidity, chlorine, and temperature.
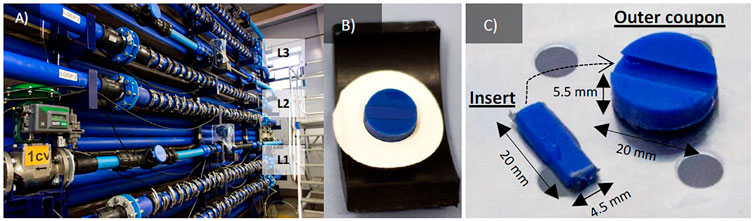
FIGURE 1. (A) Full scale test facility composed of 3 loops (L1, L2 and L3); (B,C) details and dimensions of the coupons: insert for microscopy and outer for DNA analysis.
The water in each three repeat sub-systems had a retention time of 24 h, controlled with a trickle drain and feed-based system to maintain baseline water quality parameters and preserve nutrient supply and disinfection residual, among other water quality parameters. This system retention time is independent of the hydraulic retention time of the pipe loops.
Each loop has two coils where it is possible to insert 2 × 27 removable HDPE Pennine Water Group (PWG) coupons to facilitate the analysis of biofilms in situ (Figures 1B,C), described previously by Deines et al. (2010). The coupon consists of a portion of pipe with a total surface area of 314 mm2 which fits with the internal surface and accurately follows the pipe curvature, thus experiencing the same environment as the rest of the pipeline with a minimal impact on the system hydraulic (Deines et al., 2010). Coupons are fixed into the pipes with holders and clips, following a pattern that enabled the investigation of biofilms around the entire pipe (top, medium, and bottom positions) (Figure 1). The use of coupons has the advantage that the system does not need to be drained for the sampling, and the water continues in the loops. This makes the impact of sampling on the biofilm minimal, allowing for sampling campaigns at any time throughout the experiment. Coupons comprise two parts: 1) the outer coupon used to collect biofilm biomass for DNA-based analysis and 2) an insert that can be removed from the coupon body for microscopy analysis (Figure 1C) (Deines et al., 2010).
2.2 Operational conditions
To study the effect of increasing temperature due to climate change, two different temperatures were selected, 16 and 24°C. 16°C is the average United Kingdom water temperature during spring-summer months (Husband et al., 2008), and 24°C was selected based on the World Health Organization (WHO) recommendation that the drinking water temperature should not be greater than 25°C to limit the microbial growth and pathogen proliferation in drinking water systems (WHO, 2017).
Prior to the start of the experiments, the facility was cleaned and disinfected by adding to each loop 20 mg/L of RODOLITE H (a sodium hypochlorite-based solution with less than 16% free chlorine) (RODOL Ltd., Liverpool, United Kingdom). Then, the system was flushed at a maximum flow rate (4.2 L/s or 2.7 N/m2) and left standing for 24 h with the disinfectant. After this time, the facility was flushed again at 4.2 L/s (2.7 N/m2) with fresh tap water until the levels of free chlorine showed values similar to the local tap water entering the system (≈0.2 mg/L). After disinfecting the system, sterile PWG coupons were inserted along the pipes.
The three loops were run for 30 days at 16°C to allow for biofilm development in the pipe walls. After this growth phase, each loop was subjected to a different management strategy (Figure 2). In loop 1, mechanical cleaning and chemical disinfection were applied. The pipe loop was flushed by increasing the flow in four gradual steps for a duration of three turnovers (i.e., the time that the total volume of the water needs to recirculate in the loop three times) (Supplementary Figure SA, Supplementary Table SA), and then, a hyperchlorination of the system was performed adding 20 mg/L of RODOLITE H (a sodium hypochlorite-based solution with less than 16% free chlorine) (RODOL Ltd., Liverpool, United Kingdom). The intention was to remove weaker adhered biofilm material first, then the hyperchlorination to deactivate the small portion of the biofilm that is known to remain post-flushing and reduce regrowth. In loop 2, only a mechanical cleaning procedure was performed, flushing the pipes by applying the same four gradual steps as explained for loop 1. This is a simpler intervention, and hence, it is interesting to compare it with loop 1 to establish the additional benefit of hyperchlorination. In loop 3, no mechanical or chemical maintenance treatment was applied to study the natural transition of biofilm communities when temperature increases. This effectively provides a control for comparison with the other two conditions. After the three different treatments, new sterile PWG coupons were inserted along the pipes in the three loops, and the temperature was increased to run a second biofilm growth phase of 30 days at 24°C. At the end of this growth phase, all three loops were flushed by applying the same four gradual steps for a duration of three turnovers to remove and quantify loosely adhered material on the pipe walls (Sharpe et al., 2010). For biofilm growth phases at both temperatures, a low varied flow (LVF), ranging from 0.2 to 0.5 L/s, was applied which simulates a real hydraulic regime based on daily patterns observed in real DWDS in the United Kingdom (Husband et al., 2008) (Supplementary Figure SB, Supplementary Table SA).
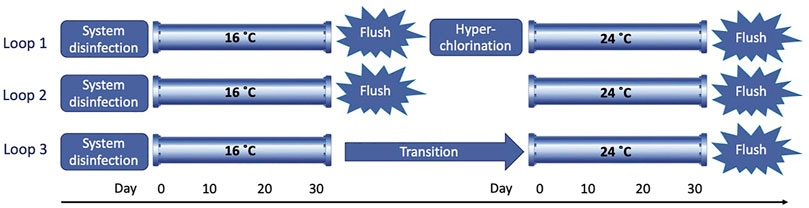
FIGURE 2. Scheme of the test performed in the 3 loops over time.
2.3 Microbial communities sampling
To study planktonic and biofilm microbial communities, bulk water samples and coupons were collected on days 0, 10, 20, and 30 throughout the growth phases and post-flushing events performed in each loop at both temperatures. For biofilm samples, three biological replicates of three coupons each were taken at each sampling point to obtain an optimal concentration of DNA for next-generation sequencing (NGS). Since at 16°C the three loops were running under the same conditions, one biological replicate was obtained from each loop. At 24°C, after the different management strategies, the three replicates were obtained from each corresponding loop. The biofilm attached to the coupons was removed by standardized brushing in 30 ml of phosphate-buffered saline solution (PBS) (Gibco®, United Kingdom), creating a biofilm suspension that was then filtered through a 0.22-μm nitrocellulose membrane filter (Millipore Corp., United States) (Deines et al., 2010). For water samples, three replicates of 2 L of bulk water were taken at each sampling point and then filtered through the 0.22-μm nitrocellulose membrane filter (Millipore Corp., United States). Filters of water and biofilm samples were preserved at −20°C in the dark until the molecular analysis was carried out.
2.4 Water quality physico-chemical analysis
During the experiment, turbidity and chlorine online measurements were recorded at 1-min intervals by equipment installed in the system, an ATi A15/76 turbidity monitor (ATi, Delph, United Kingdom) and an ATi Q45H-79 chlorine monitor (ATi, Manchester, United Kingdom), respectively. Additionally, triplicates of discrete water samples were collected at the time of each sampling point to analyze several physico-chemical parameters. pH and water temperatures were tested using a Hanna portable meter HI 991003 (Hanna Instruments, Leighton Buzzard, United Kingdom), and free and total chlorine were analyzed with a Palintest CS100 chlorosense (Palintest, United Kingdom). Total organic carbon (TOC) and the concentration of iron (Fe) and manganese (Mn) (as water discoloration indicators) were also measured in triplicate at each sampling point by The Kroto Research Institute (KRI) (Sheffield, United Kingdom), using a Shimadzu TOC-VCPH/CPN analyzer (Shimadzu, Kyoto, Japan). Inductively coupled plasma mass spectrometry (ICP-MS) was used to determine Fe and Mn concentrations in water by means of a Perkin Elmer Elan DRC II (PerkinElmer, Inc., United States); data acquisition was performed via Elan NT software (tla.mpi.nl/tools/tla-tools/elan) (Sloetjes and Wittenburg, 2008).
2.5 Microscopy analysis
For biofilm visual characterization, the inserts of the PWG coupons were analyzed by scanning electron microscopy (SEM). SEM analysis was performed at the electron microscopy facility, at the Faculty of Science of the University of Sheffield (United Kingdom). Triplicates of PWG coupon inserts were removed on day 0 (control) and day 30 from each loop at both temperatures and after the different management strategies. Inserts were fixed for 24 h in 5% formaldehyde solution (Fisher Scientific, United Kingdom) and then preserved in PBS at 4°C. Coupon inserts were secondarily fixed and prepared for SEM following the protocol described by Calero Preciado et al. (2021). Micrographs of biofilms were obtained using a TESCAN Vega 3 LMU SEM (Girton, Cambridge, United Kingdom) at an accelerating voltage of 15 kV.
2.6 DNA extraction and sequencing
DNA from all the filters where water and biofilm samples were concentrated was extracted following the protocol based on hexadecylmethylammonium bromide (CTAB) and proteinase K chemical lysis, followed by DNA purification using the phenol/isoamyl alcohol method (Neufeld et al., 2007). The concentration of purified DNA from each extraction was assessed fluorometrically by the HS dsDNA assay kit and a Qubit 4 fluorometer (Invitrogen by Thermo Fisher Scientific, Wilmington, United States).
Sequencing was performed at Mr DNA Laboratory (www.mrdnalab.com, Shallowater, TX, United States) on the Illumina MiSeq platform following the manufacturer’s guidelines for pair-end sequencing. The 16S rRNA gene of bacteria was amplified using the primers 28F (GAGTTTGATCNTGGCTCAG) and 519R (GTNTTACNGCGGCKGCTG) spanning the V1 to V3 hypervariable regions. For fungal analysis, the ITS1-2 region was targeted for the amplification using the primers ITS1FBt1 (CTTGGTCATTTAGAGGAAGTAA)/ITS2R (GCTGCGTTCTTCATCGATGC). Briefly, 30 PCR cycles were performed using the HotStarTaq Plus Master Mix Kit (Qiagen, United States) and the following protocol: 94°C for 3 min, followed by 30 cycles of 94°C for 30 s, 53°C for 40 s, 72°C for 1 min, and a final elongation step at 72°C for 5 min. PCR products were checked after the amplification in 2% agarose gel to determine the success of amplification and the relative intensity of bands. Samples were pooled together in equal proportions based on their molecular weight and DNA concentrations. Pooled samples were purified using calibrated Ampure XP beads (Beckman Coulter, Inc.), and the pooled and purified PCR product was used to prepare the Illumina DNA library. Sequencing data were deposited in the NCBI Sequence Read Archive (SRA) with the accession number PRJNA770855.
2.7 Bioinformatics and microbial community analysis
Raw sequences obtained from Illumina were subjected to quality control to evaluate the number, the quality, and the length of the initial reads using FastQC software version 0.11.8 (bioinformatics.babraham.ac.uk) (Andrew, 2010). Sequences were then filtered and trimmed, removing those with an average quality phred score below 20 and/or a minimum length of 100 bp by using BBDuk software version 37.95 (bbtools/bb-tools-user-guide/bbduk-guide/) (Cock et al., 2009). BBDuk was also used to remove sequencing errors (Davis et al., 2018). Subsequently, sequences were demultiplexed and depleted of sequencing barcodes using Sabre software (github.com/najoshi/sabre) (Joshi, 2011) and imported into the Quantitative Insights Into Microbial Ecology 2 program (QIIME2, version 2019.7, qiime2.org) (Bolyen et al., 2019). Then, within QIIME2, the implemented vsearch plug-in (github.com/qiime2/q2-vsearch) (Rognes et al., 2016) was used to join pair-end sequences, dereplicate them, identify and filter chimeric sequences, and make de-novo clustering by 97% similarity to obtain the operational taxonomic units (OTUs). See Supplementary Tables SB, C for more information on the sequence count in each step of the bioinformatics analysis. OTU’s taxonomic assignment was performed using the classify-consensus-vsearch method (Rognes et al., 2016) of the feature-classifier plug-in in QIIME2 (github.com/qiime2/q2-feature-classifier) (Bokulich et al., 2018). 16S sequences were compared against the SILVA SSU r132 database (arb-silva.de) (Quast et al., 2013), and ITS2 sequences, against UNITE 8.0 (unite.ut.ee) (Kõljalg et al., 2013).
The diversity of bacterial and fungal communities was estimated via alpha and beta diversity using rarefied tables of relative abundance of OTUs at a 97% sequence similarity cutoff (Morris et al., 2014). Alpha diversity (diversity within samples) was estimated by Chao1 (richness measurement), Simpson (dominance measurement), and Shannon (diversity measurement that considers both richness and dominance) indices, that were calculated applying the q2-diversity plug-in in QIIME2 (github.com/qiime2/q2-diversity). For beta diversity (degree of community differentiation between samples), rarefied OTU tables were square-root transformed, and similarity matrices were constructed applying the Bray–Curtis method using vegan package version 2.5-6 in R (github.com/vegandevs/vegan) (Oksanen et al., 2019). Nonmetric multidimensional scaling (nMDS) diagrams were built for the visualization of resemblance matrices using ggplot2 package version 3.2.1 in R (github.com/tidyverse/ggplot2) (Wickham and Chan, 2016).
2.8 Statistical analysis
Triplicates measurements (n = 3) were used for the mean and standard deviation calculation of all physico-chemical parameters and alpha diversity values. For 16°C, the average and standard deviation of the mean values of the three HDPE loops (n = 9) were calculated since the three loops were subjected to the same conditions during the growth phase. Shapiro–Wilk tests were used to test the normality of the datasets. Nonparametric Kruskal–Wallis tests were performed to detect significant differences between temperatures and different management strategies. If significant, differences between samples were compared pairwise by performing a Mann–Whitney U test. The analysis of similarities (ANOSIM) was calculated using the Bray–Curtis distance matrices based on OTU’s relative abundance to test for beta diversity significant differences. The global-R statistics in ANOSIM was calculated to determine the impact of the temperature increase under different management strategies (Anderson and Walsh, 2013). All statistical tests were carried out using R 3.6.1 (r-project.org) (Team, 2014), and differences were considered statistically significant when the p-value was ≤0.05.
3 Results
3.1 Water physico-chemical analysis
Results of water quality parameters measured through the experiment are shown in Supplementary Table SD. Water temperature showed stable average values close to 16 and 24°C selected for the experiments. pH was near neutral, showing values fluctuating from 6.67 to 7.47. Disinfectant residual concentrations showed higher average values of total and free chlorine on day 0 at 16°C (total chlorine = 0.91 mg/L, free chlorine = 0.89 mg/L) and in loop 1 at 24°C (total chlorine = 0.80 mg/L, free chlorine = 0.68 mg/L), a consequence of the disinfection regime applied to the system before the start of the experiment, and of the hyperchlorination carried out in this loop. Then, the concentration of disinfectant was slightly higher in the test at 16°C (total chlorine ranging from 0.17–0.21 mg/L, and free chlorine 0.17–0.09 mg/L) than in the tests at 24°C (total chlorine ranging from 0.11–0.21 mg/L, and free chlorine 0.03–0.11 mg/L). While this suggests additional chlorine decay at the higher temperature, when the values were statistically compared, no significant differences were observed.
TOC values did not show marked fluctuations during the experiments ranging from 1.16 to 1.50 mg/L, and no statistically significant differences were found. This includes no change in response to the final flushing, suggesting measurable TOC is not mobilized from the pipe wall/biofilm under any of the conditions studied.
Similar iron and manganese values were observed during all growth phases, with iron ranging from 41.3 to 59.3 μg/L and manganese from 0.39 to 0.58 μg/L; no significant differences were found. As expected, post-flushing showed increased concentration of these metals due to mobilization from biofilm-mediated pipe-wall accumulations. The average values show a greater increase in concentrations after the experiments at 24°C than at 16°C (Supplementary Table SD). Statistical tests showed significant differences in the concentration of both metals (Kruskal–Wallis test, p-value > 0.05), and pairwise comparisons confirmed significant higher values (Mann–Whitney U tests, p-value ≤ 0.05) at 24°C after all management strategies than at 16°C. See Supplementary Tables SE, F) for more details on the results of the statistical analysis. These results show accelerated accumulation of iron and manganese at the pipe wall due to the increased temperature.
3.2 Turbidity
Results from the online turbidity measurements showed similar average values during the growth phases of each loop at each temperate. Representative values from the final 24 h of the growth phases were 0.041 to 0.043 ± 0.03 NTU (where the diurnal pattern of shear stress (τ) = 0.1–0.3 N/m2). As with the physio-chemical results (Supplementary Table SD), this confirms that the loading from the bulk water during all the growth phases was consistent and directly comparable.
During the flushing events, when the shear stress was increased in four steps, different turbidity responses were observed for each of the treatments (Figure 3). In stage 1 (τ = 0.4 N/m2), the turbidity response at 16°C and 24°C after flushing-hyperchlorination and only flushing showed similar values. At 24°C, after transition (i.e., no treatment), a slightly higher value was observed, but no significant differences were found. Turbidity responses in stages 2 (τ = 2.3 N/m2) followed a similar trend, but in this case, turbidity at 24°C after transition showed a much higher average value compared to other responses at 16 and 24°C (although with significantly greater standard deviation than any other data point), and these differences were significant (Kruskal–Wallis test, p-value ≤ 0.05; Mann–Whitney U tests, p-values ≤ 0.05). In stage 3 (τ = 3.4 N/m2) and stage 4 (τ = 4.3 N/m2), the highest turbidity response was recorded at 24°C after transition, followed by 24°C after only flushing and flushing-hyperchlorination. The lowest turbidity response was observed after 16°C, and the differences in turbidity responses between 16 and 24°C, after all the different management strategies (Mann–Whitney U tests, p-values≤ 0.05) were significantly different. In addition, higher values were observed at 24°C after transition than at 24°C after flushing-hyperchlorination or only flushing (Mann–Whitney U tests, p-values ≤ 0.05). No statistical differences were found for turbidity response in stage 4 between 24°C after flushing-hyperchlorination and only flushing. See Supplementary Tables SG, H) for more details on the results of statistical analysis.
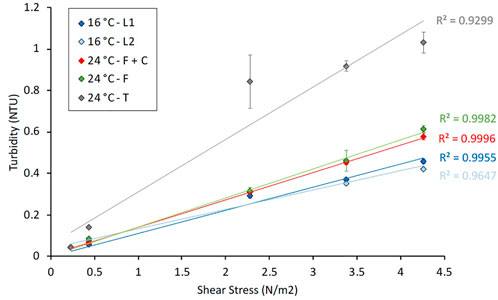
FIGURE 3. Turbidity response during the last 24 h of the growth phase and during the last turnover (i.e., when the water with the mobilised material was mixed) of the 4 stages of the flushing events at 16°C [loop 1 (L1) and loop 2 (L2)] and at 24°C after different management strategies: flushing + hyperchlorination (F+C), only flushing (F) and transition (T). All values represent an average ± standard deviation.
Stepped flushing was used to observe the relationship between turbidity response and pipe wall layer strength. Previous research has found this to be a linear function for a variety of environmental factors, under controlled laboratory conditions and from operation systems (Vreeburg and Boxall, 2007; Husband et al., 2008; Sharpe et al., 2010; Husband and Boxall, 2011; Douterelo et al., 2013; Calero Preciado et al., 2021). Figure 3 confirms this finding for the conditions studied here, with good linear regression shown for all conditions. Comparing the gradients of the two 16°C experiments with the two 24°C experiments, it is clear that the increased temperature increases the amount of material accumulated and that this increase was at all-layer strength. The temperature did not show bias toward increased accumulation in weaker layers, as might have been expected when accelerating a process. The lack of any difference between “24°C–F + C” and “24°C–F” shows that the addition of the hyperchlorination stage did not have any beneficial effect in reducing the discoloration response. It should be noted that the “16°C + 24°C–T” effectively had double the growth period, 30 days at 16°C and then 30 days at 24°C. The gradient and final value of this data set is approximately double the other lines, suggesting that the processes of accumulation continued roughly linearly with time, despite the increased temperature, that is, there was no accelerated growth or accumulation of material due to leaving the biofilm after 30 days at 16°C intact.
3.3 SEM micrographs
SEM micrographs showed a visual observation of PWG coupons on day 0 and day 30 at 16 and 24°C after the different management strategies (Supplementary Figure SC). As expected, coupons taken on day 0 from all tests did not show biofilm attached to the surface. However, coupons collected at the end of the growth phase presented different biofilm surface coverage. After 30 days, at 16°C, small areas of the coupon were covered by biofilm, while after a further 30 days at 24°C and after the different management strategies were applied, bigger patches of biofilm accumulation were observed. In addition, some visual differences could be observed in the biofilm structures. For example, biofilm developed at 24°C after flushing-hyperchlorination visually presented a more regular and smoother structure when compared with those after flushing only biofilm, which showed a more irregular structure. Similarly, biofilms after the transition only showed a more developed, thicker (as expected, as these biofilms had effectively developed for a total of 56 days), and rougher structure.
3.4 Microbial community structure (bacteria and fungi)
3.4.1 Alpha diversity (diversity within samples)
Results from alpha diversity analysis for bacterial and fungal biofilm communities are shown in Supplementary Figure SD. Overall, on days 10 and 20 during the growth phases, biofilm bacterial communities did not show significant changes in alpha diversity indices, except on day 10 when Chao1 at 24°C after transition showed a significantly higher value compared with 16°C (Mann–Whitney U tests, p-value ≤ 0.05). On day 30 and considering post-flushing events, significant differences in all indices were observed (Kruskal–Wallis test, p-value ≤ 0.05) in the samples. On day 30, Chao and Shannon indices were significantly higher at 24°C after only flushing than at 16°C, while Simpson was lower (Mann–Whitney U tests, p-values ≤ 0.05). Samples from post-flushing events showed lower significant values of Chao1 and Shannon at 16°C than at 24°C after flushing-hyperchlorination (Mann–Whitney U tests, p-values ≤ 0.05).
The different treatments and the increase in temperature affected to a greater extent the diversity of bacteria when compared with fungi, and significant differences between treatments were observed in all indices at each sampling point (Kruskal–Wallis test, p-value ≤ 0.05). Samples at 16°C showed higher Chao1, lower Simpson, and higher Shannon compared to all samples at 24°C after all management strategies, except Chao1 on day 10 at 24°C after flushing-hyperchlorination. No significant differences were observed between samples at 24°C after the different management strategies.
Planktonic communities (Supplementary Figure SE) showed no significant differences in any index during the growth phases at 16 and 24°C after different management strategies for bacteria and fungi, again confirming consistent conditions in the bulk water for the growth phase of all treatments. However, in post-flushing samples, significant differences were found in the Chao1 index values for fungi, and in Shannon, for bacteria and fungi (Kruskal–Wallis test, p-value ≤ 0.05), confirming mobilization from the biofilm phase. When samples were compared pairwise, Chao1 in fungal communities was significantly lower at 16°C than at 24°C after all management strategies (Mann–Whitney U tests, p-values ≤ 0.05). The Shannon index was significantly lower in bacterial communities at 24°C after flushing-hyperchlorination than at 16°C. In fungal communities, Shannon was statistically lower at 24°C after transition than at 16°C or at 24°C after other two strategies (Mann–Whitney U tests, p-values ≤ 0.05). See Supplementary Tables SI-R for more details on the results of the statistical analysis.
3.4.2 Beta diversity (diversity between samples)
nMDS diagrams with the resemblance matrices at 97% similarity cutoff for bacteria and fungi communities at 16 and 24°C after different management strategies are shown in Figure 4. nMDS for biofilm bacterial communities shows the separation of samples in relation to temperature and management strategy. Different pairwise comparisons were explored statistically by ANOSIM analysis. The ANOSIM test showed statistically significant differences between temperatures and management strategies, with different levels of differentiation (Supplementary Table SS). nMDS of biofilm fungal communities showed a clear clustering of samples when the factor analyzed was the temperature. However, samples did not cluster according to different management treatments. This was confirmed by ANOSIM test results, which concluded that there were significant differences in the structure of the communities at 16°C compared to those at 24°C, but not between the communities at 24°C after the different management strategies (Supplementary Table SS).
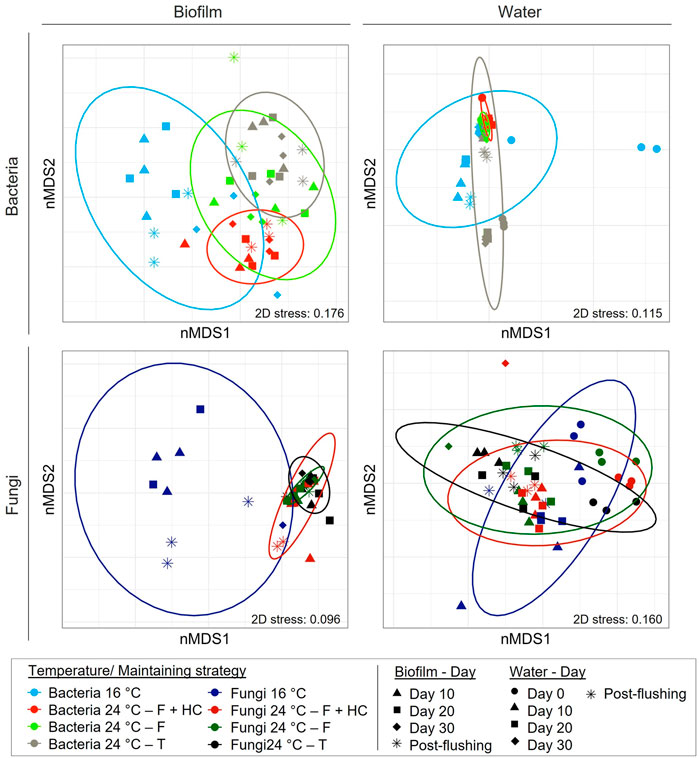
FIGURE 4. Non-multidimensional scaling (nMDS) analysis based on Bray–Curtis similarity matrixes calculated with the relative abundance of bacteria and fungi at 97% cut off in biofilm and water samples at 16°C and 24°C after the different management strategies: flushing-hyperchlorination (F+HC), only flushing (F) and transition (T). Colours represent the different types of treatment applied and symbols the different sampling points. The 3 replicates per sampling point are represented.
Conversely, bacterial and fungal planktonic communities did not clearly cluster in relation to different temperatures and/or management strategies in nMDS plots, again confirming consistent growth phase conditions across all treatments. ANOSIM analysis showed that only bacterial community structure was significantly affected by the increase in temperature after different management strategies. Fungal communities showed no significant differences between temperatures and/or different management strategies (Supplementary Table SS).
3.5 Taxonomical analysis of biofilm communities
Differences in taxonomic profiles were observed between different temperatures and types of management strategies applied (Figures 5, 6). Biofilm bacterial communities at 16°C were dominated by a not-defined genus belonging to the family Burkholderiaceae (ranging from 0.1% to 59.11%), followed by other genera such as Pseudomonas (1.51%–35.97%), Methylonera (0.24%–22.71%), or Mucilaginibacter (5.31%–19.27%) during the growth phase or Sphingomonas (8.57%–24.91%) in samples post-flushing event. Biofilm community samples at 24°C after flushing-hyperchlorination were dominated by Pseudomonas (12.11%–73.54%), and other genera such as Phreatobacter (3.245–16.76%) and Sphingomonas (1.985–10.57%) presented high relative abundances. At 24°C, after only flushing, Pseudomonas continued to be the most abundant genus (21.28%–54.18%), although with lower relative abundance. Phreatobacter (0.50%–13.66%) and Sphingomonas (0.69%–9.93%) were also present with similar relative abundances, and other genera such as Aquabacterium (0.44%–15.82%) and Flavobacterium (0.255–17.82%) increased its relative abundances at 24°C after only flushing. At 24°C, after the transition, the relative abundance of Pseudomonas (12.53%–44.97%) decreased compared to communities at 24°C after other treatments, although it continued dominating the biofilm community. Sphingobium (2.26%–16.84%) and Flavobacterium (3.24%–16.07%) showed higher relative abundances at 24°C after the transition than after other management strategies. Other genera that considerably increased when the temperature was increased and after transition were Methyloversatilis (0.11%–26.82%) and Pelomonas (0.77%–10.14%) (Figure 5).
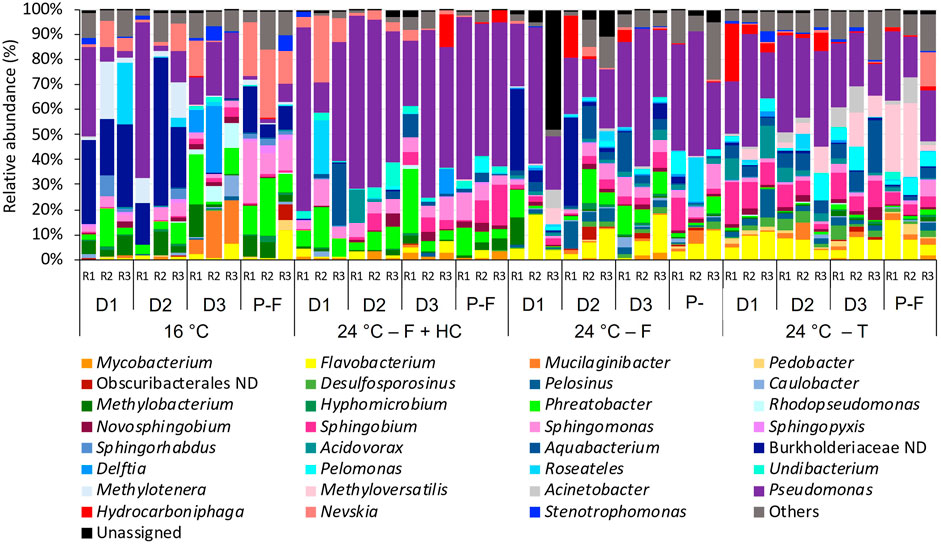
FIGURE 5. Relative abundance of bacteria at genus level (>1% of the total sequences) in biofilms from days (D) 10, 20, 30 and post-flushing (P–F) events at 16°C and 24°C after each management strategy: flushing -hyperchlorination (F+HC), only flushing (F) and transition (T). The 3 replicates (R1, R2, and R3) per sampling point are represented. Remaining genera were combined in category “Others”. Category “Unassigned” correspond to unidentified OTUs and “ND” means not defined at that level.
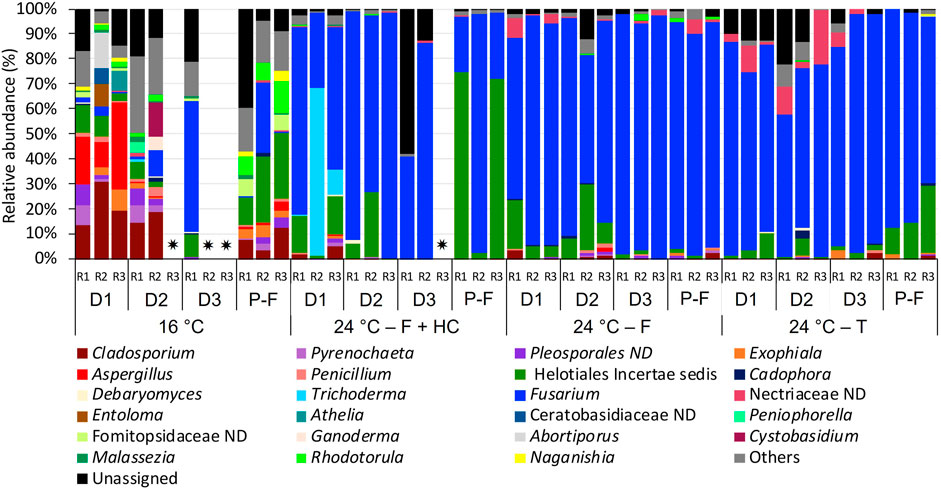
FIGURE 6. Relative abundance of fungi at genus level (>1% of the total sequences) in biofilms from days (D) 10, 20, 30 and post-flushing events (P-F) at 16°C and 24°C after each management strategy: flushing and hyperchlorination (F+HC), only flushing (F) and transition (T). The 3 replicates (R1, R2, and R3) per sampling point are represented. Remaining genera were combined in category “Others”. Category “Unassigned” correspond to unidentified OTUs and “ND” means not defined at that level. ✷ Samples that did not amplify during the sequencing process.
Focusing on the most abundant fungi taxa in biofilm communities (Figure 6), differences were also observed. At 16°C, during the growth phase on days 10 and 20, Cladosporium (13.45%–30.80%) together with Aspergillus (0.20%–19.26%) were the dominant genera. However, on day 30, fungal communities at 16°C were dominated by Fusarium (52.48%) and incertae sedis of Helotiales (9.04%). In post-flushing event samples, incertae sedis of Helotiales (10.96%–26.45%) together with Fusarium (0.50%–27.50%) and Rhodotorula (6.67%–12.48%) dominated the community structure. Biofilm fungal communities at 24°C after all management strategies were dominated mainly by Fusarium (51.34%–97.48%). At 24°C, after the flushing-hyperchlorination treatment, other genera such as Trichoderma (1.2%–66.68%) on day 10 or incertae sedis of Helotiales (2.15%–74.41%) in post-flushing events samples presented a high relative abundance. At 24°C, after only flushing, Fusarium appeared together with incertae sedis of Helotiales (4.34%–36.34%) on days 10 and 20. At 24°C, after transition, during the growth phase not-defined taxa belonging to the family Nectriaceae (1.23%–31.33%) increased its relative abundance, and in post-flushing event samples, incertae sedis of Helotiales (10.33%–26.92%) also presented a high relative abundance.
3.6 Taxonomical analysis of planktonic communities
The taxonomical profiles of bacterial and fungal planktonic communities showed differences in composition in relation to temperature as shown in Figures 7, 8. For bacteria (Figure 7) at 16°C on day 0, the not-defined Obscuribacterales (28.64%–34.48%) was the most abundant taxa, followed by Phreatobacter (2.50%–25.94%) and Methylobacterium (1.80%–15.27%). However, on day 10 and successive days, Burkholderiaceae ND (15.67%–59.02%) and Phreatobacter (13.56%–66.02%) were the dominant members of the community. In the post-flushing event samples, Phreatobacter (22.375–62.24%) together with Pseudomonas (0.12%–37.24%), Burkholderiaceae ND (9.275–13.47%), and Sphingomonas (5.66%–9.66%) dominated the community structure. Planktonic bacterial communities presented very similar profiles at 24°C after all management strategies. The most abundant taxa overtime during the growth phases and post-flushing events were Phreatobacter (38.65%–92.84%), Sphingomonas (6.05%–37.29%), and Nevskia (1.62%–16.53%).
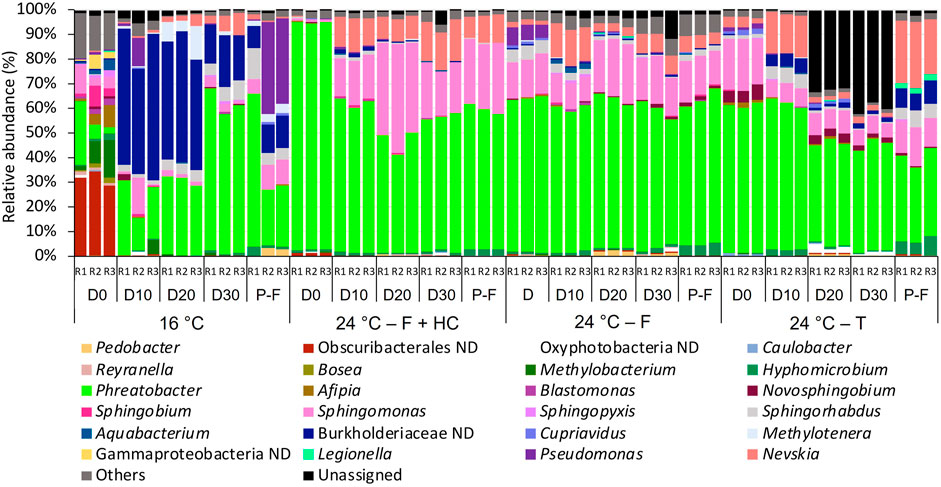
FIGURE 7. Relative abundance of bacteria at genus level (>1 % of the total sequences) in water samples from days (D) 0, 10, 20, 30 and post-flushing (P-F) events at 16°C and 24°C after each management strategy: flushing and hyperchlorination (F+HC), only flushing (F) and transition (T). The 3 replicates (R1, R2, and R3) per sampling point are represented. Remaining genera were combined in category “Others”. Category “Unassigned” correspond to unidentified OTUs and “ND” means not defined at that level.
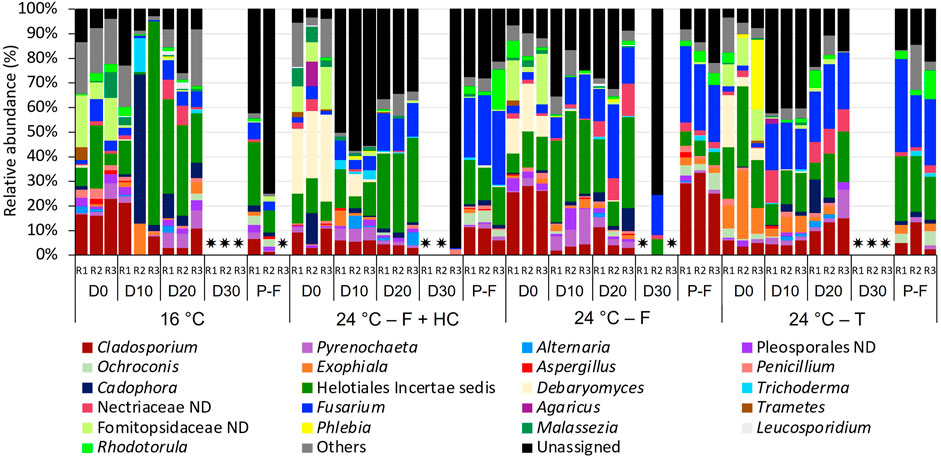
FIGURE 8. Relative abundance of fungi at genus level (>1 % of the total sequences) in water samples from days (D) 0, 10, 20, 30 and post-flushing (P-F) events at 16°C and 24°C after each management strategy: flushing and hyperchlorination (F+HC), only flushing (F) and transition (T). The 3 replicates (R1, R2, and R3) per sampling point are represented. Remaining genera were combined in category “Others”. Category “Unassigned” correspond to unidentified OTUs and “ND” means not defined at that level. ✷ Samples that did not amplify during the sequencing process.
For fungi (Figure 8), a high percentage of unassigned sequences (3.58%–97.11%) was observed in all the samples. Despite all the profiles being similar, some changes were observed in the relative abundance over time with temperature and with the management strategy applied. At 16°C, Helotiales incertae sedis (1.24%–82.84%) and Cladosporium (2.59%–22.74%) were the predominant taxa over time. On day 0 samples, they appeared with unidentified taxa belonging to the family Fomitopsidaceae (6.685–21.21%), and on day 10 samples, together with Cadophora (1.98%–60.26%). On day 20 and post-flushing event samples, Fusarium (3.74%–7.77%) and Pyrenochaeta (1.53%–7.33%) presented high relative abundances. On day 30, any water replicate amplified for fungi.
At 24°C after all management strategies, Helotiales incertae sedis (1.245–82.84%) and Cladosporium (2.595–27.97%) continued to be the most abundant taxa during the growth phase in all the samples analyzed. These two taxa appeared in all samples together with Fusarium (1.71%–29.87%), which presented higher relative abundance compared to 16°C samples. On day 0 samples, after all management strategies, Debaryomyces (3.76%–35.17%) and a not-defined Fomitopsidaceae (2.38–20.50%) also presented a high relative abundance. On day 10, after flushing-hyperchlorination and after only flushing, Pyrenochaeta (5.09%–14.06%) was relatively abundant. On day 20, after only flushing and after transition, the increase of not-defined Nectriaceae was notable (6.41%–13.26%). In post-flushing event samples, Helotiales incertae sedis (5.46–26.31%), Cladosporium (5.83–32.99%), and Fusarium (20.61%–37.36%) dominated the structure of fungal communities, together with Rhodotorula (1.67%–16.51%) that increased its relative abundance.
4 Discussion
4.1 Effect of increased temperature and management strategies on physico-chemical analysis and water discoloration
The pipe loop that experienced the temperature transition without any management intervention resulted in roughly double the amount of biofilm mobilization and discoloration compared with the loops where the interventions were imposed. The control strategies significantly reduced the discoloration potential when the temperature increased. However, there was little difference between the two management strategies.
The amount of material (measured as turbidity) mobilized by the flushing was greater for 30 days of regrowth at 24°C than 30 days of growth from a clean pipe at 16°C. The SEM micrographs were in accordance with this observation, showing higher biofilm surface coverage on coupons developed after 30 days’ regrowth at 24°C. This further confirms that discoloration is a biofilm-mediated process, as set out by Husband et al. (2016). Pintar and Slawson (2003) and Liu et al. (2016) also observed that warmer temperatures due to seasonality favored microbial growth rate in other DWDS, promoting biofilm formation. The iron and manganese increase in the bulk water due to the initial cleaning was ∼45–50 μg/L and 0.45–0.69 μg/L, respectively. After regrowth at the higher temperature the changes were 50 to 85 ug and 0.15 ug to 0.12 ug, respectively. This far greater mobilization of metals into the bulk water shows that the regrown biofilms at the higher temperature had accumulated significantly greater amounts of these metals. Higher biofilm activity has previously been associated with increased Fe and Mn accumulation (Ginige et al., 2011), supporting further the results from this study that the increase in water discoloration can be associated to enhance biofilm growth and the accumulation of metals under higher temperatures.
There was no difference in the turbidity, iron, and management response to flushing between the two management strategies applied. Thus, the application of flushing-hyperchlorination and only flushing were equally as effective in reducing the discoloration potential. Previous studies on DWDS showed that flushing is an effective mechanism to control biofilm accumulation and thus minimize discoloration potential (Vreeburg et al., 2008; Cook and Boxall, 2011). In addition, results from this study suggest that the hyperchlorination after a flushing event did not affect the biofilm regrowth capacity and/or quantity of material accumulated when the temperature increased, and thus did not decrease the discoloration potential. It has been widely established that microorganisms forming biofilms are more resistant and tolerate higher concentrations of disinfectant than planktonic communities (Bridier et al., 2011; Fish and Boxall, 2018; Inkinen et al., 2018; Zhang et al., 2019). Specifically, in DWDS, previous research found that high levels of chlorine can decrease bacterial concentrations or biofilm activity (Niquette et al., 2000; Hallam et al., 2001; Lin et al., 2017; Aggarwal et al., 2018). However, disinfectant residuals are not effective to avoid or prevent biofilm formation on the pipe walls, and even high concentrations can favor biofilm development (Srinivasan et al., 2008; Su et al., 2018) and increase the discoloration risk (Fish et al., 2020). The research carried out by Fish et al. (2020), in the same full-scale drinking water distribution test facility, showed the first conclusive evidence of increased discoloration due to a higher free chlorine residual (Fish et al., 2020). We can conclude that temperature increase leads to greater biofilm development and higher metal accumulation, which favors the potential of water discoloration, and that flushing alone was as effective as flushing plus hyperchlorination at mitigating this risk.
4.2 Influence of temperature increase and different management strategies on biofilm microbial communities
Results from this study have demonstrated that temperature is a key factor affecting biofilm bacterial community structure in chlorinated DWDS and that the compositional changes observed were also dependent on the management strategy applied. In a previous study, where sections of a real DWDS in the north of the United Kingdom were subjected to flushing trials, the authors observed that the microorganisms remaining attached to the pipe wall after a flushing event were influencing the regrowth of biofilm (Douterelo et al., 2014b). Thus, changes produced in bacterial biofilm communities during the cleaning processes applied in this study would have driven the differences observed in these communities at higher temperatures. The most notable change in biofilm bacterial community structure was the high relative abundance of Pseudomonas at 24°C, especially after flushing-hyperchlorination and after only flushing, suggesting that these control methods favored the presence of this microorganism in biofilms. Pseudomonas spp. can synthesize large quantities of EPS contributing to biofilm formation and growth (Irie et al., 2012; Liu et al., 2020). Its high relative abundance in this study and the potentially greatest production of EPS could have contributed to the more developed biofilms and the higher discoloration potential at 24°C. In addition, Pseudomonas is a ubiquitous genus that includes species considered opportunistic pathogens such as P. aeruginosa, which has been previously observed in DWDS and can cause severe infections in healthy or in immunocompromised people (Jurgens et al., 2008; Vaz-Moreira et al., 2012; Lu et al., 2016). Neither of the management strategies studied here has been effective to avoid its increase with the temperature rise, and further research is needed to understand the impact that the presence of Pseudomonas species can have on water quality.
Other genera including Flavobacterium, Sphingobium, or Methyloversatilis were also observed to increase when the temperature increased. Flavobacterium especially increased at 24°C after only flushing and after transition, and lower relative abundance was observed after flushing-hyperchlorination. This increase in Flavobacterium can be of public health concern since several species belonging to this genus are opportunistic pathogens that have been related to human infections (Geldreich, 1996; Waśkiewicz et al., 2014). Bremer et al. (2002) found a drinking water bioreactor where Flavobacterium spp. decreased in number in biofilm samples when it was exposed to different free chlorine concentrations and concluded that this genus has a low resistance to disinfectant compared with other genera. Considering the previous study, it could be suggested that the high concentrations of chlorine during the hyperchlorination treatment in this study affected Flavobacterium negatively, preventing its proliferation when the temperature increased.
Two other genera that increased their relative abundance at higher temperatures in this study were Sphingobium and Methyloversatilis. These genera play an important role in antimicrobial resistance processes since they can be reservoirs of antibiotic-resistance genes (ARGs) in DWDS (Vaz-Moreira et al., 2011; Narciso-da-Rocha et al., 2014; Ma et al., 2017). Since the highest relative abundance of these two genera was observed at 24°C after transition (no treatment), it can be concluded that the application of invasive management strategies (i.e., flushing or flushing together with hyperchlorination) prevents the increase of microorganisms of public health concern.
The structure of fungal communities in biofilms was also affected by the temperature increase, but no significant changes were observed between management strategies. Fungi are morphologically more complex and robust than bacteria, making them more resistant to environmental change (Begon and Fitter, 1995; Denham et al., 2019). Previous studies on DWDS have shown that fungi in a biofilm are not significantly affected by different chlorine regimes and that several species are resistant to different disinfection methods such as UV, chlorine, or ozone (Hageskal et al., 2012; Fish and Boxall, 2018). However, our results suggest that temperature can affect the structure of biofilm fungal communities in chlorinated DWDSs, while they show a high tolerance to hydraulic changes produced by flushing or hyperchlorination. Therefore, in a scenario of temperature increase, the structure of fungal communities will change in the same way regardless of the management strategy applied in the system.
Overall, biofilm fungal communities at higher temperatures showed less richness and diversity, and Fusarium was the dominant genus when temperature increased after all management strategies. This result is of concern since several Fusarium species are important plant pathogens and some of them also produce mycotoxins that cause severe human infections such as fusariosis, affecting mainly immunocompromised patients (Sautour et al., 2012; Abdel-Azeem et al., 2019). Moreover, the results reported here showed that Fusarium was predominant in biofilms regardless of the applied management strategy, suggesting that none of these methods is effective at modifying the fungal communities in DWDS biofilms when the temperature increases. Future research using molecular tools such as qPCR and alternative control strategies can help to determine which Fusarium species are favored at a higher temperature, aiding to evaluate the risk, as well as a better understanding of the adaptability of this genus to conditions in DWDS.
4.3 Influence of temperature increase and different management strategies on planktonic microbial communities
Temperature increase had a significant effect on planktonic bacterial communities, although less marked than in biofilm communities. This lower effect is probably because planktonic cells are less protected than biofilms against disinfectant action, and thus, they are effectively controlled in chlorinated DWDS (Schwering et al., 2013; Prest et al., 2016). It should be noted that our experimental system had a continual trickle feed renewal of the planktonic inoculum from the local water supply network, which was unchanged between the two 30-day growth phases. This will have restricted the change in the planktonic community compared to a complete supply system operating at a higher temperature. Other studies have also shown changes in planktonic bacterial communities in DWDS related to temperature. For example, McCoy and VanBriesen (2014) and Douterelo et al. (2017) observed a seasonal effect on planktonic communities in real DWDSs, in the United Kingdom and the United States, respectively. The most notable change with the temperature rise was the increase in the relative abundance of Phreatobacter and Sphingomonas bacteria and Fusarium and Cladosporium fungi. Phreatobacter is a relatively new genus; it had been isolated from an ultrapure water system in a Hungarian power plant (Toth et al., 2014), and chlorine concentration or residual biodegradable organic matter in drinking water influenced the relative abundance of Phreatobacter in other DWDSs (Stanish et al., 2016; Rahmatika et al., 2020). From this study, it can be concluded that temperature is a key factor that determines the relative abundance of this novel genus in chlorinated DWDS.
Sphingomonas sp. genus has been widely observed in DWDS, and its presence has been related to nosocomial infections in immunocompromised individuals (Steinberg et al., 2015). Thus, the enhancement of the presence of this genus in bulk water samples caused by higher temperatures could lead to water safety problems. Similarly, species of Cladosporium have been related to skin and pulmonary infections in humans (Tamsikar et al., 2006; Novak Babič et al., 2017). Therefore, although fungi are more resistant to environmental changes (Denham et al., 2019), the temperature can affect the abundance of certain genera including some that can produce mycotoxins including Aspergillus, Alternaria, Penicillium, Fusarium, Cladosporium, Malassezia, and/or Trichoderma, which have been found in this study, in both biofilm and water samples. These results show that more studies are needed on these organisms in DWDS for a better understanding of their negative implications on water safety, particularly as we face warmer temperatures due to climate change.
4.4 Overall reflections
We can conclude that different management strategies can modify bacterial community structure in biofilms when temperature increases, but not fungal communities in chlorinated systems made of HDPE pipes. Planktonic communities were less affected by changes in temperature, while the different biofilm management strategies affected subsequent biofilm development. The selection of the correct maintenance method for DWDS, applied with an optimal frequency, can significantly reduce the amount of material accumulated and the presence of microorganisms in these systems (Ellison, 2003; Ainsworth, 2004). This research is part of the first steps in understanding the effect of different management techniques on the microbial communities of these systems under an increase in temperature. Further studies are needed due to the increasing use of other emergent methods that may have a different effect on the biofilm mobilization. For example, Pourcel and Duchesne (2020) observed differences in the mobilization of material from the DWDS pipes between the application of flushing and air scouring, and Jurek Vidlářová and Heviánková (2021) demonstrated differences in the efficiency on removing material from drinking water pipes when they compared different maintenance methods, including unidirectional flushing, air scouring, and ice pigging.
These results reinforce the importance of considering biofilm communities in cleaning and management strategies in DWDS and demonstrate that current legislation based on surveillance of a number of tap water samples of the bulk water only is not providing a complete picture of the overall ecological condition of these vast and essential systems, and therefore, regulatory requirements for future water quality monitoring should include biofilm sampling and analysis.
5 Conclusion
This study provides new insights into the consequences of higher temperatures on chlorinated HDPE drinking water distribution networks under different biofilm management strategies and its impact on water quality and safety. This research is essential to inform mitigation strategies, control risks, and adapt this fundamental transport infrastructure to prevent the effects of unavoidable climate change. Specifically, this research developed in a full-scale drinking water distribution test facility has shown that in chlorinated HDPE pipes
• temperature increase in DWDS increased the rate of biofilm development and increased the potential for discoloration;
• the increase in temperature without any intervention increased the relative abundance of several bacterial and fungal genera able to compromise water safety; these included Pseudomonas, Flavobacterium, Sphingobium, Sphingomonas, Methyloversatilis, Fusarium, and Cladosporium. Only flushing and flushing-hyperchlorination were equally effective at mitigating further increase of these microorganisms;
• the absence of mechanical and/or chemical treatment when temperature increased (i.e., transition strategy) resulted in greater discoloration and more adverse microbial communities. Hence, a biofilm management strategy is recommended under a temperature increase scenario to control biofilm communities and minimize water quality problems;
• the application of hyperchlorination and flushing or only flushing prior to the increase in temperature resulted in similar discoloration response; thus, the addition of hyperchlorination was not beneficial.
The increase in temperature influenced the complete biofilm community structure, whilst the management strategy influenced only the bacterial community not the fungi.
Data availability statement
The datasets presented in this study can be found in online repositories. The names of the repository/repositories and accession number(s) can be found below: https://www.ncbi.nlm.nih.gov/, PRJNA770855.
Author contributions
CC, JB, and ID were involved in the design of the experiment. CC and ID carried out the experiment. CC performed the DNA extraction from samples and analyzed the results. CC and VS-C were involved in the bioinformatics analysis. CC, JB, and ID contributed to the interpretation of the results. CC wrote the manuscript and was in charge of the adaptation of the manuscript for a journal publication. CC, JB, and ID participated in the corrections of the manuscript.
Funding
The research reported here was supported by the United Kingdom Engineering and Physical Sciences Research Council: EPSRC‐LWEC Challenge Fellowship EP/N02950X/1. The molecular laboratory work was performed at the NERC Biomolecular Analysis Facility- Sheffield and supported by the Natural Environment Research Council, United Kingdom.
Conflict of interest
The authors declare that the research was conducted in the absence of any commercial or financial relationships that could be construed as a potential conflict of interest.
Publisher’s note
All claims expressed in this article are solely those of the authors and do not necessarily represent those of their affiliated organizations, or those of the publisher, the editors, and the reviewers. Any product that may be evaluated in this article, or claim that may be made by its manufacturer, is not guaranteed or endorsed by the publisher.
Supplementary material
The Supplementary Material for this article can be found online at: https://www.frontiersin.org/articles/10.3389/fenvs.2022.962514/full#supplementary-material
References
Abdel-Azeem, A. M., Abdel-Azeem, M. A., Darwish, A. G., Nafady, N. A., and Ibrahim, N. A. (2019). in Fusarium: Biodiversity, ecological significances, and industrial applications BT - recent advancement in white biotechnology through fungi: Volume 1: Diversity and enzymes perspectives. Editors A. N. Yadav, S. Mishra, S. Singh, and A. Gupta (Cham: Springer International Publishing), 201–261.
Aggarwal, S., Gomez-Smith, C. K., Jeon, Y., LaPara, T. M., Waak, M. B., and Hozalski, R. M. (2018). Effects of chloramine and coupon material on biofilm abundance and community composition in bench-scale simulated water distribution systems and comparison with full-scale water mains. Environ. Sci. Technol. 52 (22), 13077–13088. doi:10.1021/acs.est.8b02607
Anderson, M. J., and Walsh, D. C. I. (2013). PERMANOVA, ANOSIM, and the Mantel test in the face of heterogeneous dispersions: What null hypothesis are you testing? Ecol. Monogr. 83 (4), 557–574. doi:10.1890/12-2010.1
Andrew, S. (2010). A quality control tool for high throughput sequence data. Fast QC, 532. Available at: http://www.bioinformatics.babraham.ac.uk/projects/fastqc/.
Batté, M., Appenzeller, B. M. R., Grandjean, D., Fass, S., Gauthier, V., Jorand, F., et al. (2003). Biofilms in drinking water distribution systems. Re/Views. Environ. Sci. Bio/Technology 2 (2–4), 147–168. doi:10.1023/b:resb.0000040456.71537.29
Berry, D., Xi, C., and Raskin, L. (2006). Microbial ecology of drinking water distribution systems. Curr. Opin. Biotechnol. 17 (3), 297–302. doi:10.1016/j.copbio.2006.05.007
Bokulich, N. A., Kaehler, B. D., Rideout, J. R., Dillon, M., Bolyen, E., Knight, R., et al. (2018). Optimizing taxonomic classification of marker-gene amplicon sequences with QIIME 2’s q2-feature-classifier plugin. Microbiome 6 (1), 90. doi:10.1186/s40168-018-0470-z
Bolyen, E., Rideout, J. R., Dillon, M. R., Bokulich, N. A., Abnet, C. C., Al-Ghalith, G. A., et al. (2019). Reproducible, interactive, scalable and extensible microbiome data science using QIIME 2. Nat. Biotechnol. 37 (8), 852–857. doi:10.1038/s41587-019-0209-9
Boxall, J. B., Skipworth, P. J., and Saul, A. J. (2001). “A novel approach to modelling sediment movement in distribution mains based on particle characteristics,” in Water Software Systems, vol. 1: Theory and Applications (Water Engineering & Management). Editors B. Ulanicki, B. Coulbeck, and J. P. Rance (Hertfordshire: Research Studies Press), 263–273.
Bremer, P. J., Monk, I., and Butler, R. (2002). Inactivation of Listeria monocytogenes/flavobacterium spp. biofilms using chlorine: Impact of substrate, pH, time and concentration. Lett. Appl. Microbiol. 35 (4), 321–325. doi:10.1046/j.1472-765x.2002.01198.x
Bridier, A., Briandet, R., Thomas, V., and Dubois-Brissonnet, F. (2011). Resistance of bacterial biofilms to disinfectants: A review. Biofouling 27 (9), 1017–1032. doi:10.1080/08927014.2011.626899
Calero Preciado, C., Boxall, J., Soria-Carrasco, V., Martínez, S., and Douterelo, I. (2021). Implications of climate change: How does increased water temperature influence biofilm and water quality of chlorinated drinking water distribution systems? Front. Microbiol. 12, 658927. doi:10.3389/fmicb.2021.658927
Chaves Simões, L., and Simões, M. (2013). Biofilms in drinking water: Problems and solutions. RSC Adv. 3 (8), 2520–2533. doi:10.1039/c2ra22243d
Cock, P. J. A., Fields, C. J., Goto, N., Heuer, M. L., and Rice, P. M. (2009). The Sanger FASTQ file format for sequences with quality scores, and the Solexa/Illumina FASTQ variants. Nucleic Acids Res. 38 (6), 1767–1771. doi:10.1093/nar/gkp1137
Cook, M. D., and Boxall, J. B. (2011). Discoloration material accumulation in water distribution systems. J. Pipeline Syst. Eng. Pract. 2 (4), 113–122. doi:10.1061/(asce)ps.1949-1204.0000083
Davis, N. M., Proctor, D. M., Holmes, S. P., Relman, D. A., and Callahan, B. J. (2018). Simple statistical identification and removal of contaminant sequences in marker-gene and metagenomics data. Microbiome 6 (1), 226. doi:10.1186/s40168-018-0605-2
Deines, P., Sekar, R., Husband, P. S., Boxall, J. B., Osborn, A. M., and Biggs, C. A. (2010). A new coupon design for simultaneous analysis of in situ microbial biofilm formation and community structure in drinking water distribution systems. Appl. Microbiol. Biotechnol. 87 (2), 749–756. doi:10.1007/s00253-010-2510-x
Denham, S. T., Wambaugh, M. A., and Brown, J. C. S. (2019). How environmental fungi cause a range of clinical outcomes in susceptible hosts. J. Mol. Biol. 431 (16), 2982–3009. doi:10.1016/j.jmb.2019.05.003
Douterelo, I., Husband, S., and Boxall, J. B. (2014). The bacteriological composition of biomass recovered by flushing an operational drinking water distribution system. Water Res. 54, 100–114. doi:10.1016/j.watres.2014.01.049
Douterelo, I., Jackson, M., Solomon, C., and Boxall, J. (2017). Spatial and temporal analogies in microbial communities in natural drinking water biofilms. Sci. Total Environ. 581–582, 277–288. doi:10.1016/j.scitotenv.2016.12.118
Douterelo, I., Sharpe, R., and Boxall, J. (2014). Bacterial community dynamics during the early stages of biofilm formation in a chlorinated experimental drinking water distribution system: Implications for drinking water discolouration. J. Appl. Microbiol. 117 (1), 286–301. doi:10.1111/jam.12516
Douterelo, I., Sharpe, R. L., and Boxall, J. B. (2013). Influence of hydraulic regimes on bacterial community structure and composition in an experimental drinking water distribution system. Water Res. 47 (2), 503–516. doi:10.1016/j.watres.2012.09.053
Fish, K. E., and Boxall, J. B. (2018). Biofilm microbiome (re)growth dynamics in drinking water distribution systems are impacted by chlorine concentration. Front. Microbiol. 9, 2519–2521. doi:10.3389/fmicb.2018.02519
Fish, K. E., Reeves-McLaren, N., Husband, S., and Boxall, J. (2020). Unchartered waters: The unintended impacts of residual chlorine on water quality and biofilms. npj Biofilms Microbiomes 6 (1), 34–12. doi:10.1038/s41522-020-00144-w
Fish, K. E. (2013). The impact of hydraulic regime upon biofilms in drinking water distribution systems, 281.
Friedman, M., Martel, K., Hill, A., Holt, D., Smith, S., Ta, T., et al. (2003). Establishing site-specific flushing velocities. Denver, Colorado: AWWA Research Foundation Denver.
Garcia de Carellan, I., Catton, P., Selcuk, C., and Gan, T-H. (2012). Methods for detection and cleaning of fouling in pipelines. London: Emerg Technol Non-Destructive Test V, 231.
Geldreich, E. E. (1996). Microbial quality of water supply in distribution systems. Boca Raton, Florida: CRC Press.
Ginige, M. P., Wylie, J., and Plumb, J. (2011). Influence of biofilms on iron and manganese deposition in drinking water distribution systems. Biofouling 27 (2), 151–163. doi:10.1080/08927014.2010.547576
Gomez-Alvarez, V., Humrighouse, B. W., Revetta, R. P., and Santo Domingo, J. W. (2015). Bacterial composition in a metropolitan drinking water distribution system utilizing different source waters. J. Water Health 13 (1), 140–151. doi:10.2166/wh.2014.057
Hageskal, G., Tryland, I., Liltved, H., and Skaar, I. (2012). No simple solution to waterborne fungi: Various responses to water disinfection methods. Water Supply 12 (2), 220–226. doi:10.2166/ws.2012.131
Hallam, N., West, J., Forster, C., and Simms, J. (2001). The potential for biofilm growth in water distribution systems. Water Res. 35 (17), 4063–4071. doi:10.1016/s0043-1354(01)00248-2
Henne, K., Kahlisch, L., Brettar, I., and Höfle, M. G. (2012). Analysis of structure and composition of bacterial core communities in mature drinking water biofilms and bulk water of a citywide network in Germany. Appl. Environ. Microbiol. 78 (10), 3530–3538. doi:10.1128/aem.06373-11
Husband, P. S., and Boxall, J. B. (2011). Asset deterioration and discolouration in water distribution systems. Water Res. 45 (1), 113–124. doi:10.1016/j.watres.2010.08.021
Husband, P. S., Boxall, J. B., and Saul, A. J. (2008). Laboratory studies investigating the processes leading to discolouration in water distribution networks. Water Res. 42 (16), 4309–4318. doi:10.1016/j.watres.2008.07.026
Husband, S., Fish, K. E., Douterelo, I., and Boxall, J. (2016). Linking discolouration modelling and biofilm behaviour within drinking water distribution systems. Water Supply 16 (4), 942–950. doi:10.2166/ws.2016.045
Inkinen, J., Jayaprakash, B., Ahonen, M., Pitkänen, T., Mäkinen, R., Pursiainen, A., et al. (2018). Bacterial community changes in copper and PEX drinking water pipeline biofilms under extra disinfection and magnetic water treatment. J. Appl. Microbiol. 124 (2), 611–624. doi:10.1111/jam.13662
Irie, Y., Borlee, B. R., O’Connor, J. R., Hill, P. J., Harwood, C. S., Wozniak, D. J., et al. (2012). Self-produced exopolysaccharide is a signal that stimulates biofilm formation in Pseudomonas aeruginosa. Proc. Natl. Acad. Sci. U. S. A. 109 (50), 20632–20636. doi:10.1073/pnas.1217993109
Joshi, N. (2011). Sabre: A barcode demultiplexing and trimming tool for FastQ files. USA: GitHub San Fr CA.
Jurek Vidlářová, P., and Heviánková, S. (2021). Comparison of modern drinking water network maintenance methods: Evaluation of removed deposits in the form of total suspended solids (TSS). Int. J. Environ. Res. Public Health 18 (8), 4311. doi:10.3390/ijerph18084311
Jurgens, D. J., Sattar, S. A., and Mah, T. F. (2008). Chloraminated drinking water does not generate bacterial resistance to antibiotics in Pseudomonas aeruginosa biofilms. Lett. Appl. Microbiol. 46 (5), 562–567. doi:10.1111/j.1472-765x.2008.02354.x
Kõljalg, U., Nilsson, R. H., Abarenkov, K., Tedersoo, L., Taylor, A. F. S., Bahram, M., et al. (2013). Towards a unified paradigm for sequence-based identification of fungi. Mol. Ecol. 22 (21), 5271–5277. doi:10.1111/mec.12481
Li, W., Zhang, J., Wang, F., Qian, L., Zhou, Y., Qi, W., et al. (2018). Effect of disinfectant residual on the interaction between bacterial growth and assimilable organic carbon in a drinking water distribution system. Chemosphere 202, 586–597. doi:10.1016/j.chemosphere.2018.03.056
Lin, H., Zhu, X., Wang, Y., and Yu, X. (2017). Effect of sodium hypochlorite on typical biofilms formed in drinking water distribution systems. J. Water Health 15 (2), 218–227. doi:10.2166/wh.2017.141
Liu, S., Gunawan, C., Barraud, N., Rice, S. A., Harry, E. J., and Amal, R. (2016). Understanding, monitoring, and controlling biofilm growth in drinking water distribution systems. Environ. Sci. Technol. 50 (17), 8954–8976. doi:10.1021/acs.est.6b00835
Liu, Y., Shan, R., Chen, G., and Liu, L. (2020). Linking flow velocity-regulated EPS production with early-stage biofilm formation in drinking water distribution systems. Water Supply 20, 1253–1263. doi:10.2166/ws.2020.039
Lu, J., Struewing, I., Vereen, E., Kirby, A. E., Levy, K., Moe, C., et al. (2016). Molecular Detection of Legionella spp. and their associations with Mycobacterium spp., Pseudomonas aeruginosa and amoeba hosts in a drinking water distribution system. J. Appl. Microbiol. 120 (2), 509–521. doi:10.1111/jam.12996
Ma, L., Li, B., Jiang, X-T., Wang, Y-L., Xia, Y., Li, A-D., et al. (2017). Catalogue of antibiotic resistome and host-tracking in drinking water deciphered by a large scale survey. Microbiome 5 (1), 154. doi:10.1186/s40168-017-0369-0
McCoy, S. T., and VanBriesen, J. M. (2014). Comparing spatial and temporal diversity of bacteria in a chlorinated drinking water distribution system. Environ. Eng. Sci. 31 (1), 32–41. doi:10.1089/ees.2013.0174
Monteiro, L., Figueiredo, D., Covas, D., and Menaia, J. (2017). Integrating water temperature in chlorine decay modelling: A case study. Urban Water J. 14 (10), 1097–1101. doi:10.1080/1573062x.2017.1363249
Morris, E. K., Caruso, T., Buscot, F., Fischer, M., Hancock, C., Maier, T. S., et al. (2014). Choosing and using diversity indices: Insights for ecological applications from the German biodiversity exploratories. Ecol. Evol. 4 (18), 3514–3524. doi:10.1002/ece3.1155
Narciso-da-Rocha, C., Vaz-Moreira, I., and Manaia, C. M. (2014). Genotypic diversity and antibiotic resistance in Sphingomonadaceae isolated from hospital tap water. Sci. Total Environ. 466–467, 127–135. doi:10.1016/j.scitotenv.2013.06.109
Neufeld, J. D., Vohra, J., Dumont, M. G., Lueders, T., Manefield, M., Friedrich, M. W., et al. (2007). DNA stable-isotope probing. Nat. Protoc. 2 (4), 860–866. doi:10.1038/nprot.2007.109
Niquette, P., Servais, P., and Savoir, R. (2000). Impacts of pipe materials on densities of fixed bacterial biomass in a drinking water distribution system. Water Res. 34 (6), 1952–1956. doi:10.1016/s0043-1354(99)00307-3
Novak Babič, M., Gunde-Cimerman, N., Vargha, M., Tischner, Z., Magyar, D., Veríssimo, C., et al. (2017). Fungal contaminants in drinking water regulation? A tale of ecology, exposure, purification and clinical relevance. Ahmed W, beale dj, editors. Int. J. Environ. Res. Public Health 14 (6), 636. doi:10.3390/ijerph14060636
Oksanen, J., Blanchet, F. G., Friendly, M., Kindt, R., Legendre, P., McGlinn, D., et al. vegan: Community ecology package. R package version 2.5-6. 2019. 2019.
Pintar, K. D. M., and Slawson, R. M. (2003). Effect of temperature and disinfection strategies on ammonia-oxidizing bacteria in a bench-scale drinking water distribution system. Water Res. 37 (8), 1805–1817. doi:10.1016/s0043-1354(02)00538-9
Pourcel, F., and Duchesne, S. (2020). Comparative analysis of air scouring and unidirectional flushing of water distribution systems. J. Water Supply Res. Technology-Aqua 69 (6), 578–590. doi:10.2166/aqua.2020.146
Prest, E. I., Hammes, F., van Loosdrecht, M. C. M., and Vrouwenvelder, J. S. (2016). Biological stability of drinking water: Controlling factors, methods, and challenges. Front. Microbiol. 7, 45. doi:10.3389/fmicb.2016.00045
Quast, C., Pruesse, E., Yilmaz, P., Gerken, J., Schweer, T., Yarza, P., et al. (2013). The SILVA ribosomal RNA gene database project: Improved data processing and web-based tools. Nucleic Acids Res. 41, D590–D596. doi:10.1093/nar/gks1219
Rahmatika, I., Kasuga, I., Kurisu, F., and Furumai, H. (2020). Impacts of organic matter migrating from pipe materials on microbial regrowth in drinking water. J. Water Environ. Technol. 18 (1), 45–53. doi:10.2965/jwet.19-078
Ren, H., Wang, W., Liu, Y., Liu, S., Lou, L., Cheng, D., et al. (2015). Pyrosequencing analysis of bacterial communities in biofilms from different pipe materials in a city drinking water distribution system of East China. Appl. Microbiol. Biotechnol. 99 (24), 10713–10724. doi:10.1007/s00253-015-6885-6
Rognes, T., Flouri, T., Nichols, B., Quince, C., and Mahé, F. (2016). Vsearch: A versatile open source tool for metagenomics. PeerJ 4, e2584. e2584–e2584. doi:10.7717/peerj.2584
Sautour, M., Edel-Hermann, V., Steinberg, C., Sixt, N., Laurent, J., Dalle, F., et al. (2012). Fusarium species recovered from the water distribution system of a French University hospital. Int. J. Hyg. Environ. Health 215 (3), 286–292. doi:10.1016/j.ijheh.2011.11.003
Schwering, M., Song, J., Louie, M., Turner, R. J., and Ceri, H. (2013). Multi-species biofilms defined from drinking water microorganisms provide increased protection against chlorine disinfection. Biofouling 29 (8), 917–928. doi:10.1080/08927014.2013.816298
Sharpe, R. L., Smith, C. J., Boxall, J. B., and Biggs, C. A. (2010). “Pilot scale laboratory investigations into the impact of steady state conditioning flow on potable water discolouration,” in Water distribution systems analysis, 494–506.
Srinivasan, S., Harrington, G. W., Xagoraraki, I., and Goel, R. (2008). Factors affecting bulk to total bacteria ratio in drinking water distribution systems. Water Res. 42 (13), 3393–3404. doi:10.1016/j.watres.2008.04.025
Stanish, L. F., Hull, N. M., Robertson, C. E., Harris, J. K., Stevens, M. J., Spear, J. R., et al. (2016). Factors influencing bacterial diversity and community composition in municipal drinking waters in the Ohio river basin, USA. PLoS One 11 (6), e0157966. doi:10.1371/journal.pone.0157966
Steinberg, J. P., and Burd, E. M. (2015). “238 - other gram-negative and gram-variable bacilli,” in Bennett’s principles and practice of infectious diseases (eighth edition) MJBT-M. Editors J. E. Bennett, R. Dolin, and Blaser Douglas (Philadelphia: Content Repository Only!), 2667–2683.e4.
Su, H-C., Liu, Y-S., Pan, C-G., Chen, J., He, L-Y., and Ying, G-G. (2018). Persistence of antibiotic resistance genes and bacterial community changes in drinking water treatment system: From drinking water source to tap water. Sci. Total Environ. 616, 453–461. doi:10.1016/j.scitotenv.2017.10.318
Szewzyk, U., Szewzyk, R., Manz, W., and Schleifer, K-H. (2000). Microbiological safety of drinking water. Annu. Rev. Microbiol. 54 (1), 81–127. doi:10.1146/annurev.micro.54.1.81
Tamsikar, J., Naidu, J., and Singh, S. M. (2006). Phaeohyphomycotic sebaceous cyst due to cladosporium cladosporioides: Case report and review of literature. J. de Mycol. Medicale 16 (1), 55–57. doi:10.1016/j.mycmed.2005.12.002
Team, R. C. R. (2014). A language and environment for statistical computing. [computer program]. Vienna, Austria: R Foundation for Statistical Computing.
Toth, E. M., Vengring, A., Homonnay, Z. G., Keki, Z., Sproer, C., Borsodi, A. K., et al. (2014). Phreatobacter oligotrophus gen. nov., sp. nov., an alphaproteobacterium isolated from ultrapure water of the water purification system of a power plant. Int. J. Syst. Evol. Microbiol. 64 (3), 839–845. doi:10.1099/ijs.0.053843-0
van Bel, N., Hornstra, L. M., van der Veen, A., and Medema, G. (2019). Efficacy of flushing and chlorination in removing microorganisms from a pilot drinking water distribution system. Water 11 (5), 903. doi:10.3390/w11050903
Vaz-Moreira, I., Nunes, O. C., and Manaia, C. M. (2011). Diversity and antibiotic resistance patterns of sphingomonadaceae isolates from drinking water. Appl. Environ. Microbiol. 77 (16), 5697–5706. LP – 5706. doi:10.1128/aem.00579-11
Vaz-Moreira, I., Nunes, O. C., and Manaia, C. M. (2012). Diversity and antibiotic resistance in Pseudomonas spp. from drinking water. Sci. Total Environ. 426, 366–374. doi:10.1016/j.scitotenv.2012.03.046
Vreeburg, I. J. H. G., and Boxall, D. J. B. (2007). Discolouration in potable water distribution systems: A review. Water Res. 41 (3), 519–529. doi:10.1016/j.watres.2006.09.028
Vreeburg, J. H. G., Schaap, P. G., Bergmans, B., and Van Dijk, J. C.. How effective is flushing of cast iron pipes? Water Distrib. Syst. Anal. 2008. 2008. p. 1–12. (Proceedings).
Wang, H., Masters, S., Edwards, M. A., Falkinham, J. O., and Pruden, A. (2014). Effect of disinfectant, water age, and pipe materials on bacterial and eukaryotic community structure in drinking water biofilm. Environ. Sci. Technol. 48 (3), 1426–1435. doi:10.1021/es402636u
Waśkiewicz, A., and Irzykowska, L. (2014). “Flavobacterium spp. – characteristics, occurrence, and toxicity,” in Tortorello MLBT-E of FM. Editor C. A. Batt. Second E (Oxford: Academic Press), 938–942.
Wickham, H., and Chan, W. (2016). Rstudio (2016). Ggplot. R package version 2.21. Online: https://githubcom/tidyverse/ggplot2.
Wingender, J., and Flemming, H-C. (2011). Biofilms in drinking water and their role as reservoir for pathogens. Int. J. Hyg. Environ. Health 214 (6), 417–423. doi:10.1016/j.ijheh.2011.05.009
Keywords: climate change, flushing, hyperchlorination, discoloration, bacteria, fungi, metagenomics
Citation: Calero Preciado C, Soria-Carrasco V, Boxall J and Douterelo I (2022) Climate change and management of biofilms within drinking water distribution systems. Front. Environ. Sci. 10:962514. doi: 10.3389/fenvs.2022.962514
Received: 06 June 2022; Accepted: 08 September 2022;
Published: 03 October 2022.
Edited by:
Prosun Bhattacharya, Royal Institute of Technology, SwedenReviewed by:
Lúcia Chaves Simões, University of Minho, PortugalChiqian Zhang, University of Missouri, United States
Copyright © 2022 Calero Preciado, Soria-Carrasco, Boxall and Douterelo. This is an open-access article distributed under the terms of the Creative Commons Attribution License (CC BY). The use, distribution or reproduction in other forums is permitted, provided the original author(s) and the copyright owner(s) are credited and that the original publication in this journal is cited, in accordance with accepted academic practice. No use, distribution or reproduction is permitted which does not comply with these terms.
*Correspondence: C. Calero Preciado, Yy5jYWxlcm9wQGdtYWlsLmNvbQ==