 Yong-Kun Wang
 Yang Liang
 Liang-Shan Shao
94% of researchers rate our articles as excellent or good
Learn more about the work of our research integrity team to safeguard the quality of each article we publish.
Find out more
ORIGINAL RESEARCH article
Front. Environ. Sci., 07 October 2022
Sec. Environmental Economics and Management
Volume 10 - 2022 | https://doi.org/10.3389/fenvs.2022.962264
This article is part of the Research TopicResource Efficiency and Environmental Impact AssessmentView all 21 articles
The rapid development of the tertiary industry has made the energy consumption of public buildings grow too fast during the operation stage, which has become a key area of energy conservation and emission reduction in China’s construction industry. This study uses the Minimum Distance to Strong effective Frontier function (MinDS) and Malmquist-Luenberger (ML) index analysis methods to measure the public building carbon emission efficiency (PBCEE) of 30 provincial-level units in China’s eight economic regions from 2010 to 2019, and analyze regional differences and evolution. Then, the influencing factors of PBCEE in different regions were analyzed using the fixed-effect panel data model. The results show that: 1) China’s PBCEE is generally low, with an average efficiency value of only 0.74, and there are great differences among regions, showing the spatial characteristics of “high in the east and low in the west.” 2) Relying on the positive impact of technological progress, the PBCEE in the eight regions increased year by year, with an annual growth rate of 1.82%. 3) The influence results and degrees of various factors on PBCEE are different in different economic zones, but increasing the proportion of electricity consumption has a certain positive effect on improving PBCEE. The same influencing factor has obvious threshold characteristics for PBCEE in different regions, so the government needs to consider the actual situation of the region when formulating carbon emission reduction policies for public buildings.
Sustainable development and global warming are still the main issues affecting world development. In recent years, the frequent occurrence of extreme weather and energy crises has brought great challenges to human society (Shan and Hwang, 2018). As one of the three major energy-consuming industries in China, the construction industry not only promotes economic development but also emits a large amount of carbon dioxide. In 2018, the total carbon emission of China’s construction industry was 4.93 billion tons, accounting for 51.2% of the country’s total carbon emissions (China Building Energy Consumption Research Report, 2021). To this end, the Chinese government has pledged to reduce carbon emissions per unit of gross domestic product (GDP) by around 65% by 2030 compared with 2005 (UNFCCC, 2016). To achieve this binding target, efforts are required to reduce carbon emissions by various industries, especially the construction industry (Lai et al., 2019), where the key to carbon emission reduction is to improve carbon emission efficiency.
Public buildings, also known as commercial buildings, as a typical part of the construction industry, and undertake most of the production activities of the tertiary industry. Therefore, the rapid development of the tertiary industry has made the carbon emissions of public buildings soar, accounting for more than 30% of the carbon emissions of the construction industry in 2018. In the whole life cycle of carbon emissions from public buildings, the proportion of carbon emissions generated in the operation stage is the largest (Building Energy Conservation Research Center of Tsinghua University, 2020). It is foreseeable that with the development of the tertiary industry, public buildings will also lead to a continuously high level of carbon emissions during operation. The newly promulgated “China’s Carbon Neutral Strategy and Path to Peak Carbon” point out that the priority concept of energy saving is adhered to, and the energy efficiency of the whole society is continuously improved to facilitate the green transformation of production and life. Therefore, the improvement of carbon emission efficiency of related industries with public buildings as the main body (public building industry) plays an important role in realizing China’s carbon peak in 2030.
Most studies on carbon emission efficiency focus on single-factor efficiency and total factor efficiency. The former defines carbon emission efficiency as the ratio of carbon emission to a certain factor of production. Such as Song et al. (2018) calculated the carbon emission intensity of China’s construction industry; Li et al. (2021) analyzed that the change in intermediate input structure caused the change in the carbon intensity of the construction industry. However, this indicator does not consider the actual connection with other production factors, so it cannot be accurately measured (Hu and Wang, 2006). The commonly used methods in total factor efficiency research are the non-parametric method represented by Data Envelopment Analysis (DEA) and the parametric method represented by Stochastic Frontier Analysis (SFA). Compared with SFA, DEA has the advantages of multiple inputs and multiple outputs and has become the mainstream model for evaluating carbon emission efficiency. But under the traditional DEA model, the optimal value obtained is the maximum efficiency ratio, leading to the accuracy of efficiency measurement suffering. Relevant scholars are currently paying more attention to which model can better reflect the essence and significance of efficiency evaluation.
In the study of public buildings, related scholars have carried out work from different perspectives. Xiang et al. (2022a) used a structural decomposition approach to assess the progress of decarbonization of commercial buildings in 16 countries between 2010 and 2019, and the decarbonization efficiency of 16 economies was 10.1%. Soonsawad et al. (2022) calculated the material consumption and carbon emission of commercial buildings during the construction stage. Xiang et al. (2022b) estimated peak emissions from the commercial building sector at 1,264.81 MtCO2 using the LASSO-WOA method, with the peak year of 2030. Xiang et al. (2022c) developed a carbon emission index decomposition tool for the construction industry—PyLMDI. Du et al. (2022) discussed the spatiotemporal distribution of carbon emissions from public buildings in 30 provinces in China using the GTWR model and believed that there were east-west differences in the carbon emissions of public buildings in various provinces in China. Li G J. et al. (2022) studied the commercial buildings in China from 2001 to 2016 changes in carbon emission reduction in the operation phase and established an evaluation framework for emission reduction intensity, emission reduction amount, and carbon emission reduction rate for the decomposition of carbon intensity. Liu L. Q et al. (2021) evaluated the static environmental efficiency of the public building industry but did not analyze the dynamic analyze it from an angle. So far, scholars have done a lot of research on public buildings, but there is still less research on the carbon emission efficiency of provincial public buildings in the operation stage, and the imbalance of regional economic development and differences in resource endowments will increase the carbon emission efficiency of public buildings (PBCEE). The big difference is not in line with China’s strategy of coordinating regional development. Therefore, it is necessary to study the PBCEE from a regional perspective.
This paper evaluates the PBCEE of 30 provinces in China from 2010 to 2019, divides the 30 provinces into eight economic zones according to the criteria of the Development Center of The State Council, then discusses the regional differences in PBCEE, and analyzes the PBCEE in each region main driver. Finally, through the analysis of PBCEE and its influencing factors, the corresponding emission reduction measures in each region are proposed. The main contributions of this study are as follows: 1) Research the subject of public buildings, and calculate the PBCEE of China from the provincial level, to fill the gap in the current evaluation of total factor carbon emission efficiency. 2) Selected efficiency calculation model overcomes the inherent defects of the traditional DEA model and makes the PBCEE more consistent with the actual situation. The calculation results can provide a better basis for the government to make decisions. 3) The combination of static and dynamic dual perspectives is more helpful to reveal the evolution law and influencing factors of PBCEE differences, and can provide decision-making references for improving PBCEE in various regions and accelerating energy conservation, emission reduction and coordinated development.
The carbon emission efficiency research and sustainable development of public buildings need to attract global attention, and DEA is widely used in the current carbon emission efficiency evaluation. DEA evaluates the relative efficiency of the decision-making unit (DMU) with multiple input and output indexes based on linear programming. Thus a nonparametric production frontier is constructed (Charnes et al., 1978). Hu and Liu (2015) used the traditional DEA model to measure the carbon emission efficiency of the Australian construction industry, and the results show that the carbon emission efficiency has improved in most regions. Han et al. (2022) also used the DEA model to measure the static energy efficiency of buildings. Zhou and Yu (2021) evaluated the carbon dioxide emission efficiency of the construction industry using three-stage DEA and found that environmental factors and random errors are serious in its carbon emission efficiency. To eliminate the influence of environmental factors. Zhang et al. (2018) adopted a three-stage DEA model to measure the carbon emission efficiency of China’s construction industry, thereby improving the objectivity of the results. Simar and Wilson (2007) later developed the dual-bootstrap DEA method to measure environmental efficiency and improve the statistical efficiency of the second-stage regression.
These models are all radial DEA models, and the inefficiency level of DMU can only cover the part that the input-output index can be reduced or increased in equal proportion, which is inconsistent with the actual situation and effects the accuracy of efficiency measurement (Yu, 2020). Tone (2001) proposed the SBM model to more effectively study the redundancy of input indexes and the deficiency of output indexes of each DMU. The SBM model can not only solve the problem of slack variables but also solve the problem of DMU efficiency evaluation under the existence of undesirable outputs. Zhou et al. (2019) measured the total-factor carbon emission efficiency of the construction industry from 2003 to 2016 by applying the Super-SBM DEA approach, the results show that the carbon emission efficiency of the construction industry is declining year by year. Considering environmental and technological heterogeneity, Du et al. (2021) employed a meta-frontier method to measure carbon emission efficiency. To remove the influence of environmental factors and statistical noise, Li K et al. (2022) used the super-efficiency SBM model combined with the three-stage DEA model to calculate the green building efficiency value and obtain a value closer to the actual situation.
However, the SBM model also has an obvious disadvantage, that is, the objective function minimizes the efficiency value, and the projection point is the farthest point from the evaluation object on the front plane, which leads to the overestimation of the improvement potential of DMU (Song and Cong, 2016). In contrast, the Minimum Distance to Strong effective Frontier function (MinDS) proposed by Aparicio et al. (2007) was adopted to effectively solve the inherent defects of the SBM model, and make carbon emission efficiency evaluation results closer to the real situation. Guo et al. (2022) used the super-efficiency MinDS model to measure China’s eco-efficiency, providing a reliable basis for the improvement of the carbon emissions trading market. Therefore, considering the undesired output, this study combined with the MinDS model to measure the total factor PBCEE during operation.
The above efficiency analysis model is a static evaluation model, which can make a horizontal comparison of the efficiency of DMUs. To analyze PBCEE more completely, a dynamic evaluation of PBCEE is needed to observe whether the efficiency improves in different periods. The most common dynamic efficiency evaluation models are the Malmquist index model and the Malmquist-Luenberger (ML) index model. As the basic Malmquist index model cannot deal with the situation containing unintended outputs, Chung et al. (2007) extended the study on the index and constructed the ML model. This not only inherited the advantages of the Malmquist model, and when calculating the change rate of carbon emission efficiency, it is required to obtain a larger expected output with smaller unexpected output. Many scholars used the above two models to measure the change in total factor productivity of carbon emissions. Fernández et al. (2018) used DEA-Malmquist to evaluate industrial energy efficiency. Ran et al. (2018) studied the growth capacity and convergence of agricultural energy efficiency through the ML index decomposition model; Wang and Guo (2018) used the combination of the super-efficiency SBM model and ML index model to evaluate the carbon emission efficiency of Beijing public transportation. Therefore, based on the MinDS model and combined with the ML model, this study conducted a dynamic evaluation of the PBCEE.
To further study the influencing factors of carbon emission efficiency, many scholars have combined the DEA model with the econometric model for analysis. Wang et al. (2019) used the DEA model to measure the carbon emission efficiency of 30 provinces in China and combined the Tobit regression model to analyze the influencing factors of carbon emission efficiency. Considering the bad output of carbon emissions, Kuang et al. (2020) used the SBM model to measure the cultivated land-use efficiency in China and used the Tobit regression model to analyze the influencing factors of the difference in cultivated land-use efficiency. It is worth noting that when using the Tobit regression model to analyze, the efficiency value needs to be between 0 and 1, but the carbon emission efficiency value calculated by the MinDS model overcomes the defect that the traditional efficiency value can only be 1 at most. Therefore, this paper chooses a panel data model that is more suitable for the MinDS model to analyze the influencing factors of carbon emission efficiency.
Although the research methods are different, scholars’ research on the driving factors of carbon emission efficiency shows that industrial structure, the urbanization process, FDI, economic development, energy structure, etc. are the main factors affecting efficiency changes. As a low-carbon and environmentally friendly industry with high added value, the tertiary industry has a much lower energy consumption per 10,000 yuan of added value than the secondary industry (Ma et al., 2017), from the perspective of development trends, it is the industry that is most conducive to energy conservation. Xiang et al. (2022a) believed that the industrial structure is the key to decarbonization in the operation stage of public buildings. But Jiang and Zhao (2018) believed that the optimization of the industrial structure will lead to an increase in carbon emissions. The acceleration of urbanization may accelerate the generation of agglomeration effects, reduce energy consumption, and improve carbon emission efficiency (Su et al., 2018). It may also be that cities, as agglomeration areas of population and industries, will lead to an increase in carbon emissions (Qi et al., 2020). Scholars at home and abroad have different views on the impact of FDI on carbon emission efficiency. Li and Qi (2016) believe that foreign investment is still mainly in energy-intensive industries, ignoring the improvement of development technology, resulting in low efficiency, which means that FDI is not conducive to carbon emission efficiency. Ntom and Selin (2021) and Liu X. W et al. (2021) believe that when a region is closely connected with the rest of the world, it is easier to introduce advanced foreign technology and management experience, reduce the consumption of energy-intensive products, and improve carbon emission efficiency. From the perspective of economic growth, Li (2021) believed that under China’s extensive economic development model, its economic growth will significantly promote the growth of its carbon emissions, and Zhong et al. (2020) have shown through empirical research that GDP has the highest correlation with carbon emissions. While Chen et al. (2021) believed that economic development also helps to invest more in environmental protection and improves carbon emission efficiency. The optimization of the energy structure will slow down the generation of carbon emissions (Sun and Ren, 2021), and the energy consumption dominated by coal will lead to more carbon emissions, which is not conducive to the improvement of carbon emission efficiency.
In addition to the above factors, public building areas can also be used as another factor effecting carbon emission efficiency. On the one hand, the increase in public building areas will promote the development of the tertiary industry, but it will also increase the electricity consumption of the tertiary industry (Chen et al., 2016). Ma et al. (2017) analyzed the driving factors of carbon emissions from the operation of public buildings in China and believed that the per capita floor area of public buildings is the main driving force for the increase in carbon emissions. However, few related studies use the public building area as an influencing factor of carbon emissions efficiency.
In this study, PBCEE was calculated by applying the MinDS model of undesired output. This model limits all the evaluated DMU reference benchmarks to the same hyperplane by adding constraints. After all the effective DMUs are determined through the SBM model, use the effective subset as the reference set to solve the planning model.
Let’s say the number of DMUs is
Firstly, find the effective DMU set of DEA through the SBM model, and record it as set E.
Where,
Secondly, using set E as the initial reference set, the following mixed linear programming is solved to obtain the MinDS efficiency value. Among them,
This paper draws on the ML index model proposed by Chung et al. (2007) that considers undesired output to measure the PBCEE. The ML index constructed based on the MinDS model is:
Furthermore, the ML index can be further decomposed into the product of the technical efficiency change index
Among them, EC measures the change of the production possibility boundary of technical efficiency from period t to period t+1. The degree of closeness between its observations and the production frontier represents the change in the level of DMU management organization capabilities in the two periods, also known as the “catch-up effect.” When the EC is greater than 1, it means that technological advancement contributes to the growth of PBCEE; if it is less than 1, the opposite is true. TC measures the degree of advancement of the technological frontier in two periods, reflecting the degree of technological change or technological innovation, and is called the “frontier movement effect.” TC greater than 1 indicates the improvement of PBCEE and technological progress, while less than 1 indicates the deterioration of efficiency and technological regression.
To further explore the source of the technical efficiency change index, Fare et al. (1994) decompose the technical efficiency change index into a pure efficiency change index and a scaling efficiency change index. The expression is:
This paper takes the influencing factors as independent variables and PBCEE derived from the MinDS model as dependent variables to establish a panel data model, to judge the influence degree of independent variables on PBCEE.
Hausman statistical test results were used to determine whether to build a random effect model or a fixed-effect model. The original hypothesis of its test is that individual effects are independent of explanatory variables. If true, the random effect estimation results are more valid. In addition, the fixed-effect model is better. The basic measurement model set is:
To eliminate the heteroscedasticity existing between the variables and enhance the stability of the panel data, all variables are processed logarithmically, and the final regression model constructed is:
Where,
Based on the total factor productivity theory and input-output model, this paper calculates the PBCEE of 30 provinces in China from 2010 to 2019 and selects relevant indicators to analyze the influencing factors of PBCEE. The basic data of the related variables are mainly derived from the “China Statistical Yearbook” (2011–2020) and the “China Energy Statistical Yearbook” (2011–2020). For individual data missing and outliers, the mean is used to correct.
There are three input indicators in this paper, namely capital input, labor input, and energy consumption; the value-added of related industries is selected as the expected output; the carbon emission of public buildings is the undesired output. The specific indicators are explained as follows, and the descriptive statistics of each indicator are shown in Table 1.
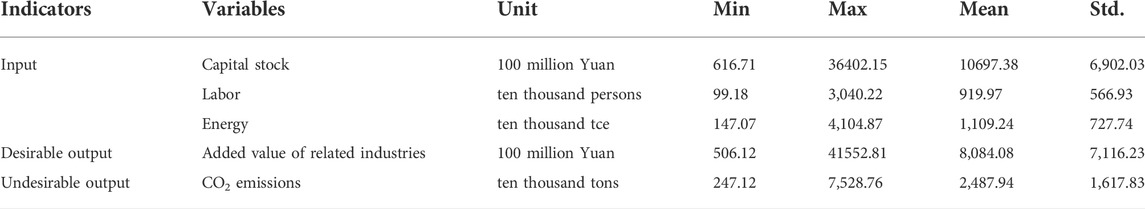
TABLE 1. Descriptive statistics of Input-Output indicators.
This study adopts the perpetual inventory method (Goldsmith, 1951; Shan, 2008) to estimate the capital investment in the public buildings industry (Wu, 2016), and then uniformly adjusts it to the constant price based on 2010.
Since the labor time invested in the actual production process cannot be obtained (Feng et al., 2014), the labor force indicator represents the number of people engaged in social labor and obtained reasonable remuneration, reflecting the utilization of labor resources in actual production during a certain period (Zhang and Jia, 2019). Therefore, following Lin and Wang (2016), this article regards 90% of the number of employees in the tertiary industry as the number of employees in the public building industry.
This paper adopts the macro model of building energy consumption based on an energy balance table to measure the energy consumption of public buildings. It can be seen from Cai et al. (2017) that the energy consumption of public buildings are concentrated in the three major industries “Transport, Storage and Post,” “Wholesale, Retail Trade and Hotel, Restaurants” and “Others.” Therefore, the energy consumption of public buildings is based on these three items, and the energy consumption of transportation is deducted from them. The deduction method of transportation energy consumption refers to the method of Wang (2007) and Zhao (2008). This paper selects eight types of energy for calculation, respectively raw coal, gasoline, diesel oil, fuel oil, kerosene, liquefied petroleum gas, natural gas, heat, and electricity, and converts the processed energy consumption into standard coal equivalent. The energy consumption of public buildings in 2019 is shown in Table A1.
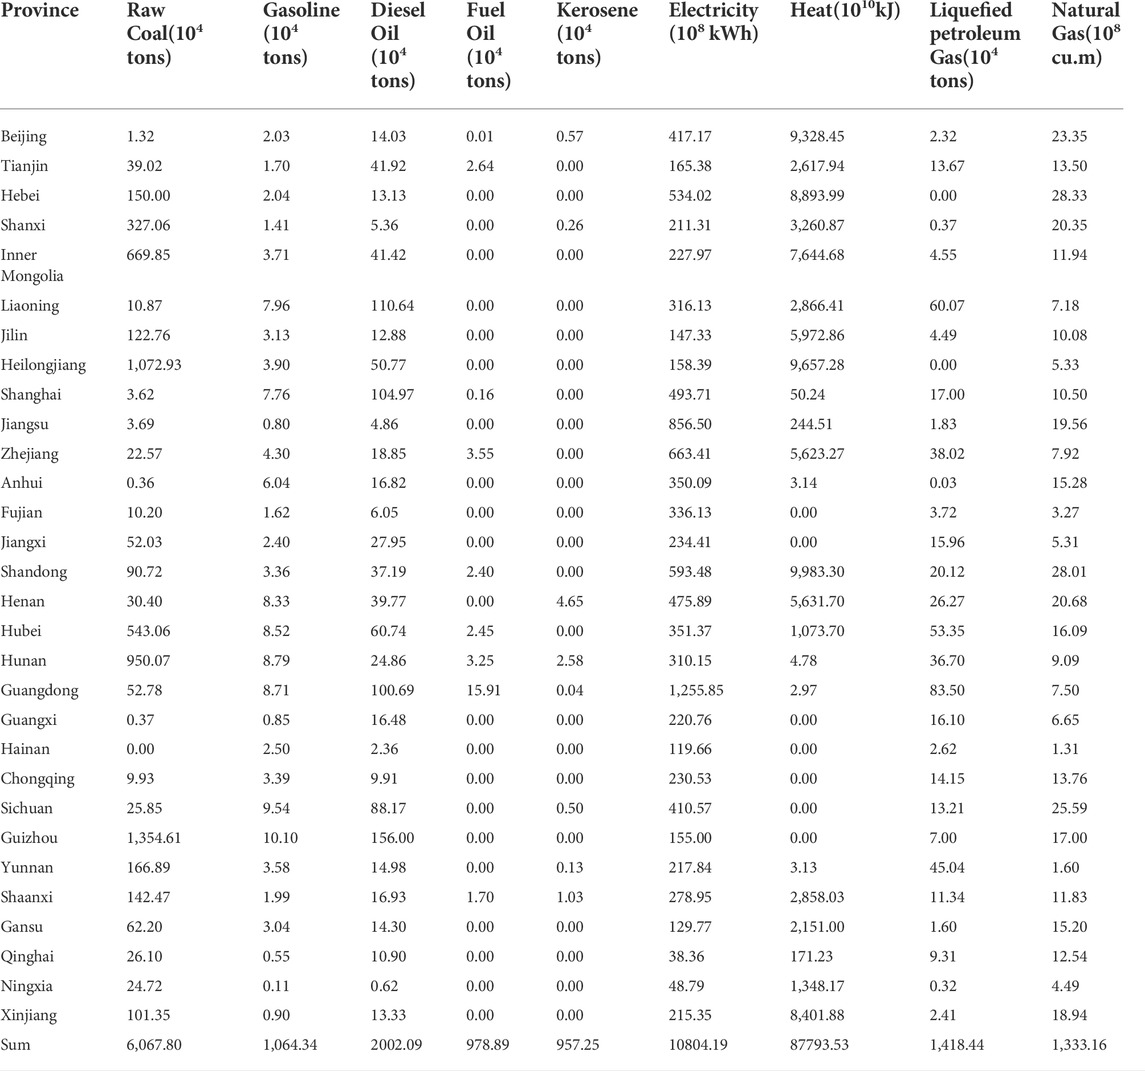
Table A1. The energy consumption of public buildings in 2019.
Since the value added of the transportation industry does not occur in public buildings, the value added of the relevant industries calculated in this article is the value added of the tertiary industry in each province from 2010 to 2019 minus the value added of the transportation industry (Lin and Wang, 2016), and converted it into the constant price in 2010, excluding the impact of inflation.
Carbon emission refers to the emission of greenhouse gases such as CO2 and methane. For the convenience of calculation, carbon emission from public buildings is specifically referred to as CO2 emission in this paper. The carbon emission coefficient method is used to calculate the CO2 emissions during the operation phase of public buildings. The calculation formula is:
Based on previous studies, this article selects indicators of Industrial Structure, Urbanization Level, Foreign Direct Investment, Development Level, Energy Structure, and Public Building Area, combined with the characteristics of the public building industry, to conduct an empirical analysis of the influencing factors of PBCEE. The meaning of each variable is shown in Table 2.
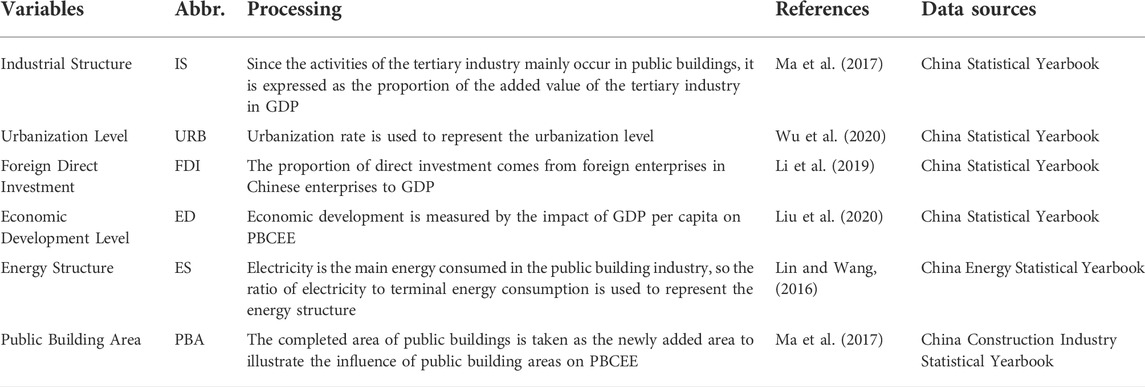
TABLE 2. Influencing factors and variable description of PBCEE.
This paper conducts PBCEE research according to the eight comprehensive economic regions classified in the report “Strategies and Policies for Regional Coordinated Development” by the Development Research Center of the State Council. The specific classifications are shown in Table 3.
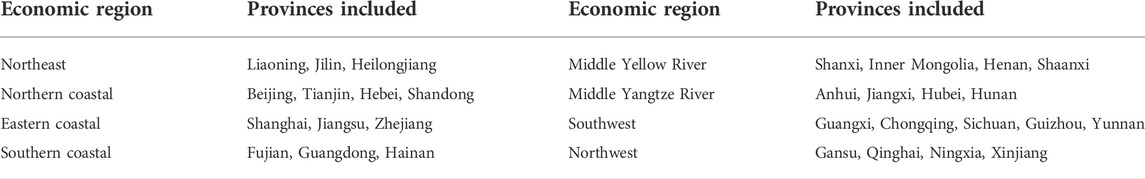
TABLE 3. Division of eight major economic regions in China.
This study uses MAXDEA 8 Ultra software to calculate the super-efficiency MinDS model considering undesired output, and obtains the PBCEE in various provinces from 2010 to 2019, as shown in Table 4 and Figure 1.
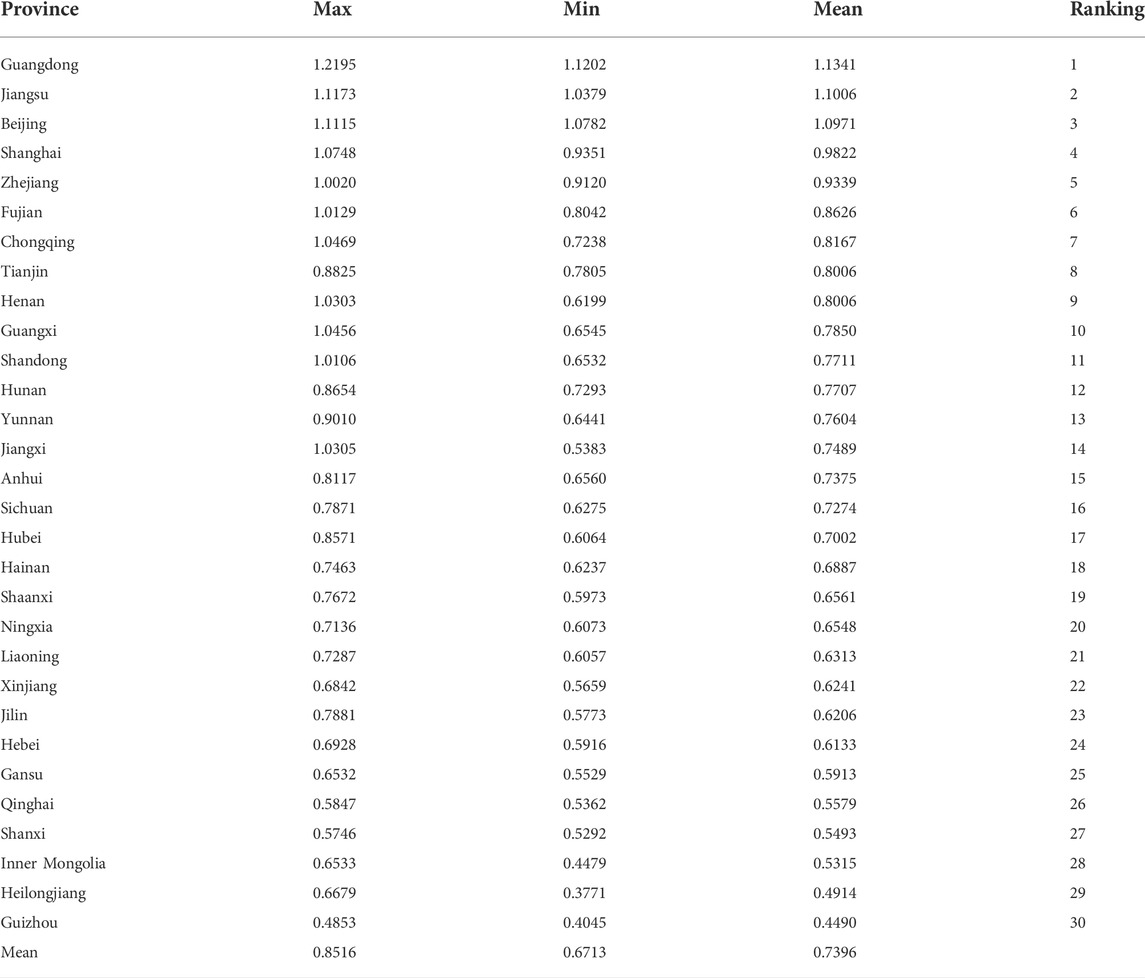
TABLE 4. Estimation results of PBCEE in China.
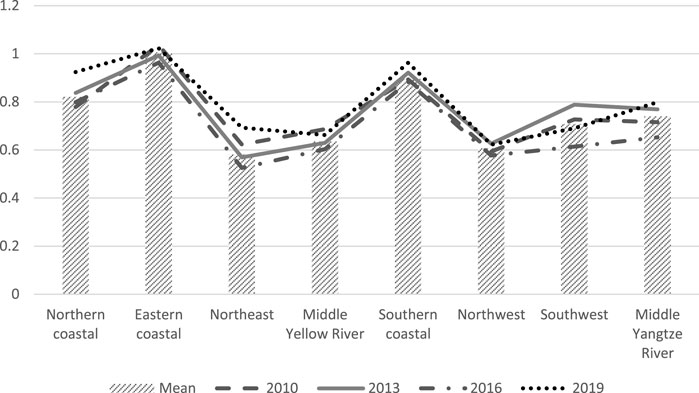
FIGURE 1. Carbon emission efficiency values of public buildings in China’s eight economic zones.
Table 4 shows that there is a large difference in PBCEE between provinces, the maximum PBCEE is about 2.5 times the minimum, indicating that quite a few provinces still have a large improvement and chasing space, and the overall PBCEE in China could be further improved.
From Figure 1, among the eight economic zones, the first echelon of PBCEE during the study period is the coastal areas, eastern coastal > southern coastal > northern coastal; the second echelon is the southern inland region, the middle reaches of the Yangtze River> the southwest region, and around the national average carbon emission level fluctuate up and down; the third echelon is the northern inland region, the middle reaches of the Yellow River > the northwest region; the fourth echelon has the lowest efficiency value in the northeast region. This result is consistent with the study by Li et al. (2019). It can be seen that PBCEE is consistent with the level of economic development. Specifically, the analysis is:
(1) The southern and eastern coastal areas represented by Guangdong and Jiangsu have the highest carbon emission efficiency values. On the one hand, due to the open geographical location and the support of national preferential policies, they have accumulated capital and technological advantages. On the other hand, the tertiary industry accounts for a large proportion, has high technical proficiency, and is in the forefront of production, resulting in an increase in PBCEE (Niu et al., 2020).
(2) From the northern coastal areas, Beijing and Tianjin are municipalities directly under the Central Government, enjoying more policy dividends, a relatively developed economy, a higher degree of popularization in the concept of low-carbon development, and higher energy efficiency (Lin and Wang, 2016). As a part of the coordinated development of Beijing-Tianjin-Hebei Province, Hebei has accepted a large number of enterprises that have moved out of Beijing, with high energy demand and low carbon emission efficiency, and is facing huge pressure to reduce emissions.
(3) In the middle reaches of the Yangtze River, the PBCEEs of the four provinces were the same. The highest is Hunan and the lowest is Hubei. During the study period, the PBCEEs increased the fastest in Jiangxi Province, with an increased value of 0.4125. As one of the first provinces in China to be included in the construction of the first demonstration zone for ecological civilization, Jiangxi Province adheres to the concept of “ecology first and green development,” and continuously promotes the adjustment of industrial structure and energy structure. The efficiency calculation results confirm that Jiangxi has made great progress in low-carbon development, but there is still room for improvement.
(4) In the southwest region, except for Guizhou, the average PBCEE of other provinces is 0.7724, which exceeds the national average. As one of the important development regions for China to implement the “Western Development Strategy” since the 21st century, the tertiary industry led by the tourism economy has made considerable development, and the introduction of foreign capital investment is an important factor in reducing the intensity of carbon emissions (Zhang et al., 2019). Among them, Guangxi and Chongqing have the fastest growth in PBCEE in the southwest region, with growth values exceeding 0.3. For example, the output value of Chongqing’s tertiary industry accounted for 49% of GDP in 2015, which has become the main driving force for Chongqing’s economic growth. 92.5% of Guizhou’s geomorphic structure is mountainous and hilly, which severely restricts the development of the local tertiary industry and makes the PBCEE the lowest.
(5) From the perspective of the economic zone in the middle reaches of the Yellow River, Henan has the fastest increase in the PBCEE during the study period, with a growth value of 0.4105. The vigorous development of tourism and service industries has brought great economic output to related industries that rely on public buildings. The growth rate of the added value of economic output in related industries was 138% between 2010 and 2019, making Henan’s economic development level rank first in Chinese central and western. In addition, due to the backward development of the tertiary industry in Shanxi and Inner Mongolia, and the use of raw coal as the main energy consumption, the PBCEE is at the end of the country, with an average value of only 0.5404.
(6) The PBCEE of Northwest China is Ningxia, Xinjiang, Gansu, and Qinghai in order from the highest to the bottom. The efficiency values of the four provinces are not much different, fluctuating around 0.6070. The reason for the low PBCEE may be that on the one hand, the geographical location is relatively remote, far from the political and economic center, and it is difficult to access advanced foreign technology and capital investment; on the other hand, the infrastructure construction is not perfect and the economic development is relatively backward. Among them, the PBCEEs in Gansu and Qinghai have a reciprocal ranking. These areas have large land areas, sparse populations, large proportions of mountainous plateaus, and extremely underdeveloped economies.
(7) As a traditional old industrial base in China, the Northeast mostly consumes raw coal as the main energy source, while the tertiary industry accounts for a relatively small proportion. This has led to lower public buildings’ energy-saving effects and the lowest PBCEE.
On the basis of analyzing the static characteristics and prosperity of PBCEE in various provinces and cities, the dynamic characteristics of PBCEE are further analyzed, and the ML index and its decomposition value of the public building industry by time period are obtained as shown in Table 5 by using MAXDEA 8 Ultra software.
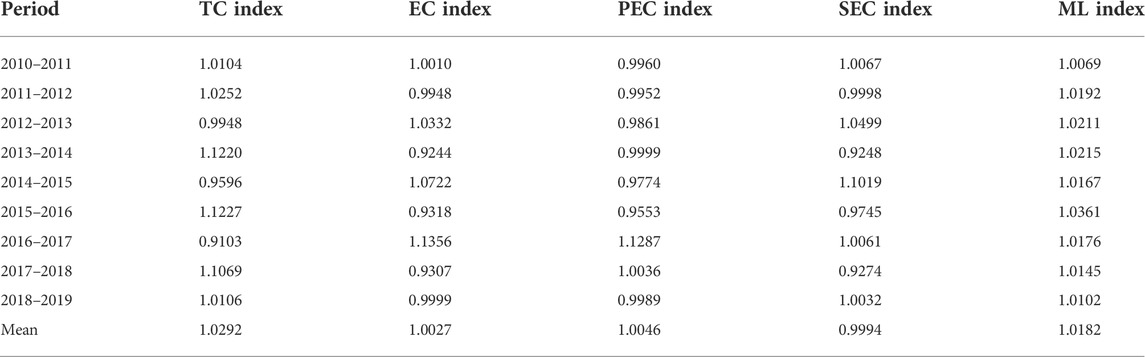
TABLE 5. The ML index decomposition results of PBCEE in 2010–2019.
As can be seen from table 5, the PBCEE is showing a trend of continuous improvement. During the study period, the average annual growth rate of PBCEE was 1.82%, and the fastest growth rate of PBCEE in 2015–2016 was 3.61%. Generally, the development of China’s PBCEE is showing a good momentum of steady progress.
Moreover, the TC index indicating that the average annual growth rate of the production technology frontier of public buildings is 2.92% considering carbon emission; the EC index showing that PBCEE’s catching-up speed on the production frontier has an average annual growth rate of 0.27%. This also means that the improvement of the overall PBCEE mainly depends on technological progress, while PBCEE’s catch-up of the production frontier is advancing in volatility, and the “catch-up effect” has slowed down.
Further breakdown, the average annual growth rate of the PEC index is 0.46%, and the SEC index is -0.06%. This shows that changes in technical efficiency are mainly affected by changes in pure technical efficiency, while changes in scale efficiency reflect that there is a gap between the level of production input in public buildings and the amount of input under the optimal production scale, and the ratio of input and output needs to be further coordinated.
Figure 2 show the dynamic changes in the PBCEE of the eight economic regions. Especially the PBCEE in the middle reaches of the Yangtze River has made the fastest progress, with a growth rate of 2.42%. Followed by the northern coast and the middle reaches of the Yellow River regions, the growth rates were 2.27% and 2.09% respectively. The PBCEE of the northwest, southwest, and northeast regions ranks behind, the growth rate is low, and there is plenty of room for improvement.
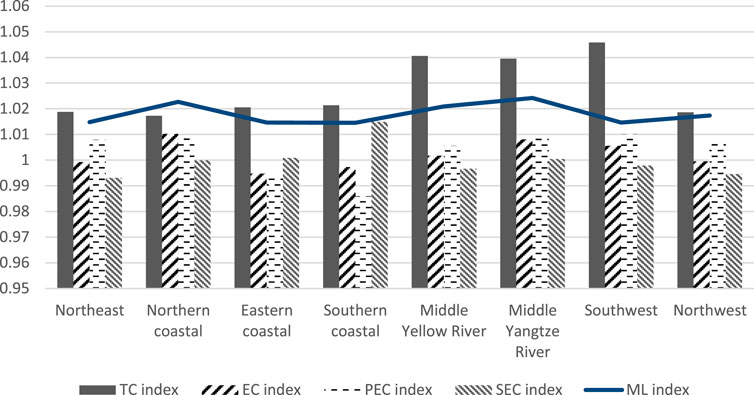
FIGURE 2. Dynamic average growth rate in the PBCEE of the eight economic regions.
Combining the ML index, TC index, and EC index measured above, the development of PBCEE from 2010 to 2019 can be studied, and targeted measures can be formulated for the problems in each region. For example, the ML index in the middle reaches of the Yellow River ranks third, the TC index ranks first, and the EC index ranks fourth. It can be seen that the PBCEE of this region has improved significantly, and technological progress is the most important reason for the improvement of PBCEE. At the same time, its carbon emission efficiency has slightly lagged in catching up with the production frontier. In other words, the rapid technological advancement in the region can drive the rapid development of the production frontier, but the PBCEE catching up with the production frontier is relatively slow, causing the industry’s production frontier to advance faster than the region’s own PBCEE improvement speed. To further increase the PBCEE in the region, it is necessary to start with the EC index. It is recommended to strengthen the absorption and utilization of high-tech by the public building industry and increase the degree of knowledge conversion.
The significance of the further decomposition of the EC index is to be able to find the deep-seated reasons for the changes in the PBCEE, to propose more targeted improvements and promotion measures. For example, the EC index in Southwest China is 1.0056, the PEC index is 1.0100, and the SEC index is 0.9978. This shows that the improvement of the technical efficiency of the public building industry is mainly caused by the improvement of pure technical efficiency, that is, the public building industry has realized the rapid promotion and application of high-tech as a whole, but because the industry scale is not at the optimal scale, the scale efficiency change index is less than 1, which harms the change in technical efficiency. Therefore, the adjustment proposal of this study for the development of the public building industry in the region is that in the future development process, the overall scale of the industry should be appropriately increased, the scale efficiency of the industry should be improved, and then drive the improvement of carbon emission efficiency level.
This paper uses Eviews10.0 statistical software to analyze the influencing factors of PBCEE. First, the p-value is 0 from the Hausman test results, so it is determined that the fixed-effects model should be selected in this paper. The results obtained by incorporating all explanatory variables into the fixed-effects model are shown in Tables 6 and 7.
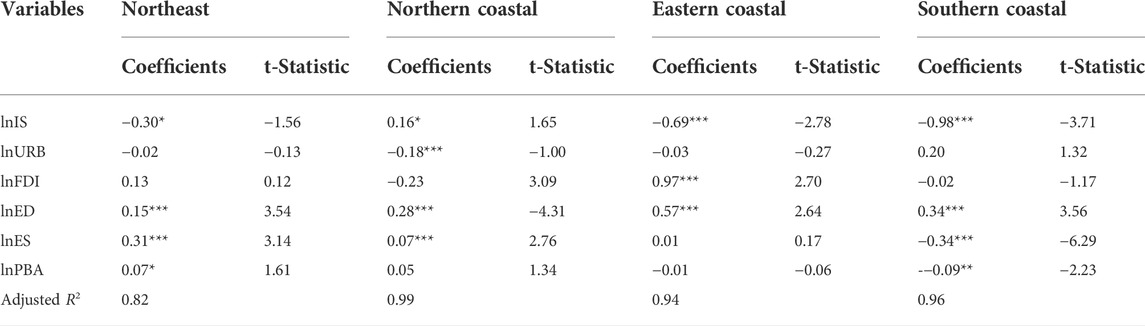
TABLE 6. Fixed effects model regression results (1).
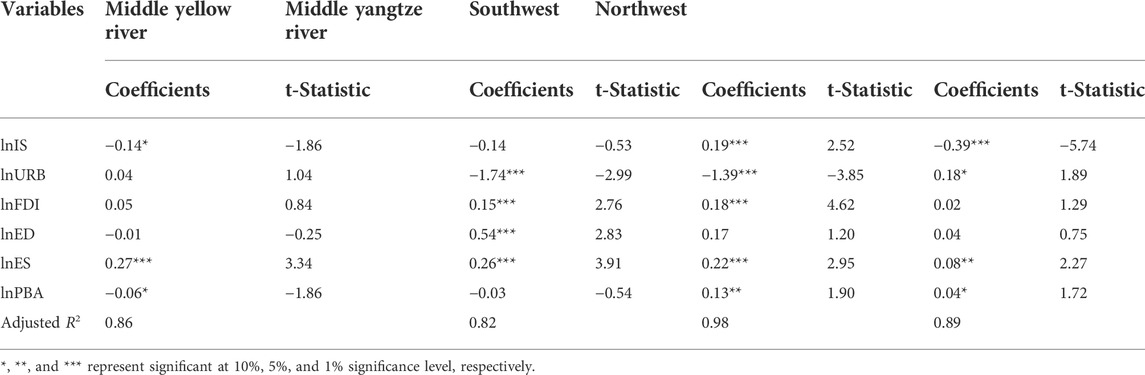
TABLE 7. Fixed effects model regression results (2).
By analyzing the regression results in Tables 6 and 7, the following conclusions can be obtained.
(1) IS inhibited the increase of PBCEE in the southeast coast, northwest, northeast, and the middle Yellow River, but the north coast and the southwest area have the promotion effect. This is consistent with the findings of Zheng et al. (2020), that is, the impact of IS on carbon emissions has regional differences. There are three reasons for the analysis:
The first is that the tertiary industry in the southeastern coastal area has a relatively high degree of maturity. The proportion of IS in most provinces has already exceeded 50%, and the growth rate of the added value of the tertiary industry is gradually slowing. The positive driving effect of economic growth on PBCEE is less than the negative driving effect of carbon emissions.
Second, in the northwest, northeast, and middle reaches of the Yellow River, the increase in the share of the tertiary industry hurts the increase of PBCEE. The reason is that in the development process of the tertiary industry, the energy structure dominated by coal consumption is unreasonable, and the demand for energy consumption is huge. Increasing the added value of the tertiary industry will generate more carbon emissions, thereby reducing PBCEE.
The third category is the southwest and northern coastal areas. Combined with the above ML index analysis, it can be seen that the rapid development of the tertiary industry in the two places is due to the improvement of pure technical efficiency, the realization of the promotion and application of emerging technologies, the reduction of energy consumption rate, and the improvement of PBCEE.
(2) The URB does not have a significant impact on PBCEE in half of the region. It only has a 1% significant negative impact on the PBCEE on the northern coast, the middle reaches of the Yangtze River, and the southwest region, while it has a 10% significant level of positive impact on PBCEE in Northwest China. This shows that the impact of URB on PBCEE is not always a driving or inhibiting effect, but has obvious threshold characteristics. Different levels of urbanization have different impacts on internal mechanisms, leading to different impacts on carbon emission efficiency.
(3) The FDI has a relatively small degree of impact on PBCEE in most regions and only has a significant positive impact of 1% on PBCEE in the eastern coastal, southwestern and middle reaches of the Yangtze River, especially the positive effect on PBCEE in the eastern coastal is stronger. This conclusion supports the analysis of the static efficiency results of the above-mentioned relevant regions. On the one hand, this situation arises because of the capital and technological advantages brought by foreign businessmen. On the other hand, although foreign capital has advanced management models and advantages in carbon emission reduction, investment in China is often high energy consumption and high pollution projects. Therefore, the impact of FDI on PBCEE has a dual nature, namely, the pollution halo hypothesis and the pollution haven hypothesis.
(4) The ED has a relatively small impact on the PBCEE in the middle reaches of the Yellow River, southwest and northwest, and has a positive impact of 1% significant level in other regions. The tertiary industry activities based on public buildings are closely related to the level of local economic development. On one hand, the more the economy develops, the more carbon dioxide is produced in economic activities; but on another, as the economic level improves, there will be more capital and technology to deal with carbon emissions, to a certain extent, offset the carbon emissions brought about by economic development. This analysis is in line with the conclusions of the environmental Kuznets curve.
(5) The ES, as the most influential factor of regional PBCEE, has a positive impact of 1% on PBCEE in most regions, a negative impact of 1% in the southern coastal, and no impact on the eastern coast. Increasing the proportion of electricity consumption has a positive effect on increasing PBCEE to a certain extent in most regions. However, for the southeast coastal areas, increasing the proportion of power consumption in the final energy consumption is not an absolute advantage. It is necessary to take advantage of local resources and increase the use of clean energy such as hydropower and nuclear power to further increase PBCEE.
(6) The influence of PBA on PBCEE can be roughly divided into two categories. One is that the southern coastal area and the middle reaches of the Yellow River have significant negative influence on PBCEE at 5% and 10%, respectively. In addition, the southwest had a significant positive effect on PBCEE at a level of 5%, the northwest and northeast only had a positive effect at a level of 10%. Therefore, the impact of the increase of public building area on PBCEE also has regional differences. The increase of public building areas lead to the increase of corresponding public building activities, which leads to the overuse of corresponding facilities and intensifies the generation of carbon dioxide.
Based on the total factor productivity theory and panel data of eight economic regions in China from 2010 to 2019, this study evaluates PBCEE from static and dynamic perspectives by using MinDS and ML index models. On this basis, a fixed-effect panel data model is established to analyze the influencing factors of PBCEE. On the one hand, this paper makes up for the relative deficiency of PBCEE research in China’s eight economic regions; On the other hand, suggestions can be put forward for the sustainable development of economic zones and carbon emission reduction of public buildings. The main conclusions are as follows:
Firstly, from the analysis of static results, there are large differences in the PBCEE in different regions, which makes the overall level in China relatively low. The PBCEE is 0.74 during the study period. From the point of the eight areas, PBCEE present the space of the “east high west low” characteristics, the eastern coastal area efficiency value is greater than the coastal areas of southern and northern coastal areas, the second is the area in the middle reach of Yangtze river and the southwest area fluctuating around the national average level, the performance of the middle reaches of the Yellow River and the northwest are a bit times, and the northeast is the lowest. The PBCEE is consistent with the level of economic development.
Secondly, from the analysis of dynamic results, the PBCEE level of eight regions in China is further improving, with an average annual growth rate of 1.82%. The improvement of PBCEE mainly depends on technological progress. The reason why the change of technological efficiency has a low positive impact on PBCEE is that the scale efficiency is low. There is a gap between the input level of the public building industry and the input amount under the optimal production scale, which needs further coordination. It is worth noting that the PBCEE in the northwest, southwest and northeast regions is not only backward, but also has a low growth rate, and there is still a lot of room for improvement.
Lastly, as for the internal driving factors of PBCEE, due to the different degrees of development in different regions, the impact result and degree of each factor on each region are different, and there is an obvious threshold effect. For the northern coastal region and the middle reaches of the Yangtze River, the energy structure and local economic development level have a positive impact on PBCEE, and the urbanization process has a restraining effect. For the eastern and southern coastal areas, the regional industrial structure has a restraining effect on PBCEE, and the level of economic development will promote PBCEE. Foreign investment can promote PBCEE in the middle reaches of the Yangtze River and eastern coastal. In southwest China, the industrial structure, foreign investment and energy structure have a significant positive effect on PBCEE, and only the urbanization level has a negative effect on PBCEE. For the northwest region and the middle reaches of the Yellow River, the energy structure has a significant promoting effect on PBCEE, while the industrial structure has a negative effect on PBCEE. For northeast China, regional economic development and energy structure have promoted PBCEE significantly. But in general, increasing the share of electricity in final energy consumption will improve the national PBCEE.
Based on the above conclusions and under the guidance of China’s regional coordinated and sustainable development strategy, this paper puts forward the following policy recommendations.
There are great differences in geographical location, level of economic development, and degree of openness among different regions, leading to great differences in PBCEE in different regions at present. Given this situation, it is suggested to make different policies and emission reduction targets according to the actual situation of different regions.
The eastern and southern coastal areas should increase the proportion of modern service industries, mainly finance and information, in the tertiary industry, and continue to enhance the level of high-tech and independent innovation. Reduce the use of secondary energy such as electricity in local public buildings, make more use of local natural conditions, increase the proportion of renewable clean energy, and reduce carbon emissions from public buildings. In addition, the government should establish a public building energy consumption monitoring platform, promulgate high carbon emission standards for public buildings, and take measures such as mandatory renovation and fines for buildings that meet high carbon emissions.
In the middle reaches of the Yangtze River and the southwest region, play the pivotal role of the Yangtze River Economic Belt, realize the joint reorganization of the overall service industry, promote the development of the knowledge-intensive tertiary industry, and enhance the scale economy of the industry. It is suggested that the focus of this area is to continuously improve the ability of technological progress. On the one hand, the electrical equipment in public buildings can be significantly improved, and on the other hand, public building facilities can be upgraded to energy-saving facilities to improve energy efficiency.
For the middle reaches of the Yellow River and the northwest region, the proportion of coal consumption in the operation of public buildings should be reduced, and the use of electricity and wind energy should be increased. Pay attention to the rational allocation of the existing resource element structure and technical level, and seek the continuous improvement of the scale economy of public buildings. It can also create an environment conducive to the low-carbon operation of public buildings by promoting energy-saving technology innovation and advocating low-carbon energy-saving consumption methods.
For the northern coastal and northeastern regions, it is necessary to increase the proportion of the tertiary industry, speed up the transformation of traditional industries, and promote local economic development. At the same time, clean and low-carbon power supply technology should be developed to reduce the carbon emissions of public buildings during the use stage. Perhaps setting reasonable energy prices can foster good energy use habits in public building operators.
This study calculates the PBCEE and the influencing factors of efficiency change, providing the theoretical basis for formulating energy saving and emission reduction measures and coordinating regional development. However, the calculation results of this study are all carried out at the provincial level, while the analysis of the results is carried out at the regional level, ignoring the heterogeneity between different cities. Therefore, the results of theoretical analysis and policy making can be further refined. In the future, the research scope should be narrowed, focusing on the PBCEE of different prefecture-level cities in the region, and trying to expand the selection of input indicators. Or the combined method of DEA and SFA can also be used to measure PBCEE to improve the objectivity and pertinence of efficiency analysis. In addition, this study found that the same factor has different driving effects on different regions, and the focus of future research should also be to explore the mechanism of influence of different factors on PBCEE.
The original contributions presented in the study are included in the article/supplementary material, further inquiries can be directed to the corresponding author.
Y-KW: grasp the theme and research direction, YL: empirical research and data, L-SS: data.
The financial support from the Social Science Planning Fund of Liaoning Province (No. L20BGL029) and Humanities and Social Sciences General Program of Liaoning Provincial Department of Education (No. LJKR0147).
The authors declare that the research was conducted in the absence of any commercial or financial relationships that could be construed as a potential conflict of interest.
All claims expressed in this article are solely those of the authors and do not necessarily represent those of their affiliated organizations, or those of the publisher, the editors and the reviewers. Any product that may be evaluated in this article, or claim that may be made by its manufacturer, is not guaranteed or endorsed by the publisher.
Aparicio, J., Ruiz, J. L., and Sirvent, I. (2007). Closest targets and minimum distance to the Pareto-efficient frontier in DEA. J. Prod. Anal. 28, 209–218. doi:10.1007/s11123-007-0039-5
Building Energy Conservation Research Center of Tsinghua University (2020). Annual report on China building energy efficiency. China Architecture and Building Press.
Cai, W. G., Li, X. H., Wang, X., Chen, M. M., Wu, Y., and Feng, W. (2017). Building energy consumption splitting model based on energy balance table and its application. Heat. Vent. Air Cond. 47 (11), 27–34.
Charnes, A., Cooper, W. W., and Rhodes, E. (1978). Measuring the efficiency of decision making units. Eur. J. Operational Res. 2 (6), 429–444. doi:10.1016/0377-2217(78)90138-8
Chen, P., Xie, R., Lu, M., and Huang, Z. (2021). The impact of the spatio-temporal neighborhood effect on urban eco-efficiency in China. J. Clean. Prod. 285, 124860. doi:10.1016/j.jclepro.2020.124860
Chen, Z., Xin, S. N., Len, Y., and Li, K. (2016). Research on electricity consumption forecast of tertiary industry based on commercial area. Mech. Electron. Inf. 21, 154–155+157. doi:10.19514/j.cnki.cn32-1628/tm.2016.21.084
China Building Energy Consumption Research Report 2020 (2021). Building Energy Efficiency. Beijing, China. 02, 1
Chung, Y. H., Färe, R., and Grosskopf, S. (2007). Productivity and undesirable outputs: A directional distance function approach. J. Environ. Manag. 51 (3), 229–240. doi:10.1006/jema.1997.0146
Du, Q., Wu, J., Cai, C. L., Li, Y., Zhou, J., and Yan, Y. Q. (2021). Carbon mitigation by the construction industry in China: A perspective of efficiency and costs. Environ. Sci. Pollut. Res. 28, 314–325. doi:10.1007/s11356-020-10412-z
Du, Z., Liu, Y., and Zhang, Z. (2022). Spatiotemporal analysis of influencing factors of carbon emission in public buildings in China. Buildings 12, 424. doi:10.3390/buildings12040424
Fare, R., Grosskopf, H., Norris, M., and Zhang, Z. Y. (1994). Productivity growth, technical progress, and efficiency change in industrialized countries. Am. Econ. Rev. 84, 66
Feng, B., Wang, X. Q., and Liu, B. Q. (2014). Provincial variation in energy efficiency across China's construction industry with carbon emission considered. Resour. Sci. 36 (6), 1256–1266.
Fernández, D., Carlos, P., Rubén, F., Laureano, J., and Gonzalo, G. G. (2018). Productivity and energy efficiency assessment of existing industrial gases facilities via data envelopment analysis and the Malmquist index. Appl. Energy 212, 1563–1577. doi:10.1016/j.apenergy.2017.12.008
Goldsmith, R. W. (1951).A perpetual inventory of national wealth.” in Congerene on Research in Income and Wealth, 14. National Bureau of Economic Research, 5
Guo, Y. S., Chen, J. Q., Shi, F., Peng, X. P., Ma, X. J., and Fang, D. (2022). The effect of China’s carbon emission trading on eco-efficiency: An empirical study at the city level. Environ. Sci. Pollut. Res. Int. 1, 17. doi:10.1007/s11356-022-21617-9
Han, Y. M., Lou, X. Y., Feng, M. F., Geng, Z. Q., Chen, L. C., Ping, W. Y., et al. (2022). Energy consumption analysis and saving of buildings based on static and dynamic input-output models. Energy 239, 122240. doi:10.1016/j.energy.2021.122240
Hu, J. L., and Wang, S. C. (2006). Total-factor energy efficiency of regions in China. Energy Policy 36 (2), 3206–3217. doi:10.1016/j.enpol.2005.06.015
Hu, X. C., and Liu, C. L. (2015). Managing undesirable outputs in the Australian construction industry using Data Envelopment Analysis models. J. Clean. Prod. 101, 148–157. doi:10.1016/j.jclepro.2015.03.077
Jiang, X. Y., and Zhao, S. (2018). Empirical study on the relationship between economic growth, industrial structure and carbon emissions in Jiangsu Province: Based on VAR model and impulse response analysis. J. Nanjing Univ. Finance Econ. 02, 16
Kuang, B., Lu, X. H., Zhou, M., and Chen, D. L. (2020). Provincial cultivated land use efficiency in China: Empirical analysis based on the SBM-DEA model with carbon emissions considered. Technol. Forecast. Soc. Change 151, 119874. doi:10.1016/j.techfore.2019.119874
Lai, X., Lu, C., and Liu, J. (2019). A synthesized factor analysis on energy consumption, economy growth, and carbon emission of construction industry in China. Environ. Sci. Pollut. Res. 26, 13896–13905. doi:10.1007/s11356-019-04335-7
Li, J., Ma, X. F., and Yuan, Q. M. (2019). Evaluation and influencing factors' analysis of regional carbon emission efficiency. Acta Sci. Circumstantiae 39 (12), 4293–4300. doi:10.13671/j.hjkxxb.2019.0309
Li, K., and Qi, S. Z. (2016). Is the hypothesis that FDI reduces energy intensity of host country valid in China? -- empirical analysis based on provincial industrial panel data. World Econ. Stud. 03, 108–122+136. doi:10.13516/j.cnki.wes.2016.03.013
Li, S. (2021). The impact of industrial structure upgrading on my country’s carbon emission reduction from the perspective of high-quality development. Sustain. Dev. 11 (01), 149–159. doi:10.12677/SD.2021.111018
Li, X., Yu, Y., Shi, X., and Hu, X. (2021). Tracking the domestic carbon emission intensity of China’s construction industry: A global value chain perspective. Front. Environ. Sci. 9, 728787. doi:10.3389/fenvs.2021.728787
Li, G. J, G. J., Ma, X. T., and Song, Y. Q. (2022). Green building efficiency and influencing factors of transportation infrastructure in China: Based on three-stage super-efficiency SBM–DEA and Tobit models. Buildings 12, 623. doi:10.3390/buildings12050623
Li, K, K., Ma, M. D., Xiang, X. W., Feng, W., Ma, Z. L., Cai, W. G., et al. (2022). Carbon reduction in commercial building operations: A provincial retrospection in China. Appl. Energy 306, 118098. doi:10.1016/j.apenergy.2021.118098
Lin, B. Q., and Wang, A. L. (2016). Regional energy efficiency of China's commercial sector: An emerging energy consumer. Emerg. Mark. Finance Trade 52 (12), 2818–2836. doi:10.1080/1540496x.2016.1224176
Liu, Q., Wang, S., Li, B., and Zhang, W. (2020). Dynamics, differences, influencing factors of eco-efficiency in China: A spatiotemporal perspective analysis. J. Environ. Manage. 264, 110442. doi:10.1016/j.jenvman.2020.110442
Liu, L. Q, L. Q., Liu, K. L., Zhang, T., Mao, K., Lin, C. Q., Gao, Y. F., et al. (2021). Spatial characteristics and factors that influence the environmental efficiency of public buildings in China. J. Clean. Prod. 322, 128842. doi:10.1016/j.jclepro.2021.128842
Liu, X. W, X. W., Wahab, S., Hussain, M., Sun, Y., and Dervis, K. (2021). China carbon neutrality target: Revisiting FDI-trade-innovation nexus with carbon emissions. J. Environ. Manag. 294, 113043. doi:10.1016/j.jenvman.2021.113043
Ma, M. D., Yan, R., and Cai, W. G. (2017). An extended STIRPAT model-based methodology for evaluating the driving forces affecting carbon emissions in existing public building sector: Evidence from China in 2000–2015. Nat. Hazards (Dordr). 89, 741–756. doi:10.1007/s11069-017-2990-4
Niu, F. Q., Yang, X. Y., and Wang, F. (2020). Urban agglomeration formation and its spatiotemporal expansion process in China: From the perspective of industrial evolution. Chin. Geogr. Sci. 30 (03), 532–543. doi:10.1007/s11769-020-1094-3
Ntom, U. E., and Selin, Y. (2021). Interacting force of foreign direct invest (FDI), natural resource and economic growth in determining environmental performance: A nonlinear autoregressive distributed lag (nardl) approach. Resour. Policy 73, 102168. doi:10.1016/j.resourpol.2021.102168
Qi, X., Han, Y., and Kou, P. (2020). Population urbanization, trade openness and carbon emissions: An empirical analysis based on China. Air Qual. Atmos. Health 13, 519–528. doi:10.1007/s11869-020-00808-8
Ran, Q. Y., Wang, B. B., and Zhou, H. (2018). Growth and convergence of agricultural total factor energy efficiency under carbon emission constraints: Based on Malmquist-Luenberger exponential decomposition. Ecol. Econ. 02, 47
Shan, H. J. (2008). Reestimation of China's capital stock K: 1952-2006. Quantitative Tech. Econ. Res. 25, 10
Shan, M., and Hwang, B. G. (2018). Green building rating systems: Global reviews of practices and research efforts. Sustain. Cities Soc. 39, 172–180. doi:10.1016/j.scs.2018.02.034
Simar, L., and Wilson, P. W. (2007). Estimation and inference in two-stage, semi-parametric models of production processes. J. Econ. 136, 31–64. doi:10.1016/j.jeconom.2005.07.009
Song, J. Z., Yuan, X. Y., and Wang, X. P. (2018). Analysis on influencing factors of carbon emission intensity of construction industry in China. Environ. Eng. 36, 178
Song, Z., and Cong, L. (2016). Energy efficiency of China's transportation industry under environmental constraints. Transp. Syst. Eng. Inf. 04, 39–45. doi:10.16097/j.cnki.1009-6744.2016.04.006
Soonsawad, N., Martinez, R. M., and Schandl, H. (2022). Material demand, and environmental and climate implications of Australia's building stock: Current status and outlook to 2060. Resour. Conservation Recycl. 180, 106143. doi:10.1016/j.resconrec.2021.106143
Su, W. S., Liu, Y. Y., Wang, S. J., Zhao, Y. B., Su, Y. X., and Li, S. J. (2018). Regional inequality, spatial spillover effects, and the factors influencing city-level energy-related carbon emissions in China. J. Geogr. Sci. 28 (04), 495–513. doi:10.1007/s11442-018-1486-9
Sun, W., and Ren, C. M. (2021). The impact of energy consumption structure on China’s carbon emissions: Taking the Shannon–Wiener index as a new indicator. Energy Rep. 7, 2605–2614. doi:10.1016/j.egyr.2021.04.061
Tone, K. (2001). A slacks-based measure of efficiency in data envelopment analysis. Eur. J. Oper. Res. 130, 498–509. doi:10.1016/S0377-2217(99)00407-5
UNFCCC (2016). Submitted intended nationally determined contributions. Available at: http://www.c2es.org/international/2015-agreement/indcs (accessed June 11, 2016).
Wang, B. X., and Guo, K. (2018). Carbon emission efficiency of Public transportation in Beijing: Based on super-efficiency SBM model and ML index. Syst. Sci. Math. 04, 456.
Wang, Q. Y. (2007). Research on statistics and calculation of building energy consumption in China. Energy Sav. Environ. Prot. 08, 9
Wang, S., Wang, H., Zhang, L., and Dang, J. (2019). Provincial carbon emissions efficiency and its influencing factors in China. Sustainability 11 (8), 2355. doi:10.3390/su11082355
Wu, X., Hu, F., Han, J., and Zhang, Y. (2020). Examining the spatiotemporal variations and inequality of China's provincial co2 emissions. Environ. Sci. Pollut. Res. 27 (1), 16362–16376. doi:10.1007/s11356-020-08181-w
Wu, Y. (2016). China’s capital stock series by region and sector. Front. Econ. China 1, 17. doi:10.3868/s060-005-016-0010-5
Xiang, X. W., Ma, M. D., Ma, X., Chen, L. M., Cai, W. G., Feng, W., et al. (2022c11940). Historical decarbonization of global commercial building operations in the 21st century. Appl. Energy 322, 119401. doi:10.1016/j.apenergy.2022.119401
Xiang, X. W., Ma, X., Ma, Z. L., Ma, M. D., and Cai, W. G. (2022b). Python-LMDI: A tool for index decomposition analysis of building carbon emissions. Buildings 12, 83. doi:10.3390/buildings12010083
Xiang, X. W., Ma, X., Ma, Z. L., and Ma, M. D. (2022a). Operational carbon change in commercial buildings under the carbon neutral goal: A LASSO–WOA approach. Buildings 12, 54. doi:10.3390/buildings12010054
Yu, B. (2020). Industrial structure, technological innovation, and total-factor energy efficiency in China. Environ. Sci. Pollut. Res. 27, 8371–8385. doi:10.1007/s11356-019-07363-5
Zhang, C., Zhou, B., and Wang, Q. (2019). Effect of China's Western development strategy on carbon intensity. J. Clean. Prod. 215 (1), 1170–1179. doi:10.1016/j.jclepro.2019.01.136
Zhang, G. T., and Jia, N. (2019). Carbon emission efficiency measurement and spatial correlation characteristics of China's construction industry. Res. Sci. Technol. Manag. 39 (21), 7.
Zhang, J., Li, H., Xia, B., and Skitmore, M. (2018). Impact of environment regulation on the efficiency of regional construction industry: A 3-stage data envelopment analysis (DEA). J. Clean. Prod. 200, 770–780. doi:10.1016/j.jclepro.2018.07.189
Zhao, J. (2008). Analysis of energy consumption and electricity consumption in China's transportation industry. China's Energy 30 (12), 27–30.
Zheng, H., Gao, X., Sun, Q., Han, X. D., and Wang, Z. (2020). The impact of regional industrial structure differences on carbon emission differences in China: An evolutionary perspective. J. Clean. Prod. 257 (6), 120506. doi:10.1016/j.jclepro.2020.120506
Zhong, Y., Lin, A. W., Zhou, Z. G., He, L. J., and Yuan, M. X. (2020). Economic development status of the countries along the Belt and road and their correlations with population and carbon emissions. J. Resour. Ecol. 06, 539–548. doi:10.5814/j.issn.1674-764x.2020.06.001
Zhou, W. Z., and Yu, W. H. (2021). Regional variation in the carbon dioxide emission efficiency of construction industry in China: Based on the three-stage DEA model. Discrete Dyn. Nat. Soc. 2021, 1–13. doi:10.1155/2021/4021947
Zhou, Y. X., Liu, W. L., Lyu, X. Y., Chen, X. H., and Shen, M. H. (2019). Investigating interior driving factors and cross-industrial linkages of carbon emission efficiency in China's construction industry: Based on Super-SBM DEA and GVAR model. J. Clean. Prod. 241, 118322. doi:10.1016/j.jclepro.2019.118322
Keywords: public buildings, carbon emission efficiency, minimum distance to strong effective frontier function, Malmquist-Luenberger index, panel data model
Citation: Wang Y-K, Liang Y and Shao L-S (2022) Regional differences and influencing factors of the carbon emission efficiency from public buildings in China. Front. Environ. Sci. 10:962264. doi: 10.3389/fenvs.2022.962264
Received: 06 June 2022; Accepted: 21 September 2022;
Published: 07 October 2022.
Edited by:
Jiashuo Li, Shandong University, ChinaReviewed by:
Alexandros Maziotis, Pontificia Universidad Católica de Chile, ChileCopyright © 2022 Wang, Liang and Shao. This is an open-access article distributed under the terms of the Creative Commons Attribution License (CC BY). The use, distribution or reproduction in other forums is permitted, provided the original author(s) and the copyright owner(s) are credited and that the original publication in this journal is cited, in accordance with accepted academic practice. No use, distribution or reproduction is permitted which does not comply with these terms.
*Correspondence: Yang Liang, bGlhbmd5YW5nZWR1QDE2My5jb20=
Disclaimer: All claims expressed in this article are solely those of the authors and do not necessarily represent those of their affiliated organizations, or those of the publisher, the editors and the reviewers. Any product that may be evaluated in this article or claim that may be made by its manufacturer is not guaranteed or endorsed by the publisher.
Research integrity at Frontiers
Learn more about the work of our research integrity team to safeguard the quality of each article we publish.