 Hongmei Wen
 Shen Zhong
- School of Finance, Harbin University of Commerce, Harbin, China
Dairy farming has become one of the most important industries for China’s national economic development, but the dairy farming process emits large amounts of greenhouse gases, which accelerate the greenhouse effect. Improving green production efficiency is important for the harmonious development between dairy farming and environmental protection. This paper explores the evolutionary characteristics of China’s GMLMI (Green total factor productivity of dairy farming) in terms of scale heterogeneity based on data from 2007 to 2018 from 27 major dairy-producing provinces (municipalities directly under the central government) in China, considering negative output indicators and using the super-efficient SBM-GML index model. The results show that 1) China’s GMLMI in 2007–2018 is highest in the medium scale, followed by the large scale, and lowest in the small scale. The regional distribution is highest in the central region, followed by the eastern region, and lowest in the western region. 2) China’s GMLMI shows a positive increasing trend from 2007 to 2018, and the decomposition indicators of the three scales (small, medium, and large) perform differently, indicating that there are differences in the ways to enhance the GMLMI of the three scales. 3) The results of the meta Frontier surface are different from those of the group Frontier surface, with the meta Frontier surface GMLMI being lower and the group Frontier surface GMLMI being overestimated. Finally, this paper proposes policy recommendations on how to improve the overall GMLMI of dairy cattle environmental farming in China.
Introduction
In recent years, with the improvement of living standards and the change of consumer preferences, milk products have become an important animal nutrition consumer product for residents (Handford et al., 2016; Karaj and Deci, 2017; Adelson and Dahl, 2020), Dairy farming has also become an important pillar in the development of agricultural modernization (Priyanka and Soedjana, 2015; Brito et al., 2021; de Almeida et al., 2021). However, the rapid growth of dairy farming has also significantly increased carbon emissions and contributed to the greenhouse effect (Rotz, 2018; Brito and Silva, 2020). In 2021, China’s milk production is 36.83 million tons, according to a report by AgResearch, China emits 1.68 kg of CO2 for each kg of milk produced (MacDonald et al., 2007). Data from a report released by The World Resources Institute (WRI) 2020 shows that the livestock sector accounts for about 15% of total global carbon emissions, and dairy farming accounting for 61% of overall livestock emissions.
At present, the development of dairy farming has damaged the ecological environment, leading to frequent agricultural natural disasters, threatening farmers’ economic income and people’s living standards, (Abbas et al., 2021; Pata, 2021; Rehman et al., 2021), and has become a part of environmental governance focus and positive change (Forney et al., 2018; Lima et al., 2019). Therefore, to reduce carbon emissions and achieve harmonious development between dairy farming and ecological protection, it is necessary to study the green production of dairy farming (Gavrilova and Fedorova, 2020; Alem, 2021; Zhu and Oude Lansink, 2022). Based on this, this paper measures the green total factor productivity (TFP) of dairy farming.
There are different sizes of dairy cattle farming, depending on the number of cows farmed, the farming scale can be divided into small, medium, and large scale (Mosheim and Lovell, 2009; Toda et al., 2020). Different farming scales using different environmental treatments will have different pollutant dissipation indices (Schiano et al., 2017; Adenuga et al., 2019). The different farming scale has different allocation efficiency of production factors, and the utilization of natural resources is different (Espinoza-Ortega et al., 2007; Sefeedpari et al., 2019). Therefore, this paper uses the super-efficient SBM-GML model from the perspective of scale heterogeneity to comprehensively evaluate the changes in green TFP in China’s dairy farming industry from 2007 to 2018 by applying the meta Frontier and group Frontier, this is important to improve the green production efficiency of dairy farming in China.
The second part of this paper analyzes the research in related literature, the third part introduces the research methodology, the fourth part explains the selection of indicators and the data sources, the fifth part conducts the empirical analysis, and the sixth part gives the conclusion and policy recommendations based on the empirical results. The content framework of this paper is shown in Figure 1.
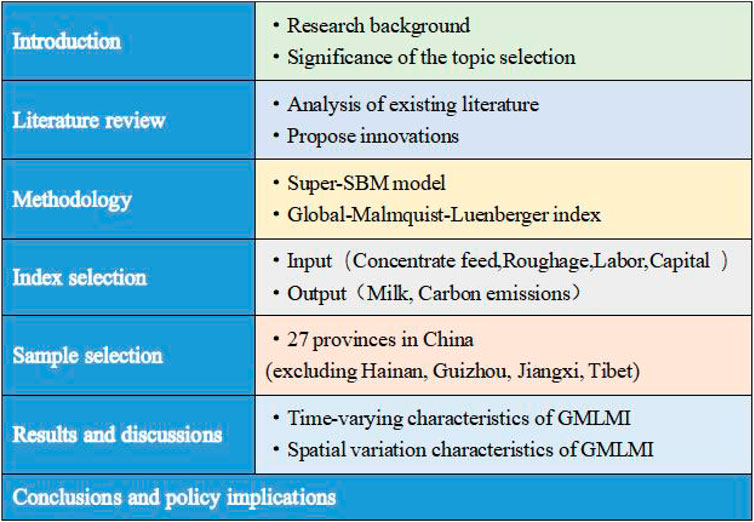
FIGURE 1. The content framework of the paper.
Literature Review
Currently, research on the efficiency of dairy farming has focused on two main areas.
The TFP of Dairy Farming
On the one hand, the research on dairy farming was from the perspective of TFP. Rae et al. (2006) decomposed TFP into technical efficiency (EC) and technological progress (TC), and the study found that 1980 to 1990 was a transitional stage that changed the production structure of China’s livestock industry, as shown by the decrease in TC progress EC. Conradie et al. (2009) measured the agricultural TFP in South Africa and found that there are differences in the development of agricultural TFP between the eastern and western regions. TFP in the western region shows a rapid positive growth trend while TFP in the eastern region shows stagnant or even negative growth. Armagan and Nizam (2012) conducted a 100-item survey of 1,429 dairy farms in Turkey and found that 206 dairy farms had labor resource wastage imagined, with external manifestations of an inverse relationship between farm size and TFP. Ohlen (2013) believed that in the Indian dairy processing industry, technical efficiency can lead to higher TFP growth than scale efficiency and that India can use the European model as a benchmark for building farm-scale and processing dairy products. Čechura et al. (2014) investigated the development of agricultural TFP in 24 EU member states and found that more member states showed positive growth in TFP, in which the contribution of technological innovation was more obvious. Moreira and Bravo-Ureta (2016) argued that increasing TFP on dairy farms through TC is more effective than EC, and concluded that TFP growth is independent of the size of dairy farming. Ningbo and Larue (2016) argued that improvements in technical efficiency can reduce production costs on Canadian dairy farms and that scale effects are the primary vehicle for TFP growth on Canadian dairy farms.
Recently, Madau et al. (2017) argued that internal technology upgrading on dairy farms in EU countries will not help much in improving TFP, while external factors will play a greater role in improving TFP. Galloway et al. (2018) believed that a sustainable dairy farm must achieve maximum TFP with a minimal environmental cost. Using concentrates and farm-produced hay effectively to reduce environmental costs, reduce the carbon footprint of cows, and improve nutrient uptake efficiency of cows is the way to maximize TFP and maximize profitability. Rada et al. (2019) analyzed the relationship between dairy farming size and TFP using data from three Brazilian agricultural censuses, and the results showed a U-shaped relationship between TFP and farming size. Omar (2020) measured the TFP of dairy farms in 27 Egyptian governorates, and the results showed that eight governorates had low TFP, and he suggested technological modifications to improve production efficiency. Olagunju et al. (2022), the study found that farm size and capital investment could enhance TFP on dairy farms, while feed expenditure and cow age had a significant negative effect on TFP. In summary, few scholars have studied dairy farming from a green TFP perspective.
The Measurement Methodology of Dairy Farming
On the other hand, there was research on the methodology of TFP measurement in dairy farming. Solow (1957), Jorgenson and Griliches (1967), Denison (1967) proposed to calculate TFR by the production function method. Farrell (1957), Moorsteen (1961), Hicks (1961), Färe et al. (1994) uses the idea of the exponential method to calculate TFP. However, in the process of practice, Coelli and Rao (2005), Zúniga-González (1979), Headey et al. (2010) found that because of the institutional system, social development, and other factors, many countries, especially developing countries, have difficulty in meeting the allocation effectiveness assumptions of the production function method and the index method, so these two methods cannot accurately calculate the TFP in agriculture. Stochastic Frontier Analysis (SFA), represented by Aigner et al. (1977), Meeusen and van Den Broeck (1977), Battese and Coelli (1995), was proposed to overcome the shortcomings of the production function method and the exponential method in measuring TFP in agriculture. SFA is a parametric approach for a multi-input, single-output portfolio, but agricultural production is a multi-input, multi-output portfolio. Therefore, in contrast to SFA, scholars were more likely to use the non-parametric data envelopment approach (DEA) proposed by Charles et al. (1978) and its extensions to measure agricultural TFP. Due to the shortcomings of various measurement methods, scholars and experts continued to optimize and extend the DEA measurement methods.
Tone (2001) proposed the Slack Based Measure (SBM) model, he has put the input-output slack variables directly into the objective function, solving the input-output slackness problem of the traditional DEA model and the bias of the efficiency measurement caused by the slackness problem. Andersen and Petersen (1993) proposed the super-efficient DEA model to avoid the problem that the traditional DEA model cannot evaluate the Decision-Making Unit (DMU) in order because of the efficiency of multiple DMUs ends up as 1. Tone (2002) and Tone and Sahoo (2003) proposed the Super-efficient SBM (SSBM) model after combining the two methods to achieve the complete ranking of decision units.
As the research on green TFP continues to grow, the measurement of green TFP based on the DEA model is gaining more and more attention. Green production efficiency includes not only desired outputs but also undesired outputs. Tone and Sahoo (2003) improved on the traditional SBM model by proposing an SBM model that included undesired outputs, which appropriately dealt with undesired outputs. However, these DEA models can only measure TFP at a single point in time, agricultural production is a continuous process. To remedy this aspect, Färe et al. (1992), Färe et al. (1994), Färe et al. (1997) combined the Malmquist index with DEA theory and decomposed the Malmquist index into technical efficiency change and technology level change in two periods, explaining the composition of productivity and its dynamic trend. Chung et al. (1997) refined the Malmquist index and proposed the Malmquist-Luenberger (ML) index to deal with problems related to undesired outputs. Oh (2010) constructed the Global Malmquist-Luenberger (GML) index which addresses the shortcomings of the ML index such as the lack of circular transferability and the unsolvability of linear programming. Based on the above advantages, the SSBM-GML index model is chosen to measure the green TFP of dairy farming containing non-desired outputs.
There are three innovations in this paper. 1) In terms of research topics, there is less literature on the green farming of dairy cattle in the existing TFP studies. 2) In terms of research methodology, out of scale heterogeneity perspective, an SSBM-GML index model is constructed to evaluate GMLMI of different scales on the meta Frontier surface and group Frontier surface. 3) In terms of indicator selection, negative output indicators were included considering the ecological damage caused by dairy farming.
Methodology
SSBM Model
Tone and Sahoo (2003) proposed the SSBM, which both ranks all effective DMUs and includes undesired outputs. The dairy farming process consumes energy and generates environmentally depleting pollutants. Considering this issue, this paper chooses the SSBM model that includes non-desired outputs to measure the efficiency values of all DMUs. The model assumes that there are y DMUs in the production system,
Among them,
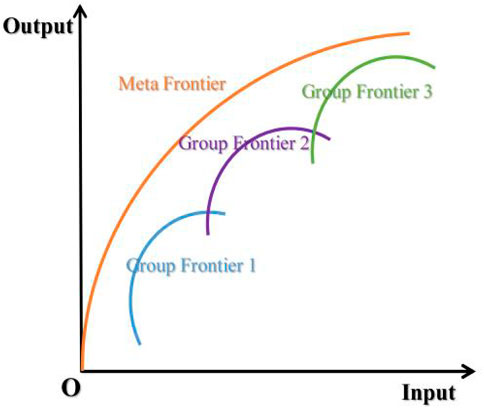
FIGURE 2. Meta Frontier structure.
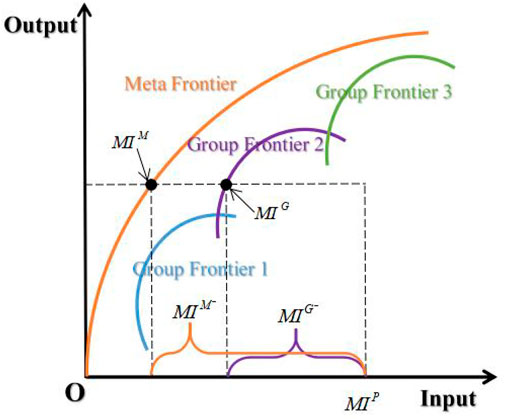
FIGURE 3. L Meta Frontier model considering group differences.
Thus, the productivity of the meta Frontier surface is expressed as Eq. 3.
Thus, the productivity of the group Frontier surface is expressed as Eq. 4.
According to Yang et al. (2015) the productivity values of meta Frontier and group Frontier can be measured by the following model. See Eqs 5,6.
Among them, the meta Frontier surface is denoted as the group Frontier surface is denoted as t means time,
Global-Malmquist-Luenberger Index
Oh (2010) constructed the GML index on the global production set with the total set of production technologies for all study periods as the reference set, which can more objectively and accurately reflect the changes in green TFP of dairy farming. Oh defines the global production technology set
The functional expression for the GML indicator of green TFP of dairy farming in the meta Frontier plane is as Eq. 8.
The functional expression for the GML indicator of green TFP of dairy farming in the group Frontier plane is as Eq. 9.
The GML index represents the change of green TFP of DMU from period t to t + 1. A GML index greater than 1 represents green TFP growth, less than 1 represents green TFP decline, and equal to 1 means green TFP remains unchanged.
According to Hoang and Coelli (2011)
When
Indicators and Samples
Index Selection
According to the characteristics and some previous studies (Madau et al., 2017; Han et al., 2020) of dairy farming, this paper selects four input indicators and two output indicators to construct the GML index system, as shown in Table 1.
(1) Concentrate feed is the main source of nutrition for dairy cows. The higher the quality of concentrate feed and the more reasonable the feeding ratio, the better the absorption rate of nutrients, the lower the carbon emission, and the higher the production capacity of cows, and this index is measured by the weight of concentrate feed.
(2) Roughage is the second most important source of nutrition for dairy cows and has a large impact on their productivity as well as their carbon footprint, which is measured by the cost of roughage.
(3) The amount of labor input is one of the important factors affecting the overall productivity of dairy farming, and this indicator is measured by the number of labor days invested, which includes the number of labor days invested by the farming subject’s own family and also the number of days invested by hired workers.
(4) Capital, as the main factor affecting the productivity of dairy farming, contains four costs of depreciation of fixed assets, repair and maintenance, tools and materials, and medical and epidemic prevention, which is the total amount of funds for the four costs.
(5) Milk, the main product produced by dairy farming, is a measure of the desired output.
(6) Carbon emissions are accounted for as a negative output indicator of dairy farming with
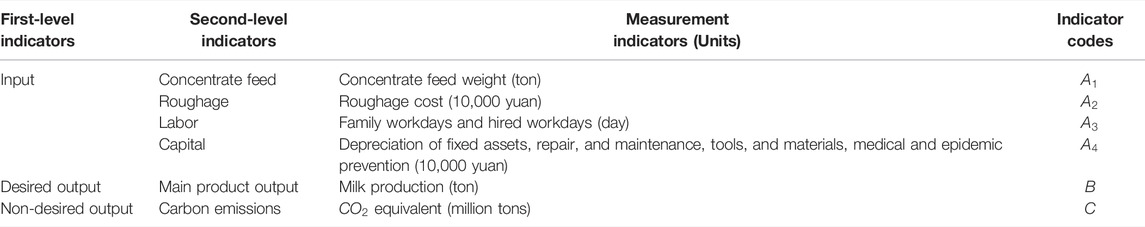
TABLE 1. GML indicator system.
Among them,
In this paper, after taking into account the conversion factors in the Agriculture Organization of the United Nations (FAO) database, the emissions of and are converted into equivalents using global warming potentials. (
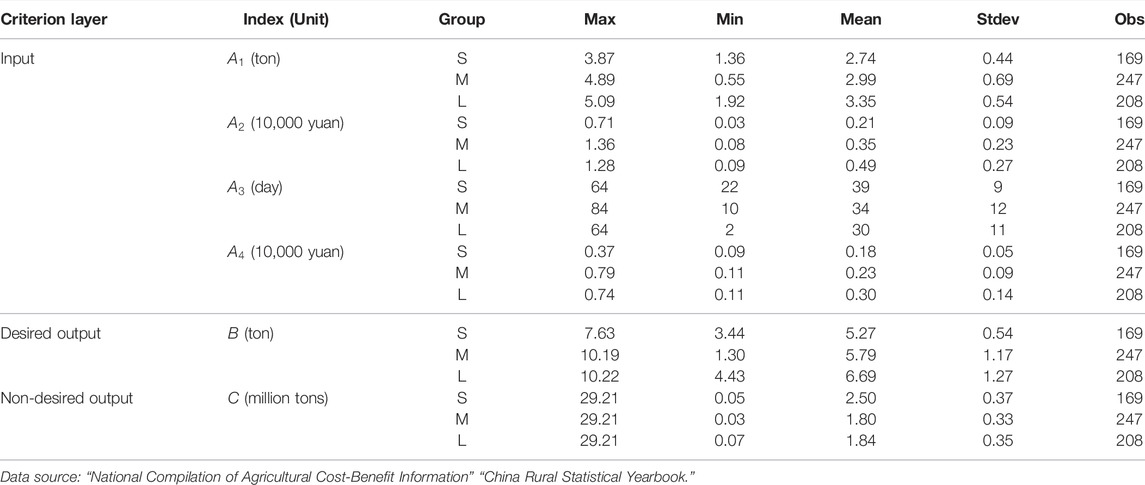
TABLE 2. Descriptive statistics of a variable.
According to the definition of scale in the “National Compilation of Agricultural Cost-Benefit Information”, this paper is divided into three farming scales: small scale (10 < Q ≤50), medium-scale (50 < Q ≤500), and large scale (≥500), Q is the number of cows raised.
Sample Selection
The data of Guizhou, Hainan, Jiangxi, and Tibet are missing in large quantities, so this paper excludes these four provinces from the sample selection and selects the remaining 27 provinces as samples for the study. The specific division is shown in Table 3.

TABLE 3. Descriptive statistics of a variable.
Results and Discussion
This paper specifically measures the GMLMI of three different scales (small, medium, and large) in China from 2007 to 2018, and based on this, analyzes the evolutionary trends and characteristics of the GMIMI.
Time-Varying Characteristics of GMLMI
Figure 4 shows the GMLMI and its decomposition indicators GMLEC and GMLTC of the small, medium, and large scale in the meta Frontier surface from 2007 to 2018. In the meta Frontier surface, China’s GMLMI showed a decreasing trend until 2010, when the minimum value of GMLMI was 0.93888. After 2010, it showed a fluctuating increasing trend, and the maximum value of GMLMI was 1.06756 in 2016.
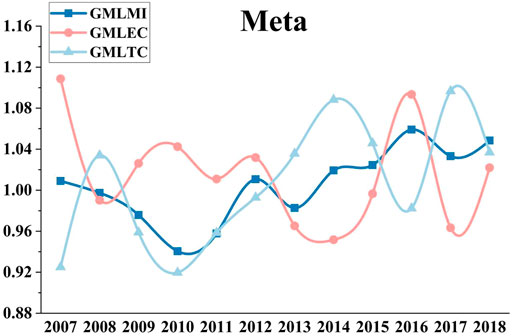
FIGURE 4. GMLMI and its decomposition index under meta Frontier surface from 2007 to 2018.
The “Melamine Event” in 2008 brought a serious impact on the development of China’s dairy industry, which affected urban and rural residents’ confidence in consuming domestic milk products, interrupting the rapid growth of China’s dairy consumption and limiting the development of China’s dairy farming industry. China’s dairy farming industry has been in the doldrums for the next 2 years and started to recover in 2011, but it has not yet recovered to the pre-event level. After the “Melamine Event,” the enthusiasm of small-scale dairy farmers was greatly dampened, and the model of medium-scale farming communities and large-scale farms was actively developed, and dairy farming in China developed to a new stage in terms of farming scale, yield, and quality level. The increase in scale is driven by both food safety events and a necessary stage in the development of the industry. The entry of large amounts of capital into the dairy farming industry has driven the increase in the level of scale in China’s dairy farming industry. From 2011 to 2018, the GMLMI showed an overall upward trend. It is worth noting that in 2013, the impact of factors such as dairy epidemics and increased slaughter due to rising beef prices forced the accelerated withdrawal of small-scale farmers, and in 2016, due to the full implementation of China’s “two-child policy,” the market capacity of milk products was increased, and the industrial pattern of the large and medium scale was again enhanced. In recent years, as the scale of China’s dairy farming industry has increased year by year, the amount of mechanized technology inputs has increased. The use of mechanized technology has not only reduced labor input and improved breeding efficiency but also reduced labor costs and reduced man-made pollution in the breeding process, which has played a role in promoting the development of dairy farming.
At present, China’s large-scale farm milking link has been mechanized, but in a large number of small and medium-sized farms, as well as other aspects of dairy farming, the level of mechanization still needs to be improved, the future of China’s dairy farming industry mechanization technology should be further enhanced in depth and breadth of use.
Figure 5 shows the GMLMI and its decomposition indicators GMLEC and GMLTC of the small, medium, and large scale in the group Frontier surface from 2007 to 2018. The group Frontier GMLMI has the same growth trend as the meta Frontier GMLMI. The GMLMI shows a decreasing trend until 2010 and a fluctuating growth trend after 2010. They have the same peak time but different peaks. In the group Frontier surface, the minimum value of GMLMI is 0.93221 (2010), but the maximum value is 1.07467 (2016).
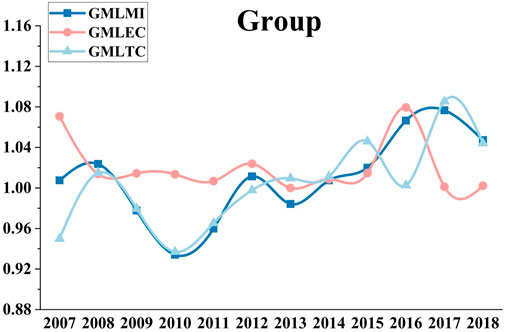
FIGURE 5. GMLMI and its decomposition index under group Frontier from 2007 to 2018.
The development and progress of China’s dairy farming industry are mainly due to a large number of inputs of production factors such as labor, land, and capital, but it is worth noting that China is relatively short of resources and the inputs of production materials such as expanding the scale of breeding, increasing investment, and purchasing machinery and equipment in the dairy farming process can lead to serious environmental pollution. How to balance the relationship between large-scale breeding and environmental protection has become one of the problems of China’s dairy farming industry and one of the key issues that restrict the development of dairy farming. The government and related departments should improve the construction of related facilities, introduce and train talents in related fields, and actively seek a green and sustainable development path for the dairy farming industry.
It should be noted that the meta Frontier surface was constructed concerning all dairy farming sizes and the group Frontier surface was constructed concerning different dairy farming sizes, so the overall 12-year average data for the two will differ. The GMLMI, GMLEC, and GMLTC of the meta Frontier (group Frontier) surface are 1.00704 (1.01046), 1.01840 (0.02302), and 1.00608 (1.00359), and it is obvious from the data that the GMLMI of the group Frontier surface is overestimated.
As shown in Figure 6, the trends of GMLMI changes in the meta Frontier and group Frontier are the same at the same scale. The average GMLMI at the meta Frontier (group Frontier) face is 0.9908 (1.0014), 1.0167 (1.0171), and 1.0093 (1.0063) for the three scales of the small, medium, and large, respectively. It is worth noting that the small-scale GMLMI values of the meta Frontier surface are less than 1, while the small-scale GMLMI values of the group Frontier surface are higher than 1. This fully illustrates the scientific nature and necessity of including scale heterogeneity in the analysis of GMLMI. The small-scale GMLMI fluctuates more, has the lowest overall level, and shows positive growth in a comprehensive 12-year view; the medium-scale GMLMI fluctuates the most, has the highest overall level, and shows positive growth in a comprehensive 12-year view; the large-scale GMLMI fluctuates more moderately, has the middle overall level, and does not show an obvious growth or decline trend in a comprehensive 12-year view.
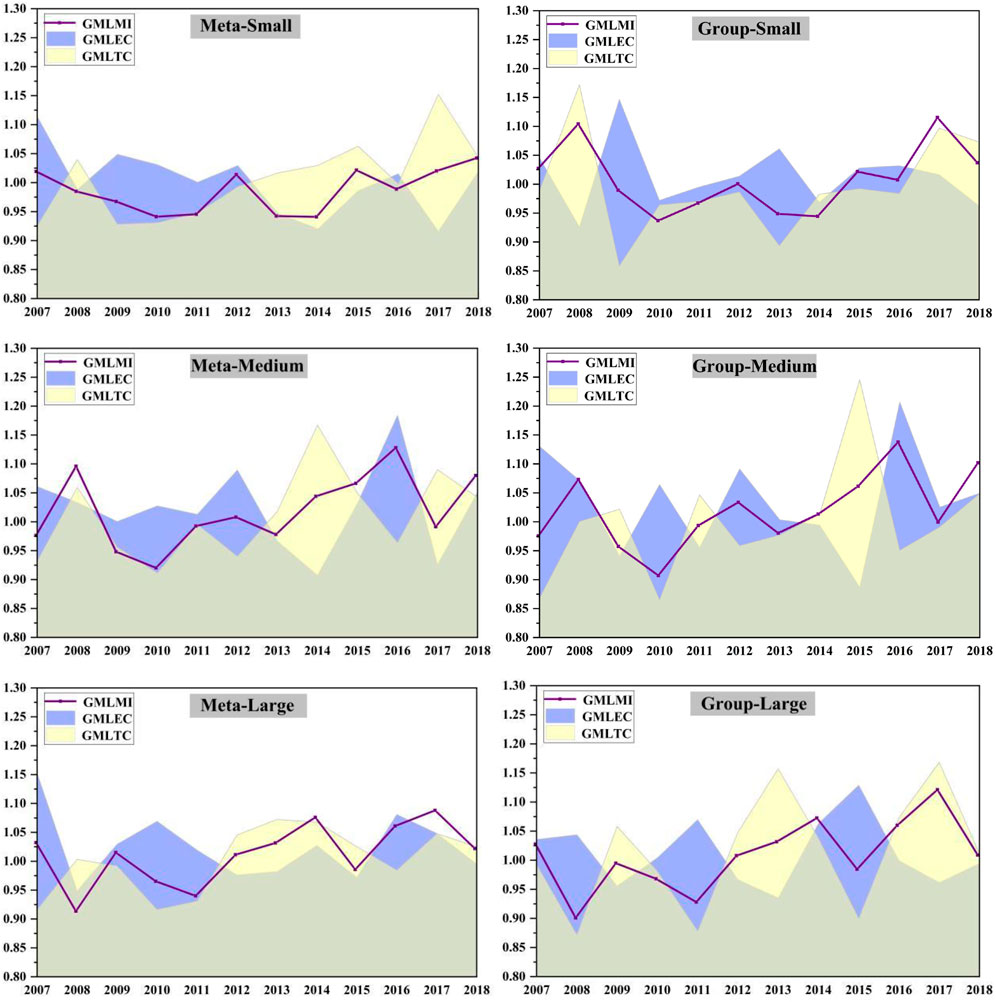
FIGURE 6. Three-sized GMLMI and its decomposition index from 2007 to 2018.
Different farming scales have different production efficiency under the influence of capital, policy, management, and other factors, and the differences in production material inputs, farming methods, and technology levels also make different farming scales show different development trends, and technical efficiency and factors affecting efficiency are the causal factors that lead to differences in developmental trajectories. In addition, there are also differences in the level of investment in environmental management and environmental protection among different farming scales. Large-scale farming is relatively stable because large-scale dairy farming is less constrained by resources and capital and has higher technical efficiency, management capacity, and manure elimination index, while small and medium-scale farming is more influenced by capital costs, equipment, labor, and expertise, resulting in large fluctuations. But not the larger the scale, the more advantageous the GMLMI growth, large-scale farming produces the highest total carbon emissions, so there are more stringent pollution abatement requirements for large-scale dairy farming, the larger the scale, subject to higher environmental constraints, the heavier the impact on development, so from the growth trend, large-scale dairy farming GMLMI has not shown a significant growth or decline trend, the growth rate has slowed down across the board.
It is worth mentioning that, in the context of internationalization, China’s milk imports continue to increase, the pressure of international competition for domestic milk products is increasing, small-scale dairy farming dairy production technology, production scale, and pr, productivity is relatively low, has gradually failed to meet the needs of dairy farming and dairy products consumption, the transition from small-scale dairy farming to medium and large-scale dairy farming has become an inevitable trend in the development of the dairy farming industry.
As shown in Figure 7, the technology fall-off rate (TGR) in the meta Frontier framework is expressed as the ratio of the efficiency value at the meta Frontier level to the efficiency value at the group Frontier level, which reflects the gap between the technological level of the group Frontier and the meta Frontier, i.e., the gap between the production efficiency at each scale and the potential optimal production efficiency. A larger TGR indicates that the actual production technology utilized is closer to the potential production technology level; a smaller TGR indicates that the actual production technology utilized is further away from the potential technology level. The TGR of the small, medium and large scale are 0.8688, 0.8899, and 0.9445 respectively, with the highest TGR of large scale, followed by medium-scale and finally small scale. This indicates that the large-scale production technology is most in line with the potential optimal production technology level and is the most suitable for the development trend of Chinese dairy farming.
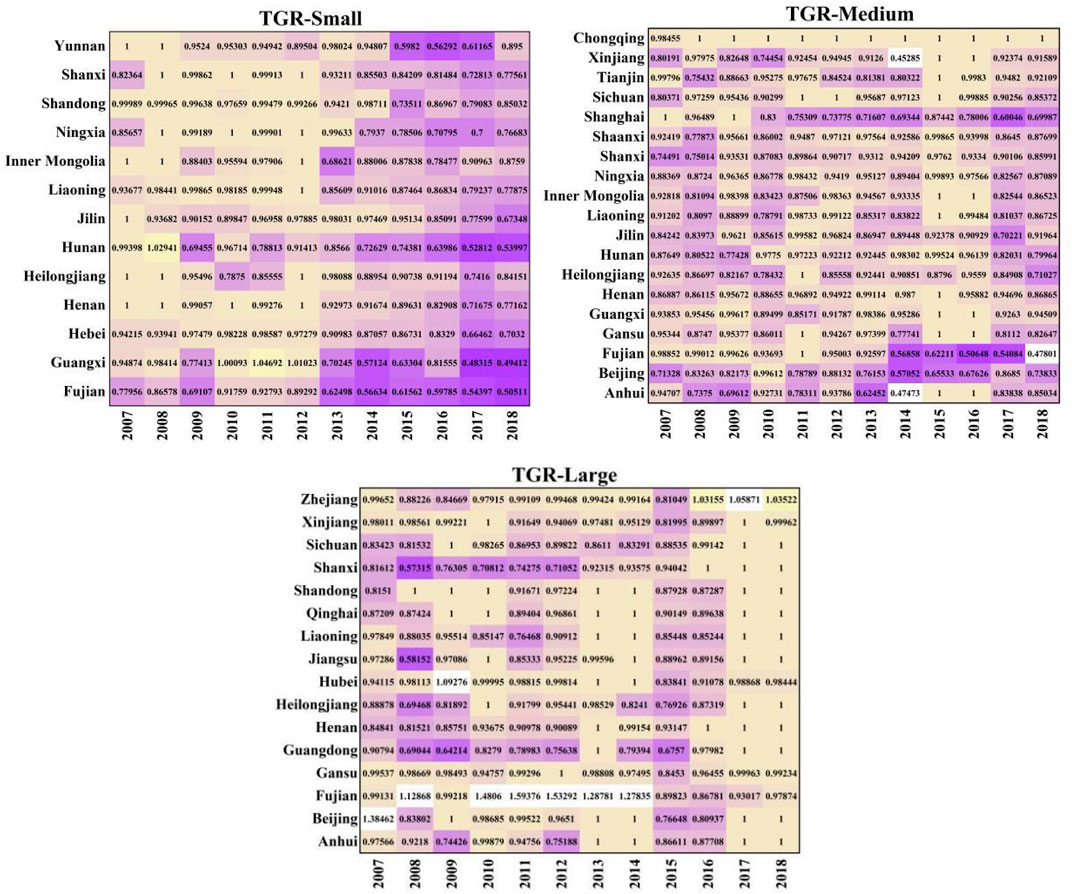
FIGURE 7. Three-sized TGR from 2007 to 2018.
The effective use and allocation of dairy farming production factors is always an important way to improve production efficiency, and the factor market can be reformed through the implementation of agricultural resource integration in rural areas to ensure adequate and efficient allocation of resources in dairy farming. Currently, the pollution generated by dairy farming has become the main source of pollution in rural areas of animal husbandry, and the disharmony between the development of the ecological environment and the development of dairy farming is becoming more and more prominent, so the environmental constraints must be considered in improving production efficiency. Large-scale farming has a higher level of pollution absorption than small and medium-scale farming because of the larger total amount of emissions. Large-scale waste utilization rate, pollutant consumption rate, water utilization rate are higher than small and medium-scale, accelerate the transformation of small-scale to medium and large-scale can not only improve the production efficiency of dairy farming but also reduce the damage to the environment.
Spatial Variation Characteristics of GMLMI
Figure 8 shows the combined GMLMI of small, medium, and large scales under the meta Frontier surface and the scale Frontier. Nationally, the GMLMI of the meta Frontier surface (0.73248) is lower than that of the group Frontier surface (0.73579). In terms of provinces, the GMLMI is relatively higher in the meta Frontier surface Hubei (1.15223), Guangxi (1.14320), Chongqing (1.08816), Yunnan (1.05222), and Zhejiang (1.04769), and the GMLMI in the group Frontier surface Hubei (1.15318), Guangxi (1.15182), Shanghai (1.06702), Chongqing (1.06152), Zhejiang (1.04881) GMLMI is relatively high, among the 27 provinces, Hubei, Guangxi, Chongqing and Zhejiang ranked within the top five of both Frontier surfaces.
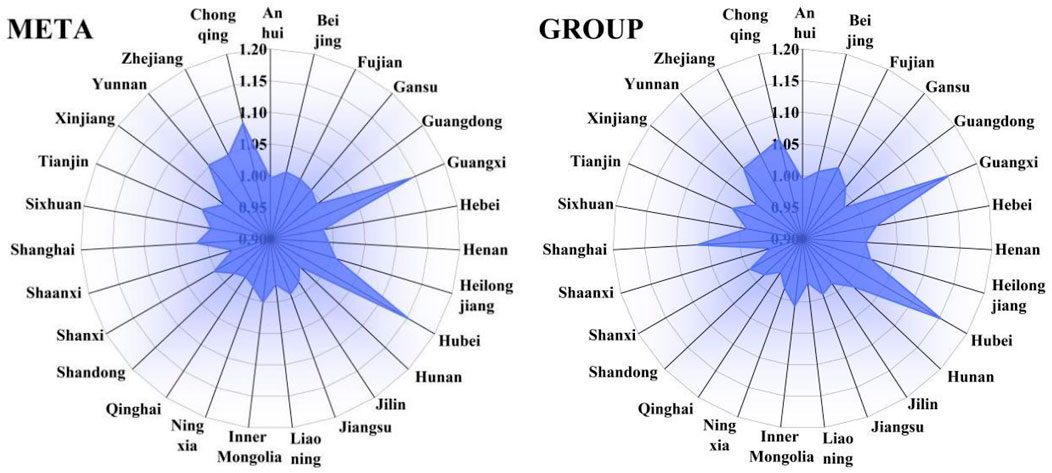
FIGURE 8. Average GMLMI in each province.
The significant disparity in the development of dairy farming among Chinese provinces has led to the overall low level of GMLMI, and different provinces have different situations in terms of regional industrial structure, the urbanization process, and environmental regulations, and these different situations have led to the varying development status of dairy farming in each province. Summarizing the farming advantages of the higher-ranked provinces, it can be found that these provinces have convenient transportation, sufficient resources, a high degree of herd breeding, high dairy cattle yields, and a leading level of modernization of dairy farming in the country. These provinces are well-equipped to manage carbon emissions and have more mature management measures, and the strict constraints on carbon emissions have achieved the coordinated development of energy-saving and emission reduction and production. The provinces that rank low are generally constrained by capital, technology, labor, and other factors. With the development of secondary and tertiary industries, rural areas have lost a large amount of labor force, a serious shortage of professional and technical personnel, and backward farming technology. Especially in the context of increased pressure on environmental protection, the efficiency of resource allocation of factors in dairy farming in most provinces has declined, there is a waste of resources, and the level of technical efficiency is low. Therefore, improving resource allocation efficiency and narrowing the pollution index gap between provinces in dairy farming is an important way to effectively improve the overall level of GMLMI nationwide.
Figure 9 shows the different sizes of dairy farming in different regions. The GMLMs of the central, eastern, and western regions of the meta Frontier are 1.00437, 0.99717, and 0.95440, and the GMLMI of the three regions of the group Frontier are 1.00699, 1.00131, and 0.94813. After comparison, the spatial GMLMI shows a decreasing trend in the middle, east, and west in order. The highest is in the central region, the eastern region, and the lowest in the western region.
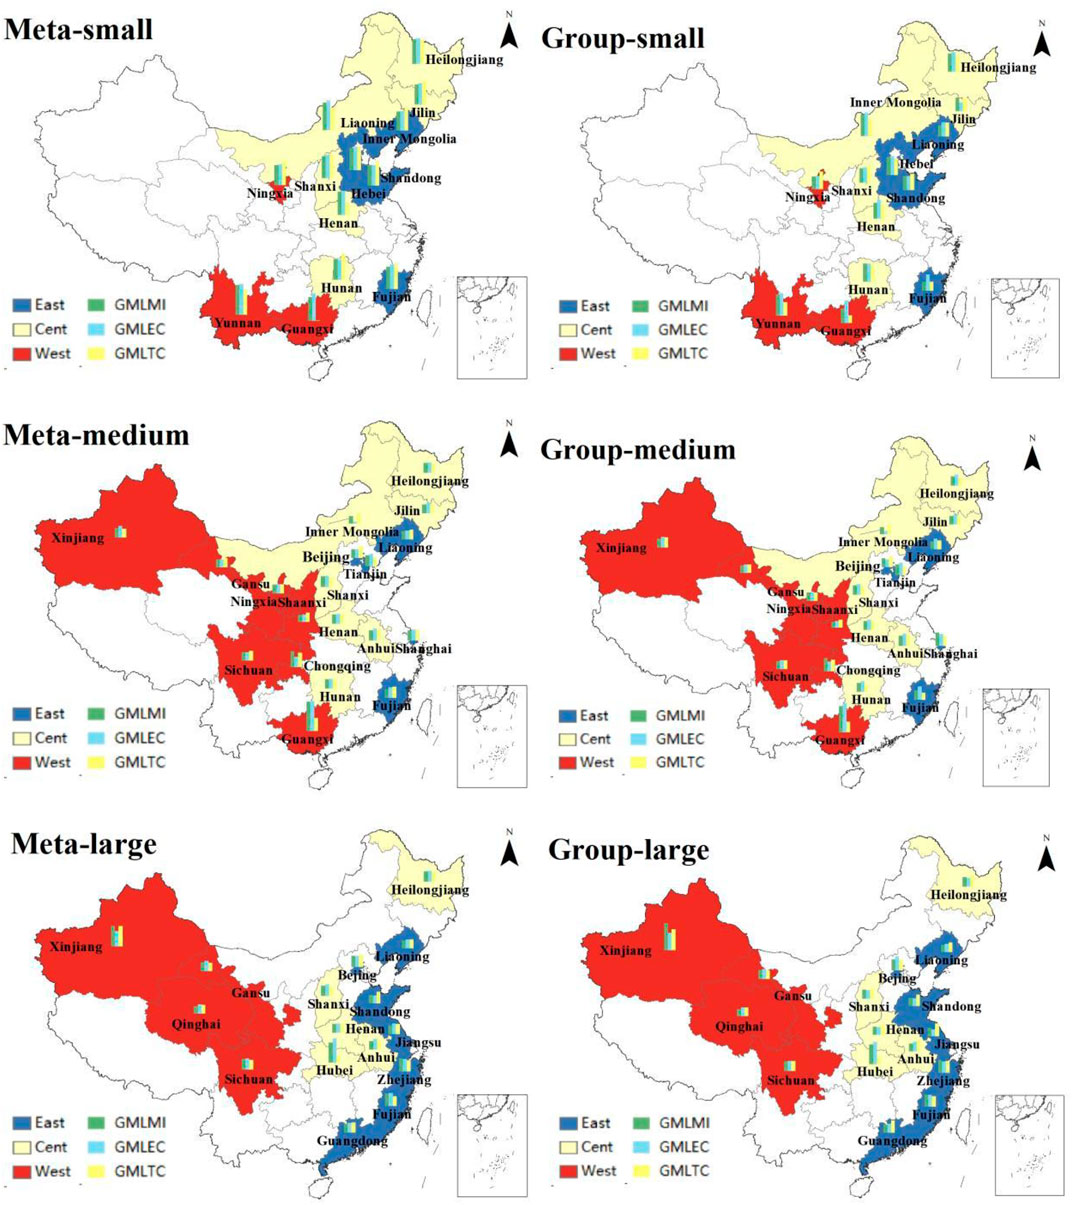
FIGURE 9. Three-sized average GMLMI and its decomposition index in different regions.
The most critical reason for these results is that the construction efforts in the western region are too small. From the corresponding supporting facilities for dairy farming to the mechanization penetration rate to the marketing channels, all these aspects need to be built and improved with greater efforts to improve the GMLMI of dairy farming. The east and the center are more coordinated in terms of production factors than the west. However, due to the national strategy to promote the rise of the Central Plains, the central region has slowly emerged a large number of excellent dairy enterprises, and technological progress is more ideal, promoting the development of the central region. Although the eastern region has superior resource endowment, due to the rapid development at the end of the twentieth century, the dairy farming industry has slowed down after entering the twenty-first century, and the technical efficiency has not performed well, so the performance of the eastern region is not as good as that of the central region. It is worth mentioning that the GMLMI of the three regions showed an increasing trend both in the meta Frontier plane and in the group Frontier plane, which indicates that the national dairy farming industry has good prospects for development.
In the meta Frontier three scales (small, medium and large) the average GMLMI was 0.99079, 0.96695, 1.00927, the average GMLEC was 1.00136, 0.97009, 1.02501 and the GMLTC was 0.98025, 0.96089, 1.00230. In the group Frontier three scales (small, medium and large) the average GMLMI was 0.99548, 0.96730, 1.00628, mean GMLEC was 1.01318, 0.98022, 0.99948, and mean GMLTC was 0.98631, 0.95049, 1.01491.
Whether in the meta Frontier plane or the group Frontier plane, the average GMLEC of small-scale is greater than 1, the average GMLTC is less than 1, showing a rise in efficiency and technical regression, indicating that the technical efficiency of the small-scale farming model has reached a high level under the current level of technology, with limited room for further improvement, and slow technological progress is the main reason that hinders the productivity of this farming model. The average GMLEC and GMLTC of the medium-scale farming model in both frontiers are less than 1, showing a double decline in technology and efficiency, indicating that there is a more optimistic potential productivity of this farming model, whether in the field of technology to make progress or in the field of efficiency to make progress in the production capacity have been significantly improved. The average GMLMI of large-scale under both frontiers is higher than that of small- and medium-scale, and the average GMLTC of both frontiers is greater than 1, and GMLEC is greater than 1 in the meta Frontier and less than 1 in the group Frontier, showing a decline in the efficiency of technological progress, indicating that the large-scale farming model has reached a higher level of technology, but the level of technical efficiency lags behind that of technological progress due to more stringent environmental regulations. How to reduce environmental pollution while improving technical efficiency is the problem that needs to be solved in this mode of farming under this level of technology. These circumstances fully demonstrate that large-scale farming has obvious advantages in optimizing the structure of factor inputs and outputs and that improving the level of organization and scale of the national dairy farming industry is the way to promote the development of modern agriculture.
Figure 10 shows the TGR of the three farming scales (small, medium, and large) in the three major regions of East, Central, and West. The average TGR of the three major regions, East, Central, and West, were 0.86023, 0.88655, and 0.84467 for small scale, 0.83494, 0.88899, and 0.92958 for medium scale and 0.96077, 0.91397, and 0.94812 for large scale.
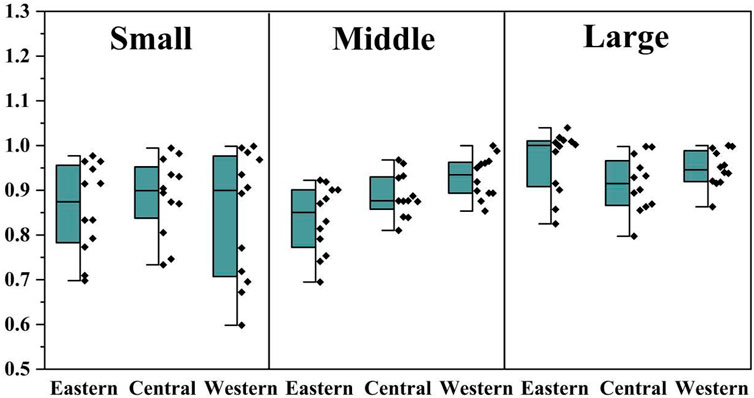
FIGURE 10. Three scales of TGR in three regions.
After comparison, it can be found that the mean TGR of the large-scale farming model is the highest in all three regions, indicating that the expansion of the farming scale is conducive to technological progress. The highest TGR (0.96077) for the large-scale breeding model in the eastern region indicates that the environmental breeding technology in the eastern region is more advanced and the dairy farming industry in this region can be closest to the potential low-carbon technology. Due to geographic and national policy factors, the eastern region, as the Frontier of China’s reform and opening up, is more conducive to receiving and introducing advanced technologies from home and abroad, and generally, advanced foreign technologies are introduced through the eastern region and then spread to the mainland. In general, advanced foreign technologies are introduced through the eastern region and then spread to the mainland. The eastern region is in the leading position in the country in terms of independent innovation capability and management mode. Due to geography, national policies, and other factors, the central and western regions have obvious technological disadvantages compared to the eastern regions of the eastern region, which can narrow the technological gap between regions through technology spillover and technology diffusion to achieve technological convergence and realize coordinated development between regions to promote the overall level of GMLMI.
Conclusion and Policy Recommendations
Based on the SSBM model, this paper constructs a GML index considering negative output and measures China’s GMLMI from 2007 to2018, and draws the following conclusions: 1) 2007–2018 China’s GMLMI in medium-scale is the highest, followed by large scale and small scale is the lowest. In terms of regional distribution, the overall GMLMI is highest in the central region, followed by the eastern region, and lowest in the western region. 2) China’s GMLMI shows positive growth overall from 2007 to 2018, and the analysis of decomposition indicators reveals that improving technology level can improve small-scale GMLMI, upgrading technology level and improving technical efficiency can both improve medium-scale GMLMI. And improving technical efficiency can improve large-scale GMLMI. 3) The results of the meta Frontier surface are different from those of the group Frontier surface. The GMLMI of the three scales (small, medium, and large) of the group Frontier surface are greater than 1, while only the GMLMI of the medium and large scales of the meta Frontier surface is greater than 1. The GMLMI of the group Frontier surface is overestimated. The TGR of the three scales (small, medium, and large) showed an increasing trend in order, and the TGR of large-scale dairy farming was the highest.
Based on the above findings, the following policy recommendations are made.
(1) Develop moderate-scale farming and promote the layout of advantageous areas. Large-scale farming is an important means to increase green total factor productivity, but not to blindly expand the scale of farming, the government or relevant departments should encourage the main body of farming to more advanced technology, energy-saving equipment is more adequate, manure management is more perfect as the standard to expand the scale of farming. In addition, the layout of areas with superior resource endowments should be reasonably adjusted to bring into play regional comparative advantages, combine their resource advantages and economic conditions, optimize the structure of factor inputs and outputs, take advantage of special resource conditions, strengthen the construction of factor resources, introduce and cultivate dairy breeds that are conducive to local farming areas, develop regionalized dairy development and support programs, and improve the productivity of the overall dairy farming industry nationwide.
(2) Improve scientific and technological training and promote differentiated production strategies. There are differences in the improvement of green all-factor production rates in the three scales (small, medium, and large). Improving the quality of services provided by science and technology extension personnel in dairy farming technology and strengthening farmers’ awareness of scientific and rational dairy farming are fundamental ways to enable the rational development of different scales of farming. On the one hand, we should promote scientific and technological innovation research and transformation of results to improve the contribution of science and technology in the development of the dairy industry; on the other hand, technical training and extension should be improved to enhance the efficiency of utilization of existing technologies, and both initiatives should go hand in hand to improve total factor productivity of raw milk. Implement differentiated technology promotion strategies according to the different needs of different farming scales for dairy farming technologies.
(3) Accelerate industrial science and technology innovation to improve the level of environmentally friendly breeding production. Technological progress has a significant role in promoting green total factor productivity in the dairy farming industry and is a source of power for its growth. The current level of technology in the national dairy farming industry as a whole is not ideal, and both the development of dairy farming and environmental protection cannot achieve dual progress. The government or relevant departments should be aware of the lack of low-carbon technology level in dairy farming, promote scientific and technological innovation research, improve technological innovation mechanisms, increase funding for technological innovation in low-carbon dairy farming, train and introduce talents in this field, and vigorously promote regulations for carbon emissions from dairy farming to curb carbon emissions from the dairy farming industry, thus improving green total factor productivity in the national dairy farming industry.
Data Availability Statement
Publicly available datasets were analyzed in this study.This data can be found here:The data underlying the results presented in the study are available from “National Agricultural Product Cost and Benefit Data Compilation” and “China Rural Statistical Yearbook.” https://data.cnki.net/yearbook/Single/N2019120280.https://data.cnki.net/yearbook/Single/N2021120010.
Author Contributions
Conceptualization, methodology, software: HW and SZ; Data curation, writing—original draft preparation: HL and JL; writing—reviewing, supervision: HL and JL.
Funding
This study was funded by the Heilongjiang Philosophy and Social Sciences Project (20GLD235, 21JYE396, 21JLE321).
Conflict of Interest
The authors declare that the research was conducted in the absence of any commercial or financial relationships that could be construed as a potential conflict of interest.
Publisher’s Note
All claims expressed in this article are solely those of the authors and do not necessarily represent those of their affiliated organizations, or those of the publisher, the editors and the reviewers. Any product that may be evaluated in this article, or claim that may be made by its manufacturer, is not guaranteed or endorsed by the publisher.
References
Abbas, S., Kousar, S., and Pervaiz, A. (2021). Effects of Energy Consumption and Ecological Footprint on CO2 Emissions: an Empirical Evidence from Pakistan. Environ. Dev. Sustain 23 (9), 13364–13381. doi:10.1007/s10668-020-01216-9
Adenuga, A. H., Davis, J., Hutchinson, G., Donnellan, T., and Patton, M. (2019). Environmental Efficiency and Pollution Costs of Nitrogen Surplus in Dairy Farms: a Parametric Hyperbolic Technology Distance Function Approach. Environ. Resour. Econ. 74 (3), 1273–1298. doi:10.1007/s10640-019-00367-2
Adesogan, A. T., and Dahl, G. E. (2020). MILK Symposium Introduction: Dairy Production in Developing Countries. J. dairy Sci. 103 (11), 9677–9680. doi:10.3168/jds.2020-18313
Aigner, D., Lovell, C. A. K., and Schmidt, P. (1977). Formulation and Estimation of Stochastic Frontier Production Function Models. J. Econ. 6 (1), 21–37. doi:10.1016/0304-4076(77)90052-5
Alem, H. (2021). The Role of Technical Efficiency Achieving Sustainable Development: A Dynamic Analysis of Norwegian Dairy Farms. Sustainability 13 (4), 1841. doi:10.3390/su13041841
Andersen, P., and Petersen, N. C. (1993). A Procedure for Ranking Efficient Units in Data Envelopment Analysis. Manag. Sci. 39 (10), 1261–1264. doi:10.1287/mnsc.39.10.1261
Armagan, G., and Nizam, S. (2012). Productivity and Efficiency Scores of Dairy Farms: the Case of Turkey. Qual. Quant. 46 (1), 351–358. doi:10.1007/s11135-010-9360-6
Battese, G. E., and Coelli, T. J. (1995). A Model for Technical Inefficiency Effects in a Stochastic Frontier Production Function for Panel Data. Empir. Econ. 20 (2), 325–332. doi:10.1007/BF01205442
Brito, A. F., and Silva, L. H. P. (2020). Symposium Review: Comparisons of Feed and Milk Nitrogen Efficiency and Carbon Emissions in Organic versus Conventional Dairy Production Systems. J. Dairy Sci. 103 (6), 5726–5739. doi:10.3168/jds.2019-17232
Brito, L. F., Bédère, N., Douhard, F., Oliveira, H. R., Arnal, M., Peñagaricano, F., et al. (2021). Review: Genetic Selection of High-Yielding Dairy Cattle toward Sustainable Farming Systems in a Rapidly Changing World. animal 15, 100292. doi:10.1016/j.animal.2021.100292
Čechura, L., Grau, A., Hackmann, H., and Kroupova, Z. Z. (2014). “Total Factor Productivity in European Agricultural Production,” in International Comparison of Product Supply Chains in the Agri-Food Sector: Determinants of Their Competitiveness and Performance on EU and International Markets (European Union. IAMO). doi:10.13140/RG.2.1.3856.9367
Charles, A., Cooper, W. W., and Rhodes, E. (1978). Measuring the Efficiency of Decision-Making Units. Eur. J. operational Res. 2 (6), 429–444. doi:10.1016/0377-2217(78)90138-8
Chung, Y. H., Färe, R., and Grosskopf, S. (1997). Productivity and Undesirable Outputs: a Directional Distance Function Approach. J. Environ. Manag. 51 (3), 229–240. doi:10.1006/jema.1997.0146
Coelli, T. J., and Rao, D. S. P. (2005). Total Factor Productivity Growth in Agriculture: a Malmquist Index Analysis of 93 Countries, 1980–2000. Agric. Econ. 32, 115–134. doi:10.1111/j.0169-5150.2004.00018.x
Conradie, B., Pieces, J., and Thirtle, C. (2009). District‐level Total Factor Productivity in Agriculture: Western Cape Province, South Africa, 1952–2002. Agric. Econ. 40 (3), 265–280. doi:10.1111/j.1574-0862.2009.00381.x
de Almeida, A. M., Alvarenga, P., and Fangueiro, D. (2021). The Dairy Sector in the Azores Islands: Possibilities and Main Constraints towards Increased Added Value. Trop. Animal Health Prod. 53 (1), 1–9. doi:10.1007/s11250-020-02442-z
Denison, E. F. (1967). Why Growth Rates Differ Postwar Experience in Nine Western Countries. United States: Brookings Institution. doi:10.2307/2551816
Espinoza-Ortega, A., Espinosa-Ayala, E., Bastida-Lopez, J., and Castañeda-Martínez, T. (2007). Small-scale Dairy Farming in the Highlands of Central Mexico: Technical, Economic, and Social Aspects and Their Impact on Poverty. Exp. Agric. 43 (2), 241–256. doi:10.1017/S0014479706004613
Färe, R., Grifell‐Tatjé, E., Grosskopf, S., and Knox Lovell, C. A. (1997). Biased Technical Change and the Malmquist Productivity Index. Scand. J. Econ. 99 (1), 119–127. doi:10.1111/1467-9442.00051
Färe, R., Grosskopf, S., Lindgren, B., and Roos, P. (1992). Productivity Changes in Swedish Pharmacies 1980–1989: A Non-parametric Malmquist Approach. J. Prod. Analysis 3 (1), 85–101. doi:10.1007/BF00158770
Färe, R., Grosskopf, S., Norris, M., and Zhang, Z. (1994). Productivity Growth, Technical Progress, and Efficiency Change in Industrialized Countries. Am. Econ. Rev. 84, 66–83. https://www.jstor.org/stable/2117971.
Farrell, M. J. (1957). The Measurement of Productive Efficiency. J. R. Stat. Soc. Ser. A General. 120 (3), 253–281. doi:10.2307/2343100
Forney, J., Rosin, C., and Campbell, H. (2018). “Introduction: Agri-Environmental Governance as Assemblage[M],” in Agri-environmental Governance as an Assemblage: Multiplicity, Power, and Transformation (Routledge: Taylor & Francis), 1–32. doi:10.1016/j.jrurstud.2014.10.006
Galloway, C., Conradie, B., Prozesky, H., and Eslera, E. (2018). Are Private and Social Goals Aligned in Pasture-Based Dairy Production? J. Clean. Prod. 175, 402–408. doi:10.1016/j.jclepro.2017.12.036
Gavrilova, O. Y., and Fedorova, M. A. (2020). Innovative and Investment Activity as the Basis for the Formation of Production Potential and Sustainable Development of Dairy Cattle Breeding. IOP Conf. Ser. Earth Environ. Sci. 548 (2), 022025. doi:10.1088/1755-1315/548/2/022025
Han, Z., Han, C., and Yang, C. (2020). Spatial Econometric Analysis of Environmental Total Factor Productivity of Ranimal Husbandry and its Influencing Factors in China during 2001–2017. Sci. Total Environ. 723, 137726. doi:10.1016/j.scitotenv.2020.137726
Handford, C. E., Campbell, K., and Elliott, C. T. (2016). Impacts of Milk Fraud on Food Safety and Nutrition with Special Emphasis on Developing Countries. Compr. Rev. Food Sci. Food Saf. 15 (1), 130–142. doi:10.1111/1541-4337.12181
Headey, D., Alauddin, M., and Rao, D. S. P. (2010). Explaining Agricultural Productivity Growth: an International Perspective. Agric. Econ. 41 (1), 1–14. doi:10.1111/j.1574-0862.2009.00420.x
Hicks, J. R. (1961). “The Measurement of Capital about the Measurement of Other Economic Aggregates,” in The Theory of Capital (London: Palgrave Macmillan), 18–31. doi:10.1007/978-1-349-08452-4_2
Hoang, V. N., and Coelli, T. (2011). Measurement of Agricultural Total Factor Productivity Growth Incorporating Environmental Factors: a Nutrients Balance Approach. J. Environ. Econ. Manag. 62 (3), 462–474. doi:10.1016/j.jeem.2011.05.009
Jorgenson, D. W., and Griliches, Z. (1967). The Explanation of Productivity Change. Rev. Econ. Stud. 34 (3), 249–283. doi:10.2307/2296675
Karaj, A., and Deci, E. (2017). “World Milk Production and Socio-Economic Factors Affecting its Consumption,” in Dairy in Human Health and Disease across the Lifespan (Academic Press), 107–115. doi:10.1016/B978-0-12-809868-4.00007-8
Lima, M. G. B., Persson, U. M., and Meyfroidt, P. (2019). Leakage and Boosting Effects in Environmental Governance: a Framework for Analysis. Environ. Res. Lett. 14 (10), 105006. doi:10.1088/1748-9326/ab4551
MacDonald, J. M., O'Donoghue, E., McBride, W. D., Nehring, R., Sandretto, C., and Mosheim, R. (2007). Profits, Costs, and the Changing Structure of Dairy Farming. United States: USDA-ERS Economic Research Report. doi:10.2139/ssrn.108445847
Madau, F. A., Furedi, R., and Pulina, P. (2017). Technical Efficiency and Total Factor Productivity Changes in European Dairy Farm Sectors. Agric. Food Econ. 5 (1), 1–14. doi:10.1186/s40100-017-0085-x
Meeusen, W., and van Den Broeck, J. (1977). Efficiency Estimation from Cobb-Douglas Production Functions with Composed Error. Int. Econ. Rev. 18, 435–444. doi:10.2307/2525757
Moorsteen, R. H. (1961). On Measuring Productive Potential and Relative Efficiency. Q. J. Econ. 75 (3), 451–467. doi:10.2307/1885133
Moreira, V. H., and Bravo-Ureta, B. E. (2016). Total Factor Productivity Change in Dairy Farming: Empirical Evidence from Southern Chile. J. dairy Sci. 99 (10), 8356–8364. doi:10.3168/jds.2016-11055
Mosheim, R., and Lovell, C. A. K. (2009). Scale Economies and Inefficiency of US Dairy Farms. Am. J. Agric. Econ. 91 (3), 777–794. doi:10.1111/j.1467-8276.2009.01269.x
Ningbo, A., and Larue, B. (2016). Scale Economies, Technical Efficiency, and the Sources of Total Factor Productivity Growth of Quebec Dairy Farms. Can. J. Agric. Economics/Revue Can. d’agroeconomie 64 (2), 339–363. doi:10.1111/cjag.12077
Oh, D. (2010). A Global Malmquist-Luenberger Productivity Index. J. Prod. analysis 34 (3), 183–197. doi:10.1007/s11123-010-0178-y
Ohlen, R. (2013). Efficiency and Total Factor Productivity Growth in the Indian Dairy Sector. Quarterly. J. Int. Agric. 52. doi:10.1007/s10854-012-0857-8
Olagunju, K. O., Sherry, E., Samuel, A., and Caskie, P. (2022). Unpacking Total Factor Productivity on Dairy Farms Using Empirical Evidence. Agriculture 12 (2), 225. doi:10.3390/agriculture12020225
Omar, M. A. E. (2020). Technical Efficiency and Total Factor Productivity Analysis of Dairy Cow Breeds in Egyptian Governorates. Zagazig Veterinary J. 48 (3), 296–305. doi:10.21608/zvjz.2020.21599.1093
Pata, U. K. (2021). Linking Renewable Energy, Globalization, Agriculture, CO2 Emissions and Ecological Footprint in BRIC Countries: A Sustainability Perspective. Renew. Energy 173, 197–208. doi:10.1016/j.renene.2021.03.125
Priyanka, A., and Soedjana, T. D. (2015). Indonesian Dairy Industry Perspective within the ASEAN Economic Community. WARTAZOA. Indonesian Bull. Animal Veterinary Sci. 25 (4), 159–170. doi:10.14334/wartazoa.v25i4.1226
Rada, N., Helfand, S., and Magalhães, M. (2019). Agricultural Productivity Growth in Brazil: Large and Small Farms Excel. Food policy 84, 176–185. doi:10.1016/j.foodpol.2018.03.014
Rae, A. N., Ma, H., Huang, J., and Rozelle, S. (2006). Livestock in China: Commodity‐specific Total Factor Productivity Decomposition Using New Panel Data. Am. J. Agric. Econ. 88 (3), 680–695. doi:10.1111/j.1467-8276.2006.00888.x
Rehman, A., Ullah, I., Afridi, F. A., Ullah, Z., Zeeshan, M., Hussain, A., et al. (2021). Adoption of Green Banking Practices and Environmental Performance in Pakistan: A Demonstration of Structural Equation Modelling. Environ. Dev. Sustain. 23 (9), 13200–13220. doi:10.1007/s10668-020-01206-x
Rotz, C. A. (2018). Modeling Greenhouse Gas Emissions from Dairy Farms. J. dairy Sci. 101 (7), 6675–6690. doi:10.3168/jds.2017-13272
Ruttan, V. W., Binswanger, H. P., and Hayami, Y. (1980). Induced Innovation in Agriculture. Economic Growth and Resources. London: Palgrave Macmillan, 162–189. doi:10.3168/jds.2017-1327210.1007/978-1-349-16328-1_11
Schiano, M. C., Maine, M. A., and Panigatti, M. C. (2017). Dairy Farm Wastewater Treatment Using Horizontal Subsurface Flow Wetlands with Typha Domingensis and Different Substrates. Environ. Technol. 38 (2), 192–198. doi:10.1080/09593330.2016.1231228
Sefeedpari, P., Vellinga, T., Rafiee, S., Sharifi, M., Shine, P., Pishgar-Komleh, S. H., et al. (2019). Technical, Environmental and Cost-Benefit Assessment of Manure Management Chain: A Case Study of Large-Scale Dairy Farming. J. Clean. Prod. 233, 857–868. doi:10.1016/j.jclepro.2019.06.146
Solow, R. M. (1957). Technical Change and the Aggregate Production Function. JSTOR. The MIT Press, 39, 312–320. The review of Economics and Statistics. doi:10.2307/1926047
Toda, M., Motoki, J., and Uchida, Y. (2020). Nitrogen Balance and Use Efficiency on Dairy Farms in Japan: a Comparison Among Farms at Different Scales. Environ. Res. Commun. 2 (12), 125001. doi:10.1088/2515-7620/abce4a
Tone, K. (2001). A Slacks-Based Measure of Efficiency in Data Envelopment Analysis. Eur. J. operational Res. 130 (3), 498–509. doi:10.1016/S0377-2217(99)00407-5
Tone, K. (2002). A Slacks-Based Measure of Super-efficiency in Data Envelopment Analysis. Eur. J. Operational Res. 143, 32–41. doi:10.1016/j.ejor.2009.12.00710.1016/s0377-2217(01)00324-1
Tone, K., and Sahoo, B. K. (2003). Scale, Indivisibilities and Production Function in Data Envelopment Analysis. Int. J. Prod. Econ. 84 (2), 165–192. doi:10.1016/S0925-5273(02)00412-7
Yang, L., Ouyang, H., Fang, K., and Zhang, J. (2015). Evaluation of Regional Environmental Efficiencies in China Based on Super-efficiency-DEA. Ecol. Indic. 51, 13–19. doi:10.1016/j.ecolind.2014.08.040
Zhu, L., and Oude Lansink, A. (2022). Dynamic Sustainable Productivity Growth of Dutch Dairy Farming. PloS one 17 (2), e0264410. doi:10.1371/journal.pone.0264410
Keywords: scale differences, dairy farming, super-efficient SBM-GML model, carbon emissions, green total factor productivity
Citation: Wen H, Li H, Li J and Zhong S (2022) Green Total Factor Productivity of Dairy Farming in China: Based on the Perspective of Scale Heterogeneity. Front. Environ. Sci. 10:961178. doi: 10.3389/fenvs.2022.961178
Received: 04 June 2022; Accepted: 21 June 2022;
Published: 22 July 2022.
Edited by:
Irfan Ullah, Nanjing University of Information Science and Technology, ChinaReviewed by:
Kaiyang Zhong, Southwestern University of Finance and Economics, ChinaMuhammad Zeeshan, Liaoning Technical University, China
Copyright © 2022 Wen, Li, Li and Zhong. This is an open-access article distributed under the terms of the Creative Commons Attribution License (CC BY). The use, distribution or reproduction in other forums is permitted, provided the original author(s) and the copyright owner(s) are credited and that the original publication in this journal is cited, in accordance with accepted academic practice. No use, distribution or reproduction is permitted which does not comply with these terms.
*Correspondence: Shen Zhong, MTAyNzE0QGhyYmN1LmVkdS5jbg==