 Debin Yang1
 Yan-Kai Fu
 Ting Zhu
- 1College of Economics and Management, Jiangsu Maritime Institute, Nanjing, China
- 2Department of Aviation Services and Management, China University of Science and Technology, Hsinchu, Taiwan
- 3School of Finance and Trade, Wenzhou Business College, Wenzhou, China
The amount of investment in marine environmental governance (MEG) is growing fast in China, which brought the prosperity of environmental treatment entities (e.g., water treatment enterprises and port pollution control institutions). Based on spatial big data, this paper adopted kernel density method, standard deviational ellipse, and nearest neighbor index to explore the spatial distribution pattern of MEG entities in Shanghai from 2005 to 2021. Several conclusions emerged from this study: (1) From 2005 to 2021, the new MEG entities in Shanghai have increased by more than 10 times; (2) The analysis showed that the nearest neighbor index of Shanghai’s MEG entities was larger than 0.2, with Z values all being lower than −30, indicating that the spatial agglomeration characteristics in Shanghai was significant at an alpha level of 1%. (3) Chongming District, Pudong New District, Fengxian District, and Minhang District were the core agglomeration areas. (4) The standard deviational ellipse analysis suggested that the distribution of Shanghai MEG entities from 2005 to 2021 showed an obvious pattern of spreading from the center to both the north and south. This results in an industrial belt along the Huangpu River. This paper argues that the spatial distribution of MEG entities in Shanghai confirms the central place theory, which highlights the network characteristics that combine centrality with spreading to the surrounding areas.
Introduction
The ocean plays an important role in the survival and development of human beings. For instance, 75% of the large cities in the world and 70% of the industrial capital and population are concentrated in coastal zones within a distance of 100 km away from the coastline (McGranahan et al., 2007). In addition, humans are increasingly engaged in activities related to exploring the ocean. However, the weak awareness of the importance of marine ecological environmental protection, the continuously increasing demand for marine resources, and the extensive way of developing marine economy have caused great damage to the marine ecosystem, resulting in a decline in the restoring ability of the marine ecosystem and a serious threat to marine ecological security (Curtin and Prellezo, 2010). These marine issues need to be addressed urgently. However, there are also serious challenges in ocean governance. Problems such as weak governance, lag in action, and limited governance have emerged in the governance process (Walters, 1997; Boesch, 2019). In recent years, as guided by the Maritime Power Strategy and Rules for the Implementation of the Law on the Prevention and Control of Marine Pollution, China has vigorously stived to develop a green and sustainable marine economy, while enhancing the governance of the marine ecological environment (Hsu, 2018; Ren et al., 2018; Shao, 2020). Since 2005, coastal provinces in China have increased the total investment in environmental pollution control and energy transition from less than 100 billion yuan to nearly 500 billion yuan (Li et al., 2019; Zhang et al., 2022). The investment in marine environmental control is still growing. Such investment brought prosperity to the marine environment treatment industry in coastal cities, with a significant increase in the number of industrial and commercial registrations of various water environment treatment and port pollution control companies and organizations (Liu et al., 2018; Li et al., 2020; Bai et al., 2021a). The spatial distribution of the industry has always been a hot research topic in the fields of regional economics and economic geography. Industries never show a random or scattered way of spatial distribution, but that they follow a certain and meaningful pattern (Rosés and Wolf, 2018). Previous research about the distribution of the marine environmental governance (MEG) industry mainly focuses on the macro causal relations, distribution and combination of marine industry sectors in a certain region, from economic perspectives (Khan et al., 2020; Teng et al., 2021). A comprehensive understanding of the spatial distribution and evolution of the MEG industry is the key to promoting the development of a green and sustainable marine economy. Thus, it has important contributions to the decision-making regarding the coordinated development of the land and sea to promote high-quality economic development.
Previous research has made in-depth studies and discussions about the spatial distribution of industries in developed countries. For example, Gervais and Jensen, (2019) believed that almost all manufacturing industries in the United States have shown certain degrees of agglomeration in geographical distribution. Within a given space, a more detailed industry classification leads to a higher degree of spatial agglomeration of industries. For the same industry, a larger space leads to a higher degree of agglomeration. González-Val, (2019) used the location Gini coefficient to study the spatial distribution of 6 different types of environmental governance industries in Miami and found that the pollution control industries related to ports tended to show a pattern of spatial agglomeration, whereas other pollution industries such as marine ecological environment tended to be scattered in spatial distribution. Platjouw (2018) applied principal component analysis to evaluate the annual comprehensive strength of marine economic development and analyzed the evolution of the MEG industry and the differences in the regional spatial structure of the marine economy in Norway. Some other scholars are more dependent on environmental economic methods for discussion (Chou, et al., 2020; Bai et al., 2021b; Zakari et al., 2021; Cao et al., 2022; Dagar et al., 2022). These studies were largely based on rich data. However, limited by the availability of large data, Chinese researchers tended to focus on the overall layout of the industry. For instance, Mou et al. (2018) explored the development of distributions of the marine industry as well as the factors affecting the distribution; Wang et al. (2020) focused on the internal attributes and suggested effective strategies to optimize the distributions of emerging marine industries. Such qualitative research emphasizes the deepening and deduction of the existing economic basic theory. Compared with theoretical research, there are more empirical studies based on yearbook data about different regions. For example, Ding et al. (2020) proposed that distributions of the marine industry follow a pattern of three points and two axes; Su and Yang, (2018) used the NRCA model to analyze the distribution of the marine industry in the Bohai Rim region. In addition, important achievements were made in research about measuring the spatial agglomeration of the marine industry and identifying the leading marine industries, taking provinces as a unit. These studies were mainly related to coastal provinces such as Liaoning, Shandong, and Zhejiang. Abundant studies have provided policy-making suggestions for the overarching planning of marine industry from both a national level and a provincial level. With the development of research about the overarching planning of the national marine industry, researchers have begun to focus on mesoscopic and microscopic levels. For instance, Ren (2021) introduced a dynamic mechanism for the optimization of the spatial distribution of the marine high-tech industry; Bailey et al. (2019) evaluated the rationality of the spatial distribution of marine fisheries and came up with the standard index for the optimization of the spatial distribution of marine aquaculture from the perspective of space. In addition, Tian et al. (2020) also assessed the rationality of the spatial distribution of blue pastures proposed in recent years based on environmental protection and ecological theories. These studies all adopted a more timely way of acquiring data. As an example, Mao et al. (2020) was based on monthly coastal carbon emission grid data. In recent years, with the availability of spatial big data, a rich body of studies have used spatial methods to examine the spatial influence and industrial distribution pattern. Among them, the most prominent is the application of POI data. For example, Chen et al. (2021) used the green space POI data to investigate the accessibility of park sports and the green accessibility rate of Shanghai residents. The present study followed this idea of employing empirical data. Data were obtained from an official real-time industrial and commercial data platform in China (gsxt.gov.cn), which records the main business of various enterprises, organizations, and public institutions. Types of properties and business activities. These data largely enable us to locate the spatial locations of the MEG entities of interest. In general, previous studies on the green and sustainable development of the marine economy have employed real-time data from different perspectives, whereas only a few studies have used spatial big data and highly reliable data from official platforms. Therefore, this paper aims to narrow this research gap. We focused on Shanghai, an international port city in China, and applied spatial pattern statistical methods to comprehensively explore the spatial distributive characteristics and developmental trends of MEG entities (including enterprises, organizations, and public utilities). Observation methods were also used to analyze the factors affecting the development of the marine economy in Shanghai. By analyzing the distributive pattern, this paper aims to understand the development of the marine governance industry in Shanghai and provide suggestions for the decision-making of optimizing the future marine governance layout. The spatial statistical methods used in this paper are introduced in the Methodology section. Results of these statistical analyses are presented in the Results section.
Methods
Standard Deviational Ellipse
This article takes Shanghai as the research object because Shanghai has implemented a series of urban greening constructions since the 1980s. According to the 2020 Shanghai Municipal Statistical Yearbook, the current green area of Shanghai is 157,800 hm2. By specifying parks with fitness facilities, there are 352 with an area of 21,400 hm2. The green coverage rate of the built city is 39.7%, and the per capita GSS area reaches 13 m2. Two types of data are mainly used in this research. The first type is spatial data, including Shanghai administrative boundary, regional parks, and GSS data, regional road traffic network data, regional residential area data, etc. All spatial data acquisition follows scientific and systematic methods, making full use of official portals such as Shanghai Urban Planning and Natural Resources Bureau, Shanghai Municipal People’s Government, and electronic maps such as Gaode map. A unified spatial coordinate system is used to calibrate the data to ensure that all data are compatible. The spatial point data of all green parks in Shanghai and the descriptive text of relevant parks were crawled at the same time, and we screened out the parks with fitness facilities in the description by searching. Finally, 607 GSSs were found in Shanghai. In order to help analysis, the government statistical data also used, which mainly comes from the Shanghai Statistical Yearbook released by the Shanghai Municipal Bureau of Statistics in November 2020.
The standard deviational ellipse method (SDE) is suitable for understanding the development of spatial distribution of ocean governance entities. SDE can describe the spatial distribution characteristics of geographic elements from multiple perspectives such as the center, long axis, short axis, and azimuth. This method has become a popular statistical tool in the ArcGIS Spatial Statistics module and has been used in several studies. For instance, Han et al. (2021) studied changes in the energy industry and proved this method is effective in realizing the visualization of spatial orientation. Therefore, this paper applied the spatial statistical standard deviational ellipse method to quantitatively analyze the developmental characteristics of the spatial distribution of marine governance enterprises. By using this method, we were able to simultaneously describe the overarching and global characteristics of the spatial distributions of marine governance enterprises such as centrality, subject range, and directionality. Through analyzing the changes in the ellipse parameters of the spatial distribution by time, we can further explore the development of the spatial distribution of marine governance enterprises. The main parameters are calculated as follows.
Mean Center:
The standard deviation of x-axis:
The standard deviation of y-axis:
In the equation,
Kernel Density Analysis
Kernel density analysis is the most commonly used method to measure the spatial distribution of pointed data. It can calculate the agglomeration status of the entire area according to the input elements, and mainly reflects the intensity of the influence from a kernel on the surrounding area. A larger kernel density estimate reflects a denser distribution of the points and a higher probability of the occurrence of regional events. The formula is presented below:
In the equation,
Nearest Neighbor Index
The nearest neighbor index R is used to estimate the distribution pattern and the degree of agglomeration of the overall and all sub-types of marine governance industries. The distribution area A is taken as the administrative area of Shanghai (6340.5 km2). The distribution patterns can be divided into three categories: random, uniform, and agglomerated distribution. When R>1, the spatial distribution of the marine water treatment industry (organization) tends to be random. When R = 1, it tends to be uniform, and when R<1, it tends to be agglomerated. A smaller value of R represents a higher degree of agglomeration. The equation is provided below:
In the equation, A is the area of the district; n is the number of data.
Results
For the spatial distribution characteristics of MEG entities in Shanghai, it is can be seen that there is an obvious pattern of agglomeration in terms of the spatial distribution in the interior area of the city. The degree and location of agglomeration have changed over time (Figure 1). In 2005, MEG entities and institutions were mainly concentrated near the old downtown area along the coastal area in the southern part. Specifically, they were distributed around the Hujia highway to Nanxiang North Station in Jiading District. There were some agglomeration in the north part of the Pudong new district and the coastal area in the south. In 2021, the agglomeration expanded, and the agglomerated area gradually shifted to Minhang District, Fengxian District, and Chongming District, with the number of entities in the three regions accounting for 49.96% of the total number of entities in Shanghai. Specifically, these entities were located in the eastern coastal area of Pudong New District, such as the intersection area of Shenjiang Road and Longdong Avenue, as well as in the part of Hongkou District that is close to the Huangpu River. As a near-inland jurisdiction, Songjiang District has the advantages of having policy preference and a large space for development, whereas it lacks obvious location advantages. Therefore, it is less attractive for MEG entities and institutions and has shortcomings in the layout. Consequently, it has not become a new agglomeration center. In contrast, Fengxian District has made obvious breakthroughs in attracting MEG entities. For instance, the Fengxian Campus of East China University of Science and Technology and Fengxian Shenlong Ecological Park have created a radiation area in the center. In Hangtang Highway, Puxing Highway, and Pingzhuang East Road, there have gathered a group of MEG entities and institutions mainly focusing on research and development. Chongming District has also attracted an increasing number of MEG entities in recent years under its outstanding geographical advantages. For example, the area around Dongping National Forest Park and radiating from the north to the south along the highway has shown agglomeration characteristics. From 2005 to 2021, the spatial distribution of MEG entities and institutions generally shifted from a pattern of one-core agglomeration to contiguous development, and then to multi-center agglomeration. The expansion trend is reflected in the radiation and expansion of old districts to new districts.
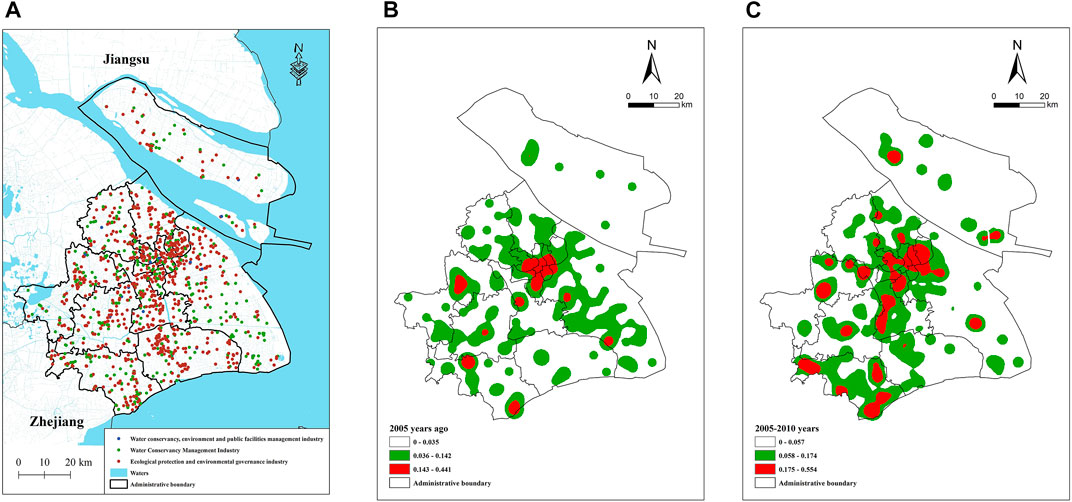
FIGURE 1. Distribution map of MEG entities and institutions in Shanghai up until 2021 (A–C).
Agglomeration Characteristics of Major Marine Entities in Shanghai
In terms of the number of entities, entities from ecological protection and environmental governance industries accounted for the vast majority of the total number of MEG entities. In contrast, entities from water conservancy, environment, and public facilities management industries accounted for the smallest proportion. The average nearest neighbor distance analysis showed that (see Table 1) the nearest neighbor indices of Shanghai MEG entities were all larger than 0.2. Considering that the number of water conservancy, environment, and public facilities management was very small and almost negligible, all the Z values were smaller than −30, being significant at an alpha level of 1%. It showed that the above industries all presented a significant pattern of agglomeration, that is, the spatial agglomeration characteristics of these marine governance entities were substantial. As the main position of developing the marine economy in Shanghai, the coastal area showed that there were differences in the spatial distribution of marine entities across different industries. Chongming District, Pudong New District, Fengxian District, and Minhang District were the core agglomeration areas of marine governance entities in Shanghai, with other areas being secondary areas for different industries. The specific distribution is shown in Figure 1.
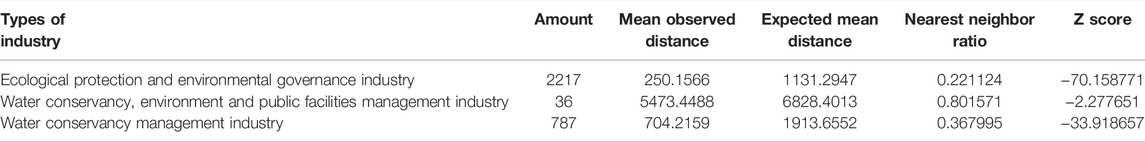
TABLE 1. Analysis of the nearest neighbor distance of MEG entities in Shanghai.
Spatial Distribution of Marine Entities in Shanghai From 2005 to 2021
In terms of the spatial distribution of entities and institutions, marine entities continued to agglomerate in the central urban area, especially in Hongkou. The suburban marine entities stayed to concentrate in the main urban areas of districts and counties. In larger districts and counties, there appeared the phenomenon of multi-center agglomeration. The characteristics of marine entities and institutions migrating to the coastal areas became more pronounced during this period. Marine entities formed a significant industrial belt on both sides of the Huangpu River. The industrial belt started from the Wusongkou area in Baoshan District along the Yangtze River, passed through the Waigaoqiao area in Pudong, and extended to the outside of Pudong Airport. At the same time, on the left bank of the Yangtze River, Changxing Island, and Chongming Island also began to show the prototype of a relatively loose marine entity belt (see Figure 1).
Between 2005 and 2021 (see Figure 2), the distribution of 2,212 new MEG entities and institutions in Shanghai was as follows: 11 in Hongkou District, 193 in Pudong New District, 33 in Yangpu District, 9 in Changning District, 256 in Minhang District, and 256 in Xuhui District. 11 in Putuo District, 131 in Jiading District, 92 in Baoshan District, 117 in Songjiang District, 162 in Qingpu District, 531 in Fengxian, 260 in Jinshan District, and 393 in Chongming District.
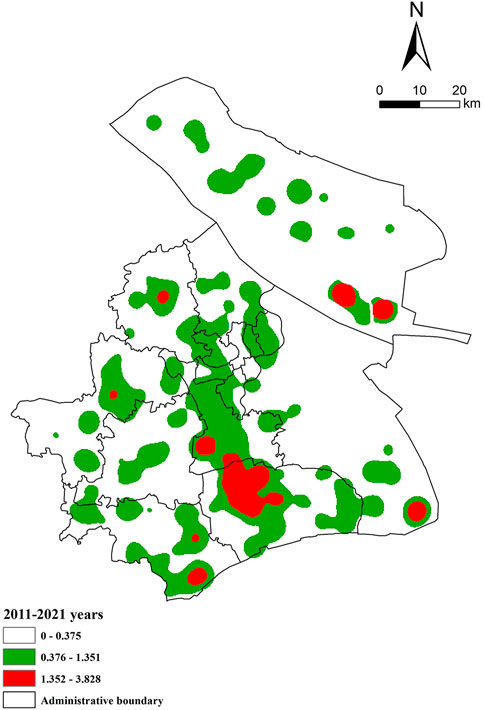
FIGURE 2. Changes in core density of MEG entities and institutions in Shanghai.
Based on the abovementioned analysis, it can be found that the spatial agglomeration of MEG entities in Fengxian District has accelerated rapidly, with the number of new entities increasing exponentially than in the previous period. Consequently, it has become the district with the largest number of marine entities in the city. The entities were still mainly concentrated in the area on the east and west sides of the Puxing road. The number of new MEG entities in Chongming District has also increased significantly. Except for the obvious agglomeration in the southeastern part of Chenhai Highway, the rest of the entities were distributed in a relatively balanced manner throughout the region. The spatial polarization of Minhang District accelerated during this period, and the number of new marine entities increased from 14 in 2005 to 270 in 2021, with an increase of nearly 20 times. During this period, the MEG entities in Jinshan District also developed rapidly. The number of new entities increased from 26 in 2005 to 286, an increase of more than 10 times. Marine entities and institutions spread in multiple directions from 2005 to 2021. In addition, the spatial distribution of marine entities and institutions in Shanghai from 2005 to 2021 showed several major characteristics (see Figure 2). First, the increase in MEG entities in Fengxian District exceeded 7,000%; Second. The marine entities in Lujiazui, the district government and the Waigaoqiao area of Pudong New Area continued to agglomerate. Third, there were several marine entity agglomeration areas in the larger area, such as Waigaoqiao in Pudong, Lujiazui and district government marine environment governance entities area, Hongqiao Airport in Minhang district, Xinzhuang Meilong Town Agglomeration Area, Nanhui District Government, and Lingang New City Aggregation Area. Fourth, the suburbs continued to accelerate the agglomeration of MEG entities in central urban areas, such as Qingpu, Songjiang, Nanhui, Jinshan, and Jiading.
The results of standard deviational ellipse analysis showed that the distribution of MEG entities in Shanghai showed significant diffusion characteristics, with the diffusion trend following a certain direction. The centers of the spatial standard deviational ellipses of the MEG entities across the three time-points were all located in Xuhui District and showed a trend of moving from the center to the north and south. The area of the ellipse continued to increase, and the spatial distribution of MEG entities spread outward (see Figure 3).
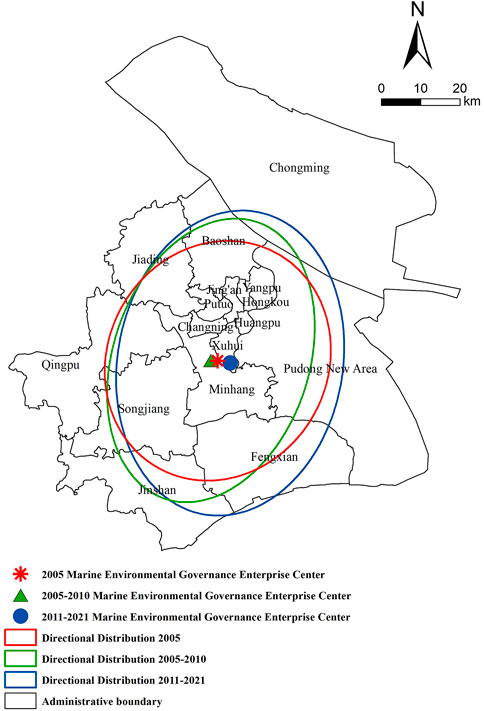
FIGURE 3. Standard deviational ellipse of resource distribution of MEG entities and institutions in Shanghai from 2005 to 2021.
Before 2005, the aggregation effect was concentrated in fewer areas. Thus, the length difference between the major and minor axes of the standard deviational ellipse was not obvious, with the directional angle approaching 90° and the distribution showing no directional characteristics. From 2005 to 2010, the ratio of the long and short axes of the standard deviational ellipse gradually increased and the direction angle gradually decreased. Meanwhile, affected by the terrain and urban economic development, the distribution of MEG entities showed a relatively obvious pattern of spreading from “the southwest to the northeast”. The area of the standard deviational ellipse in 2021 was significantly larger than that in 2005, indicating that the diffusion effect of entity distribution was significant. Due to social and economic development and the allocation and utilization of urban public resources, as well as the increase in urban population and land prices brought about by urban expansion, most entities optimized their location selection and resided in the periphery of cities, especially in coastal areas, in order to reduce operating costs and improve operating efficiency. This phenomenon was especially salient in Chongming District in the north of Shanghai and Fengxian District in the south of Shanghai. At the same time, the gradual policy guidance has also explained the increasingly obvious pattern that the MEG entities are spreading to the north and south of the city.
Conclusion
To conclude, we had the following findings: (1) Between 2005 and 2021, the number of new MEG entities in Shanghai increased by more than 10 times, of which ecological protection and environmental governance entities accounted for 73% of the total number of entities. These entities were mainly small entities with small sizes. (2) The number of new water conservancy, environment, and public facility management industries began to decline, and the number of other MEG entities rose steadily. (3) Through the analysis of the average nearest neighbor distance, it is found that the nearest neighbor indices of Shanghai MEG entities were all larger than 0.2, with the Z test values all being less than −30 and being significant at an alpha level of 1%. It can be seen that the spatial agglomeration characteristics of marine governance entities in Shanghai were salient and substantial. (4) Chongming District, Pudong New District, Fengxian District, and Minhang District were the core agglomeration areas of marine governance entities in Shanghai. Other areas were secondary agglomeration areas for different sub-industries. (5) Results of the standard deviational ellipse suggested that the distribution of MEG entities in Shanghai from 2005 to 2021 had shown an obvious diffusion characteristic. The centers of the spatial standard deviational ellipses of the MEG entities across three timepoints were all located in Xuhui District, showing a pattern of spreading from the center to both the North and South.
The period from 2005 to 2021 is a period where the foreign trade and gross national product in China experienced rapid development. As a result, the explosive growth of the marine economy has led to the occurrence of a series of environmental governance issues. Based on the results of data analysis, we have reason to believe that the rapid growth of the number of small and medium-sized entities is often the result of sufficient policy guidance and encouragement. Our future research may be able to discuss the role of different policies. In terms of spatial distribution characteristics, the entities followed a distribution that was highly concentrated in the inner circle and that was developed “from point to face”. The entities were also spreading orderly to the central urban area of each suburb. Such spatial distribution characteristics are similar to the atypical “central place theory”. The German urban geographer Kristaller theorized that on an ideal surface, a series of central places are evenly distributed. In order to maximize the profit of merchants, each central place has a maximum sales or service distance of goods and services, resulting in the formation of several circles that are tangent to each other. In order to eliminate the shadow area between the three tangent circles that the goods and services cannot reach, the optimal approach is to move the tangent circles until the shadow area is eliminated. Then, a hexagonal network that covers the whole area and maximizes the profit can be obtained by connecting the centers in each area. In line with this theory, during the period from 2005 to 2021, marine governance entities in Shanghai were highly concentrated in the inner circle area, forming a marine industry center. Although these entities did not form a hexagonal network, they still formed a network system radiating from the center to the periphery.
Data Availability Statement
The raw data supporting the conclusions of this article will be made available by the authors, without undue reservation.
Author Contributions
All authors contributed to the study conception and design. Material preparation, data collection, and analysis were performed by DY and HG. The first draft of the manuscript was written by Y-KF and TZ, and all authors commented on previous versions of the manuscript. All authors read and approved the final manuscript.
Funding
The research was supported by the Ministry of Science and Technology of Taiwan, grant numbers MOST 110-2410-H-157-001.
Conflict of Interest
The authors declare that the research was conducted in the absence of any commercial or financial relationships that could be construed as a potential conflict of interest.
Publisher’s Note
All claims expressed in this article are solely those of the authors and do not necessarily represent those of their affiliated organizations, or those of the publisher, the editors and the reviewers. Any product that may be evaluated in this article, or claim that may be made by its manufacturer, is not guaranteed or endorsed by the publisher.
Acknowledgments
This research thanks for the comments from reviewers and a proofreading expert from YourS (Shanghai) Education.
Reference
Bai, Y., Chou, L., and Zhang, W. (2021b). Industrial Innovation Characteristics and Spatial Differentiation of Smart Grid Technology in China Based on Patent Mining. J. Energy Storage 43, 103289. doi:10.1016/j.est.2021.103289
Bai, Y., Dai, J., Huang, W., Tan, T., and Zhang, Y. (2021a). Water Conservation Policy and Agricultural Economic Growth: Evidence of Grain to Green Project in China. Urban Clim. 40, 100994. doi:10.1016/j.uclim.2021.100994
Bailey, R. M., Carrella, E., Axtell, R., Burgess, M. G., Cabral, R. B., Drexler, M., et al. (2019). A Computational Approach to Managing Coupled Human-Environmental Systems: the POSEIDON Model of Ocean Fisheries. Sustain Sci. 14 (2), 259–275. doi:10.1007/s11625-018-0579-9
Boesch, D. F. (2019). Barriers and Bridges in Abating Coastal Eutrophication. Front. Mar. Sci. 6, 123. doi:10.3389/fmars.2019.00123
Cao, H., Khan, M. K., Rehman, A., Dagar, V., Oryani, B., and Tanveer, A. (2022). Impact of Globalization, Institutional Quality, Economic Growth, Electricity and Renewable Energy Consumption on Carbon Dioxide Emission in OECD Countries. Environ. Sci. Pollut. Res. 29 (16), 24191–24202. doi:10.1007/s11356-021-17076-3
Chen, D., Long, X., Li, Z., Liao, C., Xie, C., and Che, S. (2021). Exploring the Determinants of Urban Green Space Utilization Based on Microblog Check-In Data in Shanghai, China. Forests 12 (12), 1783. doi:10.3390/f12121783
Chou, L. C., Zhang, W. H., Wang, M. Y., and Yang, F. M. (2020). The Influence of Democracy on Emissions and Energy Efficiency in America: New Evidence from Quantile Regression Analysis. Energy & Environ. 31 (8), 1318–1334. doi:10.1177/0958305x19882382
Curtin, R., and Prellezo, R. (2010). Understanding Marine Ecosystem Based Management: a Literature Review. Mar. policy 34 (5), 821–830. doi:10.1016/j.marpol.2010.01.003
Dagar, V., Khan, M. K., Alvarado, R., Rehman, A., Irfan, M., Adekoya, O. B., et al. (2022). Impact of Renewable Energy Consumption, Financial Development and Natural Resources on Environmental Degradation in OECD Countries with Dynamic Panel Data. Environ. Sci. Pollut. Res. 29 (12), 18202–18212. doi:10.1007/s11356-021-16861-4
Ding, L. L., Lei, L., Wang, L., Zhang, L. F., and Calin, A. C. (2020). A Novel Cooperative Game Network DEA Model for Marine Circular Economy Performance Evaluation of China. J. Clean. Prod. 253, 120071. doi:10.1016/j.jclepro.2020.120071
Gervais, A., and Jensen, J. B. (2019). The Tradability of Services: Geographic Concentration and Trade Costs. J. Int. Econ. 118, 331–350. doi:10.1016/j.jinteco.2019.03.003
González-Val, R. (2019). The Spatial Distribution of US Cities. cities 91, 157–164. doi:10.1016/j.cities.2018.11.015
Han, X., Yu, J., Xia, Y., and Wang, J. (2021). Spatiotemporal Characteristics of Carbon Emissions in Energy-Enriched Areas and the Evolution of Regional Types. Energy Rep. 7, 7224–7237. doi:10.1016/j.egyr.2021.10.097
Hsu, A. (2018). “Governing by Numbers,” in Routledge Handbook of Sustainability Indicators (London: Routledge), 267–283. doi:10.4324/9781315561103-17
Khan, M. K., Khan, M. I., and Rehan, M. (2020). The Relationship between Energy Consumption, Economic Growth and Carbon Dioxide Emissions in Pakistan. Financ. Innov. 6 (1), 1–13. doi:10.1186/s40854-019-0162-0
Li, C., Yuan, B., and Zhang, Y. (2019). Effect Assessment of Ecological Construction in China from 2008 to 2014. Pol. J. Environ. Stud. 28 (3). doi:10.15244/pjoes/85945
Li, Z., Li, A., Dai, X. Z., and Dai, J. (2020). Impact of Public Participation on Coastal Pollution Emissions under the Growth of Personal Income. J. Coast. Res. 109 (SI), 39–44. doi:10.2112/jcr-si109-007.1
Liu, J., Viña, A., Yang, W., Li, S., Xu, W., and Zheng, H. (2018). China's Environment on a Metacoupled Planet. Annu. Rev. Environ. Resour. 43, 1–34. doi:10.1146/annurev-environ-102017-030040
Mao, J., Zhang, Y., Yu, F., Chen, J., Sun, J., Wang, S., et al. (2020). Simulating the Impacts of Ship Emissions on Coastal Air Quality: Importance of a High-Resolution Emission Inventory Relative to Cruise- and Land-Based Observations. Sci. Total Environ. 728, 138454. doi:10.1016/j.scitotenv.2020.138454
McGranahan, G., Balk, D., and Anderson, B. (2007). The Rising Tide: Assessing the Risks of Climate Change and Human Settlements in Low Elevation Coastal Zones. Environ. urbanization 19 (1), 17–37. doi:10.1177/0956247807076960
Mou, N., Liu, C., Zhang, L., Fu, X., Xie, Y., Li, Y., et al. (2018). Spatial Pattern and Regional Relevance Analysis of the Maritime Silk Road Shipping Network. Sustainability 10 (4), 977. doi:10.3390/su10040977
Platjouw, F. M. (2018). Marine Spatial Planning in the North Sea-Are National Policies and Legal Structures Compatible Enough? the Case of Norway and the Netherlands. Int. J. Mar. Coast. Law 33 (1), 34–78. doi:10.1163/15718085-12320075
Ren, W., Ji, J., Chen, L., and Zhang, Y. (2018). Evaluation of China's Marine Economic Efficiency under Environmental Constraints-An Empirical Analysis of China's Eleven Coastal Regions. J. Clean. Prod. 184, 806–814. doi:10.1016/j.jclepro.2018.02.300
Ren, W. (2021). Research on Dynamic Comprehensive Evaluation of Allocation Efficiency of Green Science and Technology Resources in China's Marine Industry. Mar. Policy 131, 104637. doi:10.1016/j.marpol.2021.104637
Rosés, J. R., and Wolf, N. (2018). Regional Economic Development in Europe, 1900-2010: A Description of the Patterns. Munich, Germany: Munich Society for the Promotion of Economic Research‐CESifo GmbH. CESifo Working Paper Series No. 6952.
Shao, Q. (2020). Nonlinear Effects of Marine Economic Growth and Technological Innovation on Marine Pollution: Panel Threshold Analysis for China's 11 Coastal Regions. Mar. Policy 121, 104110. doi:10.1016/j.marpol.2020.104110
Su, M., and Yang, Y. (2018). Evolution of District Marine Policies in China: the Case of Shandong Province. Mar. Policy 89, 124–131. doi:10.1016/j.marpol.2017.12.028
Teng, J. Z., Khan, M. K., Khan, M. I., Chishti, M. Z., and Khan, M. O. (2021). Effect of Foreign Direct Investment on CO2 Emission with the Role of Globalization, Institutional Quality with Pooled Mean Group Panel ARDL. Environ. Sci. Pollut. Res. 28 (5), 5271–5282. doi:10.1007/s11356-020-10823-y
Tian, R., Shao, Q., and Wu, F. (2020). Four-dimensional Evaluation and Forecasting of Marine Carrying Capacity in China: Empirical Analysis Based on the Entropy Method and Grey Verhulst Model. Mar. Pollut. Bull. 160, 111675. doi:10.1016/j.marpolbul.2020.111675
Walters, C. (1997). Challenges in Adaptive Management of Riparian and Coastal Ecosystems. Conserv. Ecol. 1 (2). doi:10.5751/es-00026-010201
Wang, S., Xing, L., and Chen, H. (2020). Impact of Marine Industrial Structure on Environmental Efficiency. Manag. Environ. Qual. 31 (1), 111–129. doi:10.1108/MEQ-06-2019-0119
Zakari, A., Toplak, J., Ibtissem, M., Dagar, V., and Khan, M. K. (2021). Impact of Nigeria's Industrial Sector on Level of Inefficiency for Energy Consumption: Fisher Ideal Index Decomposition Analysis. Heliyon 7 (5), e06952. doi:10.1016/j.heliyon.2021.e06952
Keywords: marine environmental governance, sustainable development, spatial distribution, Shanghai, marine economy
Citation: Yang D, Geng H, Fu Y-K and Zhu T (2022) Sustainability Assessment of Marine Economy in China: Spatial Distributions of Marine Environmental Governance Entities in Shanghai. Front. Environ. Sci. 10:960464. doi: 10.3389/fenvs.2022.960464
Received: 03 June 2022; Accepted: 21 June 2022;
Published: 22 July 2022.
Edited by:
Vishal Dagar, Great Lakes Institute of Management, IndiaReviewed by:
Muhammad Imran Khan, University of Agriculture, PakistanMuhammad Kamran Khan, Bahria University, Pakistan
Copyright © 2022 Yang, Geng, Fu and Zhu. This is an open-access article distributed under the terms of the Creative Commons Attribution License (CC BY). The use, distribution or reproduction in other forums is permitted, provided the original author(s) and the copyright owner(s) are credited and that the original publication in this journal is cited, in accordance with accepted academic practice. No use, distribution or reproduction is permitted which does not comply with these terms.
*Correspondence: Ting Zhu, ZHIuemh1LnRpbmdAb3V0bG9vay5jb20=