 José L. Cárdenas1
 Alfonso López
 Francisco R. Feito
 Juan M. Jurado
95% of researchers rate our articles as excellent or good
Learn more about the work of our research integrity team to safeguard the quality of each article we publish.
Find out more
METHODS article
Front. Environ. Sci. , 02 November 2022
Sec. Environmental Informatics and Remote Sensing
Volume 10 - 2022 | https://doi.org/10.3389/fenvs.2022.960083
This article is part of the Research Topic Methods and Applications in Environmental Informatics and Remote Sensing View all 9 articles
The reconstruction of tree branching structures is a longstanding problem in Computer Graphics which has been studied over several data sources, from photogrammetry point clouds to Terrestrial and Aerial Laser Imaging Detection and Ranging technology. However, most data sources present acquisition errors that make the reconstruction more challenging. Among them, the main challenge is the partial or complete occlusion of branch segments, thus leading to disconnected components whether the reconstruction is resolved using graph-based approaches. In this work, we propose a hybrid method based on radius-based search and Minimum Spanning Tree for the tree branching reconstruction by handling occlusion and disconnected branches. Furthermore, we simplify previous work evaluating the similarity between ground-truth and reconstructed skeletons. Using this approach, our method is proved to be more effective than the baseline methods, regarding reconstruction results and response time. Our method yields better results on the complete explored radii interval, though the improvement is especially significant on the Ground Sampling Distance In terms of latency, an outstanding performance is achieved in comparison with the baseline method.
The geometric modeling of tree branching structures has been widely studied in the last decades for the representation of synthetic vegetation with a high degree of realism, as well as for the precise acquisition of real trees. Therefore, this research field has attracted interest from several areas, including botany, Computer Graphics (CG) and Remote Sensing (RS). Recent studies are mainly focused on the interpretation of data acquired from RS tools rather than synthetic modeling, as some frameworks such as Speed-Tree® are well-established as standards for generating procedural and realistic environments. However, the modeling of vegetation covers a wide range of applications, including but not limited to the virtual entertainment industry, design of urban landscapes, simulations concerning natural environments as well as monitoring and management of agricultural and forestry scenes. Hence, this field is expected to gain interest as some emerging trends require the accurate characterization of vegetation for realistic simulation models, such as the modeling of Earth digital twins.
There have been previous efforts on the assessment of tree structures from the output of Remote Sensing (RS) tools. The main data sources consist of images (Andújar et al., 2016; Li et al., 2021; Lu et al., 2021) and point clouds (Surovy et al., 2016; Lee et al., 2018; Jaskierniak et al., 2021), either acquired by LiDAR (Laser Imaging Detection and Ranging) or photogrammetry, which are simplified using voxel-based or grid data structures (2D), as well as spatial structures, such as octrees, k-d trees and quadtrees for 3D inputs (Cao et al., 2019; Fu et al., 2020). Regarding the algorithmic core of previous work, methods aimed at the reconstruction of 3D tree skeletons from real-world data can be organized into three main categories: 1) Procedural reconstructions, where input data guides the tree modeling (Neubert et al., 2007; Binney and Sukhatme, 2009; Zhang et al., 2014; Guo et al., 2020b), 2) Geometric extraction techniques to resemble the appearance of the branching structure through its skeleton (Gorte and Pfeifer, 2004; Tan et al., 2007; Livny et al., 2010; Fu et al., 2020), and 3) Image-based methods focused on the extraction of 2D branching structures and the subsequent estimation of a 3D skeleton (Tan et al., 2008; Lopez et al., 2010). Also, the estimation of the skeleton is frequently followed by some of the following techniques: 1) cleaning, 2) smoothing branches and 3) removing redundant ones or providing higher realism to straight branches. Despite manual in-field measurements of tree properties being possible, they represent a time-consuming task (Walter et al., 2019; Wang et al., 2021) that can be automatized by digitizing the structure of trees. To this end, the vegetation geometry can be acquired by previously mentioned data sources. Firstly, Structure from Motion (SfM) provides a robust methodology for extracting features and the subsequent estimation of a 3D model, even using consumer-grade digital cameras. However, SfM reconstructions present a significant response time, yet for GPU-accelerated (Graphics Processing Unit) solutions, and are more prone to incomplete results derived from occlusion (López et al., 2021b). Nevertheless, it is challenging to handle visibility completeness for trees with dense foliage. On the other hand, LiDAR sensors allow acquiring large and dense point clouds that are less prone to occlusion at the expense of appropriate planning of one or multiple scans (Shao et al., 2020; Tu et al., 2020; Kuzelka and Surovy, 2021). Furthermore, there exists a wide range of LiDAR sensors according to their specifications and the platform they are operated on (Poux, 2019); thus, multiple scans from different tools can be fused (Shao et al., 2020). Consequently, this work is focused on the reconstruction of trees from aerial LiDAR since it leverages acquisition facilities and precision, while also minimizing occlusion.
Besides sensors, acquiring data from vegetation is a cumbersome task whether we aim to cover the surface and inner structure of trees. Accordingly, dense foliage and overlapping branches pose several challenges regarding tree occlusion and the subsequent skeleton estimation. Tree occlusion can be reduced, rather than avoided, by acquiring data from multiple viewpoints during surveys (Shao et al., 2020; Tu et al., 2020; Kuzelka and Surovy, 2021), either aerial (mounted on Unmanned Aerial Vehicles (UAV)) or terrestrial. Besides occlusion, input data may also present systematic and random errors from imprecise estimations or sensor-derived errors (Fan et al., 2015; Pandžić et al., 2017). Consequently, trees without foliage are easier to reconstruct and evaluate through geometric approaches, as observed in the literature. Thus, the reconstruction of tree skeletons must be resilient to frequent errors observed in widespread sensors by balancing the linking of local point neighborhoods and distant subgraphs. Regarding evaluation, most of the previous work lacks quantitative measures to assess the similarity of ground-truth and estimated skeletons. Therefore, a geometrically based algorithm is necessary for evaluating a reconstruction method in comparison with other state-of-the-art solutions.
Precise estimations of tree branching structures allow reconstructing the geometry and topology of real-world vegetation acquired by sensors. By digitizing these structures, manual measurements can be avoided and performed through efficient algorithms, thus reducing the response time of in-field monitoring. Some of the most relevant studies regarding vegetation properties address the estimation of biomass (Walter et al., 2019; Wang et al., 2021), phenotyping (Tefera et al., 2022) as well as coarse-grained and leaf-related parameters (Rosell et al., 2009). Furthermore, the reconstruction of trees represents a baseline for predicting and modeling the state of an environment, thus providing a background for precision agriculture, soil, forestry (Nită, 2021) and urban management (Gobeawan et al., 2021).
Reconstruction techniques are categorized either as procedural, geometric or image-based. Each one presents advantages and drawbacks, although input data is mostly limited to TLS (Terrestrial LiDAR Scanner) and photogrammetry. Aerial surveying is barely revised in the literature, despite it significantly accelerates monitoring tasks for massive tree plantations. Procedural methods are classified into Rule-based and Particle-flow modeling, where both categories are classical tree generation techniques (Reche et al., 2004; Zhang et al., 2014) constrained by real data. In this regard, most of them are based on a significant set of parameters (e.g., ramification angles, growth length of branch segments, etc.), whose values need to be adjusted for each different tree specimen. Therefore, their main drawback is given by the tuning of parameters, although there are inverse procedural modeling techniques aimed at computing the values of these parameters (Stava et al., 2014) and rules (Guo et al., 2020a). On the other hand, they usually have a high tolerance to noise and occlusion. Image-based methodologies represent an efficient estimation of 2D skeletons, although transferring this knowledge to 3D environments is not trivial. When a single image is used, the branch angles are not accurately modeled (Tan et al., 2008). Using a 2.5D approach (Cheng et al., 2007), branch angles are extracted from the depth information associated with the image. Other approaches merge multiple 2D skeletons extracted from different viewpoints into a single 3D structure (Lopez et al., 2010). Nevertheless, some of the stages of these solutions require user interaction (Teng and Chen, 2009). Finally, geometrical methods refer to methods that estimate the tree skeleton from the input data, thus obtaining the Medial Axis (MA) as well as the tree topology. Therefore, they are highly dependant on the input data and thus sensitive to missing parts of branches. These are classified in three main categories: 1) Thinning methods, 2) Clustering techniques, and 3) Spanning Tree methods, addressing the building and simplification of a spanning tree.
Thinning methodologies were first described as a voxelization of the input data, where dilation and erosion operators were later applied to fill hollow branches and reduce tree branches, thus obtaining the topology by linking surrounding voxels (Gorte and Pfeifer, 2004). Clustering techniques follow a procedure based on the spatial indexing of input data and the generation of a neighbor graph to group points according to their distance to the root. Neighborhoods are mainly driven by the k-nearest neighbor (KNN), either by using a search radius (Delagrange et al., 2014) or k neighbors (Zhu et al., 2009). Then, a geodesic graph is built by applying a distance function, such as the Euclidean distance (Tan et al., 2007) or the number of nodes traversed (Li et al., 2017). Measured distances are then clustered by considering either a fixed number of bins (Zhu et al., 2009) or equal (Xu et al., 2007) or adaptive length (Li et al., 2017). Branching sections are then split into connected components to differentiate branches. For that purpose, Gong et al. (2018) proposed to find contour lines, whereas Fu et al. (2020) exploited the cylindrical shape of branches to split them, even for bifurcations previously assessed as a single branch. Finally, sections are connected to form the tree skeleton. In this stage, optimal results are achieved by methods segmenting the point cloud to annotate branches and leaves (Li et al., 2017), thus making them appropriate for trees with foliage. Another relevant category within geometrical methodologies is the Spanning tree refinement, aimed at generating a weighted spanning tree from input data for modeling tree skeletons. To this end, Livny et al. (2010) calculates the geodesic graph using the Dijkstra’s algorithm, whereas Du et al. (2019) computes the distance minimum spanning tree (DMst), i.e., a spanning tree where the sum of all its weights must be minimum. The resulting spanning tree can be further refined through local optimization, e.g., computing a smoothed orientation field, or global approaches, such as the discarding of points with lower weight, corresponding to false branches (Du et al., 2019).
Although previous work has assessed occlusion on branching structures, most of the revised studies work under nearly ideal information. On the other hand, aerial-acquired results pose significant challenges regarding occlusion, even without the presence of foliage. Occluded areas can be partially avoided by capturing trees from different viewpoints. However, recent research has also proposed to fill gaps through procedural modeling (Guo et al., 2020b), global optimization methods (Wang et al., 2014) and Deep Learning models (Isokane et al., 2018). Also, Delagrange et al. (2014) describes a semi-automatic method where unconnected branch components require human intervention. Other alternative methods evaluate their robustness against partial branch occlusion (Fu et al., 2020), though the main challenge proceeds from overlapping branches, thereby completely omitting branch sections.
Once skeletons are reconstructed, the results ought to be evaluated regarding the similarity between ground-truth and digital structures. However, ground-truth data is unknown in most cases, mainly for input data from an RS tool. Therefore, previous work assesses the similarity and correctness through visual inspection (Zhang et al., 2014). Quantitative evaluations are also explored for penalizing geometrical and topological discrepancies, although their algorithms are composed of several complex stages (Boudon et al., 2014; Isokane et al., 2018). Coarse-grained quantitative evaluations are also proposed by comparing properties such as height, biomass, trunk diameter, or Leaf Area Index (LAI) (Bournez et al., 2017). Distance and variance-based metrics are also popular in previous work (Lu et al., 2021). Besides measuring the similarity, the robustness of the proposed method can be addressed by omitting some points, thus showing the reconstruction process in occlusion conditions (Fu et al., 2020). Nevertheless, few studies work under the occlusion of complete section branches, in contrast to preserving a few points.
Consequently, the main contribution of this work is the reconstruction of tree branching structures from aerial data combining clustering and MST approaches, thus allowing to fuse disconnected branch components. To this end, we show that grouping points with an intuitive radius offers a better performance than the classical KNN approach. Therefore, the manual connectivity repair proposed by previous research (Delagrange et al., 2014) is performed automatically in this work. Accordingly, our method is successfully applied to simulated aerial LiDAR scans, although it is also suitable for TLS point clouds acquired from a single viewpoint. Point clouds captured with ALS (Aerial LiDAR Scanner), due to their viewpoint from the top, have more occlusion and missing data in the trunk and main branches than TLS-acquired point clouds from multiple viewpoints. Finally, we simplify the algorithm proposed by Boudon et al. (2014) for quantitatively evaluating the result of the tree reconstruction methodology.
This paper is structured as follows. First, we generate a synthetic LiDAR dataset based on procedural trees, consisting of skeletons and surveyed point clouds. The proposed methodology for reconstructing tree branching structures is then explained. Furthermore, an evaluation method is proposed both to measure the quality of our results and simplify previous proposals for assessing the similarity of ground-truth and reconstructed skeletons. Using this approach, we provide a comparison of the described method with respect to other state-of-the-art geometric extraction techniques. The outcomes of the conducted tests as well as the conclusions are finally summarised in Section Results.
In this section, we describe the proposed reconstruction method that is later evaluated in Section Results. The overall procedure of our algorithm is depicted in Figure 1.
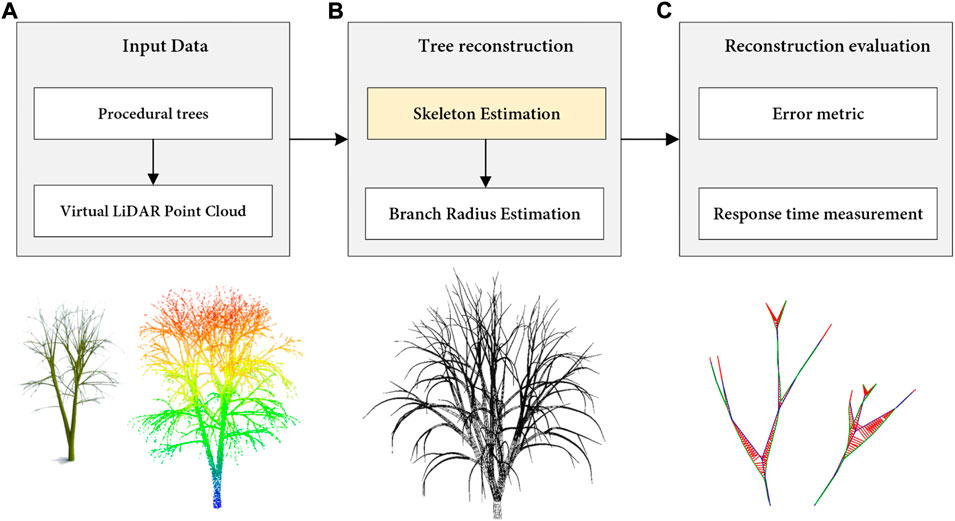
FIGURE 1. Overview of the proposed method for the reconstruction of tree branching structures. (A) First, a set of tree species is procedurally generated using a virtual LiDAR scanner. (B) Next, the skeleton is modeled by branch extraction. (C) Finally, the quality of the output skeletons and the performance of the method on real LiDAR models are measured.
The mesh modeling and assessment of real-world trees digitized from LiDAR sensors poses a challenge, as the actual skeletons of real-world data are unknown. Regarding previous work, most evaluations were based on visual inspections or manual-processing tasks to generate the branching structure of trees. Accordingly, our approach is focused on using synthetic data, which are modeled by simulating the capture of LiDAR sensors in a virtual environment. Thus, a synthetic scenario characterized by many procedural trees with their corresponding skeleton is taken as input. Therefore, the traditional process is reversed; first, the branching structure is procedurally generated, and the triangular mesh is computed with such a skeleton and the branching radius. Then, the computer-generated LiDAR data of the forest is simulated. As a result, a wide variety of procedural trees with their corresponding skeletons are taken as input for our tree skeletonization method.
Procedural trees are modeled using the well-known Sapling Tree Gen plugin from Blender (Weber and Penn, 1995), which yields both the skeleton and mesh. However, skeletons are not provided as a fully connected graph. The result consists of several disjoint components that cannot be directly applied to our later evaluation. To overcome this, the point with the lowest y coordinate is linked to the nearest edge found with KNN for each component. Note that new vertices may be generated by intersecting the nearest edge and the unlinked edge. The resulting scene is built using six different tree specimens and ten distinct seeds for each one, thus obtaining 60 uniformly distributed trees (Figure 2).
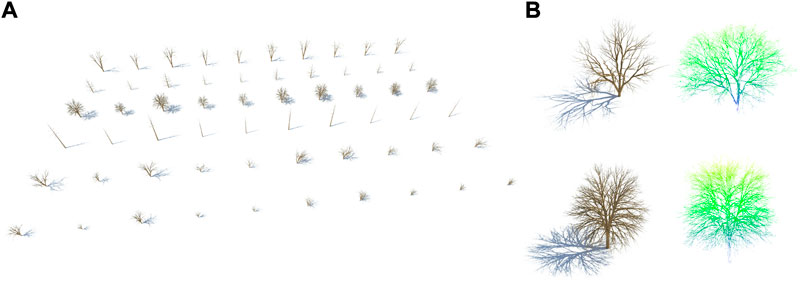
FIGURE 2. Synthetic dataset of 3D trees. (A) Procedural trees generated from Sapling Tree Gen. (B) Point clouds obtained from virtual aerial LiDAR scanning.
According to the LiDAR simulation, it is performed using the work described by López et al. (2021a), López et al. (2022) since it allows scanning virtual environments both with terrestrial and aerial LiDAR. Other solutions provide aerial surveys as an extension of TLS, thus not being appropriate to study occlusion derived from ALS. The LiDAR scanning is launched in the GPU over an scene of 14 million triangles, with the specifications of a DJI Zenmuse L1 sensor (Table 1. The maximum tree height of such a scene is 18m, and the virtual drone flight is performed at 35 m, thus requiring five different sweeps to survey the complete scenario. The final point cloud is composed of 148 k points from up to 3 returns.
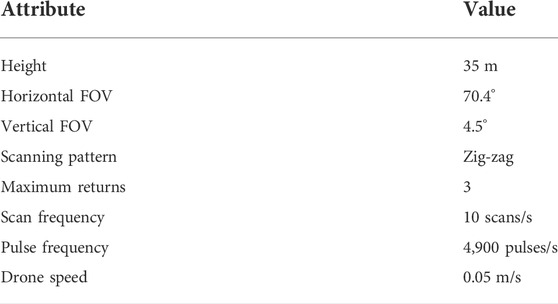
TABLE 1. Configuration of the virtual ALS sensor for scanning the synthetic trees, following the specifications of a DJI Zenmuse L1 LiDAR.
This subsection is described according to Figure 3, where six different graphs are computed throughout the framework. The input data for this description is based on synthetic LiDAR data acquired from trees without foliage. Despite virtual scans being performed over forests, the resulting point cloud is split into individual trees. In the following, the main stages for the construction of 3D tree skeletons are described:

FIGURE 3. Overview of our methodology involving four main steps: (A) the generation of synthetic LiDAR data from the scanning of the 3D procedural trees, (B) the stages aimed at the construction of the starting graphs, (C) the fusion and refinement methods based on the geodetic graph, and (D) the reduction of the previous results to generate the final skeleton.
Neighborhood graph (A). The first step for the tree skeleton extraction is to build a neighborhood graph, A. Thus, points are the graph vertices, where edges connect surrounding points. The neighborhood search is mainly performed through a range search, where all points below a certain distance are selected, or a KNN search that selects the k-nearest points. Despite KNN being robust to occlusion, the size of the neighborhood (k) does not take into account point distances, nor can receive an intuitive value. Therefore, it can mislead the algorithm whether the remaining noise points are grouped in a neighborhood. Instead, we perform a ranged search based on a radius r. However, this approach may obtain more than one connected component, whereas the tree skeleton is represented as a single connected component.
To solve the aforementioned problem, we can either increase r, or repair the connectivity of the skeleton due to using a smaller r. The second solution is preferred over the first approach for avoiding false branches, whereas a nearly optimal value of the radius, r, can be derived from the scanning frequency of the virtual LiDAR sensor. Regarding the algorithm complexity, the main challenge of neighborhood finding proceeds from time-consuming spatial searches. To accelerate this search, the point cloud is organized in a k-d tree. Finally, connected components in graph A are detected to link each vertex to its corresponding isolated component. At the end of this stage, each vertex is known to belong to an specific connected component, that is more likely to be isolated from others.
Minimum Spanning Tree (MST; B). Instead of computing the neighborhood graph, we can build the MST (B) to yield a single connected component. For that purpose, the point cloud is first triangulated with 3D Delaunay. With this representation, the graph vertices are given by points, whereas tetrahedron edges are used as graph edges for the subsequent MST computation. In our approach, the MST is built using the Prim’s greedy algorithm to find the minimal weighted undirected graph.
Fusion of Neighborhood and MST graphs (C). Previously generated graphs are fused to provide an automatic repair of disjoint connected components, while other methods perform it manually (Delagrange et al., 2014). More complex solutions based on cone searches on the tips of trunk and branches are also explored (Xu et al., 2007), although they depend on several parameters. During this process, each edge of graph B is evaluated by querying the connected component of source and destination vertices (extracted from graph A). If both vertices belong to different components, the missing edge is included in graph A as it is considered to be an error derived from occlusion. Consequently, the resulting graph, C, is composed of a single connected component once all edges are revised.
Geodesic Graph (D). Geodesic graphs have been widely used in previous work to reduce the point cloud to a skeleton, i.e., a set of lines starting from an origin point, also known as the base of the trunk. With the geodesic graph, the skeleton is defined as the graph of minimum distances to the origin point. Firstly, the origin point, po, is selected as the point with minimum height within the graph C.
To compute the distance from each point to the root, we apply the Dijkstra’s algorithm using the Euclidean distance for each edge. Consequently, we can extract a subset of edges that are part of a minimum distance path starting from the root point.
Distance clustering (E). Using the previously computed distance, vertices can be grouped according to their distance to the root, thus generating several bins. It can be parameterized either by defining a fixed number of intervals or a fixed segment length (slength). The first method limits the maximum depth of the tree graph, whereas a fixed length defines the resolution length of branches.
Collapsing clusters (F). We can simplify the graph by collapsing connected components within each distance group since a single bin may be composed of one or several components. To this end, nodes within a component are collapsed to its centroid. Finally, the edges of the final graph are formed by linking each node (centroid) to others that were previously connected.
In summary, our reconstruction requires only two parameters: the radius of the neighborhood search, r, and the length of branch segments for the distance clustering, slength. Figure 4 highlights the stages being part of the proposed methodology. Thus, the benefits of combining methods sensitive to occlusion and omitted parts of the branch due to sensor inaccuracies are here depicted. Accordingly, the MST stage discovers some of the links missed by radius-based algorithms.
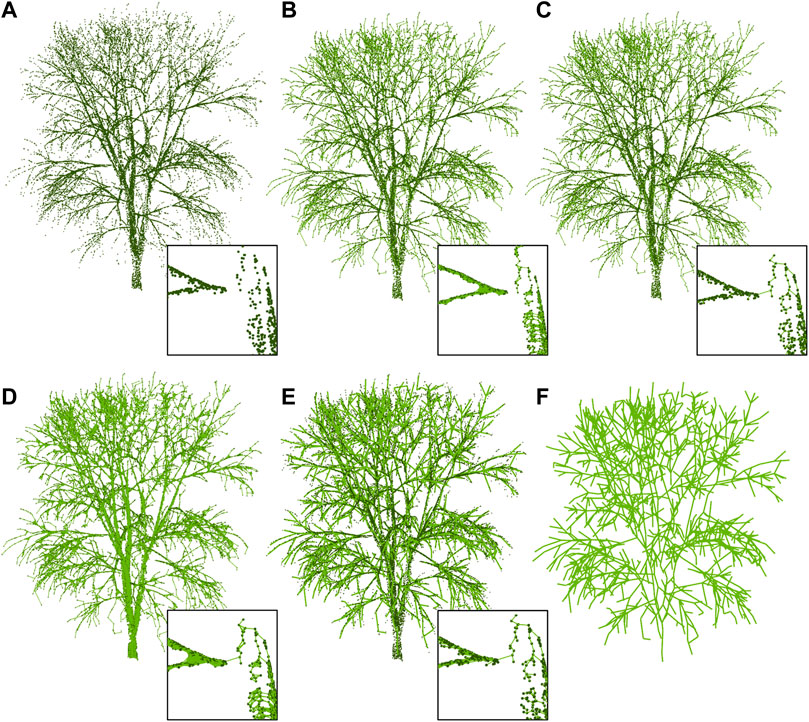
FIGURE 4. Results of the stages (A–F) that are part of our methodology for a single synthetic tree. In the MST stage, branch links not detected in the radius-search are discovered.
Previous research lacks precise evaluations for validating reconstruction results regarding both geometry and topology features. In this work, an evaluation method is proposed to obtain a global error measure. Our proposal is based on previous work (Boudon et al., 2014), though it is notably simplified by resampling skeletons. Instead of solely evaluating the reconstructed structure, we compare it against the ground-truth skeleton, and therefore this algorithm is better suited to synthetic data.
The algorithm resamples both tree skeletons using a fixed segment length (slength) that allows subdividing and comparing similar branch segments. The distance sampling is performed in order to transform the problem of finding the distance between two skeletons from continuous to discrete (Figure 5). Hence, slength is the quantization distance that we are using: the greater the value, the less precision we have. The starting length of both skeletons’ branches is unknown. Therefore, several casuistry must be considered, as highlighted in the next paragraph. The overall behavior computes the squared mean distance of each point from the source skeleton, s, to the nearest point of the target skeleton, t. Hence, such an error is bounded by
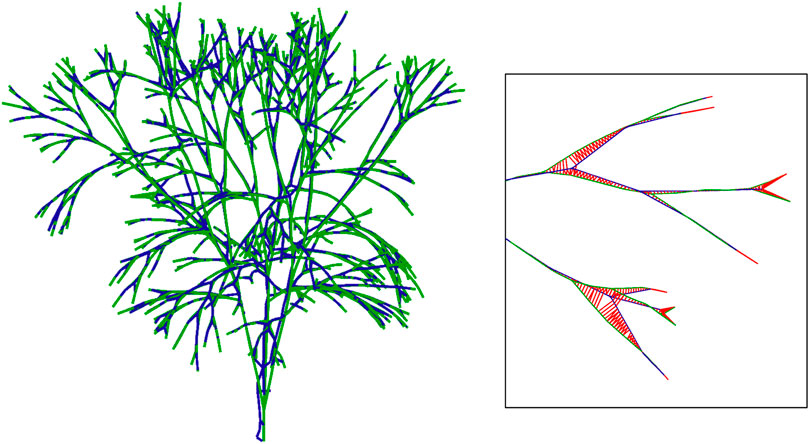
FIGURE 5. Comparison between the ground-truth skeleton (green) and our reconstructed skeleton (blue). The distance between the two skeletons is used as a quantitative evaluation of our method.
The resampling procedure follows a depth traversal approach to iterate through the graph, starting from the base. Thus, edges are added to the search iteratively, whereas branch segments are resampled according to slength. Note that subdivisions may carry some exceeding length from previous edges, as slength is not necessarily a multiple number of every branch segment length. Indeed, it varies throughout the skeleton and is unknown a priori. Whether slength is greater than the edge length, it can be omitted to propagate such length in deeper segments.
Once the source and target skeletons are resampled, the matching operation is performed. First, each vertex from the source skeleton is paired with the closest point on the target skeleton and vice versa. For each of these pairings, we compute the distance between the corresponding points. These distances are computed from the source to the target skeleton and are akin to a local error measure. Then, a global error metric for measuring the similarity of two skeletons is proposed as the aggregation of squared distances through an arithmetic mean. The bidirectional matching enables our error metric to penalize accordingly both added branches and deleted ones, that is, false branches that are not in the real tree and missing branches not reconstructed.
In this section, we present the results by applying our method on both synthetic and real LiDAR point clouds of trees. On the one hand, a set of simulated tree models is used to validate the resulting tree skeletons. Once, this tasks is carried out, our solution is tested on real LiDAR data which was collected in a real scenario.
The proposed method has been tested and assessed using the synthetic LiDAR point clouds, which were generated from a virtual LiDAR simulator. We assess the fidelity of the resulting skeleton with respect to ground-truth data from which the 3D model of the tree is generated. For that purpose, the aforementioned evaluation method is performed to measure the error between the source and resulting skeletons, as illustrated in Figure 5. The mean squared error by applying our method is compared to the results from the baseline method Delagrange et al. (2014) that also performs a manual topological adjustment. The method performance has been carried out in a PC with Intel Core i7-9700K 3.6 GHz, 16 GB RAM, GTX 1660 GPU with 6 GB RAM (Turing architecture). The proposed algorithm is implemented in C++ along with OpenGL (Open Graphics Library) for rendering. For the development of graph-related algorithms, the Boost Graph Library is used, whereas CGAL (Computational Geometry Algorithms Library) is used for the management of the point cloud.
The main parameter that determines the quality of results if the radius for searching those points that belong to the same branch. Therefore, both our algorithm and the baseline are tested by considering multiple radii. As the radius increases, the number of branches is reduced due to the merging of near branches whose distance is less than the radius. Consequently, the distance of the reconstructed branches to the ground truth skeleton increases, thus leading to also rise the error metric. Finally, we also report the response time of the complete procedure regarding point clouds of different dimensionality, following the previous algorithmic configuration.
Table 2 shows the results regarding the average and standard deviation obtained using the described evaluation method comparing ground-truth and reconstructed skeletons. The maximum error is achieved by small radius values (r ← 0.1) as it hardens the search of neighboring points within the same branch. Furthermore, it outputs disconnected components not reconstructed near the trunk, thus penalizing the whole tree. Figure 6 shows a graphical overview of the our method accuracy.
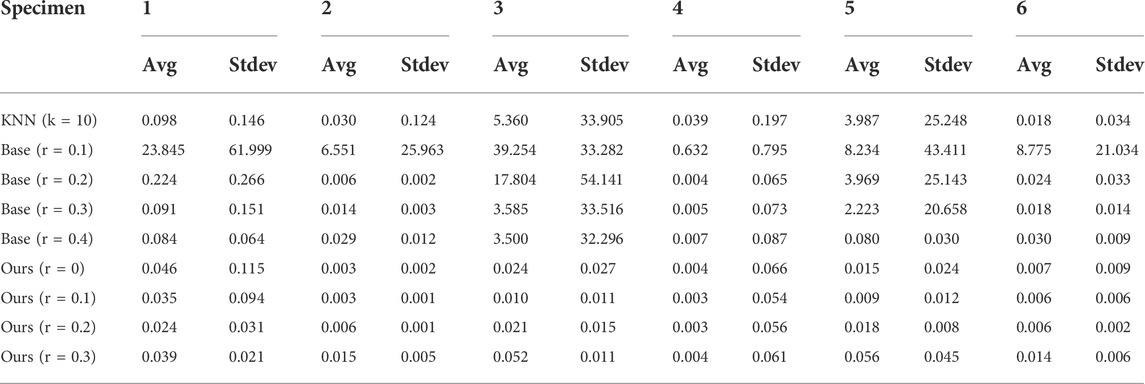
TABLE 2. The evaluation of six tree specimens. The results for each specimen are averaged over ten different trees generated with a different seed. The deviation metric for a specific specimen is also shown. The results should be interpreted in the local coordinate system of the tree models, where the unit expressed is the meter (m).
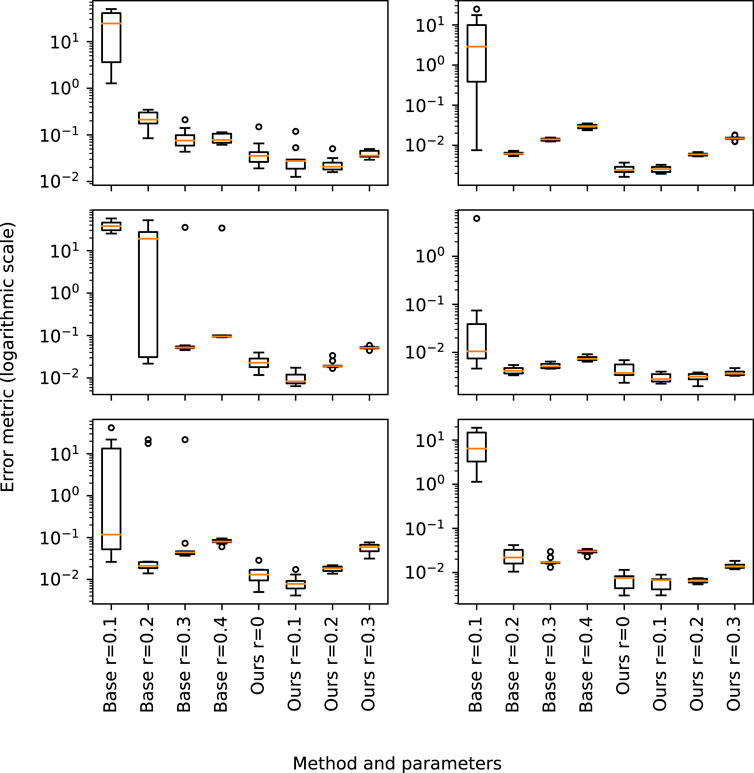
FIGURE 6. Graphical representation of the error shown in Table 2 for the set of tree specimens evaluated with the proposed metric.
Figure 7 shows the improvement in accuracy of our method with respect to the base method in the most appropriate radius range to detect an enough number of branches that make up the tree structure. The negative slope in the base method at low radii shows that there are disconnected components which are not connected to the main trunk, i.e., it has more than one connected component. Hence, the reconstruction is only performed on the main component, the one connected to the trunk base. However, the error metric also takes into account disconnected components, characterized by a large distance between them in the ground truth skeleton and the reconstructed one. Our method performs the connection using the MST, and therefore this error is reduced significantly. As the radius approaches the point resolution of the cloud (1 point for every 0.104m, 0.075 median, 0.07 mean), only far disconnected branches (due to occlusion) are not detected in the base method and thus penalized. Instead, our method connects them minimizing the branch length. Note that the shortest edges of the MST are contained in the neighbourhood graph. Hence, the resulting skeleton is equivalent whether the radius is increased both in the base and our method, and its greater or equal than the maximum edge length of the MST. This is due to the fact that all edges in the MST are contained in the neighbourhood graph, and augmenting such graph with the MST is a no-op.
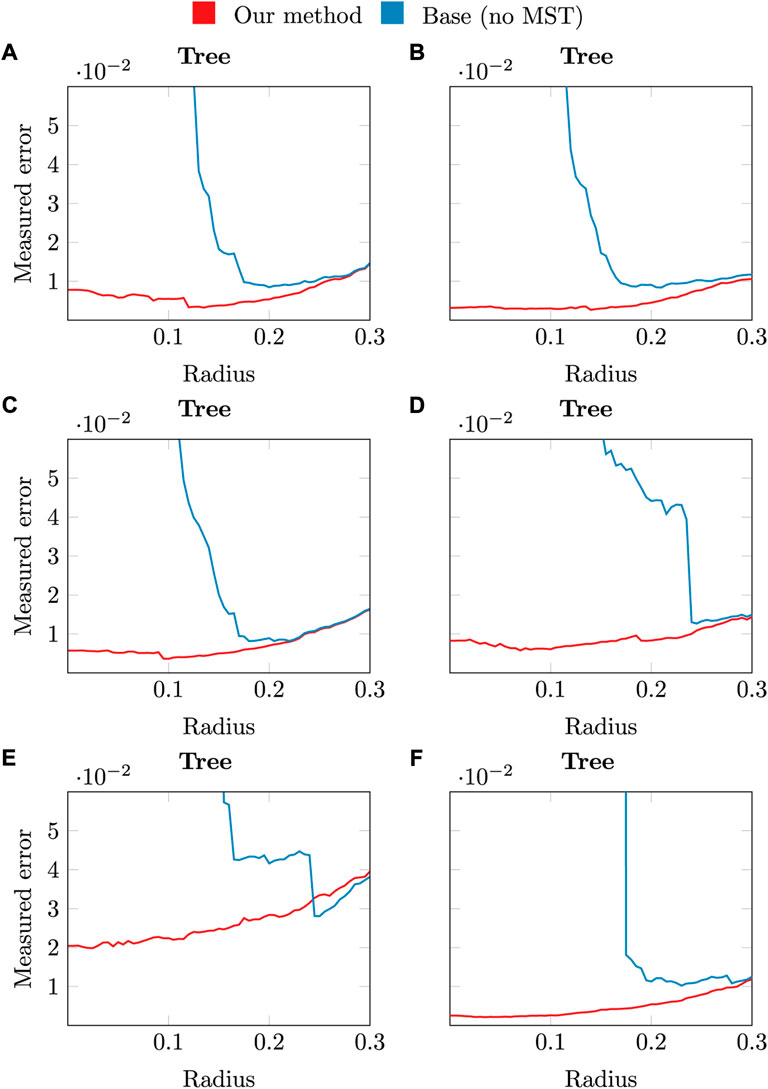
FIGURE 7. Graphical overview of the accuracy obtained by applying our method (red), or the base method (blue) with different radii.
According to the performance of the proposed method, Table 3 and Figure 8 show the execution time for the 3D reconstruction of the set of trees used before. When using r ≃ 0.0, our method works similarly to the base method with r ≃ 0.1, although it produces better results, since it leads to a single connected component. Therefore, the whole tree is reconstructed. Furthermore, our method presents a significant speedup for low radii, while it avoids performing the search with a larger radius.
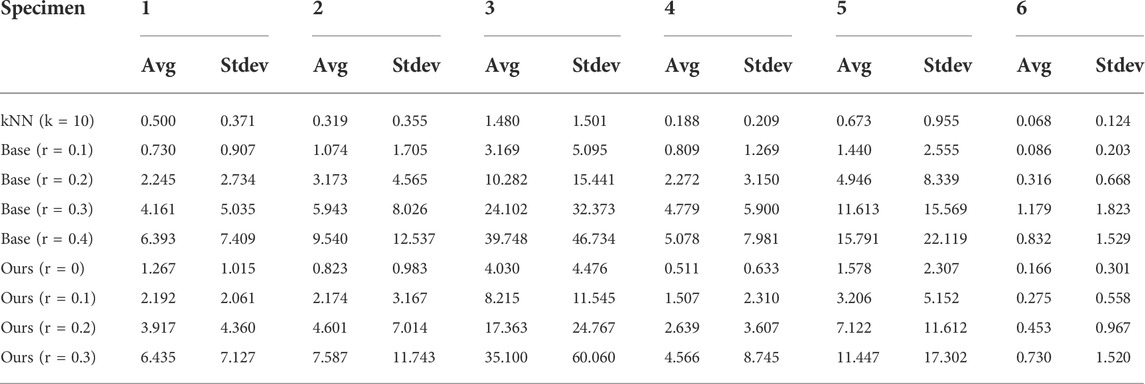
TABLE 3. Performance of the proposed method for six different specimens of trees. The mean and standard deviation are obtained by considering ten samples of each specimen.
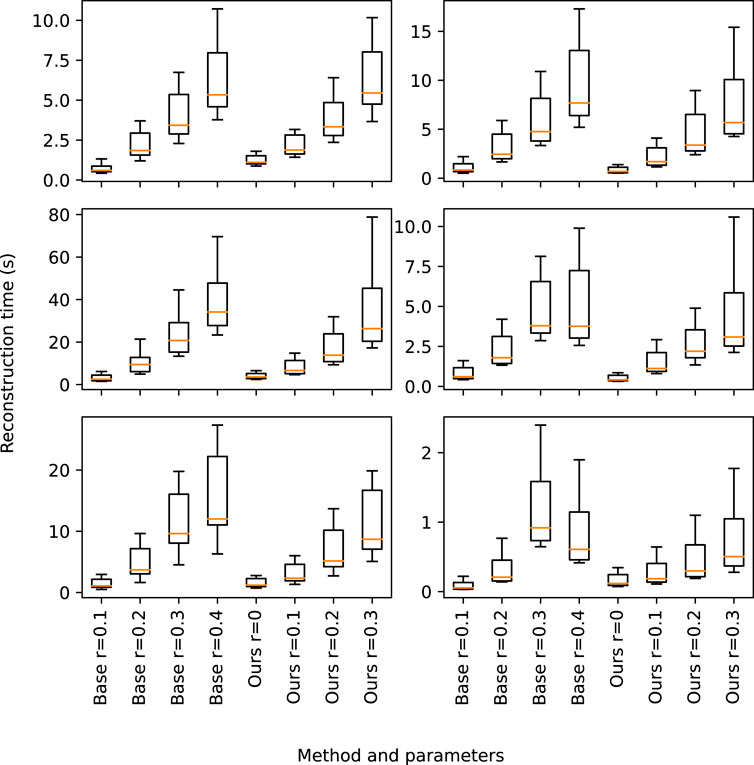
FIGURE 8. Graphical representation of the execution time shown in Table 3. Our method is compared with the base method considering different radii.
Once the method’s capabilities have been assessed on synthetic models, the next step is to use real 3D LiDAR data. For this purpose, we have used the available dataset from the 3D Forest project Trochta et al. (2017). This contains 26 trees with terrain, deadwoods, and other natural assets that have been generated by TLS in a small subplot (20 m × 40 m) of a larger forest area. Figure 9 shows the proposed reconstruction of the tree branching structures of a subset of surveyed trees.
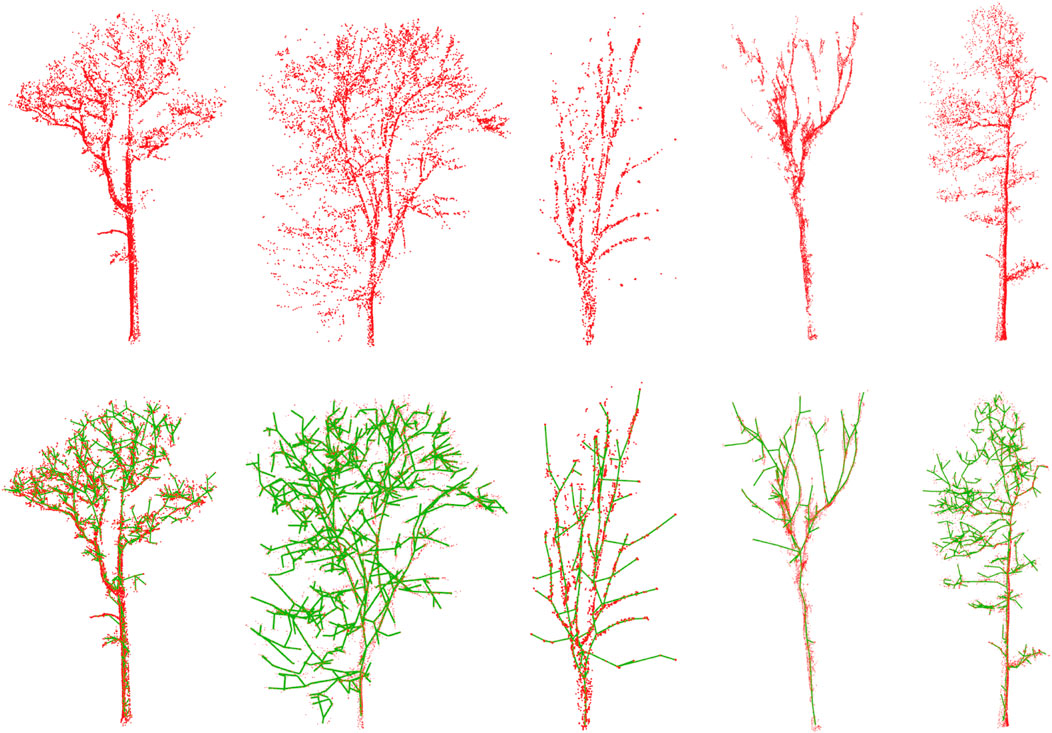
FIGURE 9. Our results for the 3D reconstruction of tree skeletons from scanned data. A set of five real tree specimens that were modeled from UAV-LiDAR sensors has been used.
In this work, we have presented a geometry-based method for tree reconstruction that handles occluded branch parts. Hence, this algorithm can be applied to ALS datasets with notable occlusion. The reconstruction method has been evaluated using a synthetic LiDAR point cloud dataset, obtained by performing a virtual scanning over procedurally-generated trees without foliage. Furthermore, the reconstruction is assessed through a metric that significantly simplifies previous approaches, while it yields similar results. Accordingly, we have shown that our method is able to handle missing branch segments, in comparison with previous work that solves this drawback manually or is only able to handle partial branch occlusion. Furthermore, our algorithm is solely parameterized by two attributes, the radius of the neighborhood search as well as the segment length for distance clustering.
In future work, we would like to extend the proposed method to multiple trees, thus solving this problem in parallel for multiple instances detected through hierarchical clustering approaches that use the MST (Gower and Ross, 1969; Jana and Naik, 2009). Furthermore, the method can be further improved with post-processing techniques for removing false branches, which were not covered in this work. Finally, occlusion handling may be improved by considering both longitudinal (complete branch segment) and spherical occlusion (partial occlusion in a branch segment). To this end, cylindrical shape detection could tackle the second occlusion case.
The raw data supporting the conclusion of this article will be made available by the authors, without undue reservation.
All authors listed have made a substantial, direct, and intellectual contribution to the work and approved it for publication.
This work has been partially funded through the research projects 1381202-GEU and PYC20-RE-005-UJA, which are co-financed by the Junta de Andalucía and the European Union FEDER funds. Moreover, this research is supported by the project PID2021-126339OB-I00 and doctoral grants to the first (FPU17/01902) and second author (FPU19/00100) funded by the Spanish Ministry of Science, Innovation and Universities.
The authors declare that the research was conducted in the absence of any commercial or financial relationships that could be construed as a potential conflict of interest.
All claims expressed in this article are solely those of the authors and do not necessarily represent those of their affiliated organizations, or those of the publisher, the editors and the reviewers. Any product that may be evaluated in this article, or claim that may be made by its manufacturer, is not guaranteed or endorsed by the publisher.
Andújar, D., Ribeiro, A., Fernández-Quintanilla, C., and Dorado, J. (2016). Using depth cameras to extract structural parameters to assess the growth state and yield of cauliflower crops. Comput. Electron. Agric. 122, 67–73. doi:10.1016/j.compag.2016.01.018
Binney, J., and Sukhatme, G. (2009). “3D tree reconstruction from laser range data,” in 2009 IEEE International Conference on Robotics and Automation, Kobe, Japan, 12-17 May 2009, 1321–1326. doi:10.1109/ROBOT.2009.5152684
Boudon, F., Preuksakarn, C., Ferraro, P., Diener, J., Nacry, P., Nikinmaa, E., et al. (2014). Quantitative assessment of automatic reconstructions of branching systems obtained from laser scanning. Ann. Bot. 114, 853–862. doi:10.1093/aob/mcu062
Bournez, E., Landes, T., Saudreau, M., Kastendeuch, P., and Najjar, G. (2017). “From TLS point clouds to 3D models of trees: A comparison of existing algorithms for 3D tree reconstruction,” in International archives of the photogrammetry, Remote sensing and spatial information sciences - ISPRS archives Nafplio, Greece: Elsevier Science, 42, 113–120. doi:10.5194/isprs-archives-XLII-2-W3-113-2017
Cao, C., Preda, M., and Zaharia, T. (2019). “3D point cloud compression: A survey,” in The 24th international conference on 3D web technology, Los Angeles, CA (New York, NY: Association for Computing Machinery), 1–9.
Cheng, Z.-L., Zhang, X.-P., and Chen, B.-Q. (2007). Simple reconstruction of tree branches from a single range image. J. Comput. Sci. Technol. 22, 846–858. doi:10.1007/s11390-007-9095-6
Delagrange, S., Jauvin, C., and Rochon, P. (2014). PypeTree: A tool for reconstructing tree perennial tissues from point clouds. Sensors 14, 4271–4289. doi:10.3390/s140304271
Du, S., Lindenbergh, R., Ledoux, H., Stoter, J., and Nan, L. (2019). AdTree: Accurate, detailed, and automatic modelling of laser-scanned trees. Remote Sens. 11, 2074. doi:10.3390/rs11182074
Fan, L., Smethurst, J. A., Atkinson, P. M., and Powrie, W. (2015). Error in target-based georeferencing and registration in terrestrial laser scanning. Comput. Geosciences 83, 54–64. doi:10.1016/j.cageo.2015.06.021
Fu, L., Liu, J., Zhou, J., Zhang, M., and Lin, Y. (2020). Tree skeletonization for raw point cloud exploiting cylindrical shape prior. Ieee Access 8, 27327–27341. doi:10.1109/ACCESS.2020.2971549
Gobeawan, L., Wise, D. J., Wong, S. T., Yee, A. T. K., Lim, C. W., and Su, Y. (2021). “Tree species modelling for digital twin cities,” in Transactions on computational science XXXVIII. Editors M. L. Gavrilova, and C. K. Tan (Berlin, Heidelberg: Springer), 17–35. Lecture Notes in Computer Science. doi:10.1007/978-3-662-63170-6_2
Gong, Y., Yang, Y., and Yang, X. (2018). “Three-Dimensional reconstruction of the virtual plant branching structure based on terrestrial LiDAR technologies and L-system,” in International archives of the photogrammetry, Remote sensing and spatial information sciences - ISPRS archives Beijing, China: Elsevier Science, 42, 403–410. doi:10.5194/isprs-archives-XLII-3-403-2018
Gorte, B., and Pfeifer, N. (2004). “Structuring laser-scanned trees using 3d mathematical morphology,” in Conference proceedings ISPRS in istanbul. Editor O. Altan (ISPRS), 35, 929–933.
Gower, J. C., and Ross, G. J. S. (1969). Minimum spanning trees and single linkage cluster Analysis. Appl. Stat. 18, 54–64. doi:10.2307/2346439
Guo, J., Jiang, H., Benes, B., Deussen, O., Zhang, X., Lischinski, D., et al. (2020a). Inverse procedural modeling of branching structures by inferring L-systems. ACM Trans. Graph. 39 (155), 1–13. doi:10.1145/3394105
Guo, J., Xu, S., Yan, D., Cheng, Z., Jaeger, M., and Zhang, X. (2020b). Realistic procedural plant modeling from multiple view images. IEEE Trans. Vis. Comput. Graph. 26, 1372–1384. doi:10.1109/TVCG.2018.2869784
Isokane, T., Okura, F., Ide, A., Matsushita, Y., and Yagi, Y. (2018). “Probabilistic plant modeling via multi-view image-to-image translation,” in Proceedings of the IEEE computer society conference on computer vision and pattern recognition (Salt Lake City, UT: IEEE), 2906–2915. doi:10.1109/CVPR.2018.00307
Jana, P. K., and Naik, A. (2009). “An efficient minimum spanning tree based clustering algorithm,” in 2009 Proceeding of International Conference on Methods and Models in Computer Science (ICM2CS), New Delhi, India, 14-15 December 2009, 1–5. doi:10.1109/ICM2CS.2009.5397966
Jaskierniak, D., Lucieer, A., Kuczera, G., Turner, D., Lane, P. N. J., Benyon, R. G., et al. (2021). Individual tree detection and crown delineation from Unmanned Aircraft System (UAS) LiDAR in structurally complex mixed species eucalypt forests. ISPRS J. Photogrammetry Remote Sens. 171, 171–187. doi:10.1016/j.isprsjprs.2020.10.016
Kuzelka, K., and Surovy, P. (2021). Mathematically optimized trajectory for terrestrial close-range photogrammetric 3D reconstruction of forest stands. ISPRS J. Photogrammetry Remote Sens. 178, 259–281. doi:10.1016/j.isprsjprs.2021.06.013
Lee, D., Muir, W., Beeston, S., Bates, S., Schofield, S. D., Edwards, M. J., et al. (2018). “Analysing forests using dense point clouds,” in 2018 International Conference on Image and Vision Computing New Zealand (IVCNZ), Auckland, New Zealand, 19-21 November 2018, 1–6. doi:10.1109/IVCNZ.2018.8634651
Li, B., Kałużny, J., Klein, J., Michels, D. L., Pałubicki, W., Benes, B., et al. (2021). Learning to reconstruct botanical trees from single images. ACM Trans. Graph. 40 (231), 1–15. doi:10.1145/3478513.3480525
Li, R., Bu, G., and Wang, P. (2017). An automatic tree skeleton extracting method based on point cloud of terrestrial laser scanner. Int. J. Opt. 2017, 1–11. undefined–undefined. doi:10.1155/2017/5408503
Livny, Y., Yan, F., Olson, M., Chen, B., Zhang, H., El-Sana, J., et al. (2010). Automatic reconstruction of tree skeletal structures from point clouds. ACM Trans. Graph. 29, 1–8. doi:10.1145/1882261.1866177
López, A., Anguita, C. J. O., and Higueruela, F. R. F. (2021a). A GPU-accelerated LiDAR sensor for generating labelled datasets. Málaga, Spain: The Eurographics Association. doi:10.2312/ceig.20211360
López, A., Jurado, J. M., Ogayar, C. J., and Feito, F. R. (2021b). An optimized approach for generating dense thermal point clouds from UAV-imagery. ISPRS J. Photogrammetry Remote Sens. 182, 78–95. doi:10.1016/j.isprsjprs.2021.09.022
López, A., Ogayar, C. J., Jurado, J. M., and Feito, F. R. (2022). A GPU-accelerated framework for simulating lidar scanning. IEEE Trans. Geosci. Remote Sens. 60, 1–18. doi:10.1109/TGRS.2022.3165746
Lopez, L., Ding, Y., and Yu, J. (2010). Modeling complex unfoliaged trees from a sparse set of images. Comput. Graph. Forum 29, 2075–2082. doi:10.1111/j.1467-8659.2010.01794.x
Lu, Y., Wang, Y., Chen, Z., Khan, A., Salvaggio, C., and Lu, G. (2021). 3D plant root system reconstruction based on fusion of deep structure-from-motion and IMU. Multimed. Tools Appl. 80, 17315–17331. doi:10.1007/s11042-020-10069-3
Neubert, B., Franken, T., and Deussen, O. (2007). Approximate image-based tree-modeling using particle flows. ACM Trans. Graph. 26, 88. doi:10.1145/1276377.1276487
Nită, M. D. (2021). Testing forestry digital twinning workflow based on mobile LiDAR scanner and AI platform. Forests 12, 1576. doi:10.3390/f12111576
Pandžić, J., Pejić, M., Božić, B., and Erić, V. (2017). Error model of direct georeferencing procedure of terrestrial laser scanning. Automation Constr. 78, 13–23. doi:10.1016/j.autcon.2017.01.003
Poux, F. (2019). The smart point cloud: Structuring 3D intelligent point data (Liege, Belgique: Université de Liege). Ph.D. thesis.
Reche, A., Martiny, I., and Drettakis, G. (2004). Volumetric reconstruction and interactive rendering of trees from photographs New York, NY: Association for Computing Machinery, 720–727. doi:10.1145/1186562.1015785
Rosell, J. R., Llorens, J., Sanz, R., Arnó, J., Ribes-Dasi, M., Masip, J., et al. (2009). Obtaining the three-dimensional structure of tree orchards from remote 2D terrestrial LIDAR scanning. Agric. For. Meteorology 149, 1505–1515. doi:10.1016/j.agrformet.2009.04.008
Shao, J., Zhang, W., Mellado, N., Wang, N., Jin, S., Cai, S., et al. (2020). SLAM-aided forest plot mapping combining terrestrial and mobile laser scanning. ISPRS J. Photogrammetry Remote Sens. 163, 214–230. doi:10.1016/j.isprsjprs.2020.03.008
Stava, O., Pirk, S., Kratt, J., Chen, B., Mech, R., Deussen, O., et al. (2014). Inverse procedural modelling of trees. Comput. Graph. Forum 33, 118–131. doi:10.1111/cgf.12282
Surovy, P., Yoshimoto, A., and Panagiotidis, D. (2016). Accuracy of reconstruction of the tree stem surface using terrestrial close-range photogrammetry. Remote Sens. 8, 123. doi:10.3390/rs8020123
Tan, P., Fang, T., Xiao, J., Zhao, P., and Quan, L. (2008). Single image tree modeling. ACM Trans. Graph. 27 (108), 1–7. doi:10.1145/1409060.1409061
Tan, P., Zeng, G., Wang, J., Kang, S. B., and Quan, L. (2007). Image-based tree modeling. ACM Trans. Graph. 26, 87. doi:10.1145/1276377.1276486
Tefera, A. T., Banerjee, B. P., Pandey, B. R., James, L., Puri, R. R., Cooray, O., et al. (2022). Estimating early season growth and biomass of field pea for selection of divergent ideotypes using proximal sensing. Field Crops Res. 277, 108407. doi:10.1016/j.fcr.2021.108407
Teng, C.-H., and Chen, Y.-S. (2009). Image-based tree modeling from a few images with very narrow viewing range. Vis. Comput. 25, 297–307. doi:10.1007/s00371-008-0269-1
Trochta, J., Krůček, M., Vrška, T., and Král, K. (2017). 3d forest: An application for descriptions of three-dimensional forest structures using terrestrial lidar. PLOS ONE 12, 0176871. doi:10.1371/journal.pone.0176871
Tu, Y.-H., Phinn, S., Johansen, K., Robson, A., and Wu, D. (2020). Optimising drone flight planning for measuring horticultural tree crop structure. ISPRS J. Photogrammetry Remote Sens. 160, 83–96. doi:10.1016/j.isprsjprs.2019.12.006
Walter, J. D. C., Edwards, J., McDonald, G., and Kuchel, H. (2019). Estimating biomass and canopy height with LiDAR for field crop breeding. Front. Plant Sci. 10, 1145. doi:10.3389/fpls.2019.01145
Wang, Y., Zhang, X., and Guo, Z. (2021). Estimation of tree height and aboveground biomass of coniferous forests in North China using stereo ZY-3, multispectral Sentinel-2, and DEM data. Ecol. Indic. 126, 107645. doi:10.1016/j.ecolind.2021.107645
Wang, Z., Zhang, L., Fang, T., Mathiopoulos, P. T., Qu, H., Chen, D., et al. (2014). A structure-aware global optimization method for reconstructing 3-D tree models from terrestrial laser scanning data. IEEE Trans. Geosci. Remote Sens. 52, 5653–5669. doi:10.1109/TGRS.2013.2291815
Weber, J., and Penn, J. (1995). “Creation and rendering of realistic trees,” in Proceedings of the 22nd annual conference on computer Graphics and interactive techniques (New York, NY, USA: Association for Computing Machinery), 119–128. SIGGRAPH ’95. doi:10.1145/218380.218427
Xu, H., Gossett, N., and Chen, B. (2007). Knowledge and heuristic-based modeling of laser-scanned trees. ACM Trans. Graph. 26, 19–es. doi:10.1145/1289603.1289610
Zhang, X., Li, H., Dai, M., Ma, W., and Quan, L. (2014). Data-driven synthetic modeling of trees. IEEE Trans. Vis. Comput. Graph. 20, 1214–1226. doi:10.1109/TVCG.2014.2316001
Zhu, C., Zhang, X., Jaeger, M., and Wang, Y. (2009). “Cluster-based construction of tree crown from scanned data,” in 2009 Third International Symposium on Plant Growth Modeling, Simulation, Visualization and Applications, Beijing, China, 09-13 November 2009, 352–359. Proceedings - PMA09. doi:10.1109/PMA.2009.19
Keywords: tree reconstruction, LiDAR, point cloud, 3D Modeling, mesh generation, forest structure
Citation: Cárdenas JL, López A, Ogayar CJ, Feito FR and Jurado JM (2022) Reconstruction of tree branching structures from UAV-LiDAR data. Front. Environ. Sci. 10:960083. doi: 10.3389/fenvs.2022.960083
Received: 02 June 2022; Accepted: 10 October 2022;
Published: 02 November 2022.
Edited by:
Huikyo Lee, NASA Jet Propulsion Laboratory (JPL), United StatesReviewed by:
Milad Janalipour, Aerospace Research Institute, IranCopyright © 2022 Cárdenas, López, Ogayar, Feito and Jurado. This is an open-access article distributed under the terms of the Creative Commons Attribution License (CC BY). The use, distribution or reproduction in other forums is permitted, provided the original author(s) and the copyright owner(s) are credited and that the original publication in this journal is cited, in accordance with accepted academic practice. No use, distribution or reproduction is permitted which does not comply with these terms.
*Correspondence: Juan M. Jurado, amp1cmFkb0B1amFlbi5lcw==
Disclaimer: All claims expressed in this article are solely those of the authors and do not necessarily represent those of their affiliated organizations, or those of the publisher, the editors and the reviewers. Any product that may be evaluated in this article or claim that may be made by its manufacturer is not guaranteed or endorsed by the publisher.
Research integrity at Frontiers
Learn more about the work of our research integrity team to safeguard the quality of each article we publish.