 Ye Wang1
 Li Li
Li Li- 1Department of Management, Tianjin Normal University, Tianjin, China
- 2School of Economics and Management, Tianjin University of Science and Technology, Tianjin, China
Based on the emission trading scheme (ETS), this study built a design framework of renewable energy support policies (RES), which is employed to assess the interaction between RES and ETS. For RES, we consider two policy instruments: feed-in-tariff (FIT) and renewable portfolio standards (RPS). Based on the partial equilibrium model, taking the case of China’s electricity market, this study quantitatively discusses the implementation effects of six different policy mix scenarios from three aspects: emission reduction, production of green electricity, and social welfare. According to the results, there were big differences among the implementation effects of different RES instruments based on ETS. The renewable subsidy policy, on the whole, is better than renewable portfolio standards in terms of emission reduction, but worse in terms of improving the production of green electricity. In addition, different from the renewable subsidy policy, the renewable portfolio standards can reduce social welfare. When the emission quota is eased, RES can be implemented to significantly improve social welfare. These simulation results inspire China for the design of effective energy policies.
1 Introduction
In recent years, energy shortage and environmental pollution have become increasingly serious, and the energy transition by promoting, developing, and utilizing renewable energy sources has become a consensus and concerted action of the international community (IEA, 2020). However, due to immature technologies and the high cost of renewable energy sources, its market competitiveness is weak. To support the development of the renewable energy industry, many OECD countries have implemented different types of renewable energy support policies. For example, the renewable energy feed-in-tariff (FIT), renewable portfolio standards (RPS), and other policies that can directly stimulate the installed capacity of renewable energy. Different from FIT where a fixed amount of money is paid for each kWh of green electricity, RPS compulsorily stipulates the market share of green electricity in the form of law. Fossil fuel power generation companies can meet RPS by purchasing renewable energy credits (RECs) from the green electricity generation companies or paying heavy fines; thus REC is a policy instrument to implement RPS. Moreover, an emission trading scheme (ETS) is also widely applied. Although it was not specifically designed for renewable energy, it can indirectly stimulate investment in renewable energy by increasing the cost of fossil energy. Since 2013, the Chinese government has formulated a series of policies for the production of green electricity and determined RES as a key component of its development plan (Mischke and Karlsson, 2014; Wang et al., 2014).
Among many renewable energy support policies, FIT is considered to be more effective because it can provide investors with long-term financial stability, but the high cost of subsidies imposes a heavy financial burden on the governments (Zhang et al., 2018). To reduce the aforementioned burden, RPS and REC become alternatives in different jurisdictions (Zhou and Zhao, 2021). Meanwhile, REC can bring economic incentives to cost-effective renewable energy companies, but there is still the risk of price volatility. When the primary goal is reducing emissions, a single RES-E policy (whether FIT or RPS) is always less cost-effective than a carbon pricing policy (Palmer and Burtraw 2005; Fischer and Newell 2008). Some scholars point out that a single policy cannot effectively meet multiple policy goals at the same time (Fischer and Carolyn, 2010). The successful transition to a low-carbon economy depends on the joint effect of low-carbon technology investment and renewable energy development, so it is necessary to adopt policy mixes (Gugler et al., 2021). But due to the volatility and intermittency of RES, these policies may restrain each other to some extent.
To avoid the possible negative effects or to take advantage of the potential synergistic effect of multiple policies, it is necessary to understand how different policy mechanisms interact with each other. In the case of two competing energy sources, which policy can bring more renewable energy investment, lower carbon emissions, and higher social welfare? How does the emission cap in ETS affect the implementation effect of renewable energy support policies? If the goal of the government is to raise the renewable energy share, what does the impact of the subsidy instruments and market mean? However, these issues are seldom talked about in current studies (Kök et al., 2018).
The research objective of this study is to quantify the effectiveness and interaction of ETS and renewable energy support policies. First of all, we built a partial equilibrium model to discuss the interaction mechanisms between ETS and renewable energy support policies. Then, we, combining the theoretical model and numerical model and taking the case of China’s electricity market, assessed the performances of different policies in emission reduction, production of green electricity, and social welfare. According to the model result, there were big differences among the implementation effects of different renewable energy support policy instruments based on ETS. The renewable subsidy policy is better than RPS in terms of emission reduction and social welfare, but less effective in terms of improving the production of green electricity.
The rest of this study is organized as follows: the second part introduces the studies on ETS and renewable energy support policies conducted by domestic and foreign scholars. The third part presents the analytical model and describes the supply and demand situation of the electricity market under different policy scenarios as well as the decision-making behavior of two major market players—producers and consumers. The fourth part describes the numerical model and method design. The fifth part discusses the results, and the sixth part draws a conclusion and gives policy implications.
2 Literature review
Domestic and foreign scholars have conducted a series of studies on ETS and renewable energy support policies. First, according to the investigations and research, ETS alone cannot realize the emission reduction and energy objective. Second, we reviewed the necessity, implementation effects, and interactions of the policy mixes.
The economic theory clearly emphasizes that market means should be made full use of to fix a price for social losses caused by greenhouse gas emissions, which will help to stimulate the internalization of externalities of carbon emissions (Pigou, 1920). Therefore, many economists (Branger et al., 2015; Metcalf, 2009) have always considered the emission trading scheme (ETS) as an important emission reduction instrument for a long time, because it can realize emission reduction at the lowest cost. In the real world, however, there are many restrictions on making environmental policies. The economically effective and optimal emission trading market requires a valid high carbon price, which is difficult to realize. This is also proven by the empirical evidence from the EU emission trading market (Perino and Jarke, 2015). The supply–demand imbalance of emission quotas and various uncertainties in the electricity market lead to a low carbon price (Lecuyer and Quirion, 2016). Therefore, ETS alone is not enough to stimulate emission reductions (IEA, 2020). The energy transition requires the deployment of green electricity, but ETS has a limited effect on renewable energy development and cannot provide sufficient incentives for technological innovation. Another reason why ETS is not enough is that ETS is indirect. Firms can also decarbonize by using efficiency measures or switching fuel (e.g., from coal to gas). Firms can even reduce their production to decarbonize, especially under the historical allocation mechanism. On the demand side, many of them only have such measures. For electricity firms, it is the same. Furthermore, under the historical allocation mechanism in ETS, the production reduction of the steel sector can lead to a lower carbon price and reduce the renewable investment in the electricity sector. The experience of the EU tells us that apart from ETS, a specific renewable energy objective is also needed (Schmidt et al., 2012).
To achieve multiple policy goals, it is particularly important to mix ETS and renewable energy support policies (Duan et al., 2018). However, the effect of policy mixes has always been a focus of controversy in academic circles. Many scholars have considered the synergistic effect between ETS and renewable energy support policies and confirmed the importance of policy mixes to achieve desired emission reduction and energy objectives in the most cost-effective manner (Cheng et al., 2016; Fan et al., 2016). Some studies employed the computable general equilibrium model or partial equilibrium model to assess the social and economic impact of policy mixes. For example, some scholars have discussed the interaction between emission cap and REC or the interaction between emission cap and FIT (Böhringer and Behrens, 2015; Jos, 2005). Lots of quantitative studies have shown that although policy mixes can reduce social welfare and cause GDP losses, they can more efficiently reduce the electricity generation from fossil fuels and increase the production of RE, thus promoting the energy transition (Mu et al., 2017; Wu et al., 2017; Wu et al., 2020). There are some similar viewpoints that the policy mixes can help to realize deep decarbonization of energy systems quickly (Hepburn et al., 2020; Rosenbloom et al., 2020).
However, mixed policies may also cause conflicts and even lead to the failure of some policy instruments, thus increasing the social cost of policy implementation. Some scholars pointed out that the impact of renewable energy support policies on ETS should be admitted (Fischer et al., 2010). The implementation of renewable energy support policies can help ETS meet the emission cap and reduce the carbon price, which is thus relatively beneficial to fossil energy. In some studies, it is believed that excessive renewable energy objectives will restrain the demand for carbon emission quotas, thus leading to a low carbon price (Nordhaus, 2011; Berghet al., 2013; Lindberg, 2019). Similarly, the trials of ETS in China also show that the risk of emission quota over-allocation may lead to a drop in carbon price and reduce market efficiency (Wu et al., 2017). Therefore, to achieve climate goals and low-carbon transition, we must fully understand the interaction mechanism between different policies and give play to the advantages of each policy instrument, which is of great significance for China to achieve carbon peak and carbon neutrality.
To sum up, it is necessary and important to study policy mixes, but most of the previous studies focused on quantitative research and ignored the theoretical discussion. Specifically, there is no study on the interaction between China ETS and renewable energy support policies. Based on the partial equilibrium model, this study analyzes how ETS and different renewable energy support policies affect the game behavior of market players. In addition, based on China’s electricity market, it simulates CO2 emissions, production of green electricity, and social welfare under different policy scenarios, which inspires China’s design of energy policies.
3 Theoretical model
3.1 Policy description
To explore the interaction mechanism between renewable energy support policies and carbon emission trading, we built a partial equilibrium model and described the supply and demand situation of the electricity market as well as two major market players—producers and consumers—and their decision-making behaviors. The following policies are involved in the model.
An emission trading scheme refers to a mechanism where a certain number of emission credits are assigned to the participants. These credits thus become a commodity, which can be “consumed” by the participants themselves or “traded” with others in the carbon market, which depends on the marginal abatement cost. As a market-driven instrument, it first sets emission caps and then fixes a price for CO2 produced by burning fossil fuels. Feed-in tariff (FIT), also known as renewable subsidy policy, means that the governments give subsidies for each kWh of electricity to renewable energy power generators (such as PV electricity generators, wind electricity generators, etc.). Many countries have adopted this policy to support and stimulate the green electricity markets at an early stage (such as several member states of the EU, Australia, and several states of the United States). Because high policy cost is needed to implement the renewable subsidy policy, it is not as good as the marketized instruments in the long run and the policy should gradually retreat. To reduce the financial burden caused by subsidies, renewable portfolio standards (RPS) and purchased renewable energy credits (REC) are two alternative market instruments. Green electricity generation companies can make extra profit by selling purchased renewable energy credits.
In the model, the electricity price depends on the supply–demand relationship in the state of equilibrium. ETS can affect the production cost of fossil fuel companies through the carbon price. Renewable energy support policies can change the equilibrium price and production by affecting the electricity generation cost and electricity demand. By comparing the differences among carbon emissions, production of green electricity, and social welfare, we can assess the impact of policies on the economy, environment, and society.
3.2 Behavior of market players
3.2.1 Electricity generators
When fossil fuels are used to generate electricity, pollutants are discharged, leading to environmental externalities. In such a case, the policymakers need to choose the optimal policy instrument to realize the externality, and such intervention is bound to affect other economic agents in the market. The electricity generators are all in pursuit of profit maximization. They will measure the marginal cost and marginal revenue of electricity generation according to policymakers’ decisions and then adjust their production
Suppose that the production cost functions of each technology
In this function,
In this function,
That requires that a certain share of
In an ETS system,
When the emission cap
3.2.2 Consumers
Consumers are always in pursuit of utility maximization, but since China’s electricity price is regulated by the government, it can be considered that changes in demand will not lead to significant changes in electricity price. Although the functional relationship between electricity price in the market and electricity demand is not clear, there is still a functional relationship between electricity price in the market
If the inverse demand function is defined as
In this function,
3.3 Supply–demand equilibrium model of electricity
First, a perfectly competitive market with symmetric information was assumed in the model (Lecuyer and Quirion, 2016). Second, we considered two technological types of electricity companies
Considering the intermittency of renewable energy resources, the electricity generation from wind and solar energy is greatly affected by weather conditions and geographical location, so
In a perfectly competitive market, no company will be hindered from entering or leaving the market, and no seller or buyer can determine the price, which meets Pareto optimality. In the equilibrium model, the production costs and benefits of electricity generators determine the production of each technology
For carbon-free technologies:
where
3.4 Social welfare maximization
When analyzing the interaction between renewable energy support policies and ETS, we mainly examined the ability to solve the pollutant externalities under two policy scenarios. In a decentralized market economy, the equilibrium decision of energy supply and demand depends on utility maximization for consumers and profit maximization for electricity generators. Therefore, policymakers should focus on social welfare maximization. The social welfare function is as follows (Lecuyer and Quirion, 2016; Abrell et al., 2019):
4 Empirical quantitative framework and results
4.1 Description of numerical model
To quantify the implementation effect of the policy mixes, we built a numerical model which was calibrated with data about China’s electricity market in 2018. First of all, we found out the differences between different electricity generation technologies
4.2 Data sources and explanation
Taking the case of China’s electricity market in 2018, we conducted an empirical analysis based on the aforementioned theoretical model. In the model, the following parameters are required:
According to the data about carbon intensity, compared with Germany, the carbon intensity of China’s coal electricity plants and the electricity market is dominated by coal electricity in China, which partly contributes to the high ratio of China’s carbon emissions over global carbon emissions. Later, we obtained data about China’s social cost of carbon (Ricke et al., 2018; Tianet al., 2019). Last, the production cost functions and emission cost functions of various technologies were obtained (Abrell et al., 2019; Liu et al., 2014; Feng et al., 2018). Through the calibration unit, we obtained the electricity demand function (Liu et al., 2019; Lin and Purra, 2019; Pu et al., 2020). The aforementioned data were all calibrated again in the numerical model.
4.3 Design of empirical methods
Based on the partial equilibrium model, we made use of the mixed complementarity formula to describe China’s electricity supply–demand market. All nonlinear inequalities can be divided into two kinds: zero profit and market clearing, which form complementary conditions with production
In addition, we need to explain some parameters in the model. The emission cap
4.4 Basic settings of the model
4.4.1 Policy scenarios and benchmark setting
In the empirical analysis, we assessed the interaction between ETS and two alternative renewable energy support policies—purchased renewable energy credits (REC) and renewable subsidy policy. Later, we considered the efforts to implement each renewable energy support policy and divided them into different policy scenarios. The specific scenarios are shown in Table 2. Scenario 1 and Scenario 2 differ in mandatory market share in RPS: S1 = 0.08 and S2 = 0.1. Scenario 3, Scenario 4, and Scenario 5 differ in the amount of policy in renewable subsidy policy: S4 = 0.1, S5 = 0.2, and S6 = 0.3. Moreover, ETS alone is used as the benchmark in this study to compare the different policy scenarios.

TABLE 1. Variables and parameters in the analysis model.
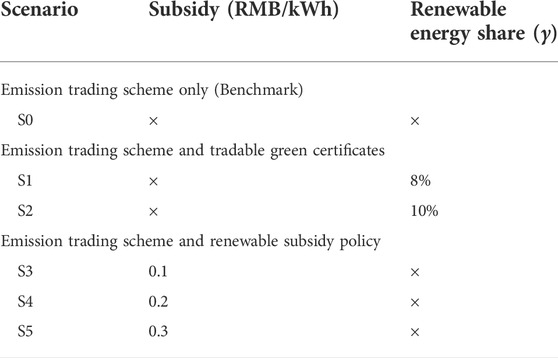
TABLE 2. Policy scenarios.
4.4.2 Scale setting
As shown in Figures 2, 5, to better show the changes in CO2 emissions during the implementation of policy mixes compared with those during the implementation of ETS alone,
As shown in Figures 1, 3, 4, % is defined in this study, which represents the changing rate of CO2 emissions, production of green electricity, and social welfare under the policy mix scenarios S1–S5 compared with benchmark scenario S0, namely,
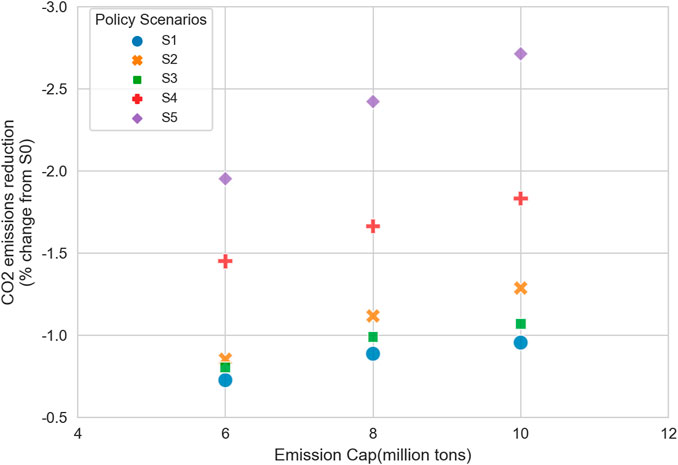
FIGURE 1. CO2 emissions under different policy scenarios.
5 Analysis of empirical results
5.1 CO2 emissions
Figure 1 shows the changes in emission reduction in scenarios S1–S5 compared with benchmark scenario S0. According to this figure, we can see that when the emission cap is relatively stringent, implementing ETS and renewable energy support policies at the same time may promote emission reduction more than implementing ETS alone, but the effect varies according to the types of RES and the efforts to implement the policy. The emission reduction effect of implementing renewable subsidy policy (S3–S5) is generally better than that of RPS and RECs (S1, S2), and the greater the subsidy amount and the higher the mandatory market share, the better the emission reduction effect. When the cap is 10 million tons, the emission reduction ratio of S1 and S2 is between 0.9% and 1.3%, while that of S3–S5 is between 1% and 2.8%.
In fact, the subsidies could decrease the carbon price. As shown in Supplementary Table S1, for the same cap, the carbon price decreases with the increase of subsidies. The more renewables are deployed, the greater the impact on the carbon price. According to the scenarios of S1–S5, the proportions of renewables in the FIT scenarios are much less than in the RPS scenarios, so the former leads to higher carbon prices than the latter. For example, when the cap = 6 million tons and the tariff is 0.5 RMB, the shares of green electricity are just 2.04%. This is far lower than the green certificate case, which is at least 8.02% under the same cap, see Supplementary Tables S1, S3. The descending carbon price encourages coal-fired generation; therefore, the emission reduction ratio of S1 and S2 is lower than those of the scenarios of S3–S5.
5.1.1 The implementation effect of ETS mixed with FIT
Figure 2 more clearly shows the interaction between renewable subsidy policy and the emission cap. However, whether FIT policies actually contribute to CO2 reduction when overlapping with an ETS is a question. Under the mixed policy scenario of renewable energy subsidies and carbon market at the same time, through the interaction between subsidy price and emission cap, we find that the results are divided into the following two cases:
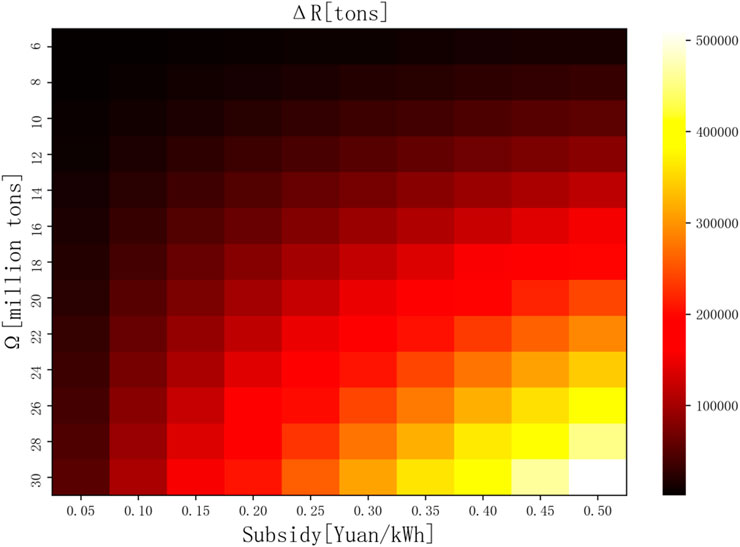
FIGURE 2. Carbon emissions of subsidy and carbon market combination policy.
On the one hand, when the emission cap of the carbon market is very loose, the carbon price will be much less than the social cost of carbon (SCC) (SCC = 156 RMB/ton,
However, with the high subsidy level combined with the loose emission cap, the situation is unclear. In this situation, the carbon price may be much lower, and high subsidies exacerbate this situation. Since the dirtier coal-fired generation benefits from the carbon price decrease, to maintain the same level of emissions, it must decrease natural gas generation more than coal-fired generation. Meanwhile, the emissions may exceed the alternative emission reductions which brought about encouraging renewable deployments. Just as shown in Figure 2, when the cap = 30 million tons, the emission in the case of 0.50 yuan/kWh is surprisingly higher than that of the 0.05 yuan/kWh. Moreover, with the increase in the amount of subsidies, the emission reduction effect will be more significant, but at the same time, it will require greater policy costs.
On the other hand, when the cap is strictly stringent, the carbon price will be approximately equal to 156 RMB/ton. Since implementing ETS alone can achieve the theoretically optimal emission reduction effect, it is unreasonable to implement a subsidy policy at the same time.
5.1.2 The emission reduction path of ETS mixed with FIT
The emission reduction path of scenarios S3–S5 where ETS and FIT are implemented at the same time is shown in Table 3. Under benchmark scenario S0, the production of coal electricity is 17,789.941 TWh, that of natural gas electricity is 6,263.900 TWh, that of wind electricity is 101.627 TWh, and that of photoelectric power is 90.260 TWh. We found two reasons for this:

TABLE 3. Electricity generation.
First, S3–S5 promote fuel conversion among fossil fuels, realizing the transition from high-emission coal electricity generation to natural gas electricity generation. After the introduction of a subsidy policy based on the emission cap control alone, cap = 6 million tons, S = 0.1 RMB/kWh, the terminal demand increases by 0.9%. This part of electricity demand is mainly met by electricity generated from natural gas, supplemented by wind electricity and PV electricity, while the proportion of coal electricity decreases.
Second, S3–S5 promote an increase in the production of renewable energy, so that renewable energy can replace fossil fuels. According to the results of the model, compared with wind electricity, the increase in the production of PV electricity is more significant, which is because the investment in wind electricity generation is larger than that in PV electricity generation. If they are given the same amount of subsidies without considering different renewable energy technologies, the investors may invest more in the PV industry, thus making the proportion of the increase in production of PV electricity larger. For example, when the cap is 6 million tons, as the amount of subsidy gradually increases to 0.3 RMB/kWh from 0.1 RMB/kWh, the proportion of the increase in production of PV electricity becomes 4.416% and that of wind electricity becomes 1.737%. Therefore, when implementing the subsidy policy, the government should take both policy cost and investment benefit into account and implement differentiated subsidies for different renewable energy technologies.
5.1.3 The carbon emissions of ETS mixed with RPS
The performance of the mixed policy of the green certificate and carbon market in carbon emissions are further discussed in the following. As shown in Figure 3, with the increase of the proportion of green electricity, the emission reduction has a fluctuation phenomenon of first decreasing and then increasing, then decreasing and then increasing again. For example, when cap = 6 million tons, when the proportion
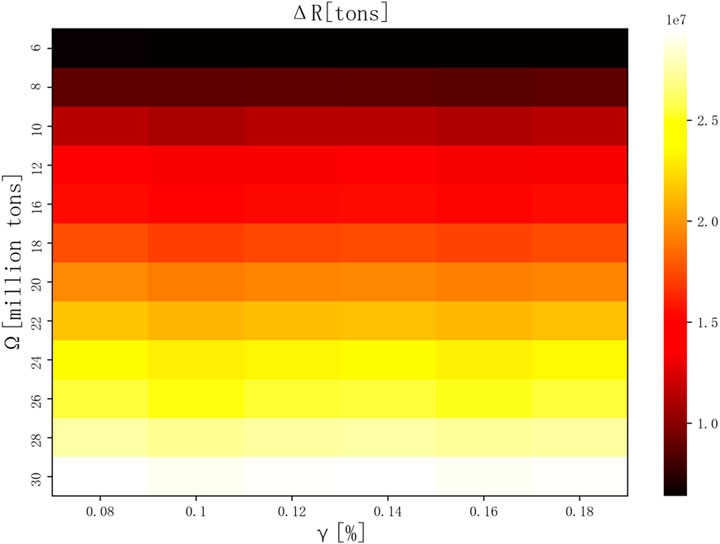
FIGURE 3. Carbon emissions of green credits and carbon market combination policy.
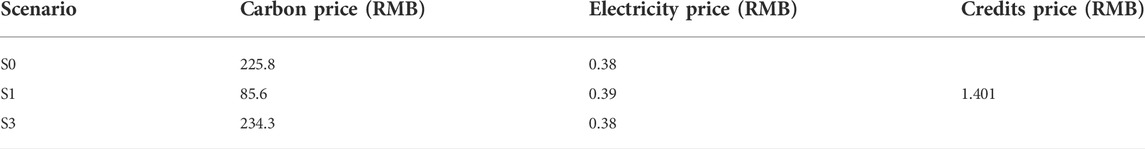
TABLE 4. Comparison of policy scenarios.
Lastly, we will explain why the emission reduction effect in S1 and S2 are lower than those of S3–S5 on the whole. There might be two reasons: under scenarios S1 and S2, the carbon price is relatively low and the natural gas electricity generation transits to coal electricity generation within the fossil fuels. In some studies, some scholars believe that excessive renewable energy objectives will restrain the demand for carbon emission quotas, thus leading to a low carbon price (Lindberg et al., 2019). This is consistent with the results of the model. As shown in Table 4, the lower case is compared. S0, S1, and S3 deliver similar green electricity generation while leading to quite different carbon prices. For example, the carbon price under scenarios S1 = 85 RMB/ton, far lower than S0 and S3. Moreover, the mandatory renewable energy share will make investors invest in renewable energy electricity generation, which will lead to underinvestment in natural gas electricity generation. However, wind electricity generation and PV electricity generation are intermittent, so backup coal electricity generation units are required for peak-load regulation. At last, the result might be over-reliance on backup (coal-fired) generators (Aflaki and Netessine, 2017), which is consistent with the results of the model. According to the results of the model, when the share of green electricity increased from 10% to 12%, the share of coal electricity increased by 2%.
5.2 Production of green electricity
Figure 4 presents the changes in the production of green electricity under scenarios S1–S5 compared to benchmark scenario S0. We can see that compared with S0, all scenarios S1–S5 can improve the production of green electricity, among which S1 and S2 have better effects. When cap = 10 million tons, increasing proportion under scenarios S1 and S2 ranges from 13% to 18%, while that under scenarios S3–S5 ranges from 8% to 15%. In addition, we can find that S1 and S5 have similar effects on increasing the production of green electricity, but S5 has higher policy costs and cannot solve the long-term incentive problem in the development of the renewable energy industry. Therefore, with a similar effect, REC, as a marketized instrument, maybe a better choice.
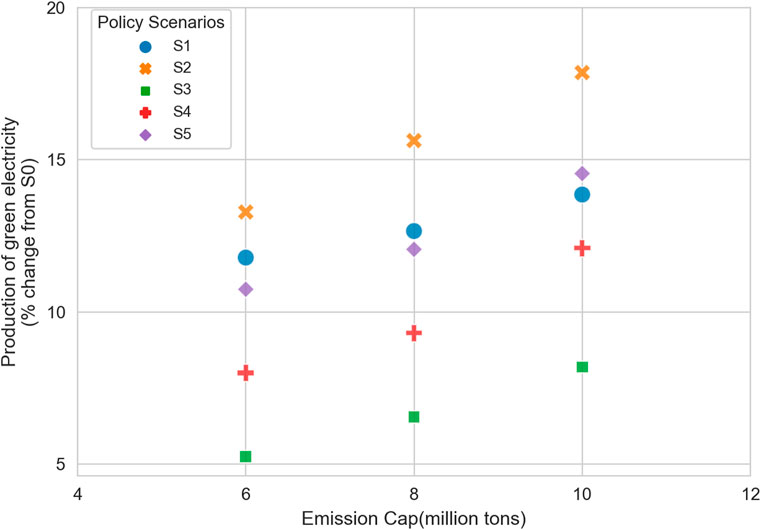
FIGURE 4. Production of green electricity under different policy scenarios.
First, according to the results of the model, we will analyze the reasons why S1 and S2 can stimulate the increase in the production of green electricity. First, the government stipulates the market share of green electricity, which directly stimulates the investment in RES; as the proportion of
Second, we will discuss the effect of the interaction between renewable subsidy policy and ETS on the production of green electricity, as shown in Table 3. First, with the same cap, as the amount of subsidy increases, the production of green electricity increases. For example, when cap = 8 million tons, if S increases to 0.5 RMB/kWh from 0.1 RMB/kWh, the shares of green electricity increase by 6.5% and 17.3%, respectively. Since the cost of investment in such renewable energy as wind electricity and PV energy is high, coupled with their natural intermittency and technical thresholds, renewable energy is not very competitive in the electricity market. Nonetheless, the implementation of a renewable subsidy policy can make up for its disadvantage in cost and promote technological innovation. However, the amount of subsidy and the opportunity to retreat should be well grasped. Second, a gradually relaxed cap requirement for ETS that could render the same RPS percentage is correspondingly difficult to achieve. For example, when the RPS percentage requirement is 0.08, if the cap increases to 8 million tons from 6 million tons, the shares of green electricity will decrease by 8.66% and 6.58%, respectively. The scholars believe that raising the carbon price may reduce the overall proportion of green electricity (Aflaki et al., 2017), which is consistent with the result of our model. This means that controlling the emission cap alone can directly stimulate emission reduction, but cannot achieve the goal of renewable energy development. Therefore, to achieve the multiple policy objectives of China, renewable energy support policies must be implemented as supplementary means.
5.3 Social welfare
Figure 5 shows the changes in social welfare of scenarios S1–S5 compared with the benchmark scenario S0. With S0 as the benchmark, scenarios S1 and S2 will reduce social welfare, while scenarios S3–S5 will improve social welfare. In the case of cap = 10 million tons, the social welfare decreases by about 0.0468%–0.0491% under scenarios S1 and S2, while social welfare increases by 0.0162%–0.0587% under scenarios S3–S5. In the following, we will explain the differences between the two renewable energy support policies according to the results of the model.
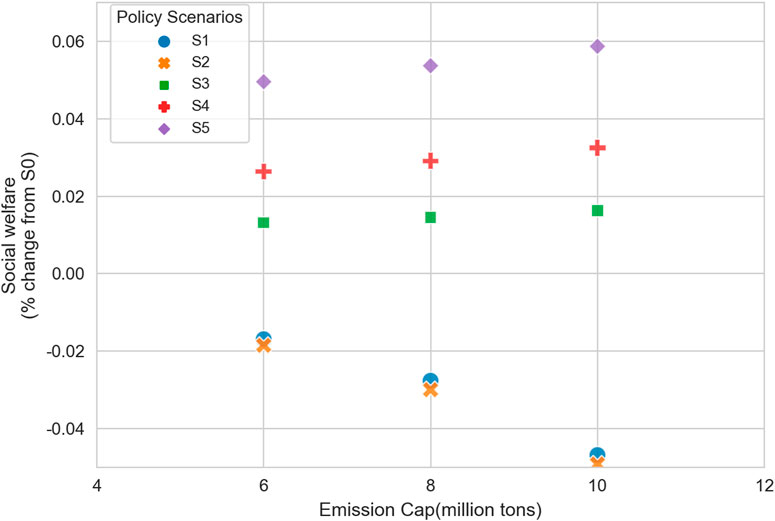
FIGURE 5. Social welfare under different policy scenarios.
First, Figure 6 presents the effect of interaction between renewable subsidy policy and ETS on social welfare. In the practice of China’s carbon market, the carbon price is always lower than its theoretical optimal level. When the carbon price is lower than the optimal level, whether the combination of the carbon market and renewable energy support policies is optimal or cost-effective depends on the deviation degree of the carbon price from the optimal level (Abrell et al., 2019). First, when the cap setting is loose, there is an interval of the carbon price and the combination of the carbon market and renewable energy support policies can improve the social welfare, which is consistent with the scholars’ conclusion (Abrell et al., 2019). Second, when the cap is set to be valid, the carbon price is close to the social cost of carbon (SCC = 156 RMB/ton). In such a case, it is unnecessary to adopt the renewable subsidy policy at the same time, which can only increase the policy cost. That is because high carbon price has effectively made use of all the emission reduction channels. If subsidies are given to renewable energy technologies in this case, a twist effect will be produced. According to the results of the model, there is an inflection point when the high carbon price is 210 RMB/ton, at which the implementation of subsidy policy will have a negative effect and lead to the situation where the more subsidies are given, the worse the situation will be.
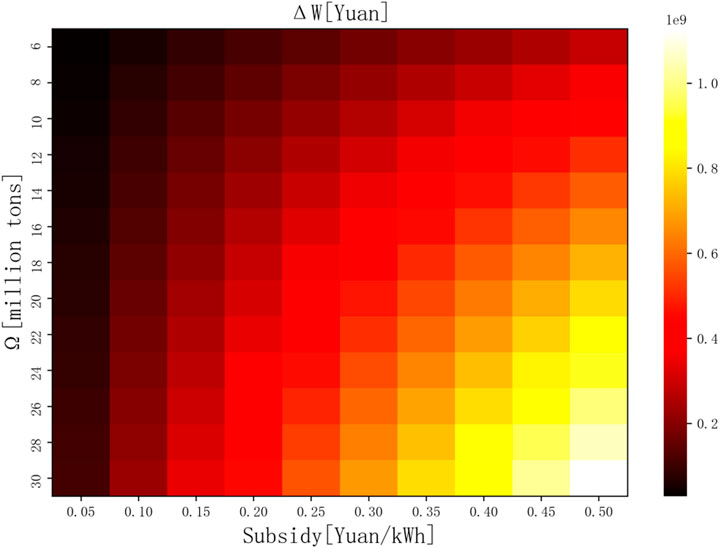
FIGURE 6. Social welfare under subsidy and carbon market combination policy.
Second, as shown in Figure 7, with the increase of renewable energy market share,
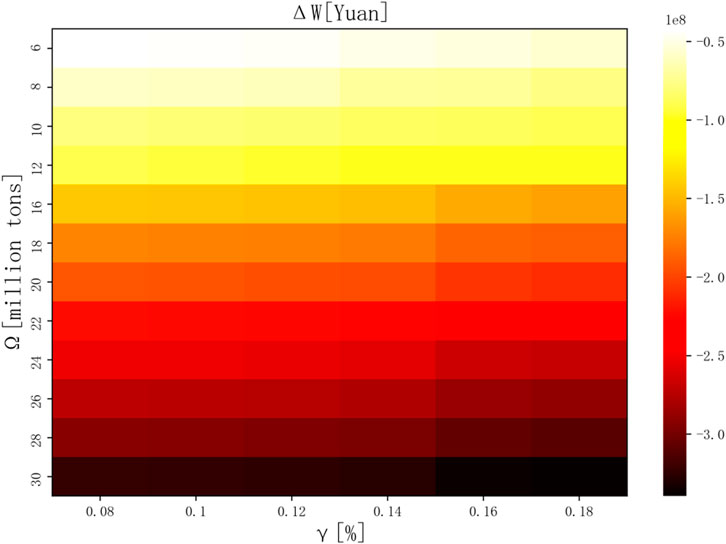
FIGURE 7. Social welfare under green credits and carbon market combination policy.
6 Conclusion and policy implications
6.1 Conclusion
In recent years, policymakers in many countries have begun to implement or seriously consider renewable energy support policies. With the widespread application of renewable energy support policies, the overlap of different policy instruments of RES and ETS may have an important impact on the implementation of regulatory policies. To avoid the possible negative effects or to take advantage of the potential synergistic effect of multiple policies, it is necessary to understand how different policy mechanisms interact with each other.
Based on the aforementioned problems, we, first of all, built a partial equilibrium model to discuss the interaction mechanisms between ETS and renewable energy support policies. Then, we, combining the theoretical model and numerical model and taking the case of China’s electricity market in 2018, conducted an empirical analysis and specifically presented the interactions between different policies from three aspects—emission reduction, production of green electricity, and social welfare.
According to the results of the model, there were big differences among the implementation effects of different renewable energy support policy instruments. Based on ETS, the renewable subsidy policy (S3–S5) is better than REC (S1 and S2) in terms of emission reduction, but worse in terms of improving the production of green electricity. In addition, different from the renewable subsidy policy (S3–S5), REC (S1 and S2) can reduce social welfare.
6.2 Policy implications
A renewable subsidy policy is the starting point of the low-carbon transition, but it cannot serve as the core driver for long. Although the policy effect of the renewable subsidy policy completely depends on the government’s willingness to reduce emissions, it still faces a large policy cost. According to Figures 2, 5, when the subsidy level is set, the setting of the emission cap should be fully considered, but should not be only based on the investment cost and environmental value of renewable energy sources. In short, the renewable subsidy policy is not a long-term solution and should gradually “retreat.” One of the preconditions for subsidy retreat is that the carbon market is efficient. According to the result of the model, when the cap is loose, the carbon price will be much less than the social cost of carbon (SCC = 156 RMB/ton), and it is necessary to implement the subsidy policy. When the carbon market runs effectively, the carbon price will be approximately equal to 156 RMB/ton, it is unnecessary to implement the subsidy policy at the same time. Therefore, to realize subsidy retreat, an effectively running carbon market is needed.
In the trend of subsidy retreat, the country encourages renewable energy enterprises to sell renewable energy green electricity certificates, and the income from it can be used for financial expenditure. According to the result of the model, under scenarios S1 and S5, the effects of increasing the production of green electricity were similar. The income of the renewable energy companies under scenario S1 is approximately equal to the policy cost paid under scenario S5, and at this moment,
Certified emission reduction (CER) is an emerging offset mechanism that can theoretically serve as a complementary instrument to the carbon market. It is a project with certified emission reduction as the main commodity based on the clean development mechanism. In addition, CER can not only further reduce the emission reduction cost of emission reduction entities, but also promote the development of renewable energy. According to the data of the model, it can be inferred that if this market is opened, CER will bring benefits to renewable energy companies that are approximately equal to the amount of subsidy S = 0.15 RMB/kWh, which will thus greatly save the policy cost. Therefore, we believe that the country should open this market and rely on market means to drive China’s energy transition.
Data availability statement
The original contributions presented in the study are included in the article/Supplementary Material; further inquiries can be directed to the corresponding author.
Author contributions
Conceptualization, LL and YW; writing—original draft preparation, XC and WB; writing—review and editing, LL and YW; supervision, LL; project administration, LL; funding acquisition, LL and YW. All authors have read and agreed to the published version of the manuscript.
Funding
Tianjin philosophy and Social Sciences Planning Project: TJ GL QN19-004.
Conflict of interest
The authors declare that the research was conducted in the absence of any commercial or financial relationships that could be construed as a potential conflict of interest.
Publisher’s note
All claims expressed in this article are solely those of the authors and do not necessarily represent those of their affiliated organizations, or those of the publisher, the editors, and the reviewers. Any product that may be evaluated in this article, or claim that may be made by its manufacturer, is not guaranteed or endorsed by the publisher.
References
Abrell, J., Rausch, S., and Streitberger, C. (2019). The economics of renewable energy support. J. Public Econ. 176, 94–117. doi:10.1016/j.jpubeco.2019.06.002
Aflaki, S., and Netessine, S. (2017). Strategic investment in renewable energy sources: The effect of supply intermittency. Manuf. Serv. Oper. Manag. 19 (3), 489–507. doi:10.1287/msom.2017.0621
Bergh, K., Delarue, E., and D'H Ae Seleer, W. (2013). Impact of renewables deployment on the price and the CO2 emissions in the European electricity sector. Energy Policy 63 (4), 10231.
Böhringer, C., and Behrens, M. (2015). Interactions of emission caps and renewable electricity support schemes. J. Regul. Econ. 48 (1), 74–96. doi:10.1007/s11149-015-9279-x
Branger, F., L Ec Uyer, O., and Quirion, P. (2013). The European union emissions trading syshould we throw the flagship out with the bathwater? Post-Print.
Chang, T., Liu, F., Ko, H., Cheng, S., Sun, L., and Kuo, S. (2014). Comparative analysis on power curve models of wind turbine generator in estimating capacity factor. Energy 73, 88–95. doi:10.1016/j.energy.2014.05.091
Cheng, B., Dai, H., Wang, P., Xie, Y., Chen, L., Zhao, D., et al. (2016). Impacts of lowbon power policy on carbon mitigation in guangdong province, China. Elsevier Sci Ltd, Oxford, England: Energy Policy.
Duan, M., Economy, E. A., and University, T. (2018). Coordinations between China's ems trading system and policies of energy efficiency and renewable energy. J. Envental Econ.
Fan, Y., Wang, S-Y., Zhu, L., Zhang, G-P., and Duan, H-B. (2016). How will diffusion of PV solar contribute to China's emissions-peaking and climate responses? Renew. Sustain. Energy Rev. 53, 1076–1085. doi:10.1016/j.rser.2015.09.021
Feng, T. T., Yang, Y. S., and Yang, Y. H. (2018). What will happen to the power supply strand CO 2 emission reduction when TGC meets CET in the electricity market in China? Renew. Sustain. Energy Rev. 92, 121–132. doi:10.1016/j.rser.2018.04.079
Fischer, , and Carolyn, (2010). Combining policies for renewable energy: Is the whole less thaum of its parts? Discuss. Pap. 4 (1), 51–92. doi:10.1561/101.00000030
Fischer, Carolyn, and Newell, Richard G. (2008). Environmental and technology policies for climate mitigation. J. Environ. Econ. Manag. 55 (2), 142–162. doi:10.1016/j.jeem.2007.11.001
Gugler, K., Haxhimusa, A., and Liebensteiner, M. (2021). Effectiveness of climate policies: Carbon pricing vs. Subsidizing renewables. J. Environ. Econ. Manag. 106. doi:10.1016/j.jeem.2020.102405
Hepburn, C., Stern, N., and Stiglitz, J. E. (2020). Carbon pricing” special issue in the European economic review. European Economic Review. 127.
Hoffmann, S. (2011). The innovation impact of the EU emission trading system — finf company case studies in the German power sector. Ecol. Econ.
International Energy Agency (2020). Implementing effective emissions trading systems: Leom international experiences [EB/OL.
iu, H. H., Zhang, Z. X., Chen, Z. M., and Dou, D. S. (2019). The impact of China's electricity regulation on coal and power industries: Two-stage game modeling, 134. Abingdon, England: Energy Policy.
Jos, S. (2011). The Interaction between the EU emission trading scheme and National Enlicies. Clim. Policy 5 (1).
Kök, A., GürhanS, , and Kevin, Y. (2018). Impact of electricity pricing policies on able energy investments and carbon emissions. Elsevier Sci Ltd, Oxford, England: Management Science Journal of the Insf Management Sciences.
Lecuyer, O., and Quirion, P., 2016, "Interaction between CO2 emissions trading and ree energy subsidies under uncertainty: Feed-in tariffs as a safety net against ovcation", Policy Papers.
Lin, K. C., and Purra, M. M. (2019). Transforming China's electricity sector: Politics of institutional change and regulation. Energy Policy 124, 401–410. doi:10.1016/j.enpol.2018.07.041
Lindberg, M. B. (2019). The EU emissions trading system and renewable energy policies: Fri foes in the European policy mix? PaG. 7, 105–123. doi:10.17645/pag.v7i1.1800
Liu, L., Zong, H., Zhao, E., Chen, C., and Wang, J. (2014). Can China realize its carbon emission reduction goal in 2020: From the perspective of thermal power development. Appl. Energy 24 (1), 199–212. doi:10.1016/j.apenergy.2014.03.001
Metcalf, G. E. (2009). Market-based policy options to control U.S. Greenhouse gas emissions. J. Econ. Perspect. 23 (2), 5–27. doi:10.1257/jep.23.2.5
Mischke, P., and Karlsson, K. B. (2014). Modelling tools to evaluate China's future energy system – a review of the Chinese perspective. Energy 69, 132–143. doi:10.1016/j.energy.2014.03.019
Mu, Y., Wang, C., and Cai, W. (2017). The economic impact of China's INDC: Distinguishing theof the renewable energy quota and the carbon market. Renew. Sustain. Energy Re81 (2), 2955–2966.
National Energy Commission Administration (2017). Current political news. Available at: http://www.nea.gov.cn/.
Nordhaus, W. (2011). Designing a friendly space for technological change to slow global warming. Energy Econ. 33 (4), 665–673. doi:10.1016/j.eneco.2010.08.005
Palmer, Karen, and Burtraw, Dallas (2005). Cost-effectiveness of renewable electricity policies. Energy Econ. 27 (6), 873–894. doi:10.1016/j.eneco.2005.09.007
Pedro, l., francisco, j. s., and mariano, V. (2008). Coordination of carbon Re and renewable energy support policies. Clim. Policy 8 (4).
Perino, G., and Jarke, J. (2015). Do renewable energy policies reduce carbon emissions? On CaIntra-jurisdictional leakage. Shanghai: Social Science Electronic Publishing.
Pu, L., Wang, X., Tan, Z., Wang, H., and Wu, J. (2020). Is China's electricity price crsidy policy reasonable? Comparative analysis of eastern, central, and western regions. Energy Policy 138. doi:10.1016/j.enpol.2020.111250
Ricke, K., Drouet, L., Caldeira, K., and Tavoni, M. (2018). Country-level social cost of carbon. CaNature Clim. Change 8 (10), 895–900. doi:10.1038/s41558-018-0282-y
Rosenbloom, D., Markard, J., Geels, F. W., and Fuenfschilling, L. (2020). Why carbon pricing is not sufficient to mitigate climate change—And how “sustainability transition policy” can help. Proc. Natl. Acad. Sci. U. S. A. 117 (16), 8664–8668. doi:10.1073/pnas.2004093117
Schmidt, T. S., Schneider, M., Rogge, K. S., Schuetz, M. J. A., and Hoffmann, V. H. (2012). The effects of climate policy on the rate and direction of innovation: A survey of the EU ETS and the electricity sector. Environ. Innovation Soc. Transitions 2, 23–48. doi:10.1016/j.eist.2011.12.002
Tian, L., Ye, Q., and Zhen, Z. (2019). A new assessment model of social cost of carbon and its situation analysis in China. J. Clean. Prod. 211 (FEB.20), 1434–1443. doi:10.1016/j.jclepro.2018.11.117
Wu, J., Fan, Y., Timilsina, G., Xia, Y., and Guo, R. (2020). Understanding the economic ImInteracting carbon pricing and renewable energy policy in China. Reg. Environ. Chem.0 (3).
Wu, J., Fan, Y., and Xia, Y. (2017). How can China achieve its nationally determined coon targets combining emission trading scheme and renewable energy policies? Energies (Basel). En10 (8), 1166. doi:10.3390/en10081166
Wu, J., Wang, J., and Hi, D. C. (2013). Wind energy potential assessment for the site of Inner Mongolia in China. Renew. Sustain. Energy Rev. 21 (5), 215–228. doi:10.1016/j.rser.2012.12.060
Yang, M., Patinoecheverri, D., and Yang, F. (2012). Wind power generation in China: Understanding the mismatch between capacity and generation. Renew. Energy 41 (2), 145–151. doi:10.1016/j.renene.2011.10.013
Ying, Z., and Xin-gang, Z. (2021). The impact of renewable portfolio standards on carbon emission trading under the background of China’s electricity marketization reform. Energy 226. doi:10.1016/j.energy.2021.120322
Keywords: carbon pricing, renewable portfolio standards, social welfare, feed-in tariffs, emission trading scheme
Citation: Wang Y, Cui X, Bu W and Li L (2022) How to design renewable energy support policies with imperfect carbon pricing?. Front. Environ. Sci. 10:958979. doi: 10.3389/fenvs.2022.958979
Received: 01 June 2022; Accepted: 25 August 2022;
Published: 17 October 2022.
Edited by:
Xiaolei Sun, Chinese Academy of Sciences (CAS), ChinaReviewed by:
Songmin Yu, Fraunhofer Institute for Systems and Innovation Research ISI (FHG), GermanyShao-Chao Ma, China University of Geosciences, China
Copyright © 2022 Wang, Cui, Bu and Li. This is an open-access article distributed under the terms of the Creative Commons Attribution License (CC BY). The use, distribution or reproduction in other forums is permitted, provided the original author(s) and the copyright owner(s) are credited and that the original publication in this journal is cited, in accordance with accepted academic practice. No use, distribution or reproduction is permitted which does not comply with these terms.
*Correspondence: Li Li, bGlsaWVjZUAxNjMuY29t