 Laura Delgado-González
 Bruno Lartiges
 Stéphane Troesch3
 Pascal Molle
- 1Inrae, REVERSAAL Research Unit, Villeurbanne, France
- 2Université de Toulouse III (Paul Sabatier), Géosciences Environnement Toulouse, Toulouse, France
- 3SYNTEA, Le Pian sur Garonne, France
- 4Université de Toulouse III (Paul Sabatier), Centre de Microcaractérisation R. Castaing, Toulouse, France
Phosphorus retention in small- and medium-sized wastewater treatment plants is crucial to preventing the eutrophication of downstream catchments. One popular solution in combination with treatment wetlands is the use of reactive filters for phosphorus retention; however, identifying a suitable substrate is not an easy task in this process. Apatites have already proven to be an effective alternative for phosphorus retention, yet more in-depth research is needed. This article uses two natural apatite materials, NA1 and NA2, introduced in four fixed-bed laboratory columns to assess their phosphorus retention capacity. Various inflow conditions are set for the NA1 substrate to evaluate the impact of calcium and biomass development on performance. The substrates show high phosphorus retention (>16.8 g PO4-P/kg for NA1 and >17.5 g PO4-P/kg for NA2) as well as high kinetic rate coefficients (1.45 and 1.70 h−1 for NA1 and NA2, respectively), with performances above 80% for both substrates. The maximum phosphorus retention capacity is not attained at the end of the experiments, despite their long duration (230 days) and the short hydraulic residence times applied (∼2 h), thus suggesting a long-term removal capacity. The NA1 column fed with a calcium-deficient synthetic solution displays just slightly reduced kinetic rates, most likely due to calcite and dolomite dissolution from the media. The column fed with treated wastewater does not reveal any significant reduction in hydraulic conductivity due to biomass development. No loss of permeability due to chemical clogging was observed in the other columns. Scanning electron microscopy indicates that phosphorus retention occurs by the precipitation of amorphous calcium phosphate for both natural apatites, thereby clearly demonstrating the implementation of seeding mechanisms. Such a retention process is sustainable, which suggests it may proceed over even higher retention capacities.
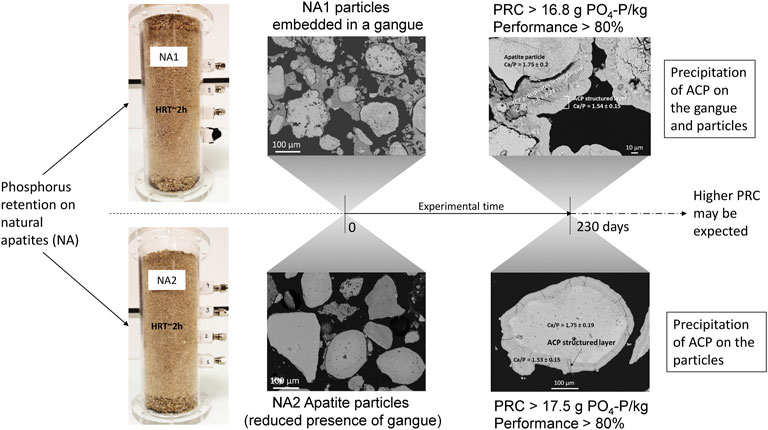
GRAPHICAL ABSTRACT
Highlights
• High phosphorus retention capacity
• No significant impact of phosphorus precipitation on hydraulic conductivity
• Precipitation of amorphous calcium phosphate
Introduction
Phosphorus removal in small wastewater treatment plants (WWTPs) is a technological issue yet to be resolved (Vohla et al., 2011). A large number of substrates for phosphorus retention have already been assessed using batch or laboratory-column experiments (Cui et al., 2008; Dai and Hu, 2017; Barca et al., 2021; Perez et al., 2021) or at the pilot scale, while full-scale applications have not been adequately developed or studied (Shilton et al., 2006). The use of filters with reactive substrates, such as natural apatites (Ca5(PO4)3(OH,F,Cl)), can be a suitable solution to retain phosphorus thanks to their low maintenance requirements and presumably long-term removal capacity (Molle et al., 2005; Molle et al., 2011). However, further in-depth research is required to determine both the resulting maximum phosphorus retention capacity (PRC) and the clogging risks associated with a small particle size distribution.
The apatite mineral has proven to be an efficient crystallization seed in promoting calcium phosphate (CaP) precipitation from wastewater (Nancollas and Mohan, 1970; Joko, 1984; Molle et al., 2005). However, the corresponding efficiency varies with apatite composition, the nature of the phosphate rock, and its origin (i.e., igneous vs. sedimentary) (Bellier et al., 2006; Harouiya et al., 2011a; Harouiya et al., 2011b; Molle et al., 2011). Seeded precipitation operates within the metastable zone between the solubility and super-solubility curves. The closer the seed crystals and precipitates in composition, the lower the supersaturation of the solution required to promote such precipitation (Jang and Kang, 2002). The precipitation of calcium phosphate phases involves complex equilibria. From a thermodynamic perspective, the most stable solid phase is hydroxyapatite (HAP) (Hermassi et al., 2015). However, HAP precipitation is not straightforward. According to the Ostwald step rule (Ostwald, 1897; Chung et al., 2008), this precipitation generally necessitates both the formation of a CaP precursor and a transition through other metastable solid phases, leading to the final crystalline HAP structure. The composition of the precursor is governed by precipitation kinetics. Most research studies carried out on HAP precipitation have identified the formation of amorphous calcium phosphate (ACP) as the phase precursor (Nancollas and Mohan, 1970; Meyer and Eanes, 1978; Mañas et al., 2012) in the transition up to HAP through crystallization of tricalcium phosphate (TCP, Ca/p = 1.5), calcium-deficient hydroxyapatite (CDHA, Ca/p = 1.5–1.6 (Dorozhkin, 2010), or octocalcium phosphate (OCP, Ca/p = 1.33) (Nancollas and Mohan, 1970; Meyer and Eanes, 1978; Castro et al., 2012).
Calcium availability is an important parameter in promoting CaP precipitation; it may be provided by the wastewater and/or supplied by an additional soluble phase (e.g., calcite). The dissolution of Ca-containing minerals increases calcium availability and the supersaturation of the solution with respect to CaP phases. The role of dissolved Ca on P retention has been pointed out in previous works on Ca-containing substrates, such as shell sand (Ádám et al., 2007), oil shale ash (Kõiv et al., 2010), and steel slag (Barca et al., 2014).
When considering wastewater treatment applications, another key aspect related to filter efficiency is the particle size distribution of the substrate. A fine particle size distribution exposes more surface area for the reactions to take place, hence improving both the kinetic rate and performance of the system. On the other hand, small particles increase the risk of a premature chemical or biological clogging of fixed-bed reactors. Such bioclogging can be partially overcome if the reactive filter is used as a tertiary treatment in small WWTPs in order to avoid excessive biomass development, as proposed in this article.
In various small WWTPs across France, apatite filters have already been installed for phosphorus retention. The material, however, is presented in a granulated form, which has failed to provide long-lasting results; moreover, it displays high pH values for several months following system start-up (Delgado-González et al., 2021; Delgado-Gonzalez et al., 2021). These results support the idea that natural apatite may still be a more appropriate solution; however, a better understanding of the processes taking place and the limitations of such a system is required before considering any technological upscaling. In this work, two distinct natural apatite materials available in the market are assessed to determine their capacity to retain (ortho)phosphates. The study examines and compares their phosphorus retention capacity, performance, and kinetics by using simplified models suitable for design purposes. Either of the two materials has been selected to evaluate their performance under alternative environmental conditions, namely, a calcium-deficient influent and a treated wastewater influent. The loss in hydraulic efficiency due to chemical and/or biological clogging is also investigated. The aim of this work is to provide a better understanding of both the phosphorus retention processes taking place in natural apatites and the impact of such retention on system sustainability in terms of hydraulics and retention performance.
Materials and methods
Characterization of apatite materials
Two natural apatite materials are used in this study, hereafter referred to as natural apatites 1 and 2, or NA1 and NA2. A physical, chemical, and mineralogical characterization of both raw apatite products was carried out. Representative samples of both substrates were selected using the coning and quartering method (NF EN 932-2).
Elemental analyses of Ca, P, Si, Al, Fe, K, Mg, and Na were conducted by means of alkaline fusion (LiBO2), followed by acid digestion (HNO3), and subsequent analyses of the solutions by inductively coupled plasma optic emission spectrometry (ICP-OES) (iCap6500, Thermo Scientific). The fluorine concentration was analyzed using an ion selective electrode (ISE). Lastly, total sulfur and total carbon were assessed with an infrared analyzer (HORIBA EMIA 320-V2) after heating the samples by induction to approximately 1,450°C.
The mineralogical characterization step was performed on dry ground (80 < µm) raw samples using X-ray diffraction (XRD), with a CuKα radiation (λ = 1.54060 Å) on a 2θ diffractometer (Bruker D8-Advance) in the 5°–70° range. The mineralogical phases were identified using Match! three software (Crystal Impact) by comparing the recorded patterns with the data provided by the Crystallography Open Database, and quantified using the Rietveld refinement performed by FullProf software (Rodriguez-Carvajal, 1993). In a Rietveld refinement, individual scale factors (related to the concentration of each phase) and profile, background, and lattice parameters are varied to fit the calculated diffraction (area of the peaks) to the observed data (Misture and Pomeroy, 2021).
The crystallographic microstructure and chemical composition of the apatite materials were also analyzed using imaging techniques. The apatite particles were first embedded in an epoxy resin to obtain cylindrical resin blocks (4 cm in diameter), which were then abraded and polished in ethanol using successively finer silicon carbide powders. Next, an ethanol-based diamond slurry was introduced to produce a smooth polished finish suitable for recording electron backscatter diffraction patterns. The polished sections were carbon coated and examined using Scanning Electron Microscopy (SEM JEOL JSM-7100) equipped with an Electron Backscattered Diffraction pattern detector (EBSD AZtec HKL) and an Energy Dispersive X-ray Spectroscopy analyzer (EDXS Oxford Instruments) for microanalysis (R. Castaing Microcharacterization Centre, France). This technique was also applied after the experiment to examine the chemical composition of the precipitates formed.
The particle size distribution was determined by the standard dry sieving method (NF EN ISO 17892-4 January 2018). The porosity of the media was evaluated using the standard soil science procedure based on estimations of both bulk density and particle density (Klute, 1986). Particle density was determined according to the pycnometer method (NF EN ISO 11508 May 2014) (n = 3), while bulk density was measured from the volume occupied by a known mass of material (n = 3).
The specific surface area (SSA) could then be determined by considering the particle size distribution of the material under the assumption of spherical particles (McCabe et al., 2005):
where
Column experiment setup
Long-term tests were conducted in four fixed-bed laboratory columns. The columns were filled to a height of 20 cm and with a 63.6 cm2 cross-section of apatite filtering material. Total three of the four columns (NA1_Ref, NA1_Ca, and NA1_Bio) contained the NA1 apatite product for investigation of various aspects related to P retention, e.g., calcium content and biomass development. The fourth column, labelled NA2_Ref, contained NA2 for comparison with the NA1 substrate.
The experiments were carried out in hydraulically saturated systems within a vertical down-flow regime (See Supplementary Figure S1). All columns display equidistant internal sampling points to allow for solution sampling at various retention times. Two gravel transition layers (2–6 mm siliceous gravel, Sibelco) were placed at the filter inlet and outlet to prevent the loss of apatite materials. The columns were also wrapped in a black opaque plastic sheet to avoid algae development.
Feeding and analysis protocol
Except for column NA1_Bio, the pilot columns were all fed with a synthetic solution prepared from tap water and KH2PO4 (Sigma-Aldrich) so as to achieve a phosphorus inlet concentration of around 15 mg PO4-P/L. Such a concentration is within the range of typical phosphorus inlet concentrations of rural communities (2,000 p. e.) in France (Mercoiret, 2010). It would also allow a fast saturation of the filtering media in order to assess their maximum retention capacity within the experimental time. The conductivity was also adjusted by adding an NaCl solution (common salt) to approximate common values found in real wastewater (≈1,000 μS/cm). The aim of the experiment in column NA1_Ca was to analyze the effectiveness and kinetic rate of P retention at low calcium concentrations. Therefore, the inlet solution was diluted with distilled water to halve the tap water calcium concentration to approximately 35 mg Ca/L. The feeding solution of the NA1_Bio column was the outlet effluent of a biological secondary treatment. To prevent premature biological clogging, the flow rate of column NA1_Bio was set at about 5 L/day, limiting the organic load on the filter. In consequence, phosphate concentration was adjusted by adding KH2PO4 to achieve concentrations of around 20 mg PO4-P/L in order to keep comparable P loads to the other columns. The flow rates of the remaining columns (NA1_Ref, NA1_Ca, and NA2_Ref) were set at roughly 10 L/day. Table 1 summarizes the feeding characteristics of the columns as well as the experiment durations.
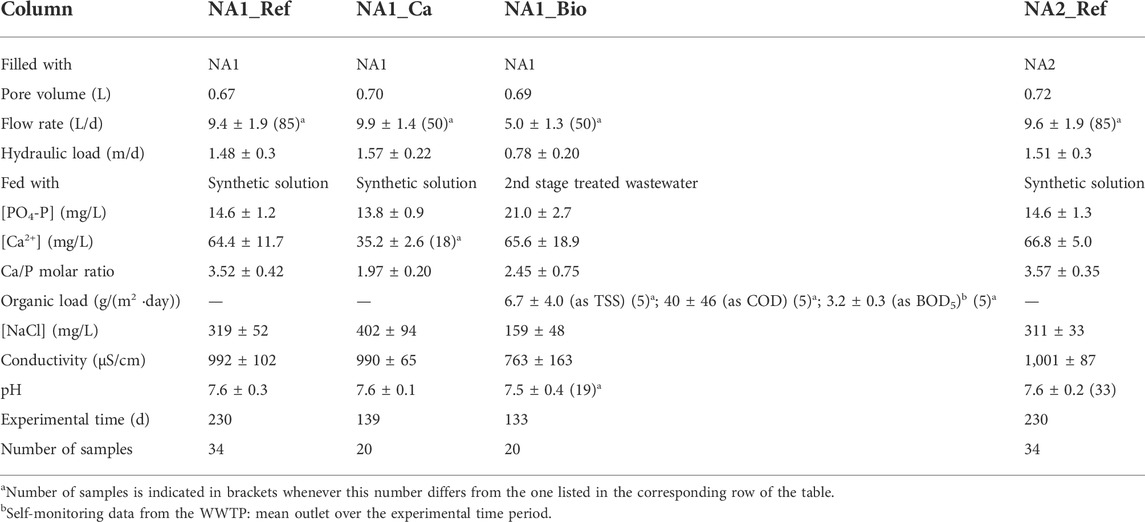
TABLE 1. Inlet solution characteristics of the laboratory column experiments and test duration. Mean value ± standard deviation (95%).
The samples were collected once a week at both the inlet and outlet of the systems. To assess the evolution of P concentration inside the column, samples were also extracted at the various sampling points along the column at selected times of the experiment, particularly during the precipitation phase [i.e., high phosphorus retention capacity (PRC)]. Calcium, phosphate, carbonates, and other ion concentrations were analyzed in 0.45-µm filtered samples by means of ionic chromatography (NF EN ISO 14911 and EN ISO 10304-1). Measurements of the chemical oxygen demand (COD) and total suspended solids (TSS) were also conducted for certain NA1_Bio samples according to Standards NF T 90-101 and NF EN 872, respectively. The analytical results of biochemical oxygen demand (BOD5) (NF EN 1899-1) were derived from the wastewater treatment plant monitoring data. The conductivity and pH were also measured for each sample. Lastly, the flow rate was checked every 2 days and adjusted when necessary.
Reaction rate models
The evolution of phosphorus concentration along the column was fitted to two distinct reaction rate models: the k-C∗ model, and the N-k-C∗ model (Kadlec and Wallace, 2009).
The k-C∗ model is a simplified kinetic model that assumes first-order kinetics for P retention, an ideal plug flow reactor, and a background concentration. The evolution of P concentration (C) with hydraulic retention times (HRTs), as represented by t(h), can be obtained by the following expression:
where C0 is the inlet concentration of phosphorus (mg/L), kv is the volumetric kinetic rate constant (h−1), and C∗ is the P equilibrium concentration (mg/L). The k-C∗ model is traditionally used to describe pollutant retention in porous systems, such as treatment wetlands (Merriman et al., 2017), and more specifically, in the case of phosphorus retention by apatite filters (Harouiya et al., 2011a; Harouiya et al., 2011b; Molle et al., 2011). Even though the plug flow may not be strictly accurate in describing the hydrodynamics of such systems, it still provides a reasonable estimation of treatment performance when taking background concentrations into consideration (Merriman et al., 2017).
The N-k-C∗ model combines the k-C∗ model with the hydrodynamics of a tank-in-series (TIS) model. The number of tanks-in-series (N) introduced into Eq. 3 must be determined by tracer tests:
The parameters of both models, kv and C∗, are to be determined by kinetic studies.
Assessment of model parameters
To estimate the model parameters, several kinetic studies were performed at different PRC levels over the course of the experiment. A kinetic study analyses the evolution of P concentration within the columns at different hydraulic retention times (HRTs). To cover the entire concentration range (from 15 mg PO4-P/L to equilibrium), the kinetic assessment was carried out by progressively reducing the inlet P concentration to simulate a longer HRTs; more specifically, the outlet concentration of the first week was set as the inlet concentration of the following week and so on. Such a methodology requires 1 to 4 or 5 weeks of measurements until the variation in concentration between consecutive sampling points is ≤0.1 mg PO4-P/L or the outlet concentration is equal to zero.
Both models were adjusted to the data resulting from these kinetic studies using a generalized reduced gradient (GRG) nonlinear least squares method, while the kv parameter is better defined at high inlet concentrations, and C∗ requires approximating low P outlet concentrations (equilibrium). When no kinetic study had been conducted, C∗ was set at the value defined in a previous kinetic study, and kv was then determined based on inlet/outlet concentrations. The additional uncertainty of such a calculation is considered reasonable since C∗ evolves slowly between two kinetic experiments.
Tracer tests
Dirac tracer tests were conducted to estimate the N parameter of the TIS hydraulic model, which describes the number of completely stirred tank reactors (CSTR) of equal volume in series. The retention distribution curve (E(t) vs. t) of a TIS hydraulic model is defined by the gamma distribution curve shown in thefollowing equation:
where E(t) denotes the retention time distribution function, t (h) is time, and texp (h) is the experimental hydraulic retention times (HRTs), which is also the mean retention time of the distribution curve (Eq. 5), and Г(N) (h−1) is the gamma function.
A GGUN-FL30 fluorometer was used to analyze the evolution over time of the concentration of fluorescein tracer at the outlet of the NA1 substrate columns. The tracer test characteristics for each filter are described in Table 2.
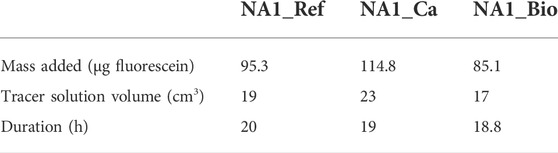
TABLE 2. Tracer test characteristics: mass of tracer used, volume of tracer solution sent to the filter, and tracer test duration.
The experimental data from the tracer test is then used to determine E(t) using the following expression:
where Q (m3/h) is the flow rate, and C (g/m3 or mg/L) is the tracer concentration at the system outlet. The model is employed to fit the data by a simultaneous determination of texp and N (involving the SOLVER (Excel™) tool that minimizes the sum of squared errors). For values of N = 1, the system behaves as an ideal CSTR. For N values greater than or equal to 50 (Levenspiel, 2012), the retention distribution curve produces the Gaussian distribution of a plug flow reactor.
Study of hydraulic conductivity
A constant head permeability test was carried out at the beginning and end of the experiments to assess changes in the saturated hydraulic conductivity (ks) of the system (see Supplementary Figures S2, S3). Darcy’s equation (Eq. 7) was applied to determine ks (m/s), where Δh denotes the head loss (m), A the section area of the column (m2), L the distance between piezometers (m), and Q the flow rate (m3/s).
Results and discussion
Characterization of apatite materials
Results from XRD analysis based on Rietveld refinement are listed in Table 3. The total amount of apatite phase in NA1 and NA2 samples is 51.8 and 70.7% (wt) as carbonated fluorapatite (C-FAP (PDF 01-073-9696)), respectively. The XRD diagrams (refer to Supplementary Figures S4, S5) of both materials show characteristic peaks at (002), (102), (210), (211), (300), (202), (222), (213), and (004) of single-phase hexagonal apatite with the space group P63/m (Predoi et al., 2021). Other phases present in both apatites NA1 and NA2 are dolomite (04-008-8066), calcite (04-001-7249), and quartz (01-089-1961).
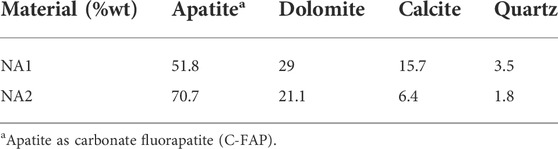
TABLE 3. Mineralogical composition by percentage weight of apatite substrates NA1 and NA2, as determined by XRD and calculated by Rietveld refinement.
Natural apatite rock suppliers inform about the quality of the material in terms of elemental composition (Table 4). Since the most abundant phosphate rock is apatite, it can be assumed that apatite content is proportional to P content. The calculation of the P content from the Rietveld estimation of apatite content (considering crystalline and amorphous phases) was 8.2% (wt) for NA1 and 11.2% (wt) for NA2. This is similar to what was obtained according to the analytical method (ICP-OES), which equals 11.0 and 13.8% (wt) for NA1 and NA2, respectively.
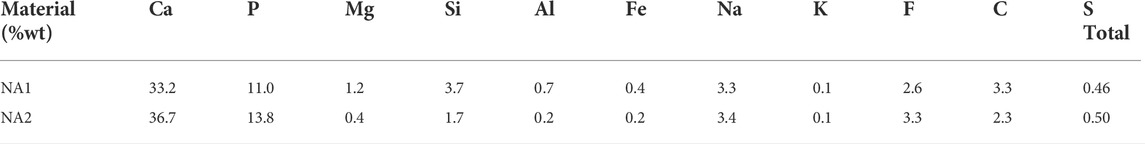
TABLE 4. Elemental composition by percentage weight based on ICP-MS and ICP-OES analyses of apatite substrates NA1 and NA2.
Table 5 presents the physical characteristics of the apatite substrates used in this study. Material NA2 shows a smaller particle size distribution than NA1, thus resulting in a slightly greater SSA for NA2 according to Method 1.
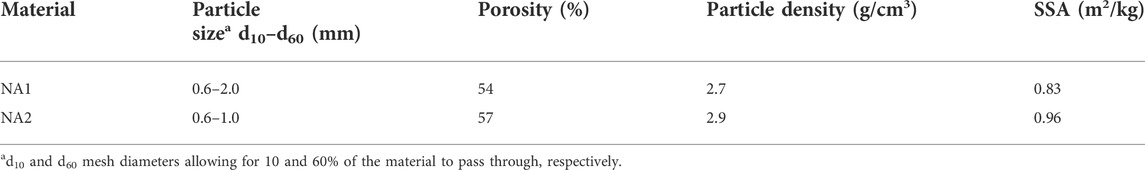
TABLE 5. Grain size, porosity, particle density, and SSA for natural apatites, NA1 and NA2.
The micrographs and SEM-EDXS analyses on the raw substrates reveal some interesting aspects regarding the morphology and composition of both products. The NA1 material often shows a gangue substrate coating the apatite particles (Figure 1A). This coating is mainly composed of clays such as montmorillonite ((Na, Ca)0.33(Al, Mg)2(Si4O10) (OH)2·nH2O), which usually contains Fe as a common cation substitute (Anthony et al., 1995). In apatite NA2, the occurrence and amount of gangue observed are lower, thus leading to a “cleaner” apatite product (Figure 1C). This may explain the slight differences in terms of Al and Fe composition, and SSA with respect to NA1. The Ca/P molar ratio of apatite particles is typical of carbonated apatites, i.e., 1.78 ± 0.8 for NA1 and 1.80 ± 0.7 for NA2. Figures 1B–D provide close-up micrographs of the apatite particles, revealing an equivalent porous texture for both the types, NA1 and NA2, which supports the notion that the major differences between the materials lie in the gangue content.
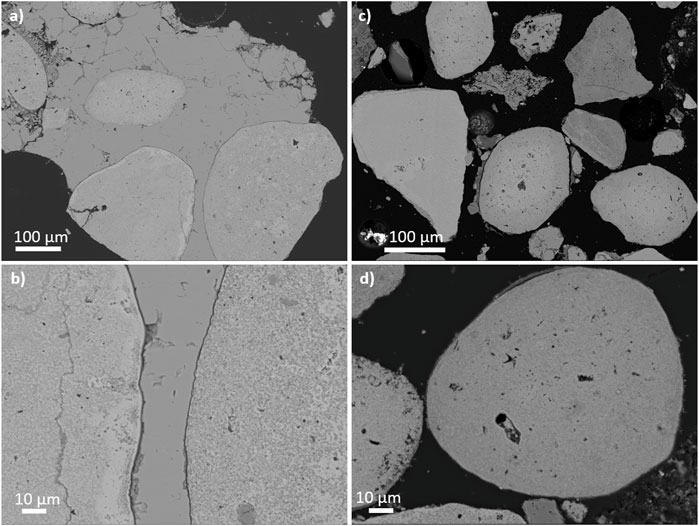
FIGURE 1. SEM micrographs of polished cross-sections of the raw material products in the backscattered mode. (A) and (B) NA1 apatite particles partially embedded in a gangue of a different nature (darker grey); (B) a close-up of the micrograph (A), revealing the porous texture of apatite rounded particles. (C), (D) NA2 apatite particles presenting a much lower clay gangue concentration; (D) close-up of NA2 particles revealing an equivalent porous texture as for NA1 particles.
Phosphorus retention performance
Figure 2 presents the performance of the system expressed as the amount of P retained per amount of P entering the filter (data presented as inlet and outlet concentrations can be found in Supplementary Figure S6). A 100% performance is represented by the y = x line. Figure 2A indicates that NA1 and NA2 have a similar evolution in their retention capacity until attaining 8 g PO4-P/kg of material. At this stage, the performance of NA1 starts to decrease and shows slight differences with NA2. As for the latter, separation from the 100% line begins at 10 g PO4-P/kg. After 230 days of the experiment, columns NA1 and NA2 have accumulated 16.8 and 17.5 g PO4-P/kg of material with a removal performance still reaching 80 and 83%, respectively, for a hydraulic retention times of 1.8 h. The experimental time was not long enough to attain the maximum PRC of these materials, yet it is still enough to reach promising values from an operational point of view.
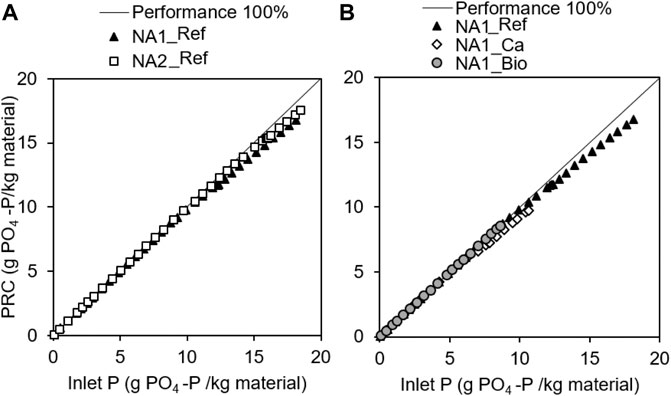
FIGURE 2. Evolution of phosphorus retention performance for (A) NA1_Ref and NA2_Ref columns, and (B) NA1_Ref, NA1_Ca, and NA1_Bio columns. These plots show the maximum PRC attained during the experiments and compare the performance recorded vs. the 100% performance line.
Figure 2B displays the results of the experiments using NA1 for various operating conditions (lack of Ca, biofilm growth). For the NA1-Bio column, performance remained close to 99% at the end of the experiment, following the same trend as NA1_Ref. Thus, up to a PRC value equal to 8.6 g PO4-P/kg NA1, the experiment shows that the effects of biofilm development remain limited. It may also result from biological assimilation, although, since the organic load is low (3.2 g BOD5/m2/d), such assimilation may not be significant.
Instead, the lack of calcium affects P retention performance to a more significant extent; it starts to reduce at 3.0 g PO4-P/kg NA1 and lies below 80% from a PRC of around 9.6 g PO4-P/kg NA1. The drop in calcium concentration does affect the supersaturation of the solution with respect to the CaP solid phases, hence reducing both the reaction rate and performance of the process.
Tracer tests
The N parameter was determined from fluorescein tracer tests conducted using the gamma distribution expression in Eq. 4; this led to an N value of 5.5, 13.0, and 19.0 for the NA1_Ref column, the NA1_Ca column, and the NA1-bio column, respectively. Since the hydrodynamics of the NA1_Ref column are furthest from the plug flow regime, so it will be selected in the following to assess the application limits of the k-C∗ model to laboratory columns.
A full description of these tracer test results can be found in the Supplementary Material section.
Assessment of reaction kinetics
The evolution of the kinetic rate constant with the phosphorus retention capacity starts at high values that gradually decrease until a pseudo-stabilization has been achieved (Molle et al., 2011). This behavior would account for an initial stage, during which adsorption and rapid precipitation of calcium phosphates occurs; then, the kinetic rate gradually decreases and retention is mainly associated with the crystal growth of calcium phosphates.
In Figure 3, the kinetic rate coefficient is evaluated using the k-C∗ model to compare both substrates, NA1 and NA2, revealing a longer initial stage for NA2 than for NA1. The mean kv value of NA2_Ref over this period is 4.34 h−1, lasting up to 9 g PO4-P/kg. For NA1_Ref, the first high kinetic coefficient stage reaches about 6.5 g PO4-P/kg, with a mean value of 4.26 h−1. Despite the longer initial stage for NA2_Ref with respect to NA1_Ref, the kv values during the pseudo-stabilization stage appear to attain a similar range for both the columns. The average kv values over the pseudo-stabilization stage are 1.45 and 1.70 h−1 for NA1_Ref and NA2_Ref, respectively.
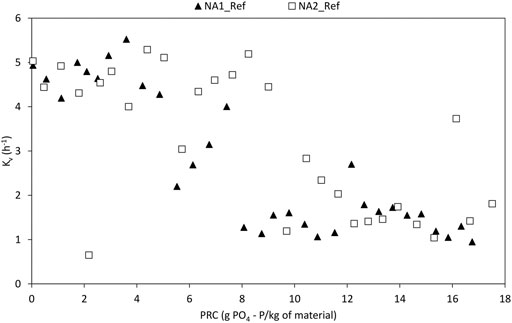
FIGURE 3. Evolution of the kinetic rate constant (according to the k-C* model) with the filter bed’s PRC values for columns NA1_Ref and NA2_Ref.
In Figure 4, both models k-C∗ and N-k-C∗ are compared in the case of the NA1_Ref column. A significant difference in kv parameters can be observed between the models at low PRC values (C∗ lying close to zero). The N-k-C∗ model presents a mean kv of 9.03 h−1 compared to 4.26 h−1 for the k-C∗ model. This difference appears to be overcome in the pseudo-stabilization stage, where similar mean kv values are obtained (1.64 h−1 for the N-k-C∗ model and 1.45 h−1 for k-C∗). From both Figure 4 and Table 6, it can be noted that the k-C∗ model leads to a more conservative evolution of model parameters than the N-k-C∗ model.
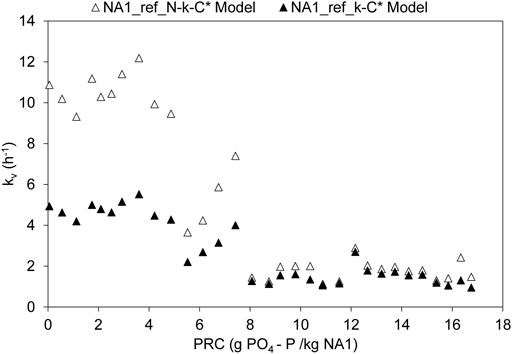
FIGURE 4. Evolution of the kinetic rate constant according to the N-k-C* and k-C* models with the filter bed’s PRC values for column NA1_Ref.
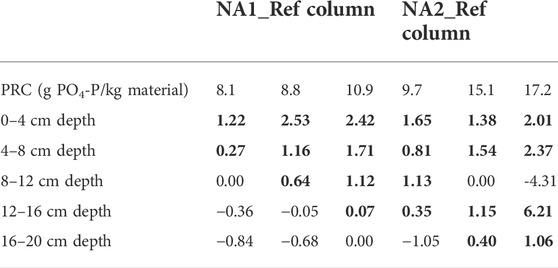
TABLE 6. Evolution of the retained Ca/P molar ratio in solution with increasing hydraulic retention times (phosphorus inlet concentration of around 15 mg PO4-P/L). The retained Ca/P ratio is calculated as the calcium concentration difference between two sampling points divided by the phosphorus concentration difference between these same two points. The bold values indicate calcium phosphate retention.
Regarding C∗, the materials allow for outlet concentrations below 1 mg PO4-P/L up to PRC values of approximately 11 and 15 g PO4-P/kg of material for NA1_Ref and NA2_Ref, respectively. At higher PRC values, C∗ could not be properly estimated, and values above 2 mg PO4-P/L may be expected. Nevertheless, considering the short retention times applied in the columns (around 2 h) to accelerate P saturation, lower C∗ values on full-scale systems with higher hydraulic retention times may indeed be expected. In turn, higher retention times may lead to different retention mechanisms (formation of different CaP phases and/or different rate-limiting steps). Thus, this specific critical aspect would need to be detailed in the future in order to better define the design and guarantee low outlet P concentrations.
Figure 5 presents the evolution of the kinetic coefficient for NA1 according to the set of various environmental conditions (Ca concentration and biomass growth). For the NA1_Ca column, the lower inlet calcium concentrations lead to a more gradual reduction in the kinetic rate coefficient as of the beginning of the experiment (low PRC values). In contrast, the NA1_Ref column remains relatively stable at high values up to around 6.5 g PO4-P/kg NA1. As a result, the pseudo-stable stage of NA1_Ca is attained at a lower PRC than NA1_Ref (at approx. 6 g PO4-P/kg NA1 vs. 8 g PO4-P/kg NA1 for the NA1_Ref column), even though kv appears to stabilize at similar values.
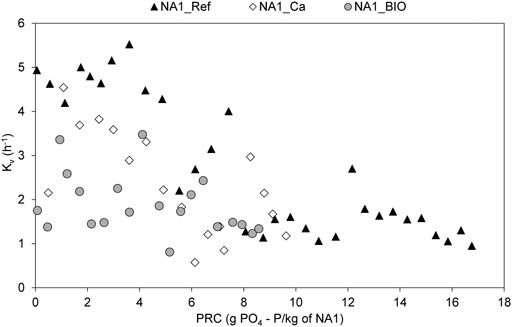
FIGURE 5. Evolution of the kinetic rate constant (according to the k-C* model) with the filter bed’s PRC value for columns NA1_Ref, NA1_Ca, and NA1_Bio.
Inlet calcium concentrations of the NA1_Ca column were high enough to allow for HAP precipitation (Ca/P = 1.67). However, a reduced calcium concentration affects the supersaturation of the solution, which in turn reduces the kinetic rate of the reaction. The mean inlet Ca/P molar ratios were 3.5 ± 0.7 for NA1 and 2.0 ± 0.2 for NA1_Ca, as shown in Table 1. Nevertheless, the actual Ca/P ratio affecting precipitation can increase inside the column due to the dissolution of calcareous material from the gangue. Such dissolution-reprecipitation of calcium as calcium phosphates could have smoothed the impact of a calcium-deficient solution on the kinetic rates, especially during the initial stage when most Ca-containing phases dissolve. The effects of a calcium-deficient solution in precipitation during the stabilization phase could not be evaluated.
In the case of the column using treated wastewater, NA1_Bio, the evolution of kv with PRC appears to be lower than under NA1_Ref conditions, showing a contrast at close to zero outlet concentrations for the NA1_Bio column over the entire PRC range of the experiment (see Supplementary Figure S6). To limit the organic load (from values up to 130–140 g DCO/m2/d), the flow rate of this column was reduced to 5 L/day instead of 10 L/day, thus increasing the retention time. When determining kinetic rate coefficients based on inlet/outlet concentrations, the HRTs affects the calculation of kv. It is impossible to know whether the column retains phosphorus on the first column layers, which would result in high kinetic rate coefficients, or whether P concentration gradually decreases with HRTs (lower kv values). Two kinetic measurements were performed by internal sampling on the NA1_Bio column, revealing kinetic rate coefficients within the same range as the NA1_Ref column (black dots in Figure 5). These results, in addition to kv values similar to NA1_Ref in the stabilization region, suggest that the effect of wastewater and biomass development is limited in the PRC range and under the operational conditions considered herein.
Concerning pH variations, the effluent of all columns exhibits a pH of around 8.0 (+/− 0.1) (see Supplementary Table S1) without any dynamic response over the duration of the experiment. We can therefore assume that this parameter could not explain the differences in the retention kinetics of the different columns.
SEM observation of calcium phosphate precipitates
At the end of the experiments, solid samples were extracted close to both the top (inlet) and bottom (outlet) of columns NA1_Ref and NA2_Ref. The samples were observed and analyzed by means of SEM-EDXS to identify the precipitates formed. The micrographs reveal the presence of a deposit formed on the surface of both the substrates for those samples taken close to the system inlet (the line scans of EDXS analyses are available in the Supplementary Material section).
In NA1 (Figure 6A), the outlying layer is constituted of a structured precipitate with a Ca/P molar ratio of approximately 1.5, which is characteristic of amorphous calcium phosphate (ACP) and tricalcium phosphate (TCP). However, this precipitate is more likely to be ACP since the Kikuchi lines characteristic of crystalized phases could not be observed in the backscattered SEM images. The ACP layer formed at the surface of apatite particles was directly exposed to the solution and onto the clay gangue. In the presence of the clay gangue, phosphorus was first retained inside the clay; (ortho)phosphates diffuse into the clay, where the oxides and hydroxides of aluminum and iron, as well as small embedded particles of apatite, would likely act as specific sorption sites, thus leading to further precipitation of (ortho)phosphates as ACP (Ca/P = 1.5).
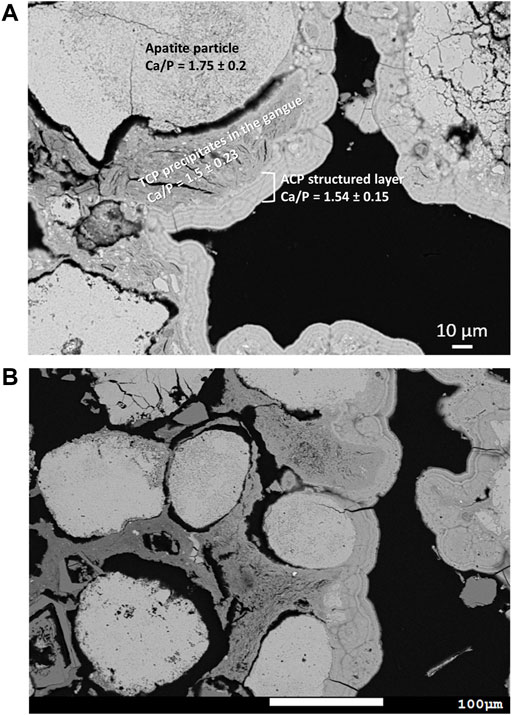
FIGURE 6. Typical SEM micrographs in the backscattered mode for samples extracted from column NA1_Ref close to the system inlet. The various solid phases and layers are identified by different levels of grey. (A) The layers above the carbonated fluorapatite (Ca/P = 1.75), where phosphorus is retained: one corresponding to the clay part, where ACP is formed (Ca/P = 1.5), while the layer above corresponds to a structured ACP precipitate (Ca/P = 1.54). (B) The apatite particles in light grey surrounded by the gangue in darker grey and the structured ACP precipitate on the right side. In contact with and adjacent to these precipitate layers, the gangue exhibits a lighter level of grey than on the left side, illustrating the diffusion of phosphorus from the bulk solution into the gangue being limited to about 100 microns. This micrograph demonstrates that apatite particles embedded in the gangue do not participate in phosphate retention.
A comprehensive micrograph of this phenomenon is shown in Figure 6B. The particles in light grey represent the apatite; surrounding them, a darker grey edge signals the presence of the clay gangue. The layers of the structured precipitate can be seen on the right side of the image at a grey level close to that of the FAP particles. Below the structured ACP layers, the clay gangue appears in light grey yet turns to a darker grey level toward the left side of the image, thus illustrating the diffusive phenomenon into the clay, which extends to roughly 100 µm in some parts of the clay gangue. It can also be observed that the particles on the left, wrapped in the clay gangue, are not in contact with the solution and therefore no precipitate is formed, i.e., precipitation onto the apatite particles is limited by the presence of the clay gangue.
In the NA2 samples, only the structured layer could be identified, also corresponding to ACP precipitates (Figure 7). Since the clay concentration in the NA2 substrate is much less significant, the precipitate is directly formed onto the apatite particle surfaces. Therefore, the presence of the gangue in the NA1 substrate may be the reason behind lower performance and kinetic rates than in NA2.
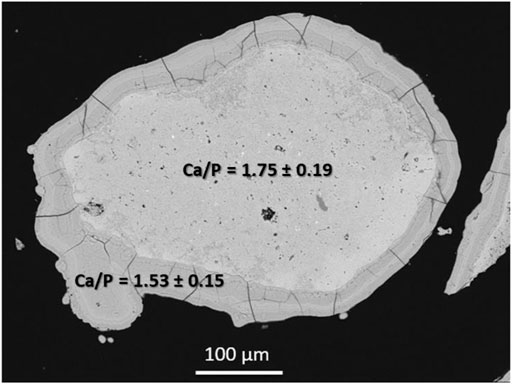
FIGURE 7. Typical SEM micrographs in the backscattered mode for the samples taken from column NA2, revealing a precipitate formed directly onto the surface of the carbonated fluorapatite with a Ca/P ratio of 1.53, corresponding to ACP. The various solid phases and layers are identified in the image by the different levels of grey. Neither the NA1_Ref nor the NA2_Ref samples extracted from the bottom of the columns and analyzed by SEM-EDXS showed the formation of precipitates.
The mean thickness of the structured ACP layer in samples close to the inlet for both substrates equals approximately 30 µm.
To analyze the evolution of phosphorus retention with the HRTs, let’s note the evolution of the Ca/P solution molar ratio retained between two consecutive sampling points in the column (Table 6), as calculated in thefollowing equation:
where [Ca2+]i and [PO4-P]i represent the calcium and phosphorus molar concentrations at the ith sampling point, and [Ca2+]i+1, and [PO4-P]i+1 are the calcium and phosphorus molar concentrations at the subsequent (ith+1) sampling point.
Note that the retained Ca/P molar ratio shows a general tendency to evolve from higher to lower values along both the NA1_Ref and NA2_Ref columns with increasing HRTs. This finding may be related to a decreasing supersaturation of the solution with HRTs as calcium phosphates are being retained. Such supersaturation reduction results in less calcium phosphate precipitation. In addition, it seems that a front of calcium phosphate retention travels from the surface of the column to lower depths as the PRC increases (values shown in bold in Table 6). Such a trend suggests that the kinetic rate of calcium phosphate retention is decreasing in the first sections where PRC is higher, thus allowing for more calcium and (ortho)phosphate ions to reach the lower sections of the column with enough supersaturation to precipitate.
At high PRCs, as shown in the NA2_Ref column (Table 6), the first two sections of the column remain active with relatively high retained Ca/P ratios. However, as of the third section (from 8 cm deep to the bottom), results indicate higher Ca/P molar ratios than those of the previous section or even a negative Ca/P accounting for a level of dissolution. Even though the phosphorus concentration along the column always decreases with HRTs, the calcium concentration varies along the column, sometimes retaining and sometimes releasing the ions (Supplementary Figure S9). Such behavior also pertains to calcite and dolomite equilibria, revealing unsaturated conditions at certain column depths and at different PRC. Indeed, the evolution of Ca, Mg, and bicarbonate concentrations with HRTs shows the occurrence of dissolution and reprecipitation processes inside the bed (Supplementary Figure S7). Lastly, the absence of precipitates in the bottom samples analyzed by SEM-EDXS may be explained by the formation of small amounts of amorphous calcium phosphates that re-dissolve under unstable solution conditions (supersaturation-unsaturation).
Hydraulic performance
The use of natural apatite with a fine particle size distribution may induce premature clogging. To measure the loss of hydraulic performance, permeability tests were conducted in the columns both before and after the experiments. Table 7 reveals no significant variations in hydraulic conductivity since the values before and after the experiment remain of the same order of magnitude. Indeed, the decrease in hydraulic conductivity over the time of the experiment is less than the level of experimental uncertainty. The variation in permeability between the various column sections (Table 8) is not significant either. It can be concluded that the accumulated deposit (thickness of precipitates ∼30 µm) or the biomass development (NA1_Bio), in considering the PRC achieved for each column, did not cause any significant loss of hydraulic conductivity.
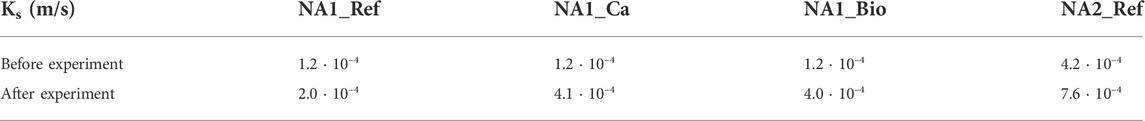
TABLE 7. Saturated of the filtering bed, as determined by the constant head permeability test before and after the experiment, for all the columns of the study.
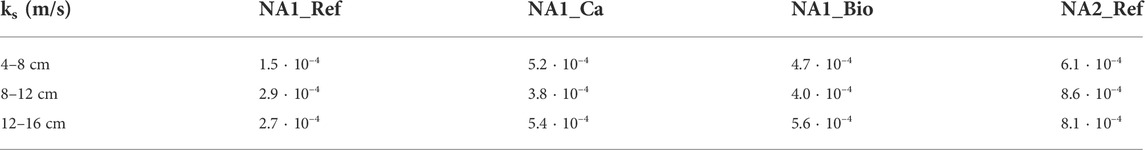
TABLE 8. Evolution of the saturated inside the filter at various depths. Measurements are recorded at the piezometers; consequently, conductivity is measured for the column section between the piezometers at the end of the experiments.
Conclusion
The natural apatites, NA1 and NA2, have demonstrated great potential for phosphorus retention from wastewater. The retention capacities attained at the end of the experimental time were 16.8 and 17.5 g PO4-P/kg for the NA1_Ref and NA2_Ref columns, respectively. However, the maximum phosphorus retention capacity was not achieved in either case. High kinetic rate coefficients were observed for the columns during both the initial and pseudo-stabilization stages. As for the latter, the values derived were 1.45 and 1.70 h−1 for NA1_Ref and NA2_Ref, respectively, when they were evaluated using the k-C∗ model (yielding more conservative results). The kinetic rate was slightly affected by calcium-deficient solutions during the initial stage, most likely due to calcium dissolution from the substrate. The impact of low calcium inlet concentrations during precipitate growth could not be assessed. Regarding the column fed by real treated wastewater effluent, NA1_Bio, the phosphorus retention performance was ≥99% for the entire PRC study range. Kinetic rate coefficients determined by internal samplings lie in the same range as those for NA1_Ref, and the evolution of kv appears to stabilize at similar values as well. Hence, biomass development, with low organic load, seems to exert little impact on P retention for the PRC range considered. The C∗ parameter increases over time but remains below 1 mg PO4-P/L up to 11 and 15 g PO4-P/kg for NA1 and NA2, respectively. However, defining the evolution of C∗ with increasing PRCs and longer HRTs would be necessary to better specify design and guarantee outlet concentrations.
Significant progress has been made in the understanding of phosphorus retention mechanisms on apatite substrates thanks to SEM images. The micrographs showed the formation of a precipitate in the samples taken close to the column inlet. The presence of a clay gangue in the NA1 substrate also allowed for some CaP retention within the clay layer. Then, a structured layer of amorphous calcium phosphate was able to grow onto the clay gangue and the apatite particle surfaces. For the NA2 substrate, with a very small amount of clay gangue, phosphorus retention could be achieved by the precipitation of amorphous calcium phosphate directly onto the apatite surface. Lastly, neither chemical nor biological clogging was observed in light of the PRC values attained. Moreover, the loss of hydraulic conductivity was insignificant in all columns.
The results presented here do account for the great potential of natural apatites for full-scale applications, in showing strong PRC with limited biological or chemical clogging risks over the short-to-medium term. Scaled-up experiments with real wastewater are required to verify the design.
Data availability statement
The datasets presented in this article are not readily available because they are under confidentiality restrictions until the end of December 2022. Requests to access the datasets should be directed to Laura Delgado González, laura.delgado-gonzalez@inrae.fr and/or Pascal MollecGFzY2FsLm1vbGxlQGlucmFlLmZy.
Author contributions
PM, ST, and LD-G contributed to the conception and design of the study. LD-G performed the experiments and data analysis. BL and AP contributed to SEM image production and interpretation. LD-G carried out the drafting of the manuscript. BL contributed to sections of the manuscript. All authors contributed to manuscript revision and read and approved the submitted version.
Funding
This work was supported by the French Water Agencies Adour-Garonne and Rhône-Méditerranée-Corse.
Acknowledgments
The authors would like to thank Ruben Vera from the Henry Longchambon Diffractometry Centre (France) and Jérémie Aubert and Olivier Garcia from the REVERSAAL Research Unit (INRAE, France) for their kind assistance.
Conflict of interest
The authors declare that the research was conducted in the absence of any commercial or financial relationships that could be construed as a potential conflict of interest.
Publisher’s note
All claims expressed in this article are solely those of the authors and do not necessarily represent those of their affiliated organizations, or those of the publisher, the editors, and the reviewers. Any product that may be evaluated in this article, or claim that may be made by its manufacturer, is not guaranteed or endorsed by the publisher.
Supplementary Material
The Supplementary Material for this article can be found online at: https://www.frontiersin.org/articles/10.3389/fenvs.2022.957807/full#supplementary-material
References
Ádám, K., Krogstad, T., Vrale, L., Sovik, A. K., and Jenssen, P. D. (2007). Phosphorus retention in the filter materials shellsand and filtralite P®—batch and column experiment with synthetic P solution and secondary wastewater. Ecol. Eng. 29 (2), 200–208. doi:10.1016/j.ecoleng.2006.09.021
Anthony, J. W., Richard, A. B., Kenneth, W. B., and Monte, C. N. (1995). Handbook of mineralogy. II (silica, silicates), II. Chantilly, VA, USA: Mineralogical Society of America.
Barca, C., Meyer, D., Liira, M., Drissen, P., Comeau, Y., Andres, Y., et al. (2014). Steel slag filters to upgrade phosphorus removal in small wastewater treatment plants: Removal mechanisms and performance. Ecol. Eng. 68, 214–222. doi:10.1016/j.ecoleng.2014.03.065
Barca, C., Scanu, D., Podda, N., Miche, H., Poizat, L., and Hennebert, P. (2021). Phosphorus removal from wastewater by carbonated bauxite residue under aerobic and anoxic conditions. J. Water Process Eng. 39, 101757. doi:10.1016/j.jwpe.2020.101757
Bellier, N., Chazarenc, F., and Comeau, Y. (2006). Phosphorus removal from wastewater by mineral apatite. Water Res. 40 (15), 2965–2971. doi:10.1016/j.watres.2006.05.016
Castro, F., Ferreira, A., Rocha, F., Vicente, A., and Antonio Teixeira, J. (2012). Characterization of intermediate stages in the precipitation of hydroxyapatite at 37°C. Chem. Eng. Sci. 77, 150–156. doi:10.1016/j.ces.2012.01.058
Chung, S.-Y., Kim, Y. M., Kim, J. G., and Kim, Y. J. (2008). Multiphase transformation and Ostwald’s rule of stages during crystallization of a metal phosphate. Nat. Phys. 5 (1), 68–73. doi:10.1038/nphys1148
Cui, L. H., Zhu, X., Ma, M., Ouyang, Y., Dong, M., Zhu, W., et al. (2008). Phosphorus sorption capacities and physicochemical properties of nine substrate materials for constructed wetland. Arch. Environ. Contam. Toxicol. 55 (2), 210–217. doi:10.1007/s00244-007-9109-y
Dai, H. L., and Hu, F. P. (2017). Phosphorus adsorption capacity evaluation for the substrates used in constructed wetland systems: A comparative study. Pol. J. Environ. Stud. 26 (3), 1003–1010. doi:10.15244/pjoes/66708
Delgado-Gonzalez, L., Lartiges, B., Gautier, M., Troesch, S., and Molle, P. (2021). Phosphorus retention by granulated apatite: Assessing maximum retention capacity, kinetics and retention processes. Water Sci. Technol. 83 (4), 792–802. doi:10.2166/wst.2021.010
Delgado-González, L., Prost-Boucle, S., Troesch, S., and Molle, P. (2021). Granulated apatite filters for phosphorous retention in treatment wetlands: Experience from full-scale applications. J. Water Process Eng. 40, 101927. doi:10.1016/j.jwpe.2021.101927
Dorozhkin, S. V. (2010). Amorphous calcium (ortho)phosphates. Acta Biomater. 6 (12), 4457–4475. doi:10.1016/j.actbio.2010.06.031
Harouiya, N., Martin Rue, S., Prost-Boucle, S., Lienar, A., Esser, D., and Molle, P. (2011). Phosphorus removal by apatite in horizontal flow constructed wetlands for small communities: Pilot and full-scale evidence. Water Sci. Technol. 63 (8), 1629–1637. doi:10.2166/wst.2011.250
Harouiya, N., Prost-Boucle, S., Morlay, C., Esser, D., Ruel, S. M., and Molle, P. (2011). Performance evaluation of phosphorus removal by apatite in constructed wetlands treating domestic wastewater: Column and pilot experiments. Int. J. Environ. Anal. Chem. 91, 740–752. doi:10.1080/03067319.2010.520132
Hermassi, M., Valderrama, C., Dosta, J., Cortina, J., and Batis, N. (2015). Evaluation of hydroxyapatite crystallization in a batch reactor for the valorization of alkaline phosphate concentrates from wastewater treatment plants using calcium chloride. Chem. Eng. J. 267, 142–152. doi:10.1016/j.cej.2014.12.079
Jang, H., and Kang, S.-H. (2002). Phosphorus removal using cow bone in hydroxyapatite crystallization. Water Res. 36, 1324–1330. doi:10.1016/s0043-1354(01)00329-3
Joko, I. (1984). Phosphorus removal from wastewater by the crystallization method. Water Sci. Technol. 17, 121–132. doi:10.2166/wst.1985.0124
Kadlec, R. H., and Wallace, S. D. (2009). Treatment wetlands. 2nd ed ed.. Boca Raton, FL: CRC Press, 1016.
Klute, A. (1986). Methods of soil analysis: Part 1—physical and mineralogical methods. SSSA book series. Madison, WI: Soil Science Society of America, American Society of Agronomy.
Kõiv, M., Liira, M., Mander, U., Motlep, R., Vohla, C., and Kirsimae, K. (2010). Phosphorus removal using Ca-rich hydrated oil shale ash as filter material – the effect of different phosphorus loadings and wastewater compositions. Water Res. 44 (18), 5232–5239. doi:10.1016/j.watres.2010.06.044
Mañas, A., Pocquet, M., Biscans, B., and Sperandio, M. (2012). Parameters influencing calcium phosphate precipitation in granular sludge sequencing batch reactor. Chem. Eng. Sci. 77, 165–175. doi:10.1016/j.ces.2012.01.009
McCabe, W. L., Smith, J. C., and Harriott, P. (2005). Unit operations of chemical engineering. McGraw-Hill.
Mercoiret, L. (2010). “Domestic wastewater characteristics in rural areas in France,” in Qualité des eaux usées domestiques produites par les petites collectivités: Application aux agglomérations d’assainissement inférieures à 2 000 Equivalent Habitants Cemagref.
Merriman, L., Hathaway, J., Burchell, M., and Hunt, W. (2017). Adapting the relaxed tanks-in-series model for stormwater wetland water quality performance. Water 9 (9), 691. doi:10.3390/w9090691
Meyer, J. L., and Eanes, E. D. (1978). A thermodynamic analysis of the amorphous to crystalline calcium phosphate transformation. Calcif. Tissue Res. 25, 59–68. doi:10.1007/bf02010752
Misture, S. T. (2021). “X-ray powder diffraction,” in Encyclopedia of materials: Technical ceramics and glasses. Editor M. Pomeroy (Oxford: Elsevier), 549–559.
Molle, P., Martin, S., Esser, D., Besnault, S., Morlay, C., and Harouiya, N. (2011). Phosphorus removal by the use of apatite in constructed wetlands: Design recommendations. Water Pract. Technol. 6 (3). doi:10.2166/wpt.2011.046
Molle, P., Lienard, A., Grasmick, A., Iwema, A., and Kabbabi, A. (2005). Apatite as an interesting seed to remove phosphorus from wastewater in constructed wetlands. Water Sci. Technol. 51 (9), 193–203. doi:10.2166/wst.2005.0318
Nancollas, G. H., and Mohan, M. S. (1970). The growth of hydroxyapatite crystals. Archives Oral Biol. 15, 731–745. doi:10.1016/0003-9969(70)90037-3
Ostwald, W. Z. (1897). Studien über die Bildung und Umwandlung fester Körper. Z. fur Phys. Chem. 22, 289–330. doi:10.1515/zpch-1897-2233
Perez, S., Munoz-Saldana, J., Acelas, N., and Florez, E. (2021). Phosphate removal from aqueous solutions by heat treatment of eggshell and palm fiber. J. Environ. Chem. Eng. 9 (1), 104684. doi:10.1016/j.jece.2020.104684
Predoi, S. A., Ciobanu, C. S., Motelica-Heino, M., Chifiriuc, M. C., Badea, M. L., and Iconaru, S. L. (2021). Preparation of porous hydroxyapatite using cetyl trimethyl ammonium bromide as surfactant for the removal of lead ions from aquatic solutions. Polym. (Basel) 13 (10), 1617. doi:10.3390/polym13101617
Rodriguez-Carvajal, J. (1993). Recent developments of the program FULLPROF commission on powder diffraction (IUCr). Phys. B 192 (55).
Shilton, A. N., Elmetri, I., Drizo, A., Pratt, S., Haverkamp, R. G., and Bilby, S. C. (2006). Phosphorus removal by an 'active' slag filter-a decade of full scale experience. Water Res. 40 (1), 113–118. doi:10.1016/j.watres.2005.11.002
Keywords: phosphate recovery, reactive filter, surface reaction, amorphous calcium phosphate, wastewater
Citation: Delgado-González L, Lartiges B, Troesch S, Proietti A and Molle P (2022) Seeded phosphorus retention in fixed-bed laboratory columns by the use of apatites. Front. Environ. Sci. 10:957807. doi: 10.3389/fenvs.2022.957807
Received: 31 May 2022; Accepted: 26 July 2022;
Published: 27 September 2022.
Edited by:
Regis Guegan, Waseda University, JapanReviewed by:
Boram Kim, Institut National des Sciences Appliquées de Lyon (INSA Lyon), FranceThomas Thiebault, PSL Research University, France
Daniela Predoi, National Institute of Materials Physics, Romania
Copyright © 2022 Delgado-González, Lartiges, Troesch, Proietti and Molle. This is an open-access article distributed under the terms of the Creative Commons Attribution License (CC BY). The use, distribution or reproduction in other forums is permitted, provided the original author(s) and the copyright owner(s) are credited and that the original publication in this journal is cited, in accordance with accepted academic practice. No use, distribution or reproduction is permitted which does not comply with these terms.
*Correspondence: Laura Delgado-González, bGF1cmEuZGVsZ2Fkby1nb256YWxlekBpbnJhZS5mcg==