 Cailin Qiu
 Ning Qiu2
 Tianjie Zhang
- 1Department of Urban and Rural Planning, School of Architecture, Tianjin University, Tianjin, China
- 2School of Architecture and Urban Planning, Shandong Jianzhu University, Jinan, China
The reasonable layout of green sports space has positive significance for promoting residents’ outdoor sports. Existing studies rarely use large-scale trajectory data to analyze urban greenway physical activity; they mostly use on-site research and questionnaires to conduct research. This study, using central Beijing as a case study, identified the spatiotemporal relationships of greenway use intensity with the social, economic, and built environment. A multiscale geographically weighted regression (MGWR) model was used to explore the temporal heterogeneity of the factors, compensating for the lack of cross-sectional data in existing studies. The results demonstrated significant differences in the spatiotemporal patterns among the core, central and inner suburban areas, and they revealed residents’ preferences in different periods. The MGWR model indicated that there were obvious scale differences and spatial heterogeneity in the greenway use intensity among social, economic, and built environment factors. Housing prices, residential density, historical resource density, and greening quality of greenways contributed to greenway use intensity, which was weak in the core area and strong in the inner suburban area. The reason for the difference in the temporal dimension was related to commuting and the separation of workplaces and residences. The layout of the greenway should be combined with rivers, historical resources, and green space to improve its attractiveness. This paper improved the spatial awareness of greenway use and facilitated the ability of urban planners to generate appropriate strategies to improve land use efficiency in different regions and promote green spatial justice to meet the needs of green, healthy cities.
1 Introduction
Walking and running are the most popular forms of exercise among residents due to no requirement of additional exercise equipment, low cost, and suitability for a wide range of people. (Li et al., 2022). Greenways are spaces for outdoor physical activity that provide a continuous and safe environment for walking, running, and cycling, thus effectively increasing residents’ exercise levels to improve their physical and mental health (Dallat et al., 2014; Lachowycz and Jones, 2013). Greenways are linear open space systems established along natural corridors, land or man-made corridors that connect parks, nature reserves, streams, and cultural and historical sites (Little, 1990). They are an integral part of the city’s green infrastructure and can assist in realizing the social benefits of green infrastructure. However, the intensity of use of urban greenways varies greatly from one geographic location to another, and some of the greenway segments that the government has invested heavily in are “No inquiry or interests from anybody” (Liu et al., 2016), while some popular greenway routes are “overcrowded”, which reduces the comfort of movement for residents. At the same time, the health benefits of greenways are even more pronounced for residents of high-density metropolitan areas (Chon and Scott Shafer, 2009). Therefore, it is necessary to explore the factors influencing the spatial heterogeneity of urban greenway use intensity to enlighten policymakers.
The effect of many influencing factors on the greenway use intensity has been investigated in existing studies, such as environmental quality, accessibility (Zhang H. et al., 2019), points of interest, population density, residential density (Ma et al., 2021), and green space ratio (Liu et al., 2016). The relationship between urban size and factors influencing greenway use intensity has not been fully explored. The effects of population density, housing prices, and the location of greenways on the promotion of sports are still controversial for cities of different sizes or communities in different geographical locations. Scholars generally agree that the effect of increased population density in low-density cities on the promotion of physical activities such as walking and cycling is robust, while a threshold may exist in high-density cities (Sato et al., 2018).
Building urban parks or greenways near marginalized urban communities may not promote more residents to exercise, but rather increase green gentrification (Rigolon and Nemeth, 2020). High-density metropolises have a more complex urban structure, and the spatial non-stationarity of the influencing factors is still unexplored. But on the other hand, land resources are scarce in high-density metropolitan areas, and the supply of green space is difficult. Compared with the construction of urban parks, it has a stronger availability to build greenways. Because the construction of the greenway can use the existing green belt, the current non-motorized road, etc. Therefore, optimizing the layout of greenways in high-density metropolitan areas has a positive effect on promoting outdoor sports for residents of megacities. In addition, the existing studies mostly study the factors influencing the greenway use intensity in micro cases, lacking the characteristics of comparing different regions from the city level (Zhu et al., 2019) (Chang et al., 2020; Tan et al., 2021). For government managers and urban planners, knowing only how some of the greenway segments are used is not enough to develop an urban greenway planning strategy. Mapping the overall intensity of use of greenways at the city level and the differences in the impact of the built environment on different areas plays an important role in developing plans to further optimize urban greenways and meet the actual needs of residents. This suggests that research at the urban scale has deeper social implications. Complementing urban-scale research can extend existing research findings.
A large number of studies on greenway sports are based on direct observation and field research, with sample sizes ranging from 200 to 300 (Chen et al., 2022; Zhu et al., 2019). Traditional research methods to collect information not only require considerable time and money but are also prone to sampling bias in the selection of respondents, which affects the results of the study (Cohen et al., 2016). Research methods have mostly used OLS, multiple linear regression, and correlation analysis, and the spatial dependence of the factors has not been extensively demonstrated in studies (C. Chen et al., 2020a; Liu et al., 2022). With the development of internet technology, GPS data provide new perspectives and methods for urban spatial studies. Trajectory data record the spatial location of objects at a given moment, and because their spatial location varies continuously over time, they can be used to study the behavior of people or animals (Ribeiro De Almeida et al., 2020). Trajectory data analysis has been applied to various research areas, including behavioral science, urban transportation, and urban planning (Choi et al., 2021). Current research using trajectory data for urban layout optimization is mainly focused on urban transportation, and scholars have conducted studies using cabs (Di et al., 2021) and bicycles (Zhang et al., 2019b; McArthur and Hong, 2019) travel trajectories. Methods that use cell phone applications to collect movement data of individuals in time and space can effectively provide large and extensive geospatial movement information (Hirsch et al., 2014). Large-scale, fine-grained movement trajectories provide a basis for studying the spatial effects of the built environment on the intensity of greenway use.
In general, studies addressing the intensity of greenway use are limited in several ways. First, in terms of research subjects and data collection, the literature mostly uses on-site research, interviews, and counting methods to investigate the greenway segments in cities. Researchers have had difficulty analyzing the spatial patterns of greenway use intensity at the urban scale and have failed to empirically study the spatial heterogeneity of greenway use. Second, in terms of the research methods of the influencing factors, most of the established studies use multiple linear regression and other methods based on the assumption of mutual independence between samples. According to the first law of geography, “Everything is related to everything else, but near things are more related to each other”, the existing research does not take into account the intensity of greenway use and the possible spatial dependence of built environment elements in space, resulting in the research results not being close to the actual situation. Finally, established studies mostly use cross-sectional data and fail to integrate time and space into a unified research framework.
With the development of urbanization and the expansion of urban population and space, High-density metropolises are an important object of national governance. The fine management of megacities is an inevitable choice for sustainable urban development. The study of microscopic cases is not sufficient to extrapolate the overall urban greenway use intensity characteristics. In particular, the core and fringe areas of megacities have large differences, and the influencing factors may have different effects on them, which remain to be explored. Strengthening the full knowledge of spatial and temporal patterns and influencing factors of greenway use from the urban scale is important to enhance the efficiency of greenway use and promote outdoor sports for residents. In this paper, we were mainly concerned with exercise on greenways in the central city of Beijing. We first used trajectory data to assess the spatiotemporal pattern of greenway use for sports. Second, the MGWR model was used to explore the different spatiotemporal relationships between the influencing factors and the intensity of greenway use in the urban core and peripheral areas. The purpose of this paper is to increase spatial awareness of the intensity of urban greenway use and to inform urban planners and policymakers.
2 Materials and methods
2.1 Study area and units of analysis
The study area is the central urban area of Beijing, which includes Dongcheng, Xicheng, Haidian, Chaoyang, and Shijingshan, totaling 1,375.70 square kilometers. The central urban area of Beijing has the characteristics of concentrated resources, a developed economy, and densely integrated service facilities when compared to other parts of the city. More notably, the central urban area has high-quality greenways and an enormous total construction volume, with numerous remarkable greenway projects. Given this scope, it is more meaningful to investigate the characteristics and influencing factors of greenway use. In Beijing, greenways are divided into urban and countryside types, which differ greatly in terms of the people who use them, the time at which they are used, their environmental characteristics, and their geographical location. As a result, this study concentrates on urban greenways and selects the central urban area as the study region, with comparable differences between districts. According to the Beijing Master Plan (2016–2035), the spatial structure of the central urban area is divided into core, central, and inner suburban areas (Zhao and Hu, 2019). The core area refers to Dongcheng and Xicheng, which are the window areas of China’s political, cultural, and international communication centres. The central area is the central functional area of the capital, including the Forbidden City, the old city centre, and the areas located within the 4th Ring Road. Its primary functions are to serve and defend the functions of the central government, transmit a historical and cultural legacy, strengthen international communication and economic operations, and provide residents with public cultural services. The inner suburban area includes the areas located outside the 4th Ring Road, with the main function of building innovative technology industrial parks.
Subdistricts are utilized as the primary unit in this study for the following reasons. 1) Based on statistical calculations, we discover that the average length of a movement track is approximately 8 km, which cannot be covered and is not significant if the study unit is too small. 2) Previous research has indicated that the majority of greenway users come from local communities (Jim and Shan, 2013; Zhu et al., 2019). Communities in China are controlled by subdistricts, which are the smallest demographic unit with trustworthy data in China (Li C. et al., 2021).
2.2 The explanation of greenways in Beijing
In the Beijing Municipal Level Greenway System Plan, a greenway is defined as a public space system built based on green space and dedicated to walking and bicycling, including two basic elements: greenway routes and greenway nodes. The greenway route is a linear space for users to conduct cycling, hiking, and sightseeing activities, including bike paths, walking paths, and their surrounding green buffer zones. The greenway node is a collection space of important service facilities on the greenway route, including bicycle rental points, motor vehicle parking lots, merchandise sales points, management houses, and other contents, capable of undertaking service and traffic conversion functions. Some of the greenway nodes also have functions such as camping, ambulance, and bicycle maintenance. The government builds greenways to integrate green resources to implement ecological restoration, increase accessibility to urban green landscapes and historical and cultural heritage resources, improve green travel, and obtain multiple benefits for the ecological environment and social well-being. Despite the abundance of green space resources in Beijing, many green spaces are still fenced in, resulting in poor accessibility for residents, and the green spaces only serve a landscape function. By building greenways, effective ecological corridors can be formed, and the recreational and fitness benefits of green space can be realized. On the other hand, the government encourages residents to go green and build a green transportation system in the city. Provide safe and comfortable space for active travel by vacating road barriers, planting street trees with small shrubs and other vegetation, and adding or optimizing existing nonmotorized lanes. Based on planning positioning, land use, and field observations, we have classified the greenways in the central city of Beijing into the following categories (Figure 1): riverfront greenways, pedestrian green corridors, park greenways, and traffic greenways. At present, the length of completed greenways exceeds 1200 km in the whole city, of which more than 500 km is built in the central city, and by 2035, the central city greenway will exceed 750 km (Beijing Municipal Bureau of Landscape and Greening, 2014). In terms of the hierarchy of greenways, greenways in Beijing can be divided into city-level greenways, district and county-level greenways, and community-level greenways. The municipal greenway is the backbone of the greenway system, through which the city’s best ecological and cultural landscape resources are connected and built as a demonstration project. District and county greenways are built between the internal resources of municipal greenways in different areas to increase accessibility between greenways, scenic spots, and transportation facilities. Community-level greenways complement local spaces to extend the service area of the greenway.
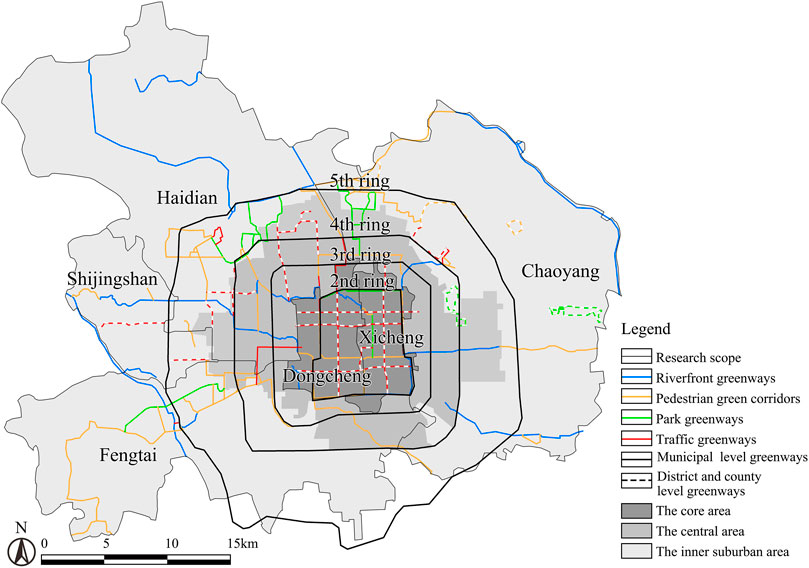
FIGURE 1. Research location and the hierarchy of greenway types in the central urban area of Beijing.
2.3 Data collection
We use Keep, the most popular exercise recording application in China, to collect user movement trajectory data and build a database. Keep is available worldwide and has exceeded 200 million users, with over 6 million daily users. Users can use the app to record and upload their movement trajectories to the server, and the uploaded original GPS trajectories are then processed into aggregated trajectory data in the background. The user movement trajectories comprise three types—walking, running, and cycling—according to the 2020 Keep Product Analysis Report. Users under the age of 25 years account for 25%, those 25–35 years old account for 59%, those 35–40 years old account for 13%, and those over 40 years old account for 3%. Moreover, female users make up 58% of all users, while male users make up 42%.
In this study, we create a database of physical activity trajectories using greenways, and the methodology for creating this database includes three stages: data collection and deduplication, data merging, and data filtration. First, we crawl trajectory data from an open website of users’ real-time movement trajectories using Python, version 3.8 (https://www.gotokeep.com/maptrack). From 7 January to 20 January 2022, we collect data from the website for these 15 consecutive days during three periods when residents are physically active: 6:30–8:30, 15:00–17:00, and 19:00–21:00. There was no extreme weather (rain, snow, high winds, and extremely low temperatures) or heavy pollution in Beijing during the data collection period that had a significant impact on outdoor fitness. In terms of the effect of season on the association with outdoor fitness, in general, exercise levels are higher in summer than in other seasons, especially in the winter (Garriga et al., 2022). Although the data were collected during the winter season (average daytime temperature of 3°C and an average nighttime temperature of -6°C during the data collection period), the results showed that Beijing residents still maintained a high frequency of outdoor exercise behavior. This may reflect residents in Beijing have good fitness habits and outdoor fitness awareness, and that the season has less influence on their outdoor exercise behavior than individuals with stable exercise habits. Even in winter, outdoor sports still have health benefits (Frühauf et al., 2020).
Since we do not know the time interval for website data refreshing beforehand, we set the collection interval to 10 min and obtain a total of 1,029 JavaScript Object Notation (JSON) files. We traverse these files using Python, read the data content, eliminated duplicate files, and finally are left with 225 files. After data deduplication, we find that the website data refreshing time is approximately 20 min, and five datasets are retained in each period. We then use Python version 3.8 to stitch the JSON files together according to the time information and use QGIS, version 3.22.2, to export the JSON data to ArcGIS, version 10.2. Finally, since the data we collect are on the movement trajectories of all Keep users in Beijing, we need to filter out those data related to greenways within the central urban area. According to the Planning of Beijing Municipal Greenway System, the width of the landscape control area of the municipal greenway should not be less than 20 m; thus, we use 20 m as the screening criterion (Liu et al., 2016). According to the Beijing Greenway Plan, this study takes the municipal-, district- and county-level greenways in central Beijing as the source layer and takes 20 m as the search distance to filter the trajectory data intersecting with the source layer. After eliminating the obvious outliers, we finally obtain 35,733 trajectories and establish a trajectory database of greenway use in central Beijing.
In addition, we use physical geographic, and socioeconomic data when studying the factors influencing greenway use intensity. Natural geographic data include 30-m-resolution digital elevation data (https://www.gscloud.cn/search), Beijing River distribution data (https://www.resdc.cn/), and Beijing green land data (http://www.beijingcitylab.com). Socioeconomic data include population statistics data (Baidu population data), Beijing Road data (http://kmap.ckcest.cn/), Beijing point-of-interest (POI) data (Baidu maps), and Beijing housing price data (https://www.fang.com/).
2.4 Method
2.4.1 Kernel density estimation
KDE can be used to calculate the kernel density of both point and line data (Jiang and Li, 2021) and is used to estimate the density of elements in their surrounding neighborhoods. In statistical investigations of hotspot analysis in an urban area, KDE is extensively used, the formula of which is as follows:
where
2.4.2 Geographically weighted regression
The observed values of variables in the geospatial analysis are usually obtained using a given geographical unit as a sample unit, the relationships between variables change as the geographical location shifts, and the adjustment of these caused by a change in geographical location is known as spatial nonstationary adjustment (Tan et al., 2019). The GWR model is introduced to remedy the distortion of the analysis findings caused by the non-stationarity of the geographical data.
To investigate the factors that influence greenway use intensity, we first use OLS regression to determine whether the independent and dependent variables have a linear relationship. If the Koenker test in the OLS model succeeds, then there is spatial heterogeneity between greenway intensity use and the variables, and the study should use the GWR model to measure the correlations across different regions, an approach that is more compatible with the objective facts. Thus, the GWR model is introduced in this paper.
where
The choice of the spatial weight matrix for the GWR model is critical, and this work calibrates the weight function using the adaptive method in the GWR tool in ArcGIS10.2. The bandwidth value has an impact on model fitting accuracy, and the GWR model is sensitive to this value. In this study, the optimal bandwidth is determined when the Akaike information criterion (AIC) is minimized (Liu et al., 2020).
2.4.3 Multiscale geographically weighted regression
The optimal bandwidth used in the geographically weighted regression model is a fixed value to reflect the spatial variation of all factors. However, in a multi-factor analysis, the optimal bandwidth of different factors may vary widely. Therefore, we used a multi-scale geo-weighted regression model to calculate the optimal bandwidth for each factor. The calculation formula of the MGWR model is as follows:
Where
2.4.4 Conceptual indicator framework
To develop our framework, according to previous research results, we undertake an overall review of the factors influencing greenway use intensity. By reviewing the established studies, the factors influencing greenway use intensity include three aspects: demographic characteristics, greenway characteristics, and environmental deviations. Among these aspects, greenway characteristics reflect the differences in the quality of greenway construction, and it has been extensively studied. Demographic characteristics characterize the preferences of different individuals, and environmental deviations reflect the influence of the built environment on greenway use. This paper presents a conceptual framework in terms of social, economic, and built environment dimensions and develops a system of indicators to assess the factors influencing the spatial heterogeneity of greenway use intensity Figure 2, Table 1).
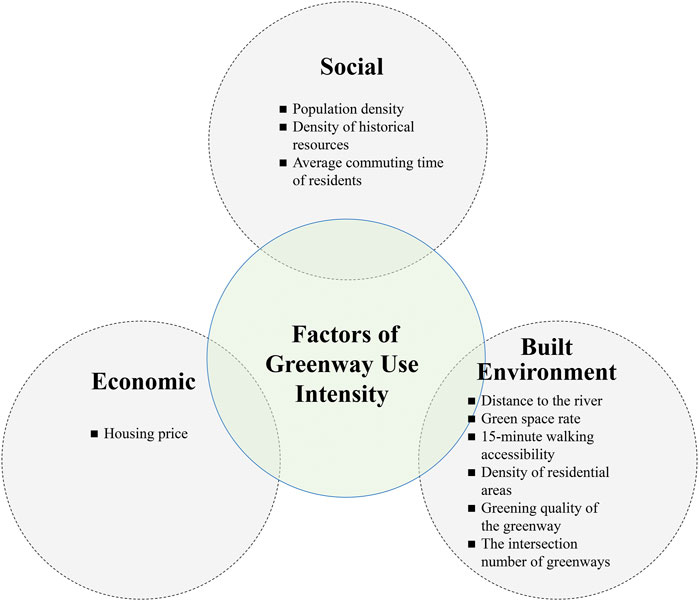
FIGURE 2. Conceptual framework of greenway use intensity.
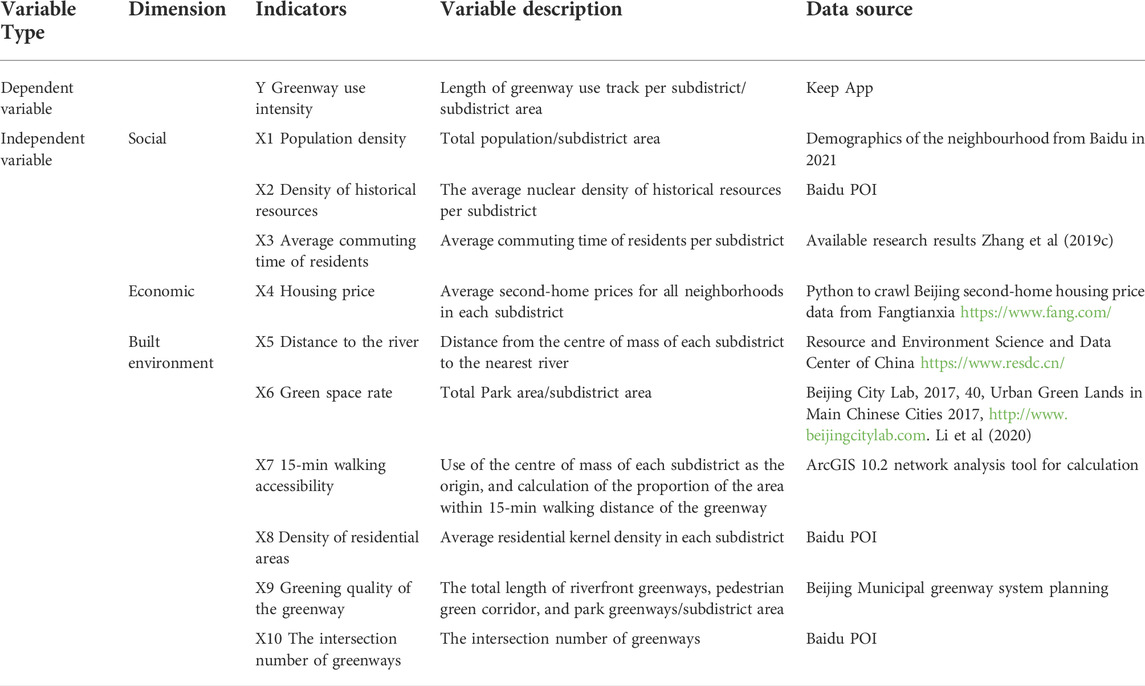
TABLE 1. Description of greenway use intensity variables and data sources.
In addition to the basic indicators, we also conducted a preliminary assessment of the green quality and safety of the greenway. Previous studies have shown that pavement grading, the number of intersections, and vegetation cover all contribute to the level of residential greenway use (Anderson et al., 2019; Chang, 2020; Chen et al., 2022; Wang et al., 2021). We used land use of the greenway to roughly assess the quality of greenery. Most of the greenways in Beijing are built by adding or renovating according to the existing land use conditions, which can be divided into the following four types: (1) Greenways constructed using riverfront green belts and trails. (2) Greenways constructed using street parks or road greenbelts. (3) Greenways constructed using park trails. (4) Greenways constructed using nonmotorized paths and walkways. The first three of these types of greenways have higher quality greenery, ample space, and less impact from cyclists and walkers interfering with each other while using the greenway. Greenways constructed using nonmotorized paths and walkways often borrow street trees for shade, the greening land of urban roads is more limited, and its landscape quality and use of comfort are relatively low compared with those of the first three types. We used the lengths of the first three types of greenways to represent the high greening level greenways and used the number of greenway intersections to assess the safety of the greenway.
Besides selecting general impact indicators, this study also considered factors related to urban greenway alignment selection, such as historical and cultural attractions and rivers. We hoped to verify, through regression analysis, how the realistic use characteristics of the greenway at the current stage dovetail with the plan, as well as whether the greenway use is consistent with the planning goals. In addition, we extend the depth of the study to the time dimension and analyze it for three different periods of the day when residents are active in sports. For metropolitan residents, work commuting occupies a large amount of time, and longer commuting times will crowd out more exercise time (Nicholls et al., 2018). Therefore, we include the average commuting time of residents as an influencing factor.
3 Results and analysis
3.1 Spatial pattern of greenway use characteristics
By summarizing the data of 35,733 trajectories, we discovered that the spatial pattern of greenway use displayed a circular structure of strength within the 4th Ring Road and was weak in the inner suburban area. The red area was the centre of the region with the highest kernel density representing Aoyunxincun in Chaoyang District and Ganjiakou in Haidian District (Figure 3). There were two additional regions, Donghuamen and Longtan in Dongcheng District, that exhibited higher kernel density. The shortest distance of the physical activity trajectory was 605.9 m, the longest distance was 35,120.1 m, the average distance was 8,094.6 m, and more than 90% of physical activities were carried out within 10 km of greenways. The spatial pattern of greenway use intensity was divided by the 4th Ring Road, with obvious differences between the inner and outer circles. The core area was the area with the highest greenway use intensity. To investigate whether the features of clustering statistics of greenway use intensity were high- or low-value aggregation and to identify the spatial distribution pattern of greenway use more accurately in Beijing, the local spatial autocorrelation analysis tool provided by Geoda was used for analysis. Figure 4 showed the spatial aggregation pattern of the local indicator of spatial association (LISA) of greenway use intensity in Beijing. The aggregation pattern of greenway use intensity could be classified into four types: high-high (HH), low-low (LL), high-low (HL), and low-high (LH) agglomeration. HH agglomeration was distributed within the third ring, with its eastern side surrounded by LH agglomeration, but an HL agglomeration area was not found, which indicated that high greenway use intensity in this area had a certain spatial spillover effect. The LL area was distributed mainly in the inner suburban area outside the 5th Ring Road.
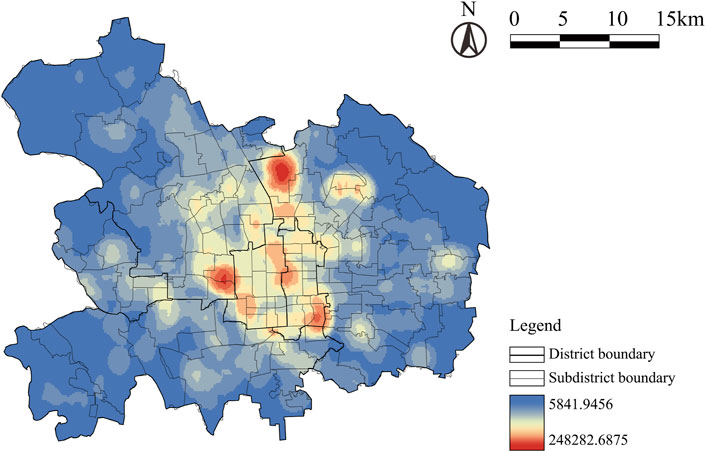
FIGURE 3. Spatial KDE distribution of greenway use intensity in central Beijing.
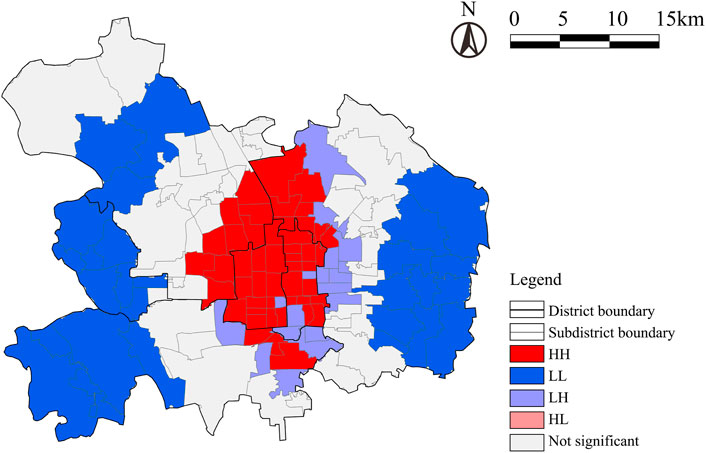
FIGURE 4. Spatial aggregation distribution of the LISA of greenway use intensity in central Beijing.
3.2 Temporal patterns of greenway use characteristics
3.2.1 Results during working days and over the weekend
Workday datasets were extracted on January 7 (Friday), 11 (Tuesday), 17 (Monday), and 19 (Wednesday), 2022, for a total of 9,672 data pointed over these 4 days. Weekend data from this dataset were extracted for January 8 (Saturday), 9 (Sunday), 15 (Saturday), and 16 (Sunday), 2022, for a total of 9,874 data pointed for these 4 days. The above two datasets were aggregated separately as a source of data for weekdays and weekends. According to the data comparison results, the total frequency of residents using greenways on weekdays and that on weekends were similar, with no significant difference. The fundamental distinction between the two was their spatial distribution (Figure 5A) illustrated the KDE for the distribution of greenway use on weekdays. The junction of Ganjiakou and Yangfangdian, Haidian and Aoyunxincun, and Chaoyang, showed the highest density of greenway use. Second, Donghuamen and Longan, Dongcheng, also showed higher density than that of other areas. The latter had a larger distribution area than the former Figure 5B illustrated the KDE for the distribution of greenway use on weekends, with the highest density found in Aoyunxincun, Chaoyang. Ganjiakou. Yangfangdian, Longtan, and Shichahai showed a higher density. We noticed a stronger clustering of residents using greenways on weekends compared to weekday KDE outcomes, with a considerable aggregation effect in Aoyunxincun. This finding suggested that more residents tended to visit greenways in Aoyunxincun for sports on weekends. The reason for this disparity might be that on weekends, individuals chose city-level greenways with strong linkages to large urban parks, such as the Olympic Forest Park Greenway, whereas on weekdays, people preferred community-level greenways near the place of living for physical activities.
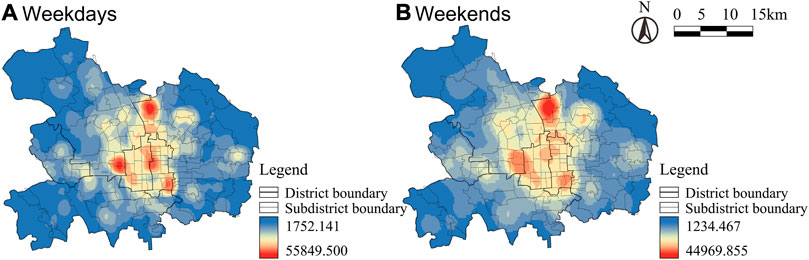
FIGURE 5. Spatial KDE distribution of greenway use intensity during working days and over the weekend in central Beijing.
3.2.2 Intraday comparison results for different periods
Since the physical activity trajectories showed evident activity variations in different periods compared to those of cabs and bike-sharing vehicles, we did not compare the frequency of trajectories throughout a full 24-h day. We collected data from the website during three periods in which residents were physically active: 6:30–8:30, 15:00–17:00, and 19:00–21:00. We further divided the dataset into sub-datasets for the above three time periods and then performed a temporal pattern analysis of greenway use intensity. The statistics in Figure 6 showed that residents preferred to use greenways for exercise in the morning, followed by the afternoon, with the lowest frequency for exercise being in the evening. When comparing weekday and weekend data within a single day, we discovered that individuals preferred to use greenways more in the evening on weekdays and more in the morning and afternoon on weekends (Figure 7). On the one hand, this finding was attributable to the fact that the majority of Keep users were of working age. In the morning, residents faced commuting time pressure, and the majority of physical activity occurred in the evenings on weekdays because of an increasing number of urban commuters exercising via night running (Rozmiarek et al., 2022). On the other hand, the preference of people to exercise in the morning on weekends might be related to the air quality in Beijing at night, when they are not faced with commuting time pressure. Due to the effects of pollutant emissions from heating and the height of the boundary layer in the urban area, air quality in Beijing is higher during the day than at night in autumn and winter (Tao et al., 2018). In comparison to parks, greenways feature a hierarchical structure that makes them more widely accessible to communities. Figure 8 indicated that the KDEs of the trajectories of the three time periods were spatially significantly different. During the period 6:30–8:30, the high-density area for greenway use was Ganjiakou, Yangfangdian, in Haidian, and Aoyunxincun in Chaoyang. During the period 15:00–17:00, the area was Aoyunxincun in Chaoyang. During the period 19:00–21:00, the high-density area was centred on Chang’an Street and Donghuamen and spread in all directions. Compared to the first two, this third area was the largest high-density area. Moreover, greenways provided better accessibility and usability than urban parks. Thus, the needs of community residents should be prioritized in greenway planning. Greenways should be created with lights and nighttime facilities as residents’ demand for nighttime exercise grows.
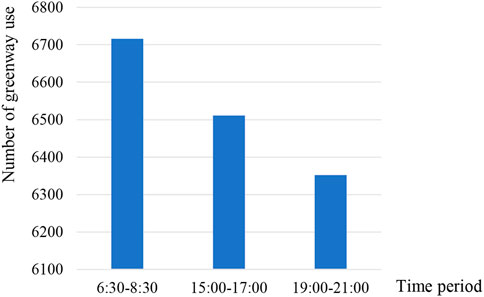
FIGURE 6. Comparison results for different periods.
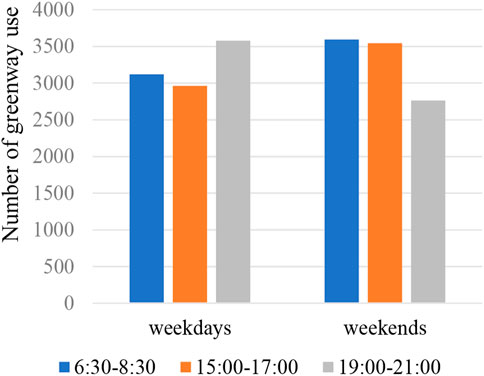
FIGURE 7. Intraday comparison results for different periods.
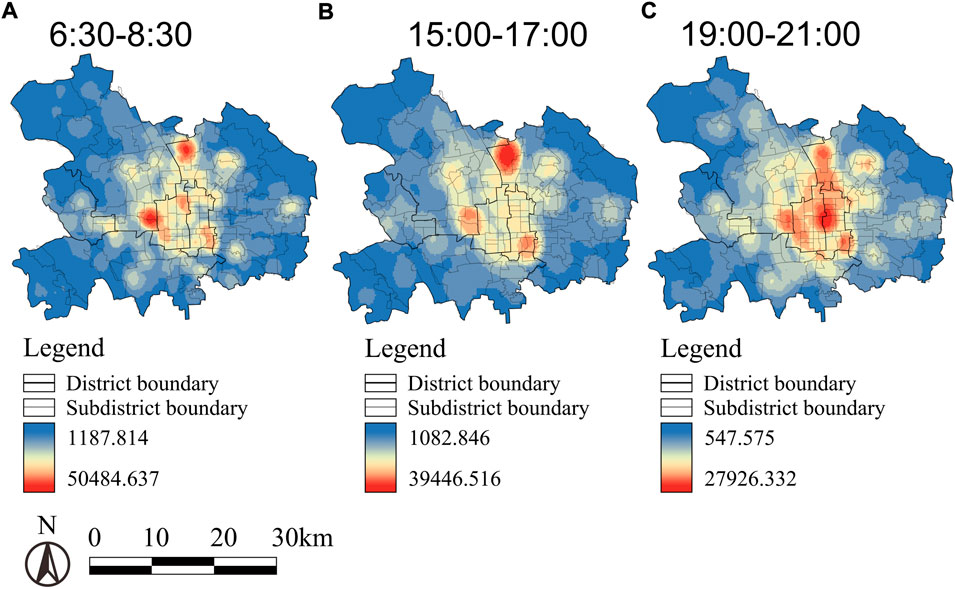
FIGURE 8. Spatial KDE distribution of greenway use intensity for different periods within a day.
3.3 Factors influencing the spatial heterogeneity of greenway use
3.3.1 Comparison between OLS, GWR, and MGWR
We analyzed the independent and dependent variables successively by OLS, GWR, and MGWR methods and then compared their results. First, we tested the independent variables for collinearity, the calculation results of which showed that there was no collinearity among the ten independent variables (variance inflation factor (VIF) < 7.5), so the selection of independent variables was reasonable (Table 2). The OLS method explains 29.39%, 14.35%, and 25.45% of the total variation in overall greenway use intensity. Additionally, the findings of the Koenker (BP) test of the OLS model diagnostic results were significant, indicating that this study can use the GWR model. Table 3 showed the model diagnostic results for OLS, GWR, and MGWR. After we used the MGWR model, the residual sum of the square value decreased, the AIC value decreased (>3 indicates a better model fit), and the R-squared value improved. As a result, this work employed the MGWR model for local spatial regression analysis, which successfully reduced residual sums of squares, improved simulation accuracy and goodness of fit, and was a more efficient model.

TABLE 2. Collinearity test.
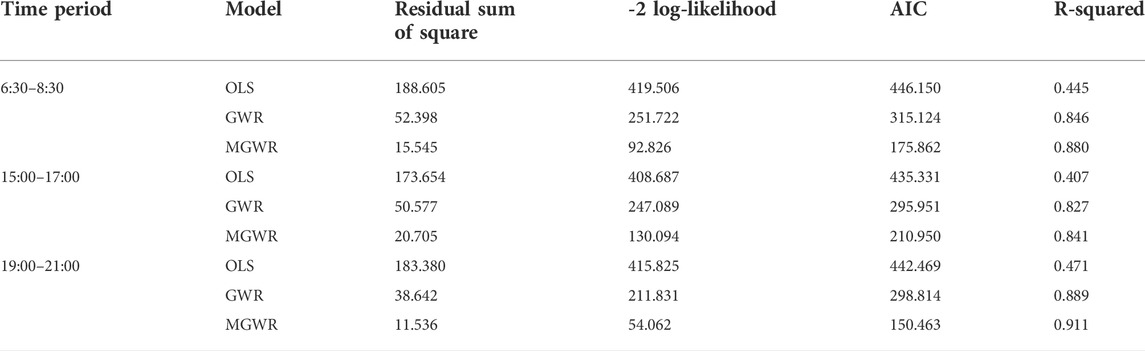
TABLE 3. Comparison of OLS, GWR, and MGWR models for different periods.
3.3.2 Scale analysis
First, we investigated the scale of influencing factors at different time periods based on the model bandwidth (Table 4). The MGWR model calculated the bandwidth separately for each independent variable. The smaller the bandwidth, the smaller the effect size of the independent variable on the greenway use intensity, which can be considered as a local influence factor. A larger bandwidth indicates that the independent variable has a wider effect size on the greenway use intensity and can be considered as a regional or global influence factor. In the regression results, the regression coefficients of population density, historical resources density, average commuting time, housing prices, distance to rivers, green space rate, 15-min walkability of greenways, residential areas density, and greening quality of greenways were significant overall (Table 5). In all three time periods, population density, historical resource density, and distance to rivers were local influence factors. It showed that the greenway use intensity in central Beijing varies widely with the spatial variation of the above factors. The green space rate, the 15-min walkability of greenways, and the greening quality of the greenway were regional impact factors. The average commute time in the period of 6:30–8:30 was the local impact factor, and it was the regional impact factor in the other two time periods. It indicated that the greenway use intensity was more closely related to the morning peak in terms of spatial location. Housing prices were a regional influence factor in the period of 6:30–8:30, and it was a local influence factor in the other two time periods. Residential area density was a local impact factor in the period of 19:00–21:00, and it was a regional impact factor in the other two time periods.
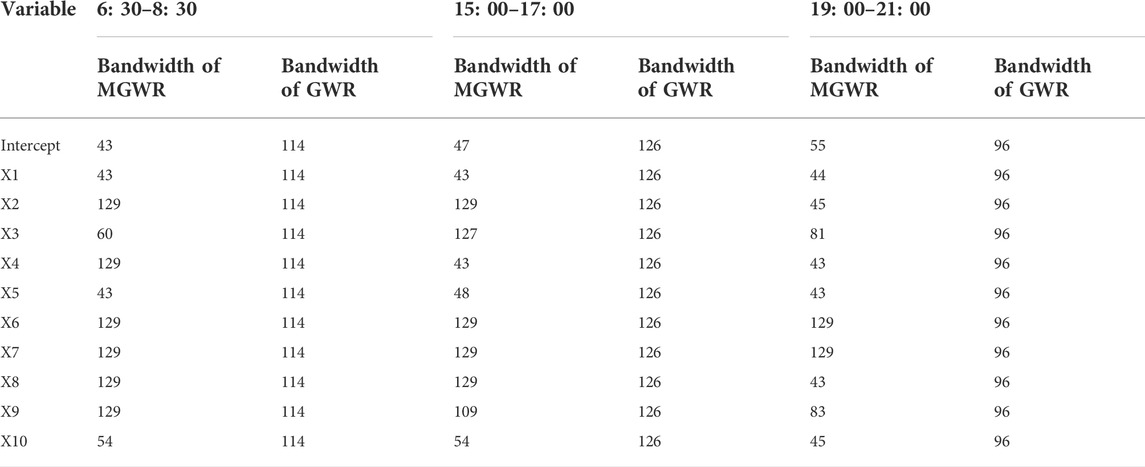
TABLE 4. Bandwidth of GWR and MGWR
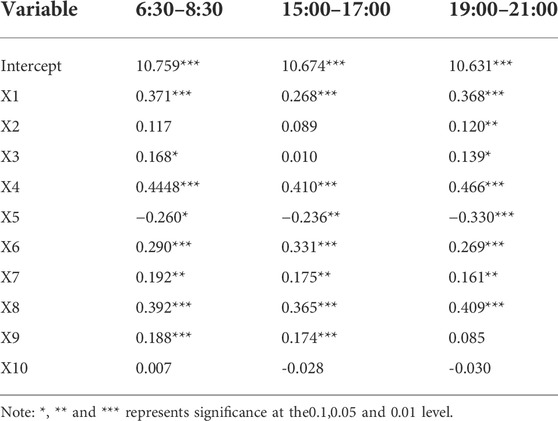
TABLE 5. Regression coefficients of terrain factors in the OLS model.
3.3.3 Spatial heterogeneity analysis of influencing factors
Table 6 showed the results of the 10 independent variables on the greenway use intensity. In regions where the significance test passed, the median coefficients of the independent variables were positive, except for the distance to rivers. It indicated that there was a positive correlation between the independent variables and the greenway use intensity in most of the study areas. The results of the study showed that housing prices and residential areas density had the strongest effect on greenway use intensity at all periods, followed by green space rate, 15-min walking accessibility, and population density also significantly affecting the level of greenway use; finally, greening quality of the greenway, distance to rivers, the density of historical resources and average commuting time of residents also had effects on greenway use intensity. After visualizing the regression coefficients of the MGWR model, we found spatial heterogeneity in the effect of the respective variables on greenway use intensity at different periods. In terms of the positive and negative effects of the impact, the distance to rivers was negatively correlated with greenway use intensity. The closer that the neighborhood was to the river, the higher the greenway use intensity was. The rest of the respective variables were positively correlated with greenway use intensity.
(1) Social dimension. The contribution of population density and historical resource density to the greenway use intensity showed a significant overall contribution to the inner suburban area. The effect of the average commuting time of residents passed the significance test in the western part of the central city. At the temporal level, population density and average commute time were more constant for areas outside the fourth ring as the time of day progresses. Historic resource density was promoted significantly in the afternoon for the western suburban area of the central city, and in the evening for the southwest and northeast regions.The promotion of physical activity by population density was significant in previous studies (Chandrabose et al., 2021), and the results of our study were the same. Because higher population density is usually associated with smaller neighborhoods, a higher mix of land functions, and greater accessibility (Frank, 2000). Thus, the population density can promote physical activity in the vicinity of the greenway.Historic resource sites are important nodes of the Beijing Greenway, and urban builders have built a large number of urban human landscapes around historic resources, enhancing the spatial attractiveness of these areas. The Beijing Greenway is given the function of stringing together the city’s historical resources and attractions during planning and construction, so historical and cultural resources have a catalytic effect on greenway use. The areas with greater influence are mainly located in the suburban areas outside the fourth ring road, related to the spatial clustering characteristics of historical and cultural resources. A large number of world-class and national historical and cultural heritage sites are concentrated in the core area of Beijing, and the level of their conservation implementation is extremely high. Relatively speaking, there are fewer historical and cultural resources in peri-urban areas, and the uneven distribution of resources could lead to a different attractiveness level of the environment to people. The eastern (Chaoyang District) and southwestern (Fengtai District) parts of central Beijing are areas where historical and cultural resources are less distributed, and in these areas, historical and cultural resources are more attractive to people than greenway nodes.Urban sprawl and suburbanization not only increase residents’ commuting time but also encroach on their daily activities (Li R. et al., 2021), yet our study found a positive correlation between commuting time and the intensity of residents’ greenway use, and the reasons for this result could be related to population characteristics and the separation of workplaces and residences. The vast majority of the sample population in this study is young and middle-aged people of working age. Due to high housing prices in metropolitan centres, young and middle-aged people choose to rent or buy homes in the suburbs of the city, which can lengthen their commuting time (Han and Yang, 2019). However, at the same time, they are a high-demand group for outdoor sports, suggesting that middle-aged youths living in suburban areas of the city (Chaoyang District and Fengtai District) are more affected by commuting time when engaging in greenway physical activity.
(2) Economic dimension. The contribution of housing prices to the greenway use intensity was stable and significant. Spatially, it exhibited a circling divergence, i.e., it was significantly higher for the inner suburban areas than for the core areas. In terms of the time pattern, in the morning it had a greater effect on the western part of the central city; in the afternoon, it had a small difference in the strength of the effect on the area outside the fourth ring; in the evening, it had a greater effect on the eastern part of the central city. This finding suggested that high-quality greenway sports environments were more likely to be concentrated in areas with higher housing prices, thus encouraging residents to play sports near greenways. First, there is an interactive relationship between housing prices and urban green space. On the one hand, supply and demand theory and housing characteristic price theory explain the significant, positive effect of park green space per capita on housing prices (Yu and Zhan, 2022), while the spatial heterogeneity of housing prices can further lead to differences in the spatial allocation of resources (Sun and Yang, 2021), with green space being considered an environmental superiority of wealthy areas over disadvantaged communities (Kong et al., 2007) and housing prices representing residents’ ability to afford a green environment (Y. Chen et al., 2020b). As a new type of green space, greenways not only have recreational functions similar to those of parks but are also carriers of green transportation. Previous research found that greenways with pedestrian or cycling transportation components built between 2008 and 2015 in 10 US cities were more likely to lead to gentrification than regular parks (Rigolon and Nemeth, 2020). Second, one possible reason for the positive effect of housing prices on greenway use intensity being weaker in the core area is that, in the old city, where there is a concentration of scarce landscape (large parks and water bodies) resources, which are abundant in Beijing overall, there is less exclusivity over scarce landscapes; thus, the intensity of residential greenway use is less influenced by housing prices. In addition, the circle differentiation of housing prices is obvious in Beijing. Prices in the core city area are as high as $25,000/m2 and close to each other in different neighborhoods; however, the closer that one is to the fringe of the urban area, the greater the difference in prices is (influencing factors include schools, hospitals, commercial centres, transportation facilities, etc.). In general, housing prices in the core area are similar, with a large difference in the urban fringe area. Greenway distribution is not equal and is concentrated in places with high housing prices and adequate facilities (Rigolon and Nemeth, 2020). A combination of factors led to a more significant impact of housing prices on greenway use intensity in the inner suburban area.
(3) Built environment dimension. The effect of distance to rivers on the greenway use intensity was significant in the northeast of the central city and the southern section. A negative value of the coefficient meant that the closer the distance to the river the higher the intensity of greenway use. In the northeast of the central city, the completed Wenyu River Greenway is about 28km, which is sought after by long-distance running and cycling enthusiasts because of its high quality and comfort. Moreover, it has good connectivity with the Wenyu River Park and the Eastern Suburbs Forest Park. The Liangshui River Greenway located in the southern region is another important waterfront greenway, but its construction scale and environmental quality are slightly lower. Rivers are an important basis for selecting routes for greenway construction in Beijing, and the regression results showed that real-life greenway use was consistent with the planning vision. The attractiveness of waterfront greenways to residents is related not only to the human instinct for water created by the dependency relationship between people and water (Wu et al., 2019) but also to the obvious advantages of waterfront space for ecological environments, social interactions, and cultural heritage (Fan et al., 2021).
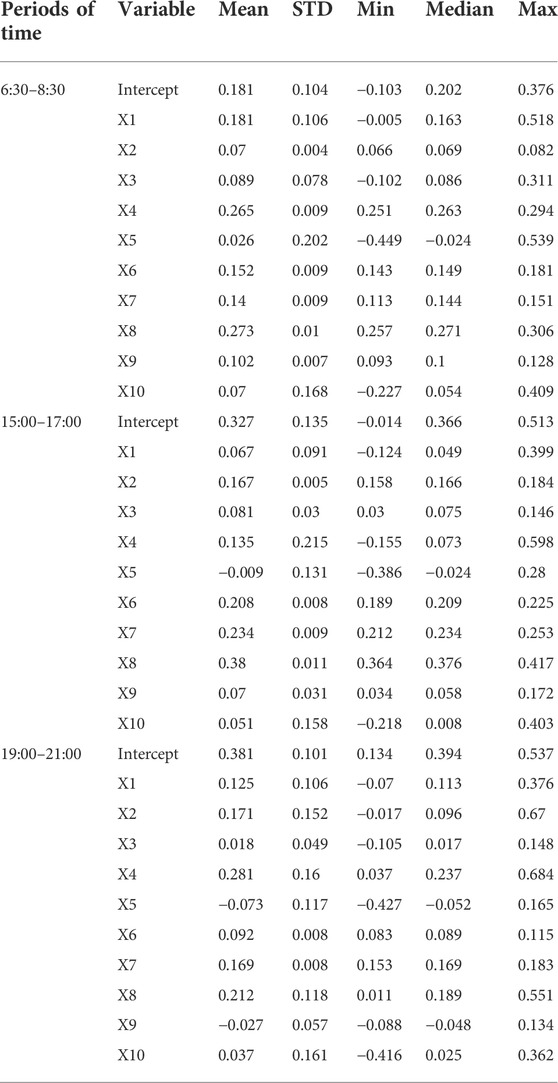
TABLE 6. Statistical description of MGWR coefficient.
The contribution of green space rate to the greenway use intensity had a different spatial and temporal pattern. The effect was stronger for the western region of the central city in the early morning and evening, and significantly for the northern region in the afternoon. First, for the majority of working people, early morning and evening are the main time to exercise. The eastern region is a shallow mountainous area with a higher green space ratio, thus contributing more significantly to the intensity of greenway use. And in the afternoon, greenway users are likely to be from non-working age groups. The Olympic Forest Park Greenway is located in the northern part of the city centre, and it is popular with the public. Therefore, the effect of the green space rate was more obvious for the northern area during this period. The attractiveness of greenway nodes affects the intensity of greenway use, especially for parks, riverfront trails, and other types of nodes (Tan et al., 2021), so strengthening the connectivity of greenways and parks through a reasonable layout will help to improve greenway use.
The 15-min walkability of the greenway showed east-west differences in space, but the temporal pattern behaved differently. In the early morning, it was “weak in the west and strong in the east”, and in the afternoon and evening, it was “strong in the west and weak in the east”. In terms of the overall 15-min walkability of the greenway, the western region was greater than the eastern region, so the contribution of this variable to the intensity of greenway use was stronger in the west than in the east for most of the day. The pattern of impact was reversed in the early morning, which might occur because the total amount of greenway use in the early morning was significantly smaller in the eastern part of the city than in the western part of the city Figure 9); i.e., the vitality of physical activities was lower in the eastern part of the city. In this case, from the analysis of residents’ movement behaviors and psychology, they might care more about the convenience of using the greenway (accessibility). This attitude indicated that there could be differences in the layout of greenways between different administrative regions, with some regions paying more attention to the construction of greenways and higher quality, while other regions were relatively lacking in the construction of green transportation.
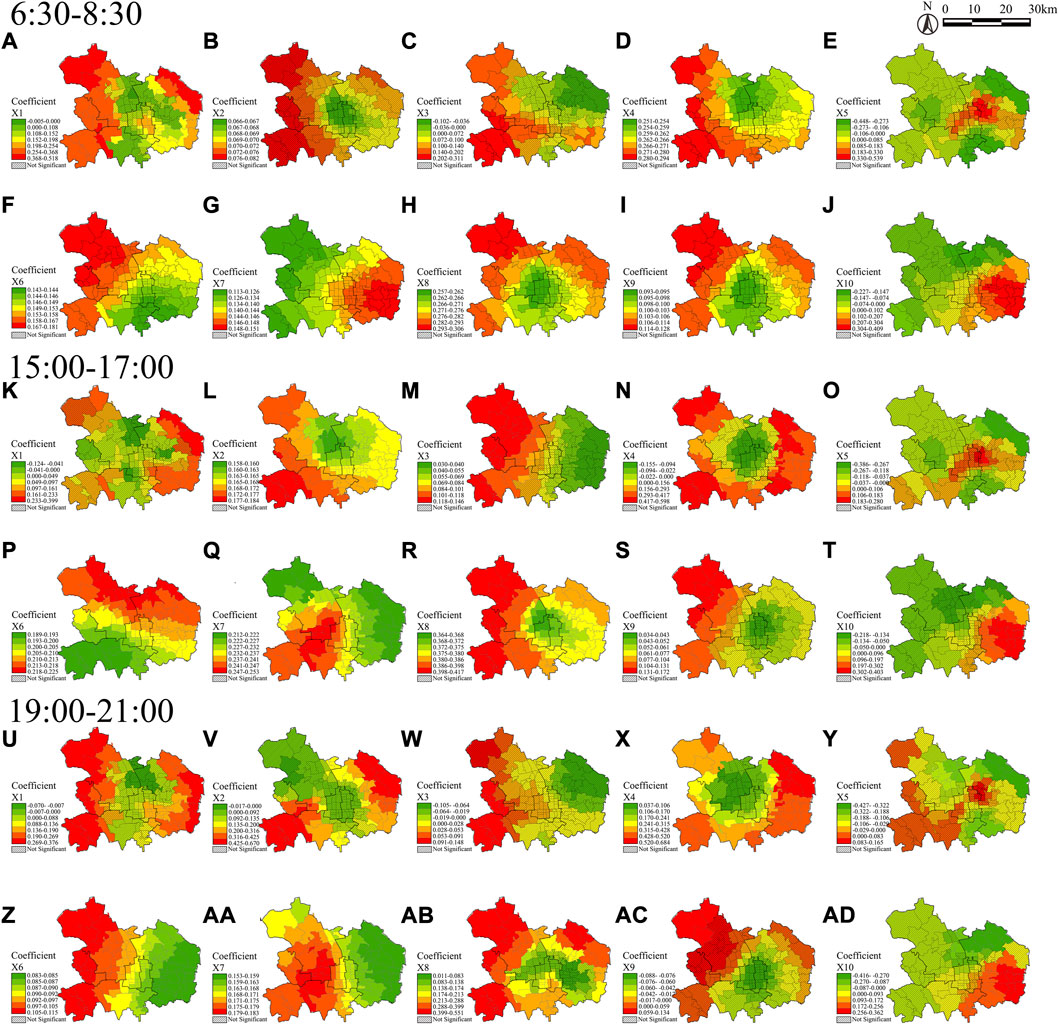
FIGURE 9. Spatial distribution of MGWR greenway use intensity coefficients at the subdistrict scale.
The spatial and temporal pattern of the effect of residential density on the greenway use intensity was stable and significant, with the overall characteristic of “weak in core areas and strong in suburban areas”. It has been shown that greenways are mostly used by groups from surrounding communities (Zhu et al., 2019) and that residential density has a contributing effect on the intensity of greenway use (Xie et al., 2021). The results of our study were the same. Second, the spatial pattern of the impact of residential density on the intensity of greenway use was related to the separation of jobs and housing in the metropolis. In the central city of Beijing, housing prices outside the fourth ring are significantly lower than inside the fourth ring. The relatively low rents (housing prices) in the eastern part of Chaoyang District and Fengtai District have attracted a large number of working people from within the 4th Ring Road, which are the main area for young and middle-aged people to buy or rent houses, thus creating a certain degree of separation between jobs and housing. They are the main group of outdoor sports. Therefore, under the influence of the separation of employment and residence, the area outside the fourth ring exhibited a significant positive correlation.
The greening quality of the greenway passed the significance test in the daytime, and its spatial pattern showed an overall characteristic of " weakness in core areas and strength in suburban areas ". Studies have proven that the greenery, road surface level, and comfort of the greenway promote the use of the greenway by residents. Our study extended it to the spatial dimension. The quality of greenway construction within the core area is generally high, with many of them being national demonstration projects. In suburban areas, the level of greenway construction varies. So, greenways with higher quality greenery were more attractive to residents in suburban areas.
4 Conclusions and discussion
This study analyzed the spatial and temporal patterns and influencing factors of greenway use intensity in the central city of Beijing based on the data of residents’ sports trajectories recorded by a sports App. We found temporal and spatial heterogeneity in the influencing factors after regressing the early morning, afternoon and evening time periods separately using the MGWR model. This bridged the gap in established research on differences in residents’ greenway exercise behavior by using cross-sectional data. We examined the relationships of social, economic, and environmental factors with the intensity of greenway use, this paper found that the reasons for the differences in residents’ greenway movement behaviors are related to urban circle differentiation, separation of workplaces and residences in metropolitan areas, and uneven distribution of resources. The main findings are the following.
(1) The MGWR model showed significant scale variability and spatial heterogeneity in the greenway use intensity by social, economic, and built environment elements. Compared with OLS and GWR, the MGWR model can iterate its optimal scale according to different variables, which facilitates the analysis of the effect of independent variables at the spatial level. Population density and distance to rivers were local influences with strong spatial heterogeneity. Average commute time and housing price were local impact factors for most of the periods. This indicated that their coefficients might change considerably in different positions. Based on this, this study verified the relationship between population density and greenway use intensity in high-density cities. Scholars have generally agreed that the effect of increasing population density on the promotion of physical activities, such as walking and cycling, is robust in low-density cities, while a threshold might exist in high-density cities (Chandrabose et al., 2021). In a study of youth walking behavior in Tokyo, youth sport intensity was found to decrease with increasing population density in areas larger than 10,000 persons/km2, maintaining a positive correlation in other areas (Rigolon and Nemeth, 2020). Beijing is similar to Tokyo in that it is a high-density city, and our study finds that the positive effect of population density on greenway use intensity decreases as population density increases (69–26,584 persons/km2). The regional population density with the highest impact is 2,500 persons/km2, consistent with established research findings for low-density cities (Australia and North America) (Sato et al., 2018). In our study, the relationship between population density and greenway use intensity in core areas with excessive population density did not pass the significance test, which confirmed the existence of the threshold by the side. Some studies have concluded that greenway parks with walking or biking features increase green gentrification compared to regular city parks (Rigolon and Nemeth, 2020). Our findings showed that green gentrification of greenways was more significant in suburban areas and had less impact on core areas.
(2) Under the influence of urban circle differentiation, housing prices, historical resource density, and greening quality of greenways had the characteristic of “weakness in core areas and strength in suburban areas” in promoting the intensity of greenway use. Despite the polycentric structure in Beijing, there is still a clear circle differentiation. The area within the fourth ring road has been highly urbanized, with relatively consistent development in each area and strong resource agglomeration (Zhan et al., 2020). In contrast, there is still a gap between the inner suburban area and the core area, as well as between various zones of the inner suburban area (Yang and Marmolejo Duarte, 2020; Zheng et al., 2019), which are prone to becoming areas of misdistribution of various facilities (Chang et al., 2021). The agglomeration featured by the configuration of urban public services induces a centripetal nature of the activity (Shi et al., 2020), becoming more pronounced in urban fringe areas. Greenways, as a type of green infrastructure, are planned similarly to other public facilities in cities. That is, the more concentrated the public service facilities are, the higher the quality and quantity of greenway construction. In this case, the promotion of greenway use intensity was more significant in urban fringe areas with higher population density, higher housing prices, higher density of residential areas, relatively high concentration of historical resources, and higher greenway greening quality compared to core areas.
(3) The reasons for the differences in spatiotemporal patterns between periods were related to residents’ commuting times and the separation of workplaces and residences. Commuting time and 15-min walkability of the greenway showed spatiotemporal heterogeneity in their effects on greenway use intensity. Residents’ greenway physical activity exhibited differences at different times of the day. During the daytime, the higher intensity use of the greenway was distributed in the northwestern part of the fifth ring, and at night, the area expanded and extended to the eastern part of the city. This finding could indicate that the opportunity for metropolitan residents to exercise in the early morning is affected by commuting stress and that people have relatively ample time to exercise in the evening. The impact of commuting time on greenway use intensity was greater in suburban areas with lower housing prices and longer commute times. The vast majority of the subjects in this study are working-age young and middle-aged people, and high housing prices in urban centres cause more young and middle-aged people to choose to live in suburban areas, thus triggering the separation of workplaces and residences. Especially in areas where greenway use was less intense, people cared more about accessibility to the greenway under the influence of early morning commuting stress. The separation of workplaces and residences and long commuting times not only affect the well-being of residents (Adam et al., 2018) but also reduce their outdoor exercise time (Nicholls et al., 2018). Improving the work-life balance of suburban residents in metropolitan areas benefits both the operational efficiency of cities and the quality of life and health of citizens.
(4) The layout of greenways should make reasonable use of rivers, historical and cultural resources, and park green spaces to improve the attractiveness of the greenway. Despite high network connectivity, greenways in suburban areas were inefficiently used according to the findings of a study on greenway networks in Shenzhen (Liu et al., 2016), which were similar to our findings. HH agglomeration was distributed within the 3rd Ring Road, and LL agglomeration was distributed outside the 5th Ring Road. The attractiveness of the greenway nodes is critical to improving the efficiency of greenway use. The two areas with the highest greenway use intensity in central Beijing were Aoyunxincun and Ganjiakou. Their greenway nodes were Olympic Forest Park (the most heavily visited urban park in Beijing) and Yuyuantan Park (one of the most famous historical parks in Beijing). Therefore, in the layout of greenways, planners should consider improving the efficiency of use and avoiding resource waste; in particular, district and community level functional greenways that serve residents should be built according to the adjustment to the city’s functional areas and population needs and combined with potential greenway nodes. In urban fringe areas, greenways should first be built in areas with concentrated populations, rich natural and cultural resources, and high accessibility. Second, the connectivity of the greenway network between suburban areas and urban centres should be strengthened to support more types of physical activities and improve use efficiency.
Although this study identified the spatiotemporal patterns of greenway use intensity and the influence of multiple factors on these patterns, three limitations remain. First, this study used trajectory data, which could lead to ignoring individual differences, such as the age, gender, and education level of users. Individual differences can also impact greenway use intensity (Ma et al., 2021; Rigolon and Nemeth, 2020). Second, the research data used in this study have two limitations: (1) There are restrictions on the use of the greenway purpose here. The purpose of the app users is exercise (walking, running, and cycling), ignoring other purposes of greenway use (casual socializing, walking the dog, accompanying children, and access). (2) There is a user age limit here, and the majority of the App users are young and middle-aged, which may exclude children and older greenway users. For the above limitations, future research will supplement the questionnaire and field research using the fitness exercise trajectory and field research combined to further refine the research results. Third, we used land use of the greenway to assess the quality of the greenway and the movement pathways on individuals who exercise outdoors. This evaluation method lacked details of the greenway microenvironment. In the future, we will take a large number of photos and use machine learning methods to assess the quality of greenways in detail.
Data availability statement
The original contributions presented in the study are included in the article/Supplementary Material, further inquiries can be directed to the corresponding author.
Author contributions
CQ: conceptualization and writing original draft; NQ: supervision, discussion, and suggestions for data analysis; CQ and TZ: supervision and editing; NQ: writing-reviewing; CQ and NQ: discussion and visualization; CQ: grammar modification and polishing, TZ: funding acquisition. All authors have read and agreed to the published version of the manuscript.
Funding
This research was supported by Department of Building Energy Efficiency and Technology, Ministry of Housing and Urban-Rural Development of The People’s Republic of China, (Grant No.202205000262) and National Natural Science Foundation of China (Grant Nos. 51778403 and 51778406).
Conflict of interest
The authors declare that the research was conducted in the absence of any commercial or financial relationships that could be construed as a potential conflict of interest.
Publisher’s note
All claims expressed in this article are solely those of the authors and do not necessarily represent those of their affiliated organizations, or those of the publisher, the editors and the reviewers. Any product that may be evaluated in this article, or claim that may be made by its manufacturer, is not guaranteed or endorsed by the publisher.
Supplementary material
The Supplementary Material for this article can be found online at: https://www.frontiersin.org/articles/10.3389/fenvs.2022.957641/full#supplementary-material
References
Adam, Z., Walasek, L., and Meyer, C. (2018). Workforce commuting and subjective well-being. Travel Behav. Soc. 13, 183–196. doi:10.1016/j.tbs.2018.08.006
Anderson, C., Zimmerman, A., Lewis, S., Marmion, J., and Gustat, J. (2019). Patterns of cyclist and pedestrian street crossing behavior and safety on an urban greenway. Int. J. Environ. Res. Public Health 16 (2), 201. doi:10.3390/ijerph16020201
Beijing Municipal Bureau of Landscape and Greening (2014). Beijing municipal greenway system planning. Report.
Chandrabose, M., Owen, N., Hadgraft, N., Giles-Corti, B., and Sugiyama, T. (2021). Urban densification and physical activity change: A 12-year longitudinal study of Australian adults. Am. J. Epidemiol. 190 (10), 2116–2123. doi:10.1093/aje/kwab139
Chang, F., Wang, L., Ma, Y., Yan, C., and Liu, H. (2021). Do urban public service facilities match population demand? Assessment based on community life circle. Prog. Geogr. 40 (4), 607–619. doi:10.18306/dlkxjz.2021.04.006
Chang, P. (2020). Effects of the built and social features of urban greenways on the outdoor activity of older adults. Landsc. Urban Plan. 204, 103929. doi:10.1016/j.landurbplan.2020.103929
Chang, P., Tsou, C., and Li, Y. (2020). Urban-greenway factors’ influence on older adults’ psychological well-being: A case study of taichung, taiwan. Urban For. Urban Green. 49, 126606. doi:10.1016/j.ufug.2020.126606
Chen, C., Luo, W., Li, H., Zhang, D., Kang, N., Yang, X., et al. (2020a). Impact of perception of green space for health promotion on willingness to use parks and actual use among young urban residents. Int. J. Environ. Res. Public Health 17 (15), 5560. doi:10.3390/ijerph17155560
Chen, Y., Yue, W., and La Rosa, D. (2020b). Which communities have better accessibility to green space? An investigation into environmental inequality using big data. Landsc. Urban Plan. 204, 103919. doi:10.1016/j.landurbplan.2020.103919
Chen, Y., Zheng, S., and Li, X. (2022). Study on the use patterns and needs of waterfront greenway in the urban fringe: A case of the haidian section of qinghe river in beijing. World Archit. 2, 34–41. doi:10.16414/j.wa.2022.02.015
Choi, S., Kim, J., and Yeo, H. (2021). Trajgail: Generating urban vehicle trajectories using generative adversarial imitation learning. Transp. Res. Part C: Emerg. Technol. 128, 103091. doi:10.1016/j.trc.2021.103091
Chon, J., and Scott Shafer, C. (2009). Aesthetic responses to urban greenway trail environments. Landsc. Res. 34 (1), 83–104. doi:10.1080/01426390802591429
Cohen, D. A., Han, B., Nagel, C. J., Harnik, P., McKenzie, T. L., Evenson, K. R., et al. (2016). The first national study of neighborhood parks: Implications for physical activity. Am. J. Prev. Med. 51 (4), 419–426. doi:10.1016/j.amepre.2016.03.021
Dallat, M. A. T., Soerjomataram, I., Hunter, R. F., Tully, M. A., Cairns, K. J., and Kee, F. (2014). Urban greenways have the potential to increase physical activity levels cost-effectively. Eur. J. Public Health 24 (2), 190–195. doi:10.1093/eurpub/ckt035
Di, S., Zhu, J., Zheng, J., Yang, J., and Ding, K. (2021). Movement pattern mining of Nanjing residents based on taxi trajectory data. Sci. Surv. Mapp. 46 (1), 203–212. doi:10.16251/j.cnki.1009-2307.2021.01.028
Fan, Z., Duan, J., Luo, M., Zhan, H., Liu, M., and Peng, W. (2021). How did built environment affect urban vitality in urban waterfronts? A case study in nanjing reach of yangtze river. ISPRS Int. J. Geoinf. 10 (9), 611. doi:10.3390/ijgi10090611
Frank, L. (2000). Land use transportation interaction: An examination of the 1995 npts data. J. Plan. Educ. Res. 6 (20), 6–22. doi:10.1177/073945600128992564
Frühauf, A., Niedermeier, M., and Kopp, M. (2020). Intention to engage in winter sport in climate change affected environments. Front. Public Health 8, 598297. doi:10.3389/fpubh.2020.598297
Garriga, A., Sempere-Rubio, N., Molina-Prados, M. J., and Faubel, R. (2022). Impact of seasonality on physical activity: A systematic review. Int. J. Environ. Res. Public Health 19 (1), 2. doi:10.3390/ijerph19010002
Han, H., and Yang, C. (2019). Spatial pattern evolution of residential and industrial land and its impact on commuting behavior in Beijing metropolitan area. Econ. Geogr. 39 (5), 8792550. doi:10.15957/j.cnki.jjdl.2019.05.008
Hirsch, J. A., James, P., Robinson, J. R., Eastman, K. M., Conley, K. D., Evenson, K. R., et al. (2014). Using mapmyfitness to place physical activity into neighborhood context. Front. Public Health 2, 19. doi:10.3389/fpubh.2014.00019
Jiang, H., and Li, Y. (2021). Change of spatial structure of manufacturing industry in the Beijing-Tianjin-Hebei region and its driving factors. Prog. Geogr. 40 (5), 721–735. doi:10.18306/dlkxjz.2021.05.001
Jim, C. Y., and Shan, X. (2013). Socioeconomic effect on perception of urban green spaces in Guangzhou, China. Cities 31, 123–131. doi:10.1016/j.cities.2012.06.017
Kong, F., Yin, H., and Nakagoshi, N. (2007). Using gis and landscape metrics in the hedonic price modeling of the amenity value of urban green space: A case study in jinan city, China. Landsc. Urban Plan. 79 (3-4), 240–252. doi:10.1016/j.landurbplan.2006.02.013
Lachowycz, K., and Jones, A. P. (2013). Towards a better understanding of the relationship between greenspace and health: Development of a theoretical framework. Landsc. Urban Plan. 118, 62–69. doi:10.1016/j.landurbplan.2012.10.012
Li, B., Liu, Q., Wang, T., He, H., Peng, Y., and Feng, T. (2022). Analysis of urban built environment impacts on outdoor physical activities-a case study in China. Front. Public Health 10, 861456. doi:10.3389/fpubh.2022.861456
Li, C., Zhang, Y., Liu, Z., and Chai, Y. (2021a). The influence of commute duration and community activities on community social capital: A study based on 26 communities survey in beijing. Sci. Geogr. Sin. 41 (9), 1606–1614. doi:10.13249/j.cnki.sgs.2021.09.012
Li, F., Li, F., Li, S., and Long, Y. (2020). Deciphering the recreational use of urban parks: Experiments using multi-source big data for all Chinese cities. Sci. Total Environ. 701, 134896. doi:10.1016/j.scitotenv.2019.134896
Li, R., Gong, S., and Gao, Y. (2021b). Accessibility of public service facilities in beijing and its impact on housing prices. Acta Sci. Nat. Univ. Pekin. 57, 875–884. doi:10.13209/j.0479-8023.2021.065
Liu, K., Siu, K. W. M., Gong, X. Y., Gao, Y., and Lu, D. (2016). Where do networks really work? The effects of the shenzhen greenway network on supporting physical activities. Landsc. Urban Plan. 152, 49–58. doi:10.1016/j.landurbplan.2016.04.001
Liu, Y., Hu, J., Yang, W., and Luo, C. (2022). Effects of urban park environment on recreational jogging activity based on trajectory data: A case of chongqing, China. Urban For. Urban Green. 67, 127443. doi:10.1016/j.ufug.2021.127443
Liu, Y., Liu, C., He, Z., Zhou, X., Han, B., and Hao, H. (2020). Spatial-temporal evolution of ecological land and influence factors in Wuhan urban agglomeration based on geographically weighted regression model. Chin. J. Appl. Ecol. 31 (3), 987–998. doi:10.13287/j.1001-9332.202003.016
Ma, M., Ding, L., Kou, H., Tan, S., and Long, H. (2021). Effects and environmental features of mountainous urban greenways (mugs) on physical activity. Int. J. Environ. Res. Public Health 18 (16), 8696. doi:10.3390/ijerph18168696
McArthur, D. P., and Hong, J. (2019). Visualising where commuting cyclists travel using crowdsourced data. J. Transp. Geogr. 74, 233–241. doi:10.1016/j.jtrangeo.2018.11.018
Nicholls, L., Phelan, K., and Maller, C. (2018). ‘a fantasy to get employment around the area’: Long commutes and resident health in an outer urban master-planned estate. Urban policy Res. 36 (1), 48–62. doi:10.1080/08111146.2017.1308859
Ribeiro De Almeida, D., de Souza Baptista, C., Gomes De Andrade, F., and Soares, A. (2020). A survey on big data for trajectory analytics. ISPRS Int. J. Geoinf. 9 (2), 88. doi:10.3390/ijgi9020088
Rigolon, A., and Németh, J. (2020). Green gentrification or ‘just green enough’: Do park location, size and function affect whether a place gentrifies or not? Urban Stud. 57 (2), 402–420. doi:10.1177/0042098019849380
Rozmiarek, M., León-Guereño, P., Tapia-Serrano, M. Á., Thuany, M., Gomes, T. N., Płoszaj, K., et al. (2022). Motivation and eco-attitudes among night runners during the Covid-19 pandemic. Sustainability 14 (3), 1512. doi:10.3390/su14031512
Sato, H., Inoue, S., Fukushima, N., Kikuchi, H., Takamiya, T., Tudor-Locke, C., et al. (2018). Lower youth steps/day values observed at both high and low population density areas: A cross-sectional study in metropolitan Tokyo. BMC Public Health 18 (1), 1132. doi:10.1186/s12889-018-6028-y
Shi, Y., Yang, J., and Shen, P. (2020). Revealing the correlation between population density and the spatial distribution of urban public service facilities with mobile phone data. ISPRS Int. J. Geoinf. 9 (1), 38. doi:10.3390/ijgi9010038
Sun, B., and Yang, S. (2021). Characteristics and influencing factors of urban housing price spatial differentiation under the effect of polycentric structure: Taking hefei city as an example. esources Environ. Yangtze Basin 30 (7), 1538–1546.
Tan, C., Tang, Y., and Wu, X. (2019). Evaluation of the equity of urban park green space based on population data spatialization: A case study of a central area of wuhan, China. Sensors (Basel) 19 (13), 2929. doi:10.3390/s19132929
Tan, S., Chen, L., and Yang, C. (2021). The impact of the greenway environment on the intensity of residents' use from the perspective of health. South Archit. 3, 15–21. doi:10.3969/j.issn.1000-0232.2021.03.015
Tao, S., Gao, S., Xiong, X., Yao, J., and Deng, S. (2018). Air pollution characteristics and jogger inhalation exposure in typical running area of Beijing. Environ. Sci. 39 (8), 3580–3590. doi:10.13227/j.hjkx.201711178
Wang, M., Qiu, M., Chen, M., Zhang, Y., Zhang, S., and Wang, L. (2021). How does urban green space feature influence physical activity diversity in high-density built environment? An on-site observational study. Urban For. Urban Green. 62, 127129. doi:10.1016/j.ufug.2021.127129
Wu, J., Chen, X., and Chen, S. (2019). Temporal characteristics of waterfronts in Wuhan city and people’s behavioral preferences based on social media data. Sustainability 11 (22), 6308. doi:10.3390/su11226308
Xie, B., Wang, X., and Wu, L. (2021). Exploring the effect of urban greenspace on residents’ mental health using a quasi-natural experiment: Taking Wuhan East Lake Greenway as an example. Prog. Geogr. 40 (7), 1141–1153. doi:10.18306/dlkxjz.2021.07.006
Yang, L., and Marmolejo Duarte, C. R. (2020). Analysis of the spatial structure of Beijing from the point view of weibo data. ACE: Archit. City Environ. 15, 43. doi:10.5821/ace.15.43.9302
Yu, X., and Zhan, D. (2022). An analysis on the spatial pattern and influencing factors of house price index in 70 large and medium-sized cities in China. J. Central China Normal Univ. Soc. Sci. 61 (1), 40–51. doi:10.19992/j.cnki.1000-2456.2022.01.006
Zhan, D., Zhang, W., Zhang, J., Li, J., Chen, L., and Dang, Y. (2020). Identifying urban public service facilities centers in Beijing. Geogr. Res. 39 (3), 554–569.
Zhang, H., Zhu, Z., and Zou, D. (2019a). Influences of greenway on the physical activities of users with different proximity degrees: A study on waterfront greenway in guangzhou city. City Plan. Rev. 43 (8), 58–62.
Zhang, Y., Li, C., Huang, J., Meng, B., and Sun, R. (2019b). Spatial characteristics of jobs-housing relationship of Beijing city based on multi-source data integration. Urban Dev. Stud. 26 (12), 37–45. doi:10.3969/j.issn.1006-3862.2019.12.005
Zhang, Y., Lin, D., and Liu, X. C. (2019c). Biking islands in cities: An analysis combining bike trajectory and percolation theory. J. Transp. Geogr. 80, 102497. doi:10.1016/j.jtrangeo.2019.102497
Zhao, P., and Hu, H. (2019). Geographical patterns of traffic congestion in growing megacities: Big data analytics from beijing. Cities 92, 164–174. doi:10.1016/j.cities.2019.03.022
Zheng, Y., Jiao, S., and Zhang, X. (2019). Impact of urban structure on subway system and real estate price: evidence from Beijing, Hangzhou, Nanjing and Chengdu. Econ. Geogr. 39, 6. doi:10.15957/j.cnki.jjdl.2019.06.009
Zhu, Z., Huang, C., Liu, L., and Liu, X. (2019). Influence of built environment on urban greenway use from the perspective of greenway-neighborhood relationships: A case study of guangzhou, China. Trop. Geogr. 39 (2), 247–253. doi:10.13284/j.cnki.rddl.003116
Keywords: greenway, use intensity, spatial heterogeneity, spatiotemporal patterns, multiscale geographically weighted regression
Citation: Qiu C, Qiu N and Zhang T (2022) What causes the spatiotemporal disparities in greenway use intensity? evidence from the central urban area of Beijing, China. Front. Environ. Sci. 10:957641. doi: 10.3389/fenvs.2022.957641
Received: 31 May 2022; Accepted: 19 August 2022;
Published: 13 September 2022.
Edited by:
Farshid Aram, Polytechnic University of Madrid, SpainReviewed by:
Andrew Allan, University of South Australia, AustraliaEbrahim Solgi, Griffith University, Australia
Copyright © 2022 Qiu, Qiu and Zhang. This is an open-access article distributed under the terms of the Creative Commons Attribution License (CC BY). The use, distribution or reproduction in other forums is permitted, provided the original author(s) and the copyright owner(s) are credited and that the original publication in this journal is cited, in accordance with accepted academic practice. No use, distribution or reproduction is permitted which does not comply with these terms.
*Correspondence: Tianjie Zhang, YXJjaF90akAxMjYuY29t