 Yixiao Peng
 Hejie Zhang*
- School of Economics, Zhejiang University of Technology, Hangzhou, China
Sustainable development has become a new goal of world development, and the measurement of sustainable development level is an important issue. This article introduces indicators of land ecology and allocation to establish a sustainable development index (SDI) including two levels of indicators. Based on the data research of SDI 2019 of 188 countries (regions), we conclude as follows: 1) the ranking of oil-producing countries fell sharply because of land ecological deterioration and single industrial structure; 2) the ranking of Southeast Asian and East African countries (regions) progressed because of ecological protection; 3) most developing countries (regions) have excellent performance on ecological protection, and the main reason for changing their ranking is the inequality of land allocation. Emerging countries, such as China and Russia, also have these problems in their rapid development. We suggest that countries (regions), especially countries (regions) that rely heavily on resource extraction, should pay attention to land ecological protection, and developed and emerging countries (regions) should optimize land allocation. The main contribution of this article is to provide a new solution and ideas for the measurement of sustainable development by improving the indicator system.
1 Introduction
Sustainable development has been an important issue in today’s world, but there is still no recognized method to measure the level of sustainable development. The United Nations issued Sustainable Development Goals (SDGs) in 2015 (United Nations Sustainable Development Summit, 2015), and it contains 17 sustainable development goals in three dimensions: environment, economy, and society (17 Goals to Transform Our World, 2021). Each goal contains some indicators to show the completion of countries (regions) around the world. Unfortunately, the United Nations only published these data and failed to form a sustainable development index. The most important reason is that most indicators are incomplete and lack data from many countries (regions).
The United Nations still use the Human Development Index (HDI) as a primary reference to measure the national development level. As time goes by, the defects of HDI become more and more obvious. On the one hand, the HDI seems to be a redundant index because it is no comparison in time and space (Srinivasan, 1994) and is significantly positively correlated with each component variable (Kelley, 1991; Mcgillivray, 1991; Mcgillivray and White, 1993; Islam, 1995; Anand and Sen, 2000; Cahill, 2005; Klugman et al., 2011). On the other hand, the HDI does not consider the contributions to sustainable development (Lind, 1992; Ivanova et al., 1999; Morse, 2003a; Moran et al., 2008; Togtokh, 2011; Bilbao-Ubillos, 2013; Biggeri and Mauro, 2018).
Scholars dedicate to improving HDI from three directions to measure sustainable development. Regarding the first direction, scholars introduced per capita carbon emission, a new indicator, to the HDI, which is called the Human Sustainable Development Index (HSDI) (Togtokh, 2011; Bravo, 2014). It is found that the HSDI rankings of the United States, Australia, Canada, and oil-producing countries have greatly regressed compared with HDI. However, HSDI still has a strong correlation with HDI (Bravo, 2014), probably because HSDI lacks more indicators of environmental sustainability. Environmental sustainability contains not only climate factors but also land ecology, air quality, and other factors.
Regarding the second direction, scholars introduce a comprehensive environmental index combined with HDI (Costantini and Monni, 2005; Hickel, 2020), such as the Ecological Footprint Human Development Index (EFHDI) (Morse, 2003a) and the Environmental Human Development Index (EHDI) (Maccari, 2014). Ecological Footprints (EF) (Wackernagel and Rees, 1997) and the Environmental Performance Index (EPI) (EPI, 2012) are comprehensive environmental indicators, in addition to per capita carbon emission, including land ecological indicators such as forest coverage and nature reserves area. This method makes up for the defects of HSDI, but it also brings more problems. First, indicators of EPI and EF are difficult to collect and cover too few countries, which is not conducive to the promotion. Second, both HDI and HSDI consider that all indicators have equal weight and nonlinear substitution. But the weight of each indicator of EPI is different, and the indicators of EF are a linear summation. Therefore, the calculation methods of EF and EPI conflict with the concept of HDI (HSDI). Third, EF and EPI are comprehensive indicators, while health, education, and per capita income are only single indicators, and this combination will lead to the problem of index level mismatch. Index level mismatch would make it more difficult to improve the score of the environmental dimension over the social and economic dimensions. In other words, the country can easily improve on the score of the economic dimension solely by adjusting per capita income, but the score of the environmental dimension needs to be improved with multiple indicators, which may reduce the country’s motivation for environmental construction.
Regarding the third direction, scholars directly select some indicators and combine them into an index (Ranis et al., 2006; Distaso, 2007; Bilbao- Ubillos, 2013; Liang et al., 2019; Singh et al., 2021). Although this method enriches the number of indicators, it is easy to raise problems of overweighting certain factors in the economy, environment, and society. For example, there is only one environmental indicator in the index established by Distaso, which is inappropriate for countries (regions) with good environmental construction (Distaso, 2007). In addition, as the number of indicators increases, the number of countries (regions) that meet the requirement decreases. The sustainable development index which covers only dozens of countries (regions) is not conducive to popularization (Liang et al., 2019; Singh et al., 2021).
The purpose of this study is to establish a multidimensional global sustainable development evaluation system. A multidimensional evaluation system can make up for the shortcomings of the existing index and accurately measure the sustainable development level of countries around the world. Meanwhile, the sustainable development index can make countries pay more attention to sustainable development than economic growth, and the ranking of the index and indicators can provide policy suggestions for improving the level of sustainable development. We will also study the differences between countries at different stages of development, identify common problems in sustainable development in these countries, and provide inspiration and references for countries that are about to enter a certain stage.
In general, we should not just add indicators or composite indexes to establish a new index; rationality, comparability, popularization, and representativeness also need to be considered. Therefore, we have collected and compared more than one hundred indicators and finally selected 15 indicators to establish a new Sustainable Development Index (SDI) with two levels of indicators. The contributions of this article can be summarized as follows: 1) we have improved the measurement of sustainable development by adding several indicators, which provide a new solution and ideas for the measurement of sustainable development. 2) We have added a land resource allocation factor to the Sustainable Development Index. 3) The existing sustainability index is either insufficient in the number of indicators or insufficient in the number of countries. We have considered comparability and balance in the establishment of SDI and ensured that SDI could cover 188 countries while increasing the number of indicators.
In the rest of this article, the second section introduces the selection of indicators; the third section introduces index calculation methods and data normalization; the fourth section shows the performance of SDI; and the fifth section gives the conclusion and prospects.
2 Literature Review
The key to establishing a sustainable development index is how to select the sustainable development assessment dimensions. We combined existing research studies on the dimension of sustainable development and added some indicators collected by ourselves. To evaluate the country’s sustainable development level more comprehensively and realistically, we propose to establish an indicator system. The new system contains two levels of indicators (Huan et al., 2021). The first-level indicators contain society, economy, and environment, as recognized by studies (Carlucci and Pisani, 1995; Barrera-Roldán and Saldı́var-Valdés, 2002; Lamichhane et al., 2021). The purpose of establishing two-level indicators is to ensure that the weight of each dimension is equal. This section mainly discusses the basis for the selection of second-level indicators.
2.1 Environmental Dimension
Climate is critical to environmental sustainability (Guest, 2010; Peeters et al., 2013; Gough, 2015); urgent action to tackle climate change and its impacts is one of the UN SDGs, and 75 countries (regions) commit to zero emissions by 2050 (Climate Action Summit, 2019). Therefore, we introduce per capita carbon emissions as a second-level indicator, which is the same as the improvement of HSDI (Togtokh, 2011; Bravo, 2014). However, it is not enough for environmental sustainability to consider only climate factors; we also need to consider land ecological factors such as water, soil, forests, and biodiversity in the SDI (Neumayer, 2001; Beça and Santos, 2010). Sustainable utilization of land resources is an important method to maintain land ecological stability (Brulé, 2022). The sustainable use of land resources requires the coordinated development of the environment, resources, population, and economy, which all determine that land ecological indicators are an indispensable part of the sustainable development index (Gupta and Bharat, 2022). Regarding the water resource, we replace “water quality evaluation indicators” with a relatively complete indicator of “maximum water extent” because the existing “water quality evaluation indicators” are seriously deficient, and water coverage is more important to the land ecosystem. Regarding biodiversity, it is inappropriate to measure biodiversity by the number of species, which has a great correlation with the national area. We chose “proportion of land protected area” to encourage countries (regions) to protect species diversity. As of 2016, 90 percent of urban residents breathed unsafety air, and 4.2 million people died from air pollution (Goal 11, 2021), indicating air quality has a major impact on human health. Therefore, we choose “mean population exposure to PM2.5” to measure a country’s air quality. Finally, forest coverage is an indicator recognized by most studies (Carlucci and Pisani, 1995; Bravo, 2014; UNDP, 2020a).
2.2 Social Dimension
From HDI and HSDI, we select life expectancy at birth, expected years of schooling, and mean years of schooling as indicators of health and education, respectively. Using life expectancy would lead to a higher score in aging countries (regions) (Herrero et al., 2019). If the population of these countries (regions) continues to grow negatively, it does not meet the requirements of sustainable development, so population dynamics need to be considered. However, it is difficult for us to formulate a standard to record the population growth rate. We finally use the mortality of newborns to measure the sustainability of a country’s population (Goal 3, 2021) because a country with a high neonatal mortality rate is not sustainable in population even if its population growth rate is high. In other words, reducing the neonatal mortality rate is more important than human reproductivity (Streeten, 1994). The land ecosystem will be excessively destroyed due to population growth too fast.
Failure to consider the inequality is another problem of HDI and HSDI (Foster et al., 2005; Dervis and Klugman, 2011). Some scholars have improved the income indicator of HDI by adding inequality factors (Anand and Sen, 1994; Anand and Sen, 1997; Hicks, 1997; Grimm et al., 2008; Harttgen and Klasen, 2012). UNDP has also adjusted income indicators using the Atkinson family of inequality measures. The purpose of introducing the income indicator is to measure the quality of life (Easterly, 1999), but the adjustment of the previous studies seems to have excessively narrowed the gap between high-income countries (regions) and low-income countries on the income indicator (Trabold-Nübler, 1991; Gormely, 1995; Noorbakhsh, 1998; Sagar and Najam, 1998). The adjusted income indicator does not truly reflect a country’s living standards, and UNDP canceled this approach accordingly. Therefore, this article introduces the property Gini coefficient in addition to GNI per capita to not only reflect the real living standard of the country but also take inequality into account. There are two main reasons for this choice. First, income allocation inequality has been studied by many scholars, and we are more concerned about the impact of property allocation, especially land allocation, on sustainable development. Second, the income Gini coefficient lacks data for many countries (regions), and the property Gini coefficient is more comprehensive. In addition, sustainable development requires the elimination of poverty, and the employment rate is introduced to measure its achievements in poverty reduction (Osberg and Sharpe, 2002; Mihci et al., 2012).
2.3 Economic Dimension
The limitations of per capita GNI in measuring living standards are mentioned earlier, and there are also limitations in measuring economic development. First, GNI per capita cannot measure the potential of economic development. As an example, China has maintained rapid economic development over the past 30 years, and the growth trend continues. However, due to the large population base, China’s GNI per capita is relatively low. In contrast, considering the low or negative economic growth of some high-income countries (regions), it is inappropriate to solely consider the income level for rapidly developing emerging countries because sustainable economic growth is in line with sustainable goals. Therefore, we introduce the GDP growth rate to measure the country’s potential for economic development. Second, some countries benefit from energy and mineral exports to maintain high-income levels (Neumayer, 2012). These industries have high energy consumption, lack diversity, and destroy the land ecosystem. Energy consumption and concentration indicators should be introduced to solve these problems that cannot be measured by GNI per capita (Yumashev et al., 2020). Third, GNI per capita cannot measure the quality of a country’s economic development (Ravallion, 1997). The ability of technological innovation and industrial upgrading is crucial to the sustainable development of the economy. An indicator that can represent the ability of technological innovation and industrial upgrading is the number of patent applications. However, due to the serious lack of data on the number of patent applications, it cannot be used as an index. After comparing some indicators, we finally chose the Internet penetration rate to represent a country’s technological innovation and transformation and upgrading capabilities. There are two reasons for choosing this indicator: first, in the information age, the Internet penetration rate represents the potential of a country to move from traditional handicraft agriculture and manufacturing to the technology industry; second, the data set is complete and suitable for use as a composition of the index.
2.4. Summary
We have selected three first-level indicators and fifteen second-level indicators. Each first-level indicator contains five second-level indicators (Table 1). “Per capita carbon emissions,” “per capita GNI-PPP,” “expected and mean years of schooling,” and “life expectancy at birth” are already included in HSDI; “forest coverage,” “maximum water extent,” “proportion of land protected area,” “GDP per ton of carbon emissions,” “concentration index,” and “property Gini coefficient” are selected to measuring land ecology and allocation, and these are key indicators of this article. The remaining indicators are used to measure other sustainable development factors to ensure that the weights of the three dimensions are the same. In addition, we believe that as a global index, and its indicators should be publicly available and include as many countries as possible, which is conducive to popularization.
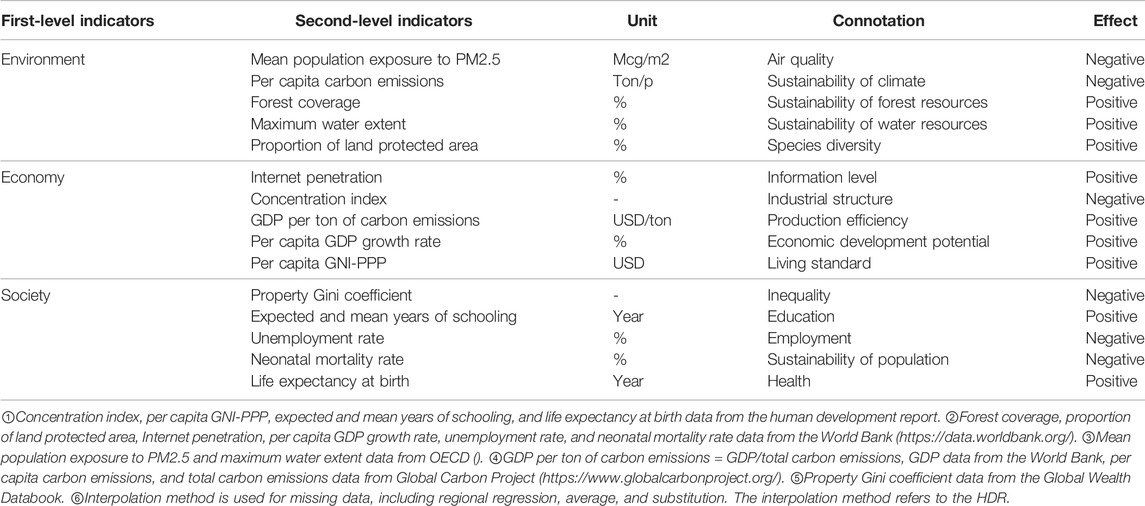
TABLE 1. Description of first-level and second-level indicators of SDI.
3 Materials and Methods
3.1 Calculation of SDI
Both the SDI and the first-level indicators are calculated by the geometric mean method as follows:
Calculation methods of
As the SDGs raise the importance of balanced development, there should be a nonlinear substitution relationship between indicators. The geometric mean method can ensure that the weight of each level of indicator is the same and penalizes countries (regions) with unbalanced development (Herrero et al., 2010; UNDP, 2010; Herrero et al., 2012; Ravallion, 2012; Zambrano, 2014). These are the advantages of using the geometric mean method to calculate the SDI. Meanwhile, we have established a secondary index system, which is an innovation in the application of calculation methods. This system makes the assessment of SDI accurate and unbiased, and countries have more data for reference in sustainable development construction.
In general, the geometric mean method is suitable to calculate SDI. First, it solved the conflict caused by the new calculation method. Second, it was combined with the secondary index system to make the evaluation accurate and unbiased. Third, it met the requirements and connotation of sustainable development.
3.2 Normalization of Indicators
All second-level indicators need to be normalized to eliminate dimensional discrepancy, and the normalization equations are as follows:
Equations 3 and 4 apply to positive and negative indicators, respectively, and the standardized indicators are within the interval (0,1). However, the geometric mean method with a standardized indicator of zero would result in an SDI score of zero. We need to set a minimum value to ensure that all standardized indicators are within the interval (0,1), and the upper limit also needs to be set (UNDP, 2020b). The specific maximum and minimum values and index calculation processes are shown in Section 3.3.
The max-min normalization method is not suitable for indicators with extreme values, and we need to process these indicators with logarithmic transformation before normalization. Figure 1 shows that after logarithmic transformation, the score distribution of maximum water extent becomes more reasonable (Aguña and Kovacevic, 2010).
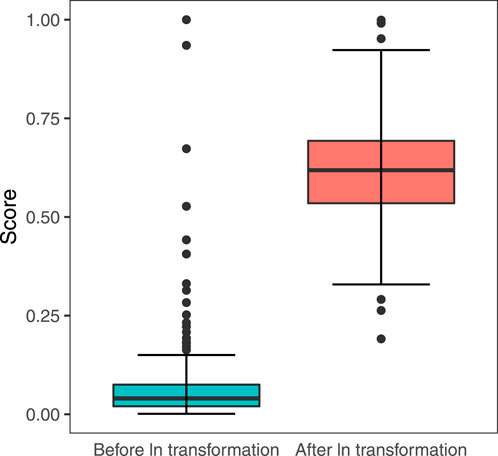
FIGURE 1. Effect of using a logarithmic transformation on outliers.
Logarithmic transformation can also reduce the margins of land ecological indicators such as forest coverage. The endowment of forest resources is related to the country’s geographic location, and some countries (regions) have a natural coverage rate of 90%, while others suffer from a coverage rate from 1 to 10%. Therefore, it is inappropriate to give a score of 10 and 90 to countries (regions) with a forest coverage rate of 10% and 90%. Figures 2A and B show that logarithmic transformation reduces the score gap between 55% and 90%, and the bonus points obtained from 0.12% to 1.9% are far greater than the bonus points from 55% to 90%. Logarithmic transformation effectively prevents excessive punishment of countries (regions) with insufficient resource endowments. In addition, it is necessary to ensure that all values are greater than one before the logarithmic transformation.
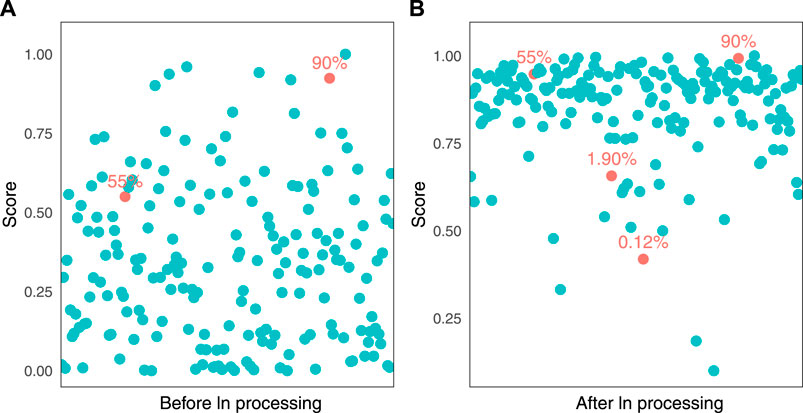
FIGURE 2. Effect of using a logarithmic transformation on score. (A) is the distribution before ln transformation, (B) is the distribution before ln transformation.
3.3 Goalposts Selection and Calculation Process
The specific maximum and minimum values are called goalposts, which are an important part of the standardization of index establishment. This section will present an example of index calculation and describe how we select goalposts. The calculation of SDI is divided into three parts: normalization of the indicators, calculation of first-level indicators, and calculation of SDI.
First, the normalization method uses Equations (3) and (4). The results are as follows:
The Human Development Report gives an approach to setting goalposts. Regarding the minimum (UNDP, 2020a), they could be set to “natural zeros”; Regarding the maximum, they could be set to observed maximum values. However, for the negative indicators, the minimum and maximum have opposite meanings.
The goalposts of Eqs 6 and 14, 16, and 19 are the same as HDI and HSDI. In Eqs 7 and 8, 9, and 10, the maximum is set to the highest observed value in the 2015–2019 period and the minimum is set to 1. In Eqs 5, 17, the maximum is set to the highest observed value in the 2015–2019 period and the minimum is set to zero. Eq. 13 refers to the HDR method, and the maximum value is 20,000 (only one country exceeds the $20,000 GDP per ton of carbon emission ceiling), and the minimum is set to a quarter of the 5-year minimum. In Eq. 15, the maximum is set to 100 (maximum Gini coefficient), and the minimum is set to the lowest observed value in the 2015–2019 period. In Eq. 13, the maximum is set to 10 and the minimum is set to -20, which excludes extreme values. The concentration index is within the interval (0,1); therefore, we select 1 as the maximum and the minimum is set to zero in Eq. 11. The unit of neonatal mortality rate is permillage; therefore, we select 100 as the maximum and the minimum is set to zero in Eq. 18.
The max-min normalization method will be controversial in the selection of goalposts. Although the HDR gives the basis for the selection of goalposts, the ranges of these indicators will change over time. Therefore, this article suggests that we can only select the goalposts as objectively as possible, and then do not replace the goalposts within 5 years so that SDI is comparable in time. In addition, SDI selects more indicators so that the sensitivity of the SDI scores to the goalposts is reduced, and the ranges of three first-level indicators are reasonable (Table 2).

TABLE 2. The statistical description of indicators after normalization.
Second, by taking the results of Eqs 5 and 6, 7, 8, and 9 into Eq. 2, we can get the score of environmental sustainability:
By taking the results of Eqs 10 and 11, 12, 13, and 14 into Eq. 2, we can get the score of economic sustainability:
By taking the results of Eqs 15 and 16, 17, 18, and 19 into Eq. 2, we can get the score of social sustainability:
Third, by taking the results of Eqs 20, 21, and 22 into Eq. 1, we can get the score of SDI:
4 Results and Discussion
All calculation results are in appendix A. First-level indicator score, SDI rankings, and changes are shown in Supplementary Appendix Table SA1.
4.1 Correlation Analysis
Taking into account the completeness of the data, we calculated the SDI from 2015 to 2019. Finally, we selected 2019 data as a representative for analysis. Before the discussion, we need to examine the correlation between SDI and HDI (HSDI) and among first-level indicators to avoid SDI becoming another redundant indicator. The correlation among the three first-level indicators is weak, and these three indicators can independently measure the sustainable development level of each dimension (Figure 3). The correlation coefficient between HSDI and HDI is as high as 0.967, and the correlation coefficient between SDI and HDI is only 0.767. Comparing 1 to 50 and 51 to 188 countries, respectively, it can be found that the correlation coefficients between SDI and HDI are only 0.609 and 0.567. We also examine the correlation between SDI and GNI per capita, and the correlation coefficient is only 0.570.
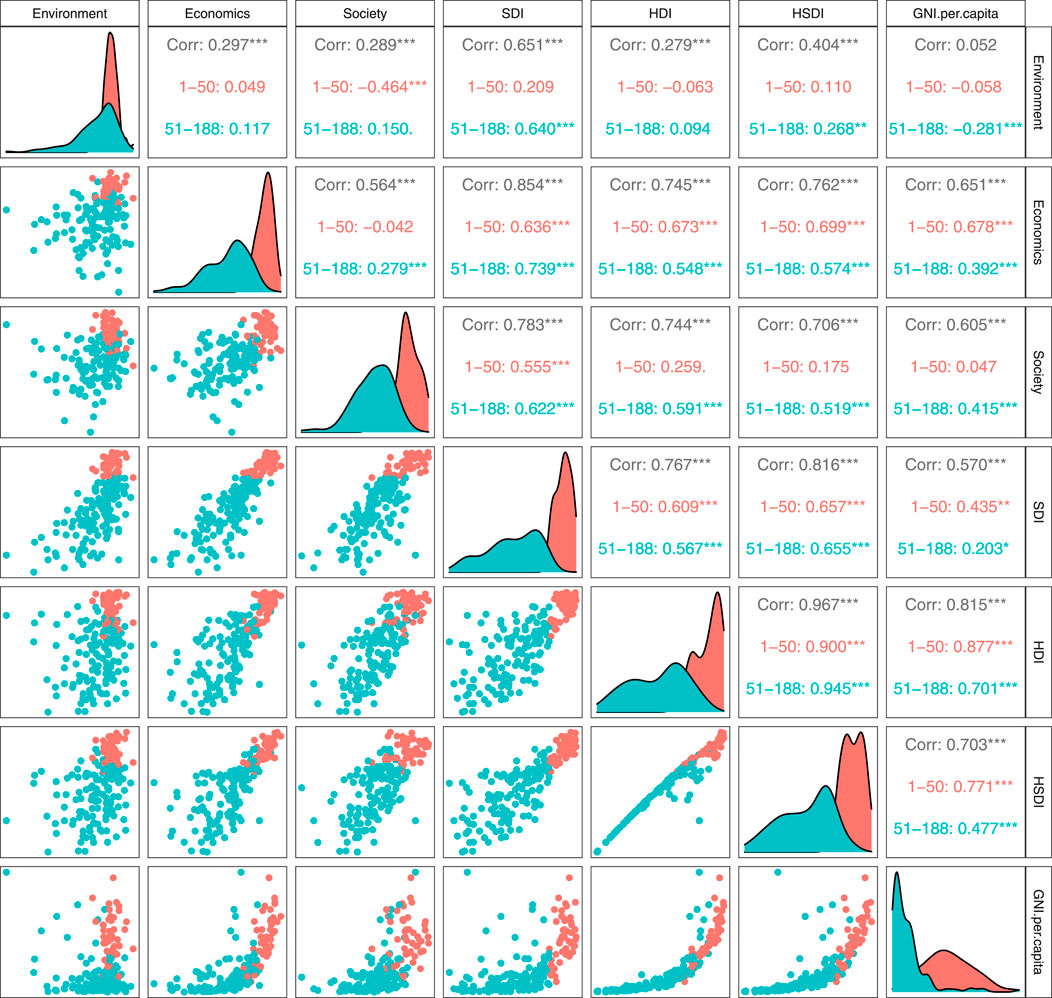
FIGURE 3. Binary correlations among SDI, HSDI, HDI, GNI-PPP, and three first-level indicators. The diagonal panels present the distribution of each index or indicator.
Although HDI and HSDI are simple to calculate and easy to generalize, their high correlation with GNI per capita makes them a redundant index (Bravo, 2014). The correlation results show that the index we created is not redundant. The highly nonlinear relationship between the index and indicators makes the existence of SDI meaningful. As can be seen from the last column of Figure 3, the distribution of SDI and first-level indicators in the GNI is more dispersed than that in HSDI and HDI, which solves the problem of too high correlation between HSDI (HDI) and GNI per capita (Figure 3). In general, SDI has made great progress compared with HSDI, and it can be considered as a new index.
4.2 Discussion of SDI Ranking Results
Compared with HDI 2019, the ranking of SDI 2019 changes a lot (Supplementary Appendix Table SA1). Except for Switzerland and Sweden, the top 10 countries (regions) in HDI have all fallen out of the top 10 in SDI. Among them, Norway, Ireland, Hong Kong, Denmark, and Germany have lowered their social scores due to property inequality, which represents the inequality in land allocation. Germany also lowered its economic scores due to too low economic growth and high energy consumption. Australia lowered its environmental scores for high per capita carbon emissions and water shortages and lowered its economic scores for the single industrial structure, too high energy consumption, and too low economic growth. Iceland lowered its environmental scores due to water and forest shortages while lowering its economic score due to the single industrial structure. Japan became the No. 1 country in the SDI, followed by New Zealand, Switzerland, Finland, Estonia, Lithuania, Hungary, the United Kingdom, Belgium, Slovenia, and Sweden. The change in the rankings of these countries shows that our added dimension is effective in reassessing the level of sustainable development.
The top 40 countries (regions) have basically not changed, and the countries (regions) with great changes appear in the middle and lower rankings. We select the top 10 countries (regions) with the most ranking progress and regression (Table 3), which show that countries (regions) with more ranking progress have higher environmental scores. None of these countries scored above 0.8 for their economy and society, and none of them are developed countries. This shows that developing countries can rely on ecological protection to obtain higher scores instead of developing their economies through sacrificing the environment. The countries (regions) with more ranking regression are mainly oil-producing countries, which rank high in HDI by relying on high per capita income. The ranking regression of oil-producing countries is due to deterioration of land ecology, such as water and forest shortages, which lower the environmental score, and the economic score of HDI is revised after adding industrial structure and energy consumption to SDI.
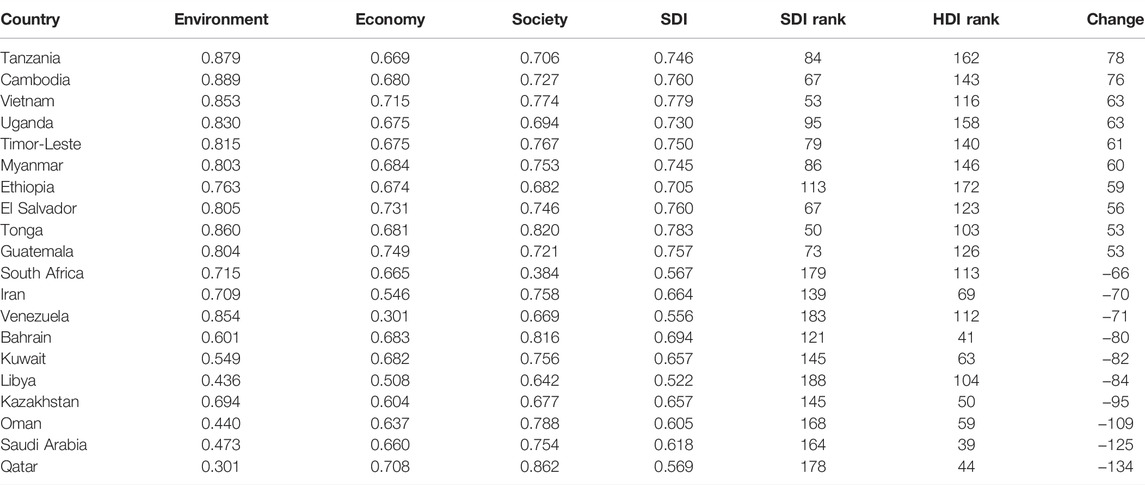
TABLE 3. The top 10 countries (regions) with the most ranking progress and regression.
Regarding the geographical distribution of SDI 2019, Figure 4 shows that most countries (regions) in North America, Western Europe, Northern Europe, and Oceania still maintain high scores; they did not fall sharply in ranking due to the addition of land ecological indicators. We believe that these countries have maintained good land ecology in the process of economic development. The scores of South America and East Asian countries (regions) remained basically unchanged except for Hong Kong, Argentina, Suriname, and Venezuela. The scores of the Middle East, North Africa, and Kazakhstan have dropped significantly, and the main reason is the deterioration of land ecology. The scores of Russia and the United States fell because of property inequality. The scores of South Africa and Argentina declined slightly because of lower social scores. The scores of East African and Southeast Asian countries (regions) have increased significantly, and the main contribution comes from a good land ecology.
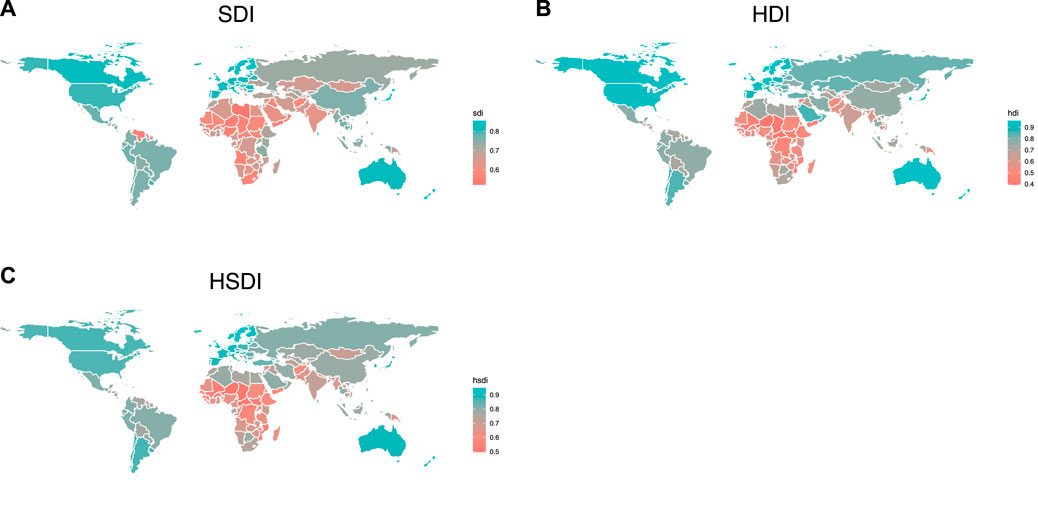
FIGURE 4. Geographical distribution of SDI, HDI, and HSDI. (A) is the geographical distribution of SDI, (B) is the geographical distribution of HDI, (C) is the geographical distribution of HSDI.
5 Conclusion
In this article, we assess the level of sustainable development over the world in terms of multidimensional. We conclude the following:
First, we have established a secondary index system and increased the number of assessment sustainability indicators. These methods solved the deficiencies of existing indices, such as the high correlation between HDI, HSDI, and GNI, the imbalance of EFHDI and EHDI, and the lack of countries of other indices (Morse, 2003a; Togtokh, 2011; Bravo, 2014; Maccari, 2014; Liang et al., 2019). It also makes up for the shortcomings of SDGs without comprehensive indicators. SDI can be considered as a new index because of the weak correlation with SDI and HDI, and it is easy to generalize. Therefore, SDI provides a solution for accurately assessing global sustainable development.
Second, SDI makes countries (regions) pay more attention to land ecological protection, and developing the economy at the expense of the environment will not get a great score in SDI. The regression of oil-producing countries in the Middle East on SDI demonstrates that it is not appropriate to focus only on GNI or GDP, and land ecological protection is equally important to the measure. On the contrary, Southeast Asian and East African countries (regions) have made progress because of land ecological protection. However, it does not mean that economic development is not important; for example, Venezuela has a high environmental score, but its ranking has fallen sharply due to the long-term economic collapse (Supplementary Appendix Table SA1).
Third, balanced development plays a vital role in improving the ranking of SDI. Under the geometric mean method, the contribution of each index to the total score is marginally decreasing, and countries (regions) with unbalanced development will be penalized. For example, Palau has good scores in environment and society, but the single industrial structure has lowered its economic score, making the SDI ranking only 94; Australia’s social score is as high as 0.903, but its environmental and economic scores are only 0.780 and 0.782, respectively, resulting in the SDI ranking only 27, while Latvia’s three scores are 0.839, 0.836, and 0.832, making its SDI ranking 13 (Supplementary Appendix Table SA1).
Fourth, it is not enough to rely on a certain indicator to become a top country. Some countries (regions) have made great progress in the SDI ranking by relying on a high environmental score, but this can’t make them enter the top 50, and too low economic and social scores have become the obstacles to their SDI ranking. This is an important conclusion of this study. The protection of the ecological environment and economic development must be promoted at the same time. In other words, developing countries should not only advocate ecological protection while ignoring economic development. The per capita carbon emissions have little impact on the environmental scores of the top countries (regions). This study holds that the top countries (regions) pay more attention to the sustainable development of the environment (Supplementary Appendix Table SA1). It is reasonable for countries (regions) with the strong financial strength to fund public welfare projects, such as air purification, afforestation, and the establishment of nature reserves. Therefore, economic development is more important than environmental protection for developing countries.
Fifth, it is property inequality, not per capita carbon emissions, that affects the SDI ranking of the top countries, which is different from the conclusions of some existing studies (Togtokh, 2011; Bravo, 2014; Maccari, 2014). Surprisingly, the main reason for the differences between SDI and HDI in the top countries (regions) is property inequality, which is proved by the changes in rankings of Norway, the United States, Ireland, Denmark, Germany, Hong Kong, and Israel. What is more, in general, property inequality has become an important factor hindering sustainable development. Countries (regions) in the world, especially the developed countries (regions), need to take measures to solve property inequality, such as optimizing land allocation.
Our research results provide a reference for countries around the world to improve the level of sustainable development. For developed countries, the gap between the rich and the poor is an issue that cannot be ignored in sustainable construction. Rising inequality will intensify conflicts and cause various social problems. Inequality is also a worldwide problem, with billions of people facing disease, poverty, and hunger every day. Developed countries should take more responsibility for inequality. For developing countries, it is necessary to pay attention to the balance between economic development and ecological protection. We also note that many developing countries are also facing the problem of property inequality. Since the per capita income of developing countries is not high, their property inequality problem is caused by the economic bubble caused by rapid economic development. For example, China has been criticized for its high housing prices in big cities, and most young people cannot afford mortgages, which is consistent with China’s property inequality score of only 0.552. The government needs to strengthen the construction of institutions to prevent economic bubbles and overheating speculation. Another important implication of our research is to promote the collection and publication of sustainability data. The completeness of indicators plays a critical role in the accuracy of SDI. However, the official organizations have not done enough in the statistics of such indicators. For example, the Gini index published by the United Nations, the World Bank, the International Monetary Fund, and other international organizations lacks data from many countries. The relatively complete inequality data we found come from Credit Suisse (Credit Suisse Research Institute, 2019), a non-official organization. The author hopes to promote the statistics and release of sustainability indicators through the establishment of SDI.
This article has limitations in the selection of indicators and goalposts. In future research, we will commit to enhancing the accuracy of the SDI by finding more sustainability indicators and improving the selection of goalposts.
Data Availability Statement
The original contributions presented in the study are included in the article/Supplementary Material; further inquiries can be directed to the corresponding author.
Author Contributions
YP: conceptualization; methodology; software; formal analysis; data curation; writing-original draft preparation; visualization. HZ: investigation; writing-review and editing; supervision.
Conflict of Interest
The authors declare that the research was conducted in the absence of any commercial or financial relationships that could be construed as a potential conflict of interest.
Publisher’s Note
All claims expressed in this article are solely those of the authors and do not necessarily represent those of their affiliated organizations, or those of the publisher, the editors, and the reviewers. Any product that may be evaluated in this article, or claim that may be made by its manufacturer, is not guaranteed or endorsed by the publisher.
Supplementary Material
The Supplementary Material for this article can be found online at: https://www.frontiersin.org/articles/10.3389/fenvs.2022.957095/full#supplementary-material
References
17 Goals to Transform Our World (2021). 17 Goals to Transform Our World. Available at: https://www.un.org/sustainabledevelopment/zh/ (Accessed October 20, 2021).
Aguña, C. G., and Kovacevic, M. (2010). Uncertainty and Sensitivity Analysis of the Human Development Index. Available at: http://hdr.undp.org/en/content/uncertainty-and-sensitivity-analysis-human-development-index (Accessed October 20, 2021).
Anand, S., and Sen, A. (1994). Human Development Index: Methodology and Measurement. Available at: https://ora.ox.ac.uk/objects/uuid:98d15918-dca9-4df1-8653-60df6d0289dd/download_file?file_format=application/pdf&safe_filename=HDI_methodology.pdf&type_of_work=Report (Accessed October 20, 2021).
Anand, S., and Sen, A. K. (1997). Concepts of Human Development and Poverty: A Multidimensional Perspective. Available at: http://clasarchive.berkeley.edu/Academics/courses/center/fall2007/sehnbruch/UNDP%20Anand%20and%20Sen%20Concepts%20of%20HD%201997.pdf (Accessed October 20, 2021).
Anand, S., and Sen, A. (2000). The Income Component of the Human Development Index. J. Hum. Dev. 1, 83–106. doi:10.1080/14649880050008782
Barrera-Roldán, A., and Saldı́var-Valdés, A. (2002). Proposal and Application of a Sustainable Development Index. Ecol. Indic. 2, 251–256. doi:10.1016/S1470-160X(02)00058-4
Beça, P., and Santos, R. (2010). Measuring Sustainable Welfare: A New Approach to the ISEW. Ecol. Econ. 69, 810–819. doi:10.1016/j.ecolecon.2009.11.031
Biggeri, M., and Mauro, V. (2018). Towards a More 'Sustainable' Human Development Index: Integrating the Environment and Freedom. Ecol. Indic. 91, 220–231. doi:10.1016/j.ecolind.2018.03.045
Bilbao-Ubillos, J. (2013). Another Approach to Measuring Human Development: The Composite Dynamic Human Development Index. Soc. Indic. Res. 111, 473–484. doi:10.1007/s11205-012-0015-y
Bravo, G. (2014). The Human Sustainable Development Index: New Calculations and a First Critical Analysis. Ecol. Indic. 37, 145–150. doi:10.1016/j.ecolind.2013.10.020
Brulé, G. (2022). Evaluation of Existing Indexes of Sustainable Well-Being and Propositions for Improvement. Sustainability 14 (2), 1027. doi:10.3390/su14021027
Cahill, M. B. (2005). Is the Human Development Index Redundant? East. Econ. J. 31, 1–5. Available at: https://www.jstor.org/stable/40326318.
Carlucci, F., and Pisani, S. (1995). A Multiattribute Measure of Human Development. Soc. Indic. Res. 36, 145–176. doi:10.1007/BF01079723
Climate Action Summit (2019). Climate Action Summit. Available at: https://www.un.org/en/climatechange/2019-climate-action-summit (Accessed October 20, 2021).
Costantini, V., and Monni, S. (2005). Sustainable Human Development for European Countries. J. Hum. Dev. 6, 329–351. doi:10.1080/14649880500287654
Credit Suisse Research Institute (2019). Global Wealth Databook 2019. Available at: https://www.credit-suisse.com/about-us/en/reports-research/global-wealth-report.html (Accessed October 20, 2021).
Dervis, K., and Klugman, J. (2011). Measuring Human Progress: The Contribution of the Human Development Index and Related Indices. Rev. Econ. Polit. 121, 73–92. doi:10.3917/redp.211.0073
Distaso, A. (2007). Well-being And/or Quality of Life in EU Countries through a Multidimensional Index of Sustainability. Ecol. Econ. 64, 163–180. doi:10.1016/j.ecolecon.2007.02.025
EPI (2012). EPI. Available at: https://ec.europa.eu/jrc/sites/default/files/2012-epi-full-report.pdf (Accessed October 20, 2021).
Foster, J. E., Lopez-Calva, L. F., and Szekely, M. (2005). Measuring the Distribution of Human Development: Methodology and an Application to Mexico. J. Hum. Dev. 6, 5–25. doi:10.1080/1464988052000342220
Goal 11 (2021). Goal 11: Make Cities Inclusive, Safe, Resilient and Sustainable. Available at: https://www.un.org/sustainabledevelopment/zh/cities/(Accessed October 20, 2021).
Goal 3 (2021). Goal 3: Ensure Healthy Lives and Promote Well-Being for All at All Ages. Available at: https://www.un.org/sustainabledevelopment/health/(Accessed October 20, 2021).
Gormely, P. J. (1995). The Human Development Index in 1994: Impact of Income on Country Rank. Jem 21, 253–267. doi:10.3233/JEM-1995-21401
Gough, I. (2015). Climate Change and Sustainable Welfare: the Centrality of Human Needs: Fig. 1. Cameco 39, 1191–1214. doi:10.1093/cje/bev039
Grimm, M., Harttgen, K., Klasen, S., and Misselhorn, M. (2008). A Human Development Index by Income Groups. World Dev. 36, 2527–2546. doi:10.1016/j.worlddev.2007.12.001
Guest, R. (2010). The Economics of Sustainability in the Context of Climate Change: An Overview. J. World Bus. 45, 326–335. doi:10.1016/j.jwb.2009.08.008
Gupta, P., and Bharat, A. (2022). Developing Sustainable Development Index as a Tool for Appropriate Urban Land Take[J]. Environ. Dev. Sustain. 2022, 1–29. doi:10.1007/s10668-021-01992-y
Harttgen, K., and Klasen, S. (2012). A Household-Based Human Development Index. World Dev. 40, 878–899. doi:10.1016/j.worlddev.2011.09.011
Herrero, C., Martínez, R., and Villar, A. (2012). A Newer Human Development Index. J. Hum. Dev. Capab. 13, 247–268. doi:10.1080/19452829.2011.645027
Herrero, C., Martínez, R., and Villar, A. (2010). Multidimensional Social Evaluation: an Application to the Measurement of Human Development. Rev. Income Wealth 56, 483–497. doi:10.1111/j.1475-4991.2009.00375.x
Herrero, C., Martínez, R., and Villar, A. (2019). Population Structure and the Human Development Index. Soc. Indic. Res. 141, 731–763. doi:10.1007/s11205-018-1852-0
Hickel, J. (2020). The Sustainable Development Index: Measuring the Ecological Efficiency of Human Development in the Anthropocene. Ecol. Econ. 167, 106331. doi:10.1016/j.ecolecon.2019.05.011
Hicks, D. A. (1997). The Inequality-Adjusted Human Development Index: A Constructive Proposal. World Dev. 25, 1283–1298. doi:10.1016/S0305-750X(97)00034-X
Huan, Y., Liang, T., Li, H., and Zhang, C. (2021). A Systematic Method for Assessing Progress of Achieving Sustainable Development Goals: A Case Study of 15 Countries. Sci. Total Environ. 752, 141875. doi:10.1016/j.scitotenv.2020.141875
Islam, S. (1995). The Human Development Index and Per Capita GDP. Appl. Econ. Lett. 2, 166–167. doi:10.1080/135048595357537
Ivanova, I., Arcelus, F. J., and Srinivasan, G. (1999). An Assessment of the Measurement Properties of the Human Development Index. Soc. Indic. Res. 46, 157–179. doi:10.1023/A:1006839208067
Kelley, A. C. (1991). The Human Development Index: "Handle with Care". Popul. Dev. Rev. 17, 315–324. doi:10.2307/1973733
Klugman, J., Rodríguez, F., and Choi, H.-J. (2011). The HDI 2010: New Controversies, Old Critiques. J. Econ. Inequal. 9, 249–288. doi:10.1007/s10888-011-9178-z
Lamichhane, S., Eğilmez, G., Gedik, R., Bhutta, M. K. S., and Erenay, B. (2021). Benchmarking OECD Countries' Sustainable Development Performance: A Goal-specific Principal Component Analysis Approach. J. Clean. Prod. 287, 125040. doi:10.1016/j.jclepro.2020.125040
Liang, M., Niu, S., Li, Z., and Qiang, W. (2019). International Comparison of Human Development Index Corrected by Greenness and Fairness Indicators and Policy Implications for China. Soc. Indic. Res. 142, 1–24. doi:10.1007/s11205-018-1912-5
Lind, N. C. (1992). Some Thoughts on the Human Development Index. Soc. Indic. Res. 27, 89–101. doi:10.1007/BF00300511
Maccari, N. (2014). Environmental Sustainability and Human Development: A Greening of Human Development Index. SSRN J. doi:10.2139/ssrn.2426073
Mcgillivray, M. (1991). The Human Development Index: Yet Another Redundant Composite Development Indicator? World Dev. 19, 1461–1468. doi:10.1016/0305-750X(91)90088-Y
Mcgillivray, M., and White, H. (1993). Measuring Development? the UNDP's Human Development Index. J. Int. Dev. 5, 183–192. doi:10.1002/jid.3380050210
Mihci, H., Taner, M. T., and Sezen, B. (2012). Employment-adjusted Human Development Index. Available at: www.openaccess.hacettepe.edu.tr:8080/xmlui/bitstream/handle/11655/21240/2436.pdf?sequence=2 (Accessed October 20, 2021).
Moran, D. D., Wackernagel, M., Kitzes, J. A., Goldfinger, S. H., and Boutaud, A. (2008). Measuring Sustainable Development - Nation by Nation. Ecol. Econ. 64, 470–474. doi:10.1016/j.ecolecon.2007.08.017
Morse, S. (2003). For Better or for Worse, till the Human Development Index Do Us Part? Ecol. Econ. 45, 281–296. doi:10.1016/S0921-8009(03)00085-5
Morse, S. (2003). Greening the United Nations' Human Development Index? Sust. Dev. 11, 183–198. doi:10.1002/sd.219
Neumayer, E. (2012). Human Development and Sustainability. J. Hum. Dev. Capab. 13, 561–579. doi:10.1080/19452829.2012.693067
Neumayer, E. (2001). The Human Development Index and Sustainability - a Constructive Proposal. Ecol. Econ. 39, 101–114. doi:10.1016/S0921-8009(01)00201-4
Noorbakhsh, F. (1998). A Modified Human Development Index. World Dev. 26, 517–528. doi:10.1016/S0305-750X(97)10063-8
Osberg, L., and Sharpe, A. (2002). An Index of Economic Well-Being for Selected OECD Countries. Rev. Income Wealth 48, 291–316. doi:10.1111/1475-4991.00056
Peeters, W., Dirix, J., and Sterckx, S. (2013). Putting Sustainability into Sustainable Human Development. J. Hum. Dev. Capab. 14, 58–76. doi:10.1080/19452829.2012.748019
Ranis, G., Stewart, F., and Samman, E. (2006). Human Development: Beyond the Human Development Index. J. Hum. Dev. 7, 323–358. doi:10.1080/14649880600815917
Ravallion, M. (1997). Good and Bad Growth: The Human Development Reports. World Dev. 25, 631–638. doi:10.1016/S0305-750X(96)00141-6
Ravallion, M. (2012). Troubling Tradeoffs in the Human Development Index. J. Dev. Econ. 99, 201–209. doi:10.1016/j.jdeveco.2012.01.003
Sagar, A. D., and Najam, A. (1998). The Human Development Index: a Critical Review. Ecol. Econ. 25, 249–264. doi:10.1016/S0921-8009(97)00168-7
Singh, A. K., Jyoti, B., Kumar, S., and Lenka, S. K. (2021). Assessment of Global Sustainable Development, Environmental Sustainability, Economic Development and Social Development Index in Selected Economies. Int. J. Sustain. Dev. 16 (1), 123–138. doi:10.18280/ijsdp.160113
Srinivasan, T. N. (1994). Human Development: a New Paradigm or Reinvention of the Wheel? Am. Econ. Rev. 84, 238–243. Available at: https://www.jstor.org/stable/2117836.
Streeten, P. (1994). Human Development: Means and Ends. Am. Econ. Rev. 84, 232–237. Available at: https://www.jstor.org/stable/2117835.
Trabold-Nübler, H. (1991). The Human Development Index-A New Development Indicator? Intereconomics 26, 236–243. doi:10.1007/BF02928996
UNDP (2010). Human Development Report 2010: The Real Wealth of Nations—Pathways to Human Development. Available at: http://hdr.undp.org/en/content/human-development-report-2010 (Accessed October 20, 2021).
UNDP (2020). Human Development Report 2020: The Next Frontier—Human Development and the Anthropocene. Available at: http://hdr.undp.org/en/2020-report (Accessed October 20, 2021).
UNDP (2020). Technical Notes. Available at: http://hdr.undp.org/sites/default/files/hdr2020_technical_notes.pdf (Accessed October 20, 2021).
United Nations Sustainable Development Summit (2015). United Nations Sustainable Development Summit. Available at: https://sustainabledevelopment.un.org/post2015/summit (Accessed October 20, 2021).
Wackernagel, M., and Rees, W. E. (1997). Perceptual and Structural Barriers to Investing in Natural Capital: Economics from an Ecological Footprint Perspective. Ecol. Econ. 20, 3–24. doi:10.1016/S0921-8009(96)00077-8
Yumashev, A., Ślusarczyk, B., Kondrashev, S., and Mikhaylov, A. (2020). Global Indicators of Sustainable Development: Evaluation of the Influence of the Human Development Index on Consumption and Quality of Energy. Energies 13, 2768. doi:10.3390/en13112768
Keywords: sustainable development index, land ecological protection, inequality, balanced development, sustainable development assessment
Citation: Peng Y and Zhang H (2022) Global Sustainable Development Evaluation Methods With Multiple-Dimensional: Sustainable Development Index. Front. Environ. Sci. 10:957095. doi: 10.3389/fenvs.2022.957095
Received: 30 May 2022; Accepted: 24 June 2022;
Published: 22 July 2022.
Edited by:
Larisa IVASCU, Politehnica University of Timișoara, RomaniaReviewed by:
Yongliang Yang, Zhejiang Sci-Tech University, ChinaYafei Lu, Zhejiang Laboratory, China
Copyright © 2022 Peng and Zhang. This is an open-access article distributed under the terms of the Creative Commons Attribution License (CC BY). The use, distribution or reproduction in other forums is permitted, provided the original author(s) and the copyright owner(s) are credited and that the original publication in this journal is cited, in accordance with accepted academic practice. No use, distribution or reproduction is permitted which does not comply with these terms.
*Correspondence: Hejie Zhang, aHp6aGpAemp1dC5lZHUuY24=