 Zhiheng Yang
 Tiantian Liu1
 Mei Guan
- 1Institute of Regional Economics, Shandong University of Finance and Economics, Jinan, China
- 2Center for Economics, Finance and Management Studies, Hunan University, Changsha, China
- 3Shandong Provincial Land Survey and Planning Institute, Jinan, China
In response to the challenges of rural chronic poverty caused by insufficient self-development ability, establishing a development model conducive to poverty alleviation and stimulating rural development potential have become core tasks of deepening rural revitalization. Resources and environment play an important role in invigorating rural vitality. Based on symbiosis theory, we have constructed a new conceptual framework to analyze dynamic performance of rural areas in population, industry and facilities, and dynamic constraints in resources and environment. Using an improved TOPSIS evaluation method and panel Tobit model, we have selected 106 rural revitalization model towns from Shandong province as research samples, empirically analyzed the performance of rural vitality and its resources and environment constraints, explored differences of rural vitality performance and vitality constraints of different village types, and put forward long-term mechanisms to maintain rural vitality. Results show that from 2012 to 2019, rural vitality of rural revitalization model towns in Shandong province was gradually improved, among which industrial development had contributed the most; agriculture-tourism towns are more dynamic than industrialized agriculture towns and characteristic agricultural towns. Through analysis of resources and environment constraints on rural vitality, we found that resources had the greatest impact on rural vitality, and the short-term constraints of total amount restriction on rural vitality were not obvious; binding force of ecological environment on rural vitality changed from weak to strong and increasingly became the bottleneck restricting rural vitality. We have further proposed a long-term mechanism to stimulate rural vitality from the aspects of promoting comprehensive utilization of rural residential land, strengthening concept of ecological priority and green development, taking the road of urban–rural integration, and promoting integrated development of rural industries.
1 Introduction
With rapid expansion of world population, shortage of resources and energy, deterioration of ecological environment and intensification of social contradictions, and coordinated development of resources and environment has gradually become the consensus of all mankind. Regional development under resources and environment constraints has become a hot topic in recent years. Rural development is particularly dependent on resources and environment. Rural poverty, food security, and increasingly severe environmental degradation have posed challenges to realization of global sustainable development goals (SDGs) (Carr and Kefalas, 2009; Liu and Li, 2017; Barbier and Burgess, 2020; Diaz-Sarachaga, 2020; Yang et al., 2020). How to make better use of resources and environment to stimulate rural vitality has become a research hot spot to solve the problem of rural development and realize rural revitalization (Makkonen and Kahila, 2021; Pinilla and Sáez, 2021).
Revival of rural geography has started redefinition of rural areas, conceptualizing rural production space as a mixed and networked space (Woods, 2009; Yang et al., 2021). It is believed that material conditions and discourse power related to geographical environment of rural areas have an impact on rural development, creating diversification of interest subjects and industrial forms, multi-function of land use, and variability of land use modes (Liu et al., 2017; Li et al., 2019; Li et al., 2021; Long et al., 2019).
Resources and environment are important constraints for rural development. Some scholars have incorporated resource and environmental factors into analysis framework of agricultural total factor productivity and water use efficiency of food crops. For example, Ball et al. (2001) and Rezek and Richard (2004) measured TFP in US agriculture from the perspective of environmental constraints and found that the TFP index accounting for environmental pollution was lower than the TFP index without accounting for environmental pollution. Li (2014) concluded that agricultural green TFP was generally lower than agricultural TFP and that green TFP was higher in the eastern region than in the central and western regions. Gan and Li (2021) took discharge of major agricultural water pollutants as unexpected output to calculate the water use efficiency of grain crops in grain production areas. Some scholars have analyzed such issues as environmentally friendly and economically viable cropping systems, sustainable agriculture, and having sustainable livelihood under resource and environmental constraints. Deng et al. (2020) suggested that planting common vetch during the summer fallow period may be a productive and economically sound practice that has low energy requirements. Sarkar et al. (2021) considered that sustainable agriculture could play significant roles in facilitating the betterment of land, water, air, and the overall environment. In addition, sustainable livelihood had been fully utilized in solving the poverty problems (Dzanku, 2015), which is the ability to restore and confront pressure and shocks, to maintain capital and to remain growing based on conserving environmental resources (Chambers and Conway, 1992).
Previous studies have provided a good reference for explaining rural vitality under resources and environment constraints. In reality, rural areas carry multiple functions, such as agricultural production, rural cultural inheritance, social security, and ecological conservation. The endogenous development model embodied in rural vitality is pinned on a number of development goals, such as agricultural transformation and upgrading, sustained income increasing of farmers, and comprehensive rural progress, which is just in line with current needs to promote sustainable rural development and alleviate relative poverty. However, further stimulation of rural vitality is facing unprecedented pressure due to shortage of water resources, cultivated land resources, and labor resources as well as global climate change, agricultural non-point source pollution, and industrial exogenous pollution.
Based on this, we have tried to use the data obtained from 106 rural revitalization model towns in Shandong province in 2012, 2016, and 2019, constructed rural vitality index system, used an improved Technique for Order Preference by Similarity to an Ideal Solution (TOPSIS) method to measure the vitality value of different village types and panel Tobit model to explore the impact of resource and environmental factors on rural vitality, and explored a feasible path to activate rural vitality, so as to fully explore development potential of rural areas and build a long-term mechanism to stimulate rural vitality. The main contributions of our study are summarized as follows: 1) a rural vitality index system based on “population–facility–industry” is proposed to analyze the performance of rural vitality of rural revitalization model towns in Shandong province and explore differences of rural vitality performance of different village types and 2) restricted by regional resources and environment have increasingly become a prominent contradiction perplexing rural revitalization. However, existing studies seldom analyze rural vitality from the perspective of resources and environment constraints. We creatively link the two and analyze the issue of stimulating rural vitality under resources and environment constraints.
2 Conceptual Background
2.1 Literature Review of Rural Vitality
Vitality refers to vigorous vitality, which is generated in the exploration of life problems. Referring to general evolution law of life, vitality is used to express viability and development of social organizations, as well as the interaction between life and the external environment (Lan et al., 2020). In research on man-land relations, vitality is mainly used to express the attraction of space to people and its support for activities, especially in urban planning (Montgomery, 1995; Xia et al., 2020), which shows the economic and social development trends created by people on the basis of using natural resources and protecting environment (Lurie and Brekken, 2019).
Rural vitality is the embodiment of rural development and the potential of rural areas to overcome possible problems, such as rural hollowing out and backward development, which represents viability and development of rural social organizations, covering agricultural development, rural population employment, housing development, rural facilities improvement, traditional village protection, ecological governance, etc. Rural population, facilities, and industries are important components of rural vitality (Lampic and Potocnik-Slavic, 2007; Cheng, 2019; Cao et al., 2020).
Many scholars pay attention to rural vitality. Some of them concerned for rural vitality from a single perspective. Pearce (2005) analyzed the decisive role of natural resources in rural community vitality. Van Rij and Koomen (2010) concluded that there was no clear relationship between the construction of houses and different indicators of rural vitality such as employment and facility levels. Vujicic et al. (2013) studied local initiatives for rural vitality and social inclusion. Mihai et al. (2019) made a new assessment of the development status among the people living in rural areas. Lin et al. (2021) proposed a process for interactive participation to optimize green space in the peri-urban village from the demand-side perspective and enhance rural vitality. They have paid attention to rural vitality performance in specific fields but lacked a comprehensive understanding of rural vitality.
Therefore, some scholars have analyzed rural vitality from a comprehensive dimension and believed that rural vitality is the embodiment of comprehensive development of rural areas. Accordingly, evaluation system of rural vitality is mainly carried out from multiple dimensions. Cheng et al. (2019) proposed the personal rural development index (PRDI) from three socio-economic components, namely, economy, education, and health. Li et al. (2020) constructed the rural viability index from the aspects of infrastructure conditions, public services, health status, employment opportunities, and social participation, reflecting the ability of rural areas to achieve the quality of life desired by residents. In addition, some scholars have built index systems from the aspects of rural industrial development, living environment, cultural construction, governance capacity, and quality of life to measure the rural development level. Liu et al. (2022) established a traditional village vitality assessment index system as an integrated capacity to protect and develop rural sustainable revitalization.
2.2 Rural Vitality Based on Symbiosis Theory
Rural vitality is a comprehensive reflection of rural population activity, industrial output rate, and facility utilization rate. Rural population is the main body of the rural regional system. Number of farmers and their living standards are the most direct and realistic performance of rural vitality. Completeness of rural facilities is social performance of rural vitality. Convenient and high-quality infrastructure is conducive to promoting rural undertakings and the quality of life for farmers. Rural industrial development is economic performance of rural vitality, including agricultural production and the integrated development of agriculture, industry, and service industry, which is the power source of rural vitality.
Changes in any aspect of rural population, facilities, and industries may greatly impact rural vitality. The vitality state of rural areas is the result of the interaction of population, facilities, and industries. The changes in the quantity, quality, and structure of rural population are the main factors that determine the development of rural industries. The development of agricultural modernization has promoted the improvement of agricultural productivity, enhanced agricultural output capacity, and brought about the increase of rural population income. Industrial development is also inseparable from the support of production and living facilities. At the same time, benefits from industrial development lay the foundation for better upgrading the level of facilities. The development of infrastructure construction synchronized with or faster than rural development, which can well meet the needs of rural economic development and farmers’ living, providing strong facilities guarantee for agricultural and rural development.
Through the interaction of population, facilities, and industries, rural vitality finally presents a state of population concentration, complete facilities, and prosperous industries. As for rural population, vibrant rural areas have high population density and income level. They attract population aggregation with stable employment and higher income and slowed down the overflow of rural population in rural areas. In the rural industry, dynamic rural areas have high agricultural production capacity and active entrepreneurial activities. Rural areas create a high-yield and low-consumption agricultural production system by the application of modern technology and industrial equipment and an entrepreneurial atmosphere of multi market players’ competition and incorporation by adopting development mode of industrial integration, which is conducive to the development of agricultural industrialization. In rural infrastructure, rural areas with high vitality have sound infrastructure. Improving infrastructure construction to meet the needs of population and industrial development in rural areas will guide more rural people to change to a modern way of life, activate rural infrastructure vitality, and promote development of rural areas. The quantity and spatial combination of rural population, facilities, and industries constitute the rural regional system, which comprehensively shows rural vitality (Figure 1).
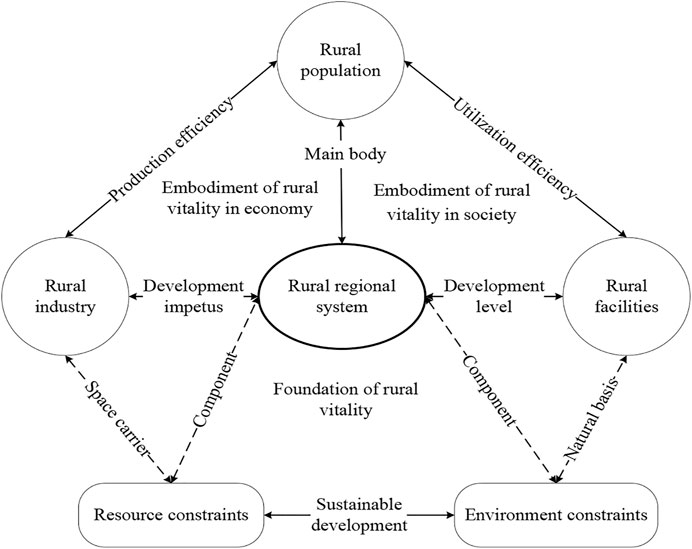
FIGURE 1. Composition of rural vitality.
2.3 Resource and Environment Constraints on Rural Vitality
Meanwhile, basic pattern of social and economic activity spaces cannot cross the “hard threshold” jointly set by resource and environmental elements and geographical development conditions. Rural resources and environment and its development conditions constitute spatial carrier and natural base of rural vitality, which is the development foundation of rural vitality. Agriculture is highly dependent on resources and environment. The input of natural resources is essential. Appropriate natural ecological environment conditions are also very important.
Resources limitation mainly refers to land resources limitation. Land is material basis and spatial carrier of rural economic and social development, and plays a very important role in the process of activating rural internal vitality. Rural industrial structure adjustment, population agglomeration, and infrastructure construction all need to be realized through reallocation of land resources. Rational land use will play a good role in balanced distribution of resources and rural social and economic development. At present, imbalanced man-land relationship is basic contradiction in the process of stimulating rural vitality. Farmers are highly dependent on land, reflecting in spatial dependence of rural residents on living space (housing) and production space (arable land). However, man-land relationship in rural areas is facing conflicts such as village hollowing and extensive use of cultivated land. Land use change expressed by spatial expansion and contraction of different land use types has become an important driving force for rural vitality. Intensive land use has promoted change of input and output per unit land area, affected agricultural production efficiency, changed rural production system, and affected further stimulation of rural vitality.
Environmental constraints mainly refer to ecological environment constraints. A good ecological environment is basis for rural sustainable development. Under the condition of limited land resources, improving rural ecological environment helps to comprehensively stimulate rural vitality. Vegetation coverage, water resource abundance, and environmental quality are important indicators to indicate ecological environment change. Forest vegetation has the functions of regulating climate, conserving water, preventing soil erosion, and desertification in its adjacent areas, which will affect improvement of the farmers’ living environment. It can also provide support to characteristic industries such as forest economy, natural eco-tourism, and forest health tourism. Water resource is a basic production factor of agriculture. Its abundance, shortage, and distribution directly determine the scale, type, and level of rural industrial development, which is essential in social and economic development. Water and soil pollution, air pollution, and excessive use of pesticides and fertilizers will lead to deterioration of rural living environment, resulting in a series of social and economic problems, including threat of food safety and human health, weakening of talent gathering capacity and low efficiency of agricultural production, which limits stimulation of rural vitality.
3 Methods and Research Materials
3.1 Survey and Data
In 2013, the per capita disposable income of rural residents in Shandong province exceeded the 10,000 RMB for the first time, reaching 10,620 yuan. Since 2018, Shandong province has promoted flow of various resources and elements to the countryside, focused on building demonstration benchmarks for rural revitalization with different regional characteristics and different development types, and promoted overall momentum of rural revitalization by strengthening the top-level design and work implementation. Considering the availability of data, the three time points of 2012, 2016, and 2019 are finally determined, which can fully reflect dynamic characteristics of rural revitalization model towns in Shandong province at different development stages.
The data of population and industrial output value are from the third agricultural census, the sixth national census, County Statistical Yearbook for 2013, 2017, and 2020, and statistical bulletin on national economic and social development of counties for 2013, 2017, and 2020. Land use data are from Resource and Environment Science and Data Center of Chinese Academy of Sciences, (http://www.resdc.cn) providing land use data (spatial resolution: 100 m * 100 m) in 2012, 2016, and 2019. Through a large number of ground surveys and human–computer interpretation, the accuracy is not less than 85%. The number of rural household industry and township enterprises comes from local market survey.
3.2 Study Area
Rural revitalization model towns in Shandong province are selected as research samples (Figure 2). Shandong province is one of coastal provinces in East China. It is essential in national rural development for the following reasons. With 6% of arable land and 1% of fresh water resources in China, it contributes 8% of grain output, 9% of meat output, 12% of fruit output, 13% of vegetable output, 14% of aquatic product output, and 19% of peanut output; export volume of agricultural products accounts for 24% of the country; the rural population is 37.513 million, accounting for 36.95% of total population of Shandong province.
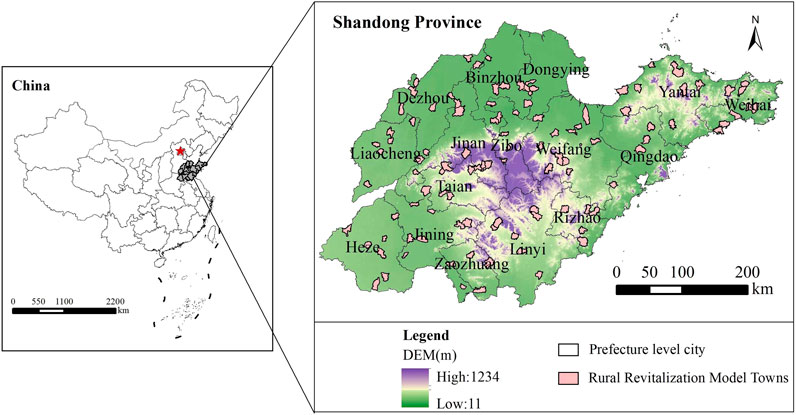
FIGURE 2. Distribution of rural revitalization model towns.
To further shoulder the responsibility of a major agricultural province, Shandong province has identified many rural revitalization model towns and explored multiple models and successful experience of building characteristic towns for rural revitalization. Thus, we have selected 106 towns with different resource endowments and location conditions as research samples. Industrial integration development is the fundamental path for the development of rural revitalization model towns in Shandong province. Through the investigation of whether the town adopts industrial integration development model and which industries the town mainly integrates with, these samples are divided into three types: characteristic agricultural towns, agriculture-tourism towns, and industrialized agriculture towns. Among them, there are 43 characteristic agricultural towns, accounting for 40.57%, 38 agriculture-tourism towns, accounting for 35.85%, and 25 industrialized agriculture towns, accounting for 23.58%.
Characteristic agriculture is a special agricultural industry developed on basis of regional resource advantages, which has more development advantages than conventional agriculture. It transforms the original natural resource advantage into scale, efficiency, and benefit advantage of agricultural development through agricultural science and modern management and then into economic advantage. It uses high-quality, high-value, and highly competitive agricultural products to meet people’s growing diversified needs, obtain higher economic benefits and increase farmers’ income. Compared with conventional agriculture, characteristic agriculture has the characteristics of strong regionality, high-quality products, high merchantability, and economic efficiency. Typical characteristic agricultural town is the standardized vegetable production town—Jitai town, Weifang city (Figure 3).
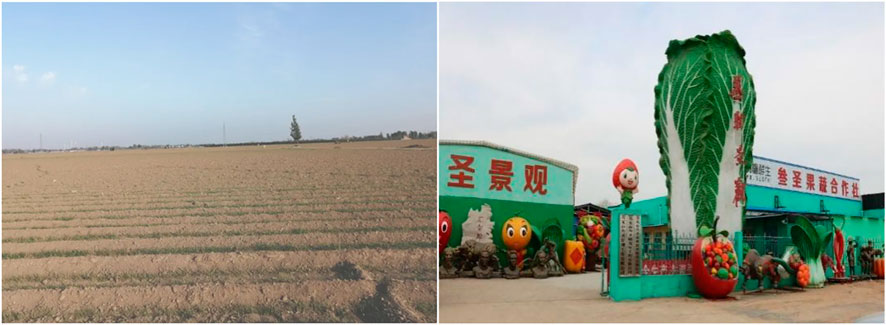
FIGURE 3. Characteristic agricultural town.
Integration of agriculture and tourism is mutual extension between agriculture and tourism, which can meet growing leisure and recreation needs of citizens and transfer agricultural surplus labor. Its essential attribute is industrial integration and urban–rural interaction based on agricultural resources. Agricultural resources formed by R&D, production, processing, and sales of the agricultural industry chain can be developed into tourism resources. Tourism mainly provides services and facilities. Through effective organization and development of corresponding projects, it organically combines elements such as food, housing, transportation, tourism, shopping, and entertainment with agricultural resources. Agriculture has changed from providing production factors for tourism to showing characteristics of tourism suppliers, which has optimized agricultural service industry development. Typical agriculture-tourism town is Longju town, Dongying city, which has a distinctive cultural and leisure tourism brand (Figure 4).
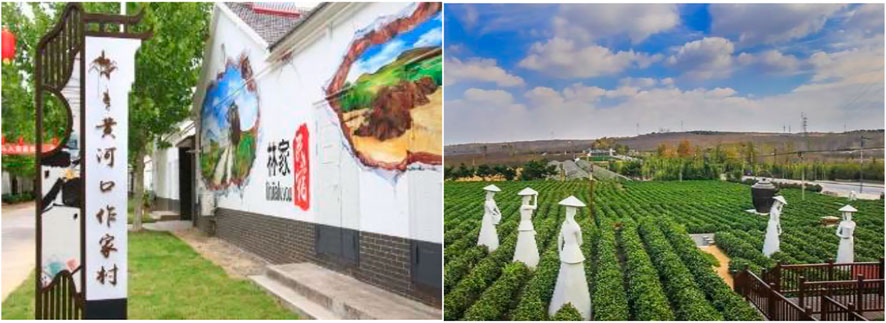
FIGURE 4. Agriculture-tourism town.
Industrialized agriculture refers to a modern advanced agricultural production mode that adopts industrialized production to achieve intensive, efficient, and sustainable development under relatively controllable environmental conditions. It is a production mode that combines advanced agricultural facilities with land, which has high technical specifications and high-efficiency intensive scale operation. Compared with traditional agriculture, industrialized agriculture based on the Internet can accurately control the problems of watering, fertilization and pesticide application in the process of agricultural production through the information-based intelligent monitoring system in real-time, so as to achieve the sustainable development goals of intensive, high-yield, efficient, and ecological agricultural production. Typical industrialized agriculture town is Baisha town, Rushan city, which uses industrial ideas to plan agricultural development (Figure 5).

FIGURE 5. Industrialized agriculture town.
3.3 Methods
3.3.1. Construction of Index System
Based on the aforementioned theoretical analysis, we have built the rural vitality evaluation index system from the dimensions of population, facilities, and industry (Table 1). Following principles of systematization, scientific nature, and data availability, we have screened representative indicators of each dimension. Population dimension includes residential density of rural permanent population and annual per capita net income of farmers, which represents distribution and wealth of rural populations. Facility dimension includes the level of agricultural mechanization and density of highway network, which reflects the level of agricultural modernization and regional highway development. Industrial dimension includes agricultural output value per unit land area and the number of rural household industries and township enterprises, which represents rural economic strength.
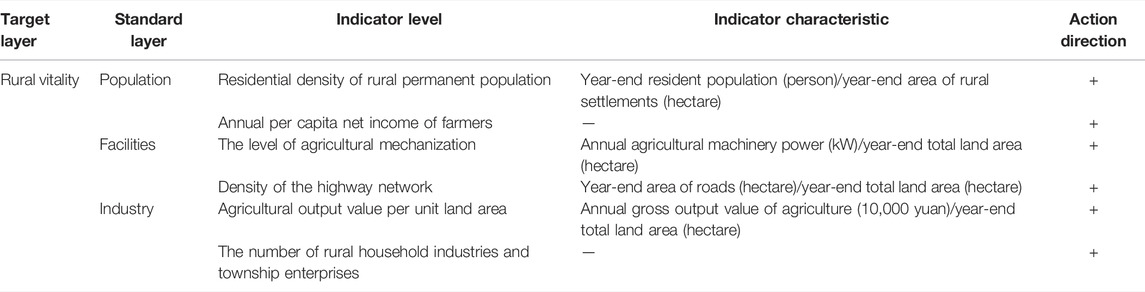
TABLE 1. Rural vitality evaluation index system.
3.3.2. Improved TOPSIS Method
The traditional TOPSIS model only considers comprehensive level of indicators. But indicators can replace each other, that is, for a scheme, even if a small number of indicators have low scores and most indicators have high scores, comprehensive evaluation value of the scheme will be high. The requirement of coordinated development is that the scores of multiple development indicators should not be very different. The greater the difference, the lower is the comprehensive evaluation score. Based on this consideration, we have proposed the following improved TOPSIS method to calculate the comprehensive evaluation value and each dimension value of rural vitality.
First, positive and negative indicators are standardized according to the range variation method. Second, the equal weight method is adopted to give the index weight
Taking two indicators as examples to illustrate how to calculate, it can be seen from Figure 6 that when index coordination is high, the scores of each index should be close, and the vertical distance from the scheme point
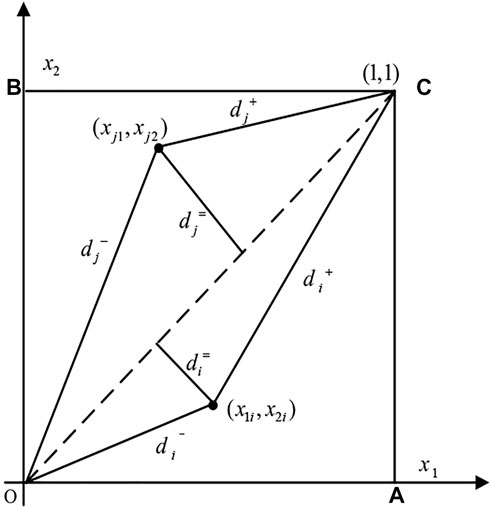
FIGURE 6. Three distances of Program
When there are more than two evaluation indexes, the shortest distance from scheme point
First, calculate square of the space distance
Second, calculate the derivative to get the coordinate value of the connection point
Finally, calculate the shortest weighted distance
3.3.3. Model Construction
The value of rural vitality calculated by the improved TOPSIS method ranges from 0 to 1, which belongs to truncated data at both ends. If the OLS method is used to regression the model, the estimation of parameters will be biased and inconsistent. Therefore, we use the limited dependent variable model, namely, the panel Tobit model, to make an empirical analysis on rural vitality state under resources and environment constraints. Referring to Moffit and McDonald (1980), the model is as follows.
where,
3.3.4. Variable Selection
The explained variable is rural vitality index, which is calculated by the improved TOPSIS method; the core explanatory variable is the resource and environment constraints that affect rural vitality. The resource constraints mainly refer to land resource. In rural areas, cultivated land and rural residential land, accounting for the majority of land resource, are important social units because they reflect the relationships between people and land, the historical background, and the sociopolitical relationships (Robinson, 2003; Zhou et al., 2019). We have selected the per capita cultivated land area and the density of rural residential areas as the indicators. The indicators of environmental constraints are the ecological environment quality. With reference to Technical Criterion for Ecosystem Status Evaluation issued by the State Environmental Protection Administration and the theoretical analysis of Section 2, we have selected three indicators: vegetation cover index, water network density index, and the amount of solid waste discarded per unit area.
As to control variables, geographical location factors, urbanization level, policy inclination, and other factors are selected. 1) Geographical factors mainly include the distance from the county center. Compared with towns, the county has a high density of public facilities, a complete range of service industries and public activities. It is often an economically active and densely populated area and has a strong ability to drive vitality of surrounding areas. The closer the township is to the county center, the more convenient the transportation is, and the stronger the attraction of the township to people. 2) Urbanization drives development of rural areas in terms of scale, quality, and benefits by providing product sales markets and sharing of urban and rural facilities, which promotes expansion of the scale of agricultural products and rural tourism consumption markets, brings about an increase in farmers’ income, drives the construction of rural infrastructure, leads to the agglomeration of rural development factors, and the improvement of comprehensive benefits. 3) Policy preference means that the government formulates fiscal and fixed asset investment policies conducive to rural development, which helps to guide more factors to gather in rural areas through capital investment, industrial layout, engineering projects, and supporting facilities construction. The meaning and calculation method of the selected variables are shown in Table 2.
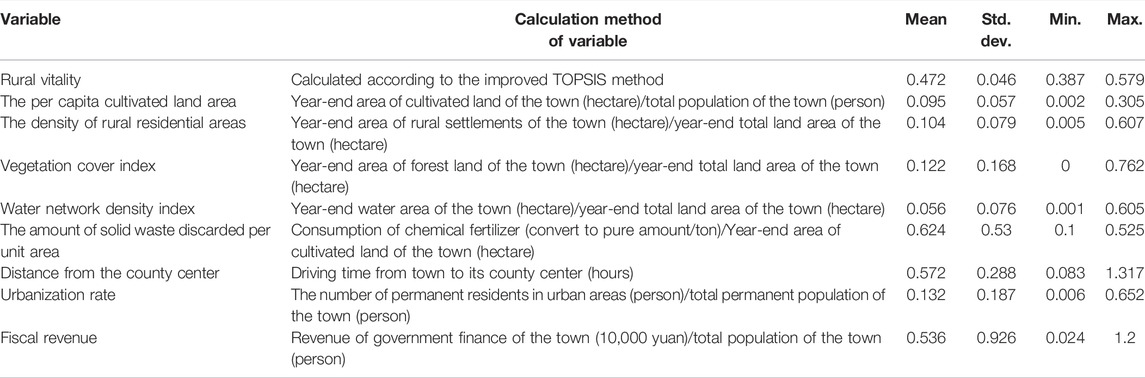
TABLE 2. Variable definition and descriptive statistics.
4 Results
4.1. Rural Vitality Status
To sum up, we have calculated measurement results of rural comprehensive vitality, industry vitality, facility vitality, and population vitality of 106 rural revitalization model towns in Shandong province from 2012 to 2019 (Figure 7; Table 3). The rural comprehensive vitality value showed a fluctuating upward trend during the study period. The average values in 2012 and 2019 were 0.4200 and 0.5245, respectively, and the average growth rate was 3.23%. According to the data of all dimensions, the average growth rate of industrial vitality was the highest, with a value of 3.97%, indicating that development of rural industries has made the greatest contribution to rural vitality because rural areas are mainly based on production functions. In 2019, 88.68% of rural revitalization model towns in Shandong province had a comprehensive vitality index of more than 0.5, meaning that most towns can give relatively effective play to their resource advantages to achieve improvement of rural vitality. This is because the function of rural areas has changed from a single production function to a multi-functional one such as social security, economic development, and ecological conservation, which makes the relationship of population, industry, and facilities more harmonious. During the study period, the towns located around central cities in Shandong province had a high level of vitality and a rapid growth rate. This gets benefits from radiation and driving effect of a city on the surrounding villages and towns.
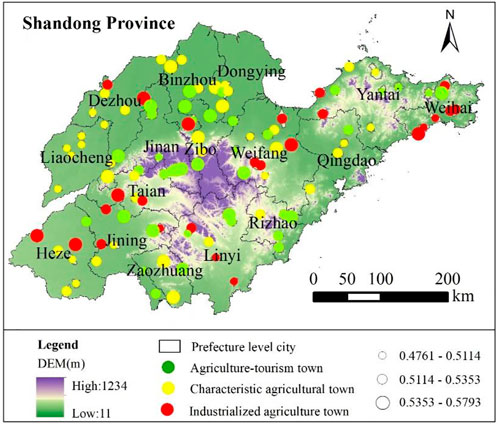
FIGURE 7. Comprehensive vitality value of different village types in 2019.

TABLE 3. Vitality scores of different village types from 2012 to 2019.
The trend of vitality values of various village types was consistent with an overall change trend. From 2012 to 2019, average growth rates of rural comprehensive vitality of industrialized agriculture towns, agriculture-tourism towns, and characteristic agricultural towns were 3.45, 3.31, and 3.01%, respectively. Average growth rate of industrial vitality of agriculture-tourism towns during 2012–2019 was 4.13%, which was higher than the growth rate of its comprehensive vitality. In 2019, its industrial vitality value reached 0.5335, indicating that industrial development is the main factor affecting rural vitality of such towns. From 2012 to 2019, its average growth rate of population vitality value was 2.79%. In 2019, the population vitality value reached 0.5261, slightly lower than its industrial vitality value of 0.5335 in the same year. Its average growth rate of facility vitality in 2012–2019 was 3.04%, and the facility vitality value in 2019 reached 0.5256, which is lower than the growth rate of its comprehensive vitality. Due to insufficient financial expenditure on rural infrastructure construction of the government, the weakness in infrastructure has, to some extent, lowered its vitality level.
Average growth rate of industrial vitality of industrialized agriculture towns during 2012–2019 was 4.14%, which was higher than the growth rate of its comprehensive vitality value. In 2019, its industrial vitality value reached 0.5582. Because, such towns relying on rich agricultural products and labor resources integrate industrial elements into rural industrial development, build an industrial chain of industrial and agricultural integration, and form a good trend of industrial and agricultural interaction to help development of towns. Its average growth rate of population vitality value from 2012 to 2019 was 2.98%. The population vitality in 2019 reached 0.5262, slightly lower than its industrial vitality value of the same year, and performed best among the three types. Benefiting from the development of agricultural product processing industry, farmers have expanded the channels of employment and income increase. Its average growth rate of the facility vitality value from 2012 to 2019 was 3.19%, which is lower than the growth rate of its comprehensive vitality value. In 2019, facility vitality value reached 0.4998, the worst among the three types, indicating that such towns should also increase investment in public infrastructure.
Average growth rate of industrial vitality value of characteristic agricultural towns during 2012–2019 was 3.73%, higher than its growth rate of the comprehensive vitality value. In 2019, the industrial vitality value reached 0.5229, the worst among the three types. This happens because there are still some problems, such as extensive land use and low land output efficiency in characteristic agricultural towns. Its average growth rate of the population vitality value during 2012–2019 was 2.51%, which was the worst in the three types because of the insufficient development of rural industries. Its average growth rate of the facility vitality value during 2012–2019 was 2.83% because most characteristic agricultural towns are located in traditional agricultural areas and have a certain amount of capital accumulation, which helps to complete public supporting facilities.
4.2. Resource and Environment Constraints of Rural Vitality
4.2.1. Basic Results
Through the aforementioned analysis, rural vitality values of 106 rural revitalization model towns in Shandong province in 2012, 2016, and 2019 were estimated. Here, the panel Tobit model was used to analyze resource and environmental constraints of their rural vitality values during the study period.
As is shown in column (1) of Table 4, the impact of the per capita cultivated land area, rural residential density, vegetation coverage index, water network density index, and the amount of solid waste discarded per unit area on rural comprehensive vitality value passed the significance test. The marginal effect of per capita cultivated land area was 0.314, which was significant at the level of 1%, indicating that the richer the per capita cultivated land area, the higher is rural comprehensive vitality value. Because in the areas rich in cultivated land resources in Shandong province, the degree of agricultural development is relatively high. The marginal effect of rural residential density was −0.042, which was significant at the level of 5%, indicating that scattered layout of rural settlements and low degree of intensive utilization limit stimulation of rural vitality. The marginal effect of vegetation cover index was 0.131, which was significant at the level of 10%, indicating that vegetation cover index has a certain positive effect on improvement of rural comprehensive vitality. The marginal effect of water network density index was 0.101, which was significant at the level of 1%, indicating that the more abundant the water resources, the better is the comprehensive vitality of a town. The marginal effect of the amount of solid waste discarded per unit area was 0.196, which indicates that improvement of comprehensive vitality of rural revitalization model towns in Shandong province is at the expense of the environment.
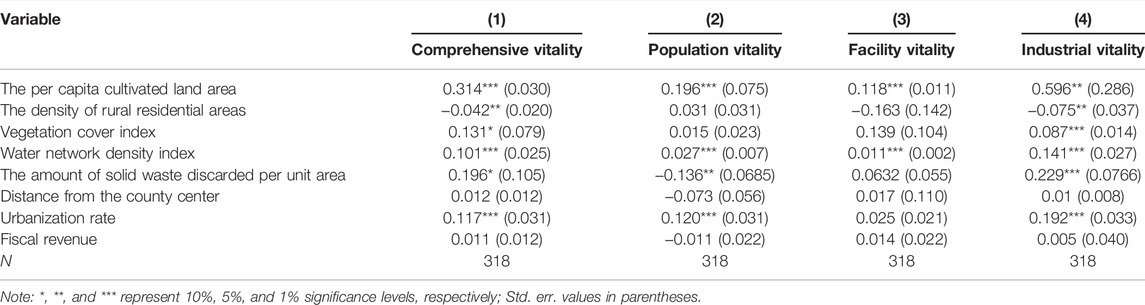
TABLE 4. Resource and environment constraints of rural vitality.
Comparing vitality values of different dimensions, the per capita cultivated land area and water network density index promoted population vitality, industrial vitality, and facility vitality and had a greater impact on industrial vitality. Promotion of facility vitality and industrial vitality was at the expense of environment while population vitality was not. Rural settlements density only had a negative effect on improvement of industrial vitality, with a marginal effect of −0.075, and had no significant impact on population vitality and facility vitality. Vegetation cover index only positively affected industrial vitality, with a marginal effect of 0.087, and had no significant impact on population vitality and facility vitality.
As for control variables, the impact of urbanization rate on rural comprehensive vitality value passed the significance test, and the marginal effect of urbanization rate was 0.117, indicating that urbanization positively impacts rural comprehensive vitality. Moreover, the urbanization rate had an increasing effect on vitality of three dimensions, but only had a significant positive effect on vitalities of population and industry.
4.2.2. Robustness Check
4.2.2.1 Add Control Variable
Previous studies have shown that cities have a radiating and driving effect on rural areas, and central cities with high levels of economic development and urbanization can better support rural development (Chen et al., 2018). Therefore, we added the per capita GDP index (10,000 yuan/person) as the control variable, which is the ratio of GDP (10,000 yuan) to total population of the town (person). The results in column (1) of Table 5 showed that after adding control variables, the estimated results of core explanatory variables did not change in the direction of influence compared with benchmark regression results, but only changed in the significance level, which verifies the robustness of benchmark regression results.
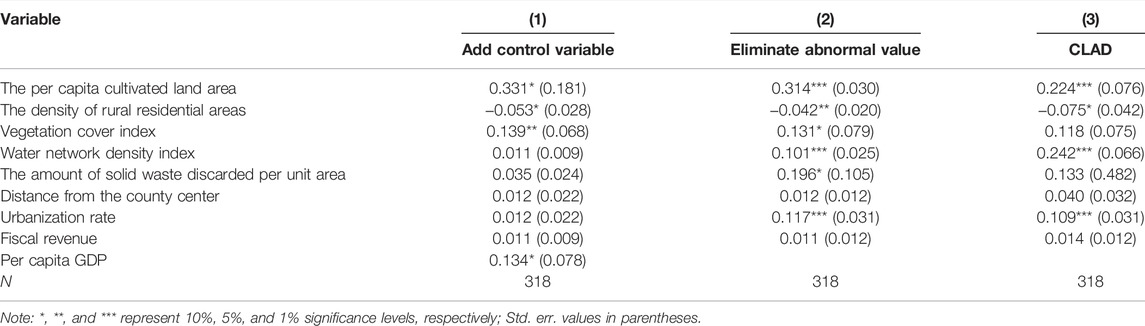
TABLE 5. Estimation results of robustness analysis.
4.2.2.2 Eliminate Abnormal Values
In order to eliminate interference of a small number of outliers caused by special areas, it is necessary to deal with outliers through bilateral tailing. Comprehensive vitality index of rural areas was treated by bilateral tailing at the 1% quantile. It was not difficult to find from column (2) of Table 5 that symbol of the coefficient of core explanatory variables had not changed and all passed the significance test, which showed that after bilateral tailing treatment of 1% quantile of rural comprehensive vitality index, the effect of core explanatory variables on rural comprehensive vitality index should still be consistent with benchmark regression.
4.2.2.3 Transform Estimation Method
The Tobit model is highly dependent on the distribution of disturbance terms. If the disturbance terms do not obey the normal distribution or have heteroscedasticity, the estimation results will be biased. In view of this, we used the more robust merged least absolute deviations (censored least absolute deviations, CLAD) method for semi-parameter estimation, and the results are shown in column (3) of Table 5. Compared with benchmark regression results, the estimated results of core explanatory variables did not change in the direction of influence, but only changed in the significance level. It can be seen that estimated results using the CLAD method were basically consistent with benchmark regression results.
4.2.3 Heterogeneity Analysis: the Impact of Industrial Convergence Development
The impact of resource and environment constraints on rural comprehensive vitality index depends on efficiency of resource and environment utilization. Towns with agriculture as the leading industry have the following characteristics: low productivity level, extensive production mode, and poor ecological environment quality. Resource and environmental constraints have certain restrictions on stimulating rural vitality. With the gradual integration of agriculture and the secondary and tertiary industries, the level of intensive and economical utilization of rural land resources and water resources has increased, habitat environment has gradually improved, and resource and environmental constraints have gradually weakened, contributing to the improvement of rural vitality.
In order to test the aforementioned conjecture, we classified characteristic agricultural towns as the non-industrial integration type and industrialized agriculture towns and agriculture-tourism towns as the industrial integration type and carried on the regression test again. Table 6 shows the results, while rural vitality of industrial integration towns improved, the amount of solid waste discarded per unit area decreased, but non-industrial integration towns did not achieve such a result, indicating that the task of ecological protection in characteristic agricultural towns is more arduous. Rural settlements density strengthened the constraints on industrial integration towns but weakened the constraints on non-industrial integration towns. The per capita cultivated land area, vegetation cover index, and water network density index all positively affected the vitality of each type, but industrial integration towns were more affected by the per capita cultivated land area and vegetation cover index, and non-industrial integration towns were more affected by water network density index.
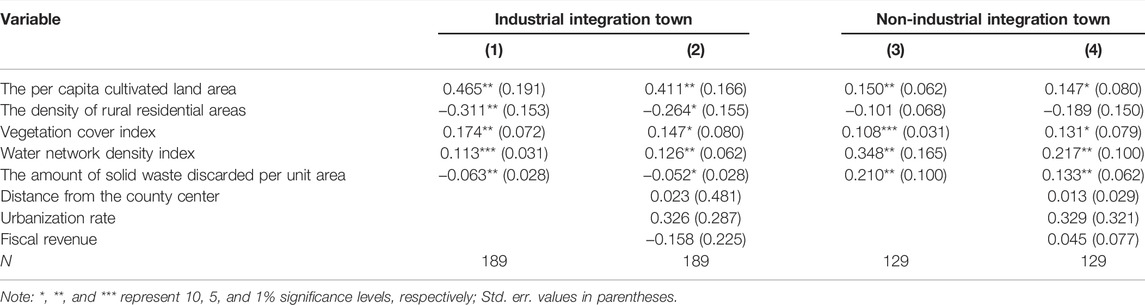
TABLE 6. Results of heterogeneity analysis.
5 Conclusion and Recommendations
5.1 Conclusion
Based on symbiosis theory, we have creatively put forward the “population–facility–industry” theoretical framework of rural vitality, constructed rural vitality index system, selected 106 rural revitalization model towns from Shandong province as research samples, empirically tested rural vitality of 106 rural revitalization model towns by using an improved TOPSIS method, and measured resource and environmental constraints of rural vitality by using the panel Tobit model.
Overall, during the study period, the comprehensive vitality value of 106 rural revitalization model towns in Shandong province showed a fluctuating upward trend, with an average growth rate of 3.23%. Industrial vitality had the fastest growth rate, with an average growth rate of 3.97%, indicating that rural industries have the greatest contribution to promotion of rural vitality. In 2019, 88.68% of the towns’ comprehensive vitality values were above 0.5, indicating that the overall vitality level of rural revitalization towns in Shandong province was high, especially towns around central cities benefitting from the radiation and driving effect of cities.
Average growth rates of comprehensive vitality of industrialized agriculture towns, agriculture-tourism towns, and characteristic agricultural towns during the study period were 3.45, 3.31, and 3.01%, respectively. From 2012 to 2019, average growth rates of industrial vitality of industrialized agriculture towns, agriculture-tourism towns, and characteristic agricultural towns were 4.14, 4.13, and 3.73%, respectively, which were higher than average growth rates of their respective comprehensive vitality indexes, indicating industrial development is also the main factor affecting rural vitality of different village types. From 2012 to 2019, average growth rates of population vitality of industrialized agriculture towns, agriculture-tourism towns, and characteristic agricultural towns were 2.98, 2.79, and 2.51%, respectively, which were lower than average growth rates of their respective comprehensive vitality indexes, indicating that improvement of rural vitality do not bring about a rapid increase in farmers’ income, reflecting current situation of insufficient development of rural towns in Shandong province. The public infrastructure of various types of towns had different degrees of disadvantages. Taking data of 2019 as an example, facility vitality of industrialized agriculture towns, agriculture-tourism towns, and characteristic agricultural towns were 0.4998, 0.5256, and 0.5161, respectively, which were lower than their respective comprehensive vitality index values, lowering rural vitality level to a certain extent. It is necessary to increase investment in infrastructure construction in towns to ensure the infrastructure guarantee for internal dynamic development of rural areas.
Benchmark regression results showed that the per capita cultivated land area and water network density positively impacted comprehensive vitality and population vitality, facility vitality, and industry vitality. The result was related to rich cultivated land resources and water resources and the high level of economical and intensive utilization; rural settlements density negatively impacted comprehensive vitality and industrial vitality, indicating that rural settlements have problems such as hollow population and single land use function. It is necessary to integrate rural settlements and improve the mixed utilization of rural residential land; improvement of vegetation cover index promoted comprehensive vitality and industrial vitality, indicating that vegetation cover has played a positive role in the development of rural industries. To a large extent, the promotion of vitality level of rural revitalization model towns in Shandong province was at the expense of the environment, and there is an urgent need to walk out of the old road of “pollution before treatment.” As for control variables, urbanization positively impacted comprehensive vitality, population vitality, and industry vitality. We should further play the role of urbanization in promoting rural vitality.
Heterogeneity analysis showed that the per capita cultivated land area played a greater role in promoting rural vitality of industrial integration towns than that of non-industrial integration towns because high level of economical and intensive utilization of cultivated land resources in industrial integration towns will have a strong role in promoting rural industrial development. Rural settlement density negatively impacted industrial integration towns but had no significant impact on non-industrial integration towns, indicating that industrial integration towns are more constrained by rural settlement density. Vegetation cover index had a greater positive impact on the vitality level of industrial integrated towns but a smaller impact on non-industrial integrated towns. Forest resources provide a good ecological environment and production factors for rural secondary and tertiary industries. Water network density index played a greater role in promoting rural vitality of non-industrial integration towns than that of industrial integration towns. Water demand of characteristic agricultural towns is large, and the change of water resources significantly affects their agricultural development. Improvement of vitality of non-industrial integration towns had brought about environmental problems to varying degrees. However, while industrial integration towns improved vitality of towns, the amount of solid waste discarded per unit area decreased.
5.2 Recommendations
According to the previous research conclusions, the following suggestions are put forward.
Further promote comprehensive utilization of rural residential land. The research showed that the density of rural residential areas had a negative impact on comprehensive vitality and industrial vitality. Therefore, we should take rural revitalization as strategic goal and village planning as means to guide the mixed layout of rural residential land, promoting rural residential land from single to diverse, from diverse to complex, and making rural residential land become a multi-functional complex integrating residence, industry, commercial services, and tourism reception. Accelerate adjustment of land use structure of rural residential areas, reduce the proportion of residential areas, increase the proportion of industrial land and public service land, provide space for industrial development and public infrastructure construction, improve compatibility of adjacent plots, and attract capital, industry, population, and other factors. This can stimulate land factors to promote industrial upgrading, promote diversification and interaction of rural resource factors, and realize a virtuous circle of various factors, so as to enhance vitality and attractiveness of rural areas.
Further strengthen the concept of ecological priority and green development. The research conclusion showed that the promotion of vitality level of rural revitalization model towns in Shandong province was at the expense of the environment. Therefore, we should further improve green development in rural areas, promote green production in agriculture, green living of farmers, and rural ecological environment protection. Reduce the use of chemical fertilizers and pesticides and promote organic fertilizers and biological pesticides; realize resource utilization of agricultural wastes, such as realizing straw resource utilization and waste plastic film and packaging waste recycling; improve quality and safety level of agricultural products, and the proportion of brand agricultural products. Promote the rural living environment, with the treatment of rural garbage, sewage and toilets as the main content, it is recommended to establish a system for the collection, transportation, and disposal of rural domestic garbage, promote local classification and resource utilization of rural garbage, extend coverage of urban sewage pipe network to surrounding villages, achieve sewage treatment and resource utilization, and popularize sanitary toilets in rural areas.
Rural development should take the road of urban–rural integration. The empirical test results showed that the increase of urbanization rate promoted rural vitality. Therefore, it is suggested to promote two-way flow of urban–rural spatial elements and cultivate symbiotic mechanism of endogenous driving force of rural development through complementing regional resource advantages. In the connection and interaction between urban and rural areas, we should clarify prominent position of villages in social and economic construction and their equal position in urban–rural relations, fundamentally change the development path of unifying agriculture by industry, unifying villages by cities, and reducing farmers in rural areas by expanding cities, promote mutual integration and common development of urban and rural areas in planning layout, industrial development, public services, ecological protection, etc., and gradually narrow development gap between urban and rural areas. The establishment of a good interactive relationship between urban and rural areas can further promote rural development and enable rural areas to produce economic and social values synchronized with cities.
Continue to promote integrated development of rural industries. Based on the aforementioned analysis, we understand that rural industrial integration is conducive to promoting rural vitality. Therefore, it is advised to further innovate development mode of rural industrial integration and improve the rural industrial integration level. Encourage new agricultural management organizations to carry out integrated development of rural industries in various forms and promote integrated process of “production, processing, storage, transportation, and sales” of advantageous and characteristic agricultural products, so as to promote natural extension of the primary industry to the secondary and tertiary industries; use agricultural production and operation activities, rural natural ecological environment and rural unique local culture to attract tourists, develop rural ecological sightseeing tourism and leisure experience agriculture, fully exploit potentialities of agricultural natural resources, and expand agricultural functions, so as to promote integration of the primary industry to the tertiary industries.
Data Availability Statement
The datasets presented in this article are not readily available because the data that support the findings of this study are available from Statistical Yearbooks and local market survey, but restrictions apply to the availability of these data, which were used under supervision. Requests to access the datasets should be directed to emhpaGVuZ3lhbmdAMTYzLmNvbQ==.
Author Contributions
ZY: conceptualization, formal analysis, methodology, and writing original draft. TL: validation and writing—original draft. NS: investigation, validation, and writing—original draft. MG: conceptualization, data collection and collation, and formal analysis. YZ: investigation, validation, data collection and collation, and formal analysis. HJ: investigation, validation, data collection and collation, and formal analysis.
Funding
This research was supported by the National Natural Science Fund Youth Project of China (41501606), Natural Science Fund General Project of Shandong (ZR2020MD012), Key research and development (R&D) plan of Shandong (Soft Science Project) (2021RZB06026); and Shandong Provincial Institutions of Higher Learning “Youth Innovation Team Development Plan” Project (2019RWG016).
Conflict of Interest
The authors declare that the research was conducted in the absence of any commercial or financial relationships that could be construed as a potential conflict of interest.
Publisher’s Note
All claims expressed in this article are solely those of the authors and do not necessarily represent those of their affiliated organizations, or those of the publisher, the editors, and the reviewers. Any product that may be evaluated in this article, or claim that may be made by its manufacturer, is not guaranteed or endorsed by the publisher.
Acknowledgments
The authors would like to thank valuable comments and suggestions from editors and reviewers.
References
Ball, V. E., Fare, R., Grosskopf, S., and Nehring, R. (2001). Productivity of the US Agricultural Sector: The Case of Undesirable Outputs. Cambridge, Mass: The National Bureau of Economic Research. doi:10.7208/9780226360645
Barbier, E. B., and Burgess, J. C. (2020). Sustainability and Development after COVID-19. World Dev. 135, 105082. doi:10.1016/j.worlddev.2020.105082
Cao, Y., Zhang, X., and He, L. (2020). Collective Action in Maintaining Rural Infrastructures: Cadre-Farmer Relationship, Institution Rules and Their Interaction Terms. Land Use Policy 99, 105043. doi:10.1016/j.landusepol.2020.105043
Carr, P. J., and Kefalas, M. J. (2009). Hollowing Out the Middle: The Rural Brain Drain and What it Means for America. Boston: Beacon Press.
Chambers, R., and Conway, G. R. (1992). Sustainable Rural Livelihoods: Practical Concepts for the 21st Century. Brighton, UK: The Institute of Development Studies. IDS Discussion Paper No. 296.
Chen, C., LeGates, R., Zhao, M., and Fang, C. (2018). The Changing Rural-Urban Divide in China's Megacities. Cities 81, 81–90. doi:10.1016/j.cities.2018.03.017
Cheng, J. (2019). Source of Urban Vitality: Systematic Effects of Migrant Population on the Development of Urban Economy. Chn. J. Urb. Environ. Stud. 07 (2), 1950005. doi:10.1142/S2345748119500052
Cheng, M., Yansui Liu, Y., and Zhou, Y. (2019). Measuring the Symbiotic Development of Rural Housing and Industry: A Case Study of Fuping County in the Taihang Mountains in China. Land Use Policy 82, 307–316. doi:10.1016/j.landusepol.2018.12.013
Deng, J., Ni, H., Zhang, Z., Usman, S., Yang, X., Shen, Y., et al. (2020). Designing Productive, Energy-Efficient, and Environmentally Friendly Production Systems by Replacing Fallow Period with Annual Forage Cultivation on the Loess Plateau of China. J. Clean. Prod. 320, 128660. doi:10.1016/j.jclepro.2021.128660
Diaz-Sarachaga, J. M. (2020). Combining Participatory Processes and Sustainable Development Goals to Revitalize a Rural Area in Cantabria (Spain). Land 9 (11), 412. doi:10.3390/land9110412
Dzanku, F. M. (2015). Transient Rural Livelihoods and Poverty in Ghana. J. Rural Stud. 40, 102–110. doi:10.1016/j.jrurstud.2015.06.009
Gan, T., and Li, B. (2021). Analysis of Agricultural Water Use Efficiency and Cost under Resource and Environment Constraints. J. South-Central Univ. Natl. Nat. Sci. Ed. 40 (5), 530–536. doi:10.12130/znmdzk.20210512
Lampic, B., and Potocnik-Slavic, I. (2007). Demographic Vitality and Human Resources as Important Factors for Rural Areas Development. B Serbian Geogr. 87 (2), 103–114. doi:10.2298/GSGD0702103L
Lan, F., Gong, X., Da, H., and Wen, H. (2020). How Do Population Inflow and Social Infrastructure Affect Urban Vitality? Evidence from 35 Large- and Medium-Sized Cities in China. Cities 100, 102454. doi:10.1016/j.cities.2019.102454
Li, C., Jiao, Y., Sun, T., and Liu, A. (2021). Alleviating Multi-Dimensional Poverty through Land Transfer: Evidence from Poverty-Stricken Villages in China. China Econ. Rev. 69, 101670. doi:10.1016/j.chieco.2021.101670
Li, G. (2014). The Green Productivity Revolution of Agriculture in China from 1978 to 2008. China Econ. Q. 13 (2), 537–558. doi:10.13821/j.cnki.ceq.2014.02.011
Li, Y., Fan, P., and Liu, Y. (2019). What Makes Better Village Development in Traditional Agricultural Areas of China? Evidence from Long-Term Observation of Typical Villages. Habitat Int. 106, 111–124. doi:10.1016/j.habitatint.2018.11.006
Li, Y., Qiao, L., Wang, Q., and Karácsonyi, D. (2020). Towards the Evaluation of Rural Livability in China: Theoretical Framework and Empirical Case Study. Habitat Int. 105, 102241. doi:10.1016/j.habitatint.2020.102241
Lin, Y., Shui, W., Li, Z., Huang, S., Wu, K., Sun, X., et al. (2021). Green Space Optimization for Rural Vitality: Insights for Planning and Policy. Land Use Policy 108 (8), 105545. doi:10.1016/j.landusepol.2021.105545
Liu, S., Ge, J., Bai, M., Yao, M., He, L., and Chen, M. (2022). Toward Classification-Based Sustainable Revitalization: Assessing the Vitality of Traditional Villages. Land Use Policy 116, 106060. doi:10.1016/j.landusepol.2022.106060
Liu, Y., and Li, Y. (2017). Revitalize the World's Countryside. Nature 548 (7667), 275–277. doi:10.1038/548275a
Liu, Y., Yang, Y., Li, Y., and Li, J. (2017). Conversion from Rural Settlements and Arable Land under Rapid Urbanization in Beijing during 1985-2010. J. Rural Stud. 51, 141–150. doi:10.1016/j.jrurstud.2017.02.008
Long, H., Zhang, Y., and Tu, S. (2019). Rural Vitalization in China: A Perspective of Land Consolidation. J. Geogr. Sci. 29 (4), 517–530. doi:10.1007/s11442-019-1599-9
Lurie, S., and Brekken, C. A. (2019). The Role of Local Agriculture in the New Natural Resource Economy (NNRE) for Rural Economic Development. Renew. Agric. Food Syst. 34 (5), 395–405. doi:10.1017/S174217051700062X
Makkonen, T., and Kahila, P. (2021). Vitality Policy as a Tool for Rural Development in Peripheral Finland. Growth Change 52 (2), 706–726. doi:10.1111/grow.12364
Mihai, C., Ulman, S.-R., and David, M. (2019). New Assessment of Development Status Among the People Living in Rural Areas: An Alternative Approach for Rural Vitality. Sci. Ann. Econ. Bus. 66 (2), 167–192. doi:10.47743/saeb-2019-0013
Moffit, R., and McDonald, J. F. (1980). The Use of Tobit Analysis. Rev. Econ. Stat. 62 (2), 318–321. doi:10.2307/1924766
Montgomery, J. (1995). Editorial Urban Vitality and the Culture of Cities. Plan. Pract. Res. 10 (2), 101–110. doi:10.1080/02697459550036649
Pearce, C. (2005). Natural Resources and Community Vitality: A Rural Perspective. J. Ecosyst. Manag. 6 (2), 63–69. doi:10.22230/jem.2005v6n2a318
Pinilla, V., and Sáez, L. A. (2021). What Do Public Policies Teach Us about Rural Depopulation: The Case Study of Spain. Eur. Countrys. 13 (2), 330–351. doi:10.2478/euco-2021-0021
Rezek, J. P., and Richard, K. P. (2004). Environmentally Adjusted Agricultural Productivity in the Great Plains. J. Agric. Resour. Econ. 29 (2), 346–369. doi:10.2307/40987224
Robinson, P. S. (2003). Implications of Rural Settlement Patterns for Development: A Historical Case Study in Qaukeni, Eastern Cape, South Africa. Dev. South. Afr. 20 (3), 405–421. doi:10.1080/0376835032000108202
Sarkar, A., Azim, J. A., Asif, A. A., Qian, L., and Peau, A. K. (2021). Structural Equation Modeling for Indicators of Sustainable Agriculture: Prospective of a Developing Country's Agriculture. Land Use Policy 109, 105638. doi:10.1016/j.landusepol.2021.105638
Van Rij, E., and Koomen, E. (2010). Analysing the Rural Vitality Argument for Residential Development: Linking Discourses and Actual Spatial Developments. Tijdschr. Voor Econ. En. Soc. Geogr. 101 (5), 583–595. doi:10.1111/j.1467-9663.2010.00637.x
Vujicic, M., Ristic, L., and Ciric, N. (2013). Local Initiatives for Rural Vitality and Social Inclusion: Some Experiences from Serbia. East. Eur. Countrys. 19 (1), 105–125. doi:10.2478/eec-2013-0006
Woods, M. (2009). Rural Geography: Blurring Boundaries and Making Connections. Prog. Hum. Geogr. 33 (6), 849–858. doi:10.1177/0309132508105001
Xia, C., Yeh, A. G.-O., and Zhang, A. (2020). Analyzing Spatial Relationships between Urban Land Use Intensity and Urban Vitality at Street Block Level: A Case Study of Five Chinese Megacities. Landsc. Urban Plan. 193, 103669. doi:10.1016/j.landurbplan.2019.103669
Yang, Z., Li, C., and Fang, Y. (2020). Driving Factors of the Industrial Land Transfer Price Based on a Geographically Weighted Regression Model: Evidence from a Rural Land System Reform Pilot in China. Land 9 (1), 7–21. doi:10.3390/land9010007
Yang, Z., Shen, N., Qu, Y., and Zhang, B. (2021). Association between Rural Land Use Transition and Urban-Rural Integration Development: From 2009 to 2018 Based on County-Level Data in Shandong Province, China. Land 10 (11), 1228. doi:10.3390/land10111228
Keywords: resource and environment constraints, rural vitality status assessment, promotion strategies, rural revitalization model towns, Shandong, China
Citation: Yang Z, Liu T, Shen N, Guan M, Zheng Y and Jiang H (2022) Resource and Environment Constraints and Promotion Strategies of Rural Vitality: An Empirical Analysis of Rural Revitalization Model Towns. Front. Environ. Sci. 10:956644. doi: 10.3389/fenvs.2022.956644
Received: 30 May 2022; Accepted: 23 June 2022;
Published: 15 July 2022.
Edited by:
Wenqiu Ma, China Agricultural University, ChinaReviewed by:
Chen Lin, Nanjing Institute of Geography and Limnology (CAS), ChinaJin Ping Zhang, Hainan Normal University, China
Xiaopeng Liu, Ningxia University, China
Copyright © 2022 Yang, Liu, Shen, Guan, Zheng and Jiang. This is an open-access article distributed under the terms of the Creative Commons Attribution License (CC BY). The use, distribution or reproduction in other forums is permitted, provided the original author(s) and the copyright owner(s) are credited and that the original publication in this journal is cited, in accordance with accepted academic practice. No use, distribution or reproduction is permitted which does not comply with these terms.
*Correspondence: Mei Guan, Mjk1MjE0NjJAcXEuY29t