 Lijuan Zhang
 Yuzhu Yu
 Yongheng Chen
94% of researchers rate our articles as excellent or good
Learn more about the work of our research integrity team to safeguard the quality of each article we publish.
Find out more
ORIGINAL RESEARCH article
Front. Environ. Sci., 07 July 2022
Sec. Land Use Dynamics
Volume 10 - 2022 | https://doi.org/10.3389/fenvs.2022.955982
This article is part of the Research TopicTowards Greener Urbanization: Resource Environmental Effects and Sustainable Land UseView all 16 articles
With the acceleration of urbanization, the urban land area of different spatial scales in China continues to increase, the urban land use efficiency is relatively low, and there are great regional differences. Land is an important material carrier for human production, life, and socio-economic activities. Reasonable measurement of the green utilization efficiency of urban land (Glande) has important theoretical and practical significance for the realization of urban land green use and the formulation of related policies. In this context, based on the publicly available data of 282 China’s cities at prefecture-level and above from 2009 to 2019, this study measures Glande with the Super-SBM data envelopment analysis model. After analyzing the spatio-temporal evolution characteristics of Glande, we employ the spatial dynamic Durbin model to analyze the spatial spillover effects. The results showed that: 1) Glande in China shows a fluctuating and rising trend, but it has not reached the effective state; 2) the agglomeration characteristics of urban land green use efficiency are significant, and from a regional point of view, it shows the pattern of western > eastern > central; 3) Glande is the result of the interaction of many factors. In the future, measures should be taken according to urban policies and local conditions, and differential measures should be taken to improve Glande.
China is vigorously promoting the new strategy of changing the mode of economic development, and has put forward five development visions of “innovative, coordinated, green, open and inclusive”. The goal of green development is to combine economic, social, and ecological development to create a society that is “resource-conserving” and “environment friendly”. Land is an important material carrier for human production, life and social and economic activities. The green development concept of harmonious coexistence and sustainable development between man and nature should run through in the process of land use. To achieve the unity of economic, social and ecological benefits of land use, this process can be defined as green utilization of urban land. Glande is the key to properly solve various production structural contradictions, to achieve the goal of carbon peak and carbon neutralization vision, and to promote sustainable economic and social development. Therefore, the research on Glande has important practical significance to reduce the eco-environmental risk in the development and utilization of urban land and realize the unity of economic, social and ecological benefits.
Since the reform and opening-up, China’s urbanization level has increased significantly. In 1987, the urbanization rate was only 17.90%, but reached 58.52% in 2017, with an average annual growth rate of 1.04% far exceeding the world average in the same period (Wang et al., 2019). By 2020, China’s urbanization rate has reached 63.89%, and the area of urban built-up area has increased to 61,000 km2.1 However, in the face of the high concentration of population and the limited supply of land, the gradual extension of urban boundaries shows the crux of the mismatch between land utilization efficiency and the speed of urbanization, and the improvement of the ecological environment lags behind urban development. Improving the Glande is one of the primary tasks of developing countries. In this context, improving the utilization efficiency of urban land has become the internal requirement to promote sustainable regional construction and the development of national environmental civilization (Wang et al., 2019).
The utilization efficiency of urban land is to maximize the degree of land use focusing on achieving the optimization of economic output, while Glande emphasizes the coupling of “economic-social-ecological” systems, that is, under the given conditions of productive technology, through the minimum unit of input to obtain higher economic benefits, social well-being and reduce the “non-expected” output at the same time. Glande is the land utilization efficiency considering pollution factors (Aiping Wang et al., 2021). Glande is different from the economic utilization efficiency of urban land and the environmental utilization efficiency of urban land, which is mainly reflected in the goal of urban land use. Under the given production technical conditions and the level of input factors, the economic efficiency of urban land use mainly focuses on economic output and takes income maximization as the goal of land use. The environmental utilization efficiency of urban land considers both “desirable” output (such as economic income) and “undesirable” output (such as environmental pollution and ecological destruction). Its goal is to maximize economic benefits and minimize environmental pollution. On the other hand, Glande takes economic income and social dimension output as “desirable” output, and environmental pollution as “undesirable” output. Its goal is to maximize economic benefits and social dimensional output (such as social services) and minimize environmental pollution. Meanwhile, there is also a certain relationship between the three. The environmental utilization efficiency of urban land adds the restriction of “environmental factors” on the basis of the economic efficiency of urban land use, which is the result of the progress and development of the ecological environment. The green efficiency of urban land use is the addition of the “social output factor” on the basis of the environmental efficiency of urban land use, which is the result of progress in social development. The relationship among the three is mainly reflected in the continuous expansion and enrichment of the research content, from the economic field to the ecological environment field and then to the social development field1.
At present, Glande has been widely concerned in the academic circles. The existing researches mainly focus on the measure of Glande, spatio-temporal characteristics, and driving factors. The first is the measurement and evaluation of land utilization efficiency (Hanif, 2018; Peng et al., 2018; Zhu et al., 2019a). Scholars have carried out a series of optimization on the measurement of urban land use efficiency (Du et al., 2016; Martinho, 2017; Xie et al., 2018). First, the evaluation has evolved from single- to multi-index methods that consider economic, social, environmental, and political factors (Guastella et al., 2017; Ferreira and Feres, 2020; Jin et al., 2018; Jing et al., 2017; Zhou and Tan, 2017). Conventional land utilization efficiency only considers a single indicator, such as land-use density or yield per unit of land (Hui et al., 2015; Desiere and Jolliffe, 2018; Wang et al., 2018; Chen et al., 2019), which does not fully reflect the relationship between multiple inputs and outputs in the process of urban land utilization in terms of efficiency. Second, data envelopment analysis (DEA) is gradually becoming a mainstream method for measuring urban land utilization efficiency. It can apply an optimized method to determine the weights of various inputs, avoid human subjectivity, and effectively evaluate efficiency values more objectively. For example, Xin et al. (2020) and Yang et al. (2010) used conventional DEA methods that did not consider undesirable outputs to measure urban land efficiency from different scales. Third, apart from the economic output, add environmental output such as SO2 emissions, wastewater emissions, and solid waste as the undesirable output of land use into the efficiency calculation (Hanif, 2018; Peng et al., 2018; Zhu et al., 2019b). The slacks-based measure (SBM) undesirable model has improved on the conventional DEA model to account for the undesirable output of land use, thus becoming the mainstream measurement method for land utilization efficiency. For example, Yang et al. (2015), Tao et al. (2016), and Yu et al. (2019) each applied this research approach to measure and study Glande at different scales. Henceforth, the Super-SBM model based on undesirable outputs is applied to resolve the issue that the efficiency value of the effective decision-making unit cannot be broken down, resulting in the loss of effective decision-making information in practical application (Zhu et al., 2019a; Lu et al., 2020; Peng Wang et al., 2021). What’s more, Huang et al. (2014) proposed an SBM model considering global reference and solved the problem that the efficiency could not be compared across time.
In terms of driving factors, scholars believe that there are great differences in the influence of economic development level (Chen et al., 2019), the degree of market openness (Chen et al., 2017; Huang et al., 2017), the level of R&D (Xie et al., 2019; Yan et al., 2020), and the level of public infrastructure (Osman et al., 2016; Sun et al., 2020) on land use efficiency in different cities (Fan et al., 2018). However, most of the existing studies focus on the driving factors of land use efficiency, there are few studies focused on the impacts on Glande (Aiping Wang et al., 2021). Researchers generally hold that the development of green land utilization efficiency also has spatial features. A large number of studies are based on the geographical effect of regional green total factor productivity. There is spatial autocorrelation in the distribution of Glande, and there is a spatial agglomeration effect between ecological efficiency and provincial financial development (Sun and Sun, 2019). Ren et al. have faith in that overall Glande in China is still not at a high level, with great variance among different areas (Ren et al., 2020). The spatial econometric model is used to analyze the impact of globalization, marketization, and decentralization on Glande, and it is found that there is a certain degree of convergence of “spatial club” in Glande.
Since the 1990s, Chinese local governments have made use of the unique arrangements of the land system to dominate economic development. However, with the transformation of the stage of China’s economic development and the continuous accumulation of many potential problems in the model of “Land Driving Development”, the effectiveness of land to promote development is declining and unsustainable. China urgently needs to shift from extensive economic growth to intensive economic growth. The mode of intensive economic growth depends on the optimal combination of production factors, through improving the quality and efficiency of production factors, technological progress, improving the quality of workers, and improving the utilization rate of funds, equipment, and raw materials. China is the largest developing country in the world. China’s practice of improving the Glande can provide a rich experience for developing countries and provide reference to improve ecological benefits while economic development.
Based on the review of the existing literature, we find that there may be the following research gaps: first, to focus on Glande, rather than utilization efficiency of urban land or ecological utilization efficiency of urban land, or economic utilization efficiency of urban land; Second, taking China as the research object and cities as the observation, to study the current situation and development direction of Glande in developing countries; Third, to select the most cutting-edge methods to measure the Glande more accurately. Accordingly, this paper uses panel data of 282 cities in China from 2009 to 2019 to construct a land-use efficiency evaluation system from the perspective of urban development with land, capital, and labor as input factors, economic and social output as desired output factors, and environmental pollutants as undesired output factors. This paper uses the Super-SBM model to measure the Glande scores and analyzes the spatio-temporal evolution characteristics. Then, the global reference Malmquist index and decomposition index are calculated. After analyzing the spatio-temporal evolution characteristics of the green land utilization efficiency, we employ the spatial dynamic Durbin model to analyze the spatial spillover effects. The potential contributions of this article are shown as follows: 1) this paper uses the Super-SBM model to accurately measure Glande of 282 cities in China, and reveals the regional characteristics and time-varying characteristics; 2) this paper explores the driving factors affecting Glande; 3) this paper takes the largest developing countries as the research object, and the conclusions provide a reference for developing countries to improve Glande.
China has a land area of about 9.6 million square kilometers, a continental coastline of more than 18,000 km in the east and south, and a water area of more than 4.7 million square kilometers in the inland and border seas. There are more than 7600 large and small islands in the sea area. China is bordered by 14 countries and eight countries at sea. Provincial administrative divisions are divided into 23 provinces, five autonomous regions, four municipalities directly under the Central Government and two special administrative regions. China is the most populous developing country in the world, the third largest in land area, the second largest economy in the world, and continues to be the largest contributor to world economic growth, with a total economic output exceeding 100 trillion yuan in 2020. Specifically, the research object of this paper is 282 prefecture-level cities in China. It is divided according to the standard of economic geographical location, including 100 cities in the eastern region, 99 cities in the central region and 83 cities in the western region. As shown in Figure 1, in terms of the level of economic development, the economic development of Chinese cities shows an upward trend, and the eastern region > the central region > the western region.

FIGURE 1. Trend of economic development by regions.
In this paper, with reference to the more mainstream method, the environmental pollution index is included in the output item as undesired output. As Glande of the research unit may be optimal at the same time, in order to solve the problem of efficiency comparison between effective units under resource constraints and undesired output, this paper further uses the Super-SBM model. The Super-SBM model considering undesired output is as follows:
In the above equation, it is assumed that there are
Referring to Aiping Wang et al. (2021), the input includes capital, labor, and land in this paper. The capital input is measured by the city’s fixed assets investment (10,000 yuan, RMB), and the land input is measured by the city’s urban construction land area (square kilometers). Labor input is measured by the number of employees in the secondary and tertiary industries (10,000). Expected output includes economic, social, and ecological output, in which economic output is measured by the GDP of secondary and tertiary industries (10,000 yuan, RMB), the social output is measured by the average wage of on-duty workers (RMB, yuan), and ecological output is measured by the green coverage rate (%) in the built-up area. Undesired output is environmental pollution, including industrial wastewater emissions (10,000 tons), sulfur dioxide emissions (tons), and industrial soot emissions (tons). Details of the input-output index are shown in Table 1.
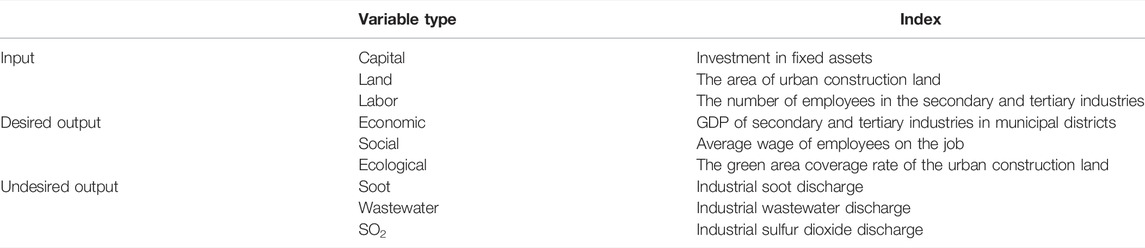
TABLE 1. Input-output index table.
In order to study the panel data of observations at multiple time points in order to analyze the effects of technical efficiency and technological progress on productivity changes respectively, the total factor productivity (TFP) index is usually used for further analysis. In order to avoid the rough front surface constructed because of less DMU and the problem that the VRS model may have no feasible solution, the global reference Malmquist model (Global Malmquist) is selected for analysis in this paper, which can effectively avoid the defect of linear programming without solution and the phenomenon of “technology regression” and which also has transitivity proposed by Pastor and Lovell (Oh, 2010).
First, we construct the common reference set of each period, as shown in the following equation.
where
The Moran’s I test is a spatial autocorrelation measure developed by Patrick Alfred Pierce Moran (Moran, 1950; Li et al., 2007), as shown in the following equation.
Global Moran’s I:
Local Moran’s I:
In this paper, referring to the practice of LeSage and Pace (2009), the spatial lag terms of driving factors and dependent variables are included in the static Durbin model. Compared with the static Durbin model, the dynamic Durbin model not only considers the dynamic effect and spatial spillover effect, but also alleviates the endogenous problem of “reciprocal causation” (Elhorst, 2014). Therefore, the first-order lag term of
Following prior studies with Glande as the dependent variable (Aiping Wang et al., 2021; Yan et al., 2020; Xie et al., 2019), we select the level of economic development, the upgrading of industrial structure, the endowment of ecological resources, the level of infrastructure, the investment in science and education, financial deepening and financial gap as the possible driving factors of Glande. The reasons are as follows. Cities with a higher level of economic development will have more power to improve social and environmental benefits, so the level of economic development may have a positive impact. The process of industrial structure transformation and upgrading is usually accompanied by the reduction of agricultural land and the increase of secondary and tertiary industrial land represented by the industry and service industry. Therefore, land prices continue to rise. For enterprises, the high cost of land will raise the entry threshold, guide the entry of high-efficiency enterprises, and exit inefficient enterprises, to improve the efficiency of land. Since the high value-added industry has both talent and technological advantages and has high output efficiency. The upgrading of the industrial structure guides the government’s financial investment in the education, medical, and other public service departments, reduces repeated construction, and improves the value of land output, which is conducive to the improvement of land-use efficiency. As Glande is based on environmental benefits, urban ecological resource endowment, as its ecological basis, may have an impact. Infrastructure involves a wide range of areas, in which convenient traffic conditions not only make the relationship between cities closer but also make the characteristics of industrial agglomeration, factor flow, technology spillover, and information resource sharing more obvious. The increasing innovation ability is an important driving force to support the improvement of Glande, in which education is an important source of human capital accumulation and an important means to improve the ability of independent innovation. Therefore, investment in science and education may also be one of the important driving factors. Financial deepening means that the government reduces excessive intervention in the financial market and allocates financial resources by adjusting interest rates, exchange rates, and other market means. The development of the financial market will affect the quality of urban investment projects, thus affecting Glande. In the choice of financial strategy, land finance as extra-budgetary revenue is the best choice to make up for the financial gap, adopting the “Land Driving Development” mode of selling commercial and residential land at a high price and industrial land at a low price. Therefore, the larger the financial gap is, the more local governments attach importance to the land-use model, and the greater the expectation of good management and use of land, the higher the efficiency of urban land use. Details are shown in and Table 2
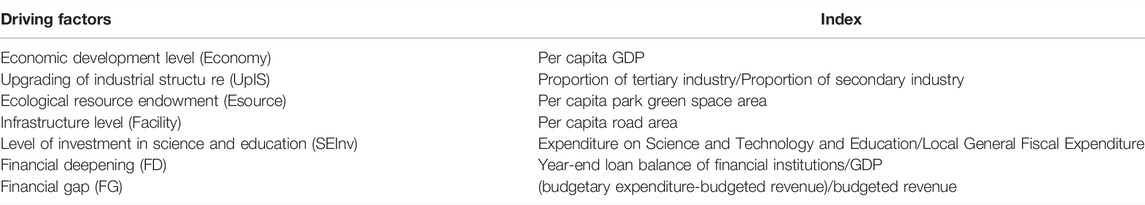
TABLE 2. Driving factors.
The cities with many missing data, such as Sansha City and Danzhou City, are removed, some of the missing values are supplemented by looking up the local statistical yearbooks, and the remaining missing values are processed by linear interpolation. In order to avoid the influence of extreme outliers, the continuous variables involved in the study were shrank-tailed by 1%. The data are from Chinese Research Data Services Platforms (CNRDS).
Details of the input-output index variables are shown in Table 3.
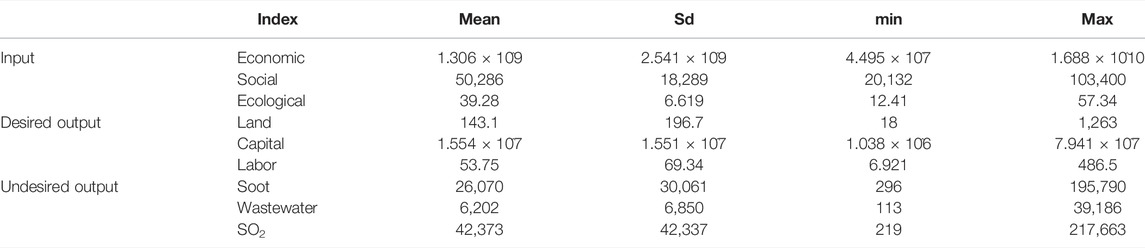
TABLE 3. Descriptive statistics of input-output index (N = 3102).
The DEA model includes two types: variable scale return (VRS) and constant scale return (CRS). The pure technical efficiency is measured when the scale return is variable, and the comprehensive efficiency is measured when the scale return is constant. The comprehensive efficiency can be decomposed into the product of pure technical efficiency and scale efficiency (Liang et al., 2013). For this reason, after measuring the land utilization efficiency under CRS and VRS respectively, this paper divides it into land scale efficiency (Sglande) and land technical efficiency (Tglande). Land scale efficiency refers to the best output obtained by changing the input-output ratio under the fixed technical level. Its economic meaning is the effect of increasing output caused by economies of scale. If land factors flow to low-productivity enterprises, the long-term average total cost will rise with the expansion of land area, resulting in diseconomies of scale and restraining land scale efficiency. Land technical efficiency refers to the best output of a given input under the maximum technical conditions. Its economic meaning is the effect of increasing output caused by technological innovation, excessive deviation from the technological demand-oriented land-use model will crowd out innovative resources, and then restrain the land technical efficiency (Guo and Zhou, 2020). Figure 2 shows the distribution of Glande in China, taking 2009, 2014, and 2019 as examples.
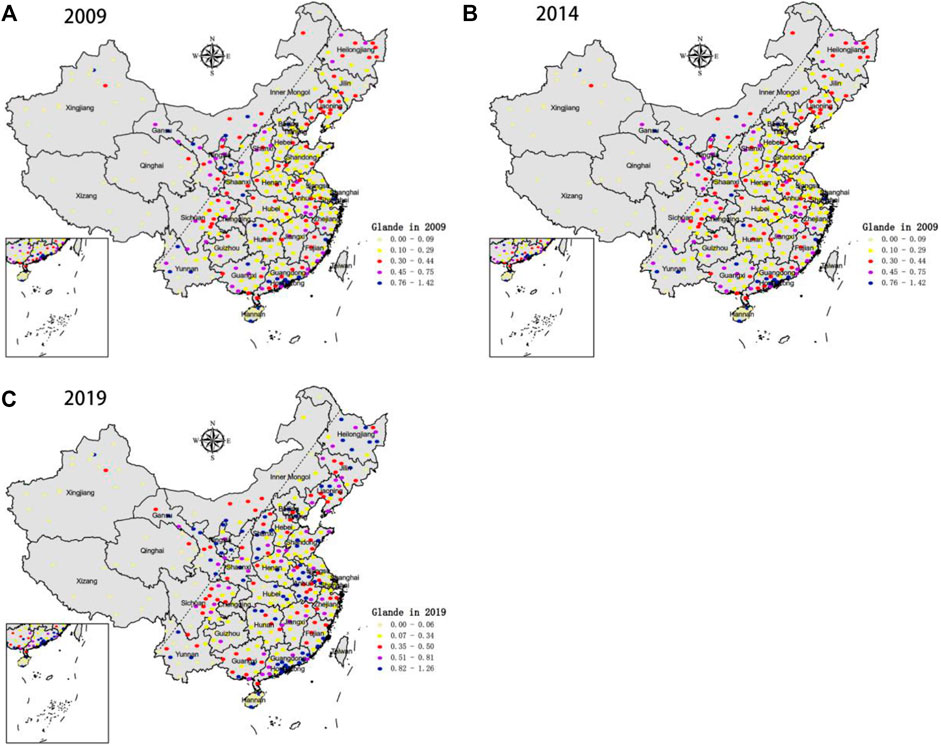
FIGURE 2. Distribution of Glande in China. (A) Distribution of Glande in China in 2009. (B) Distribution of Glande in China in 2014. (C) Distribution of Glande in China in 2019.
Table 4 shows the geometric mean of Glande over the years. As can be seen from Table 4, Glande in China shows a fluctuating upward trend from 2009 to 2019, from 0.381 to 0.559, but it has not yet reached the effective state. The national geometric mean is 0.449, indicating that if the existing output remains unchanged, there is theoretical potential for Glande to be improved by 55.1 percent. Land scale efficiency fluctuates from 2009 to 2019, with an average of 0.522. From 2009 to 2019, the geometric mean of land technical efficiency was 0.906.
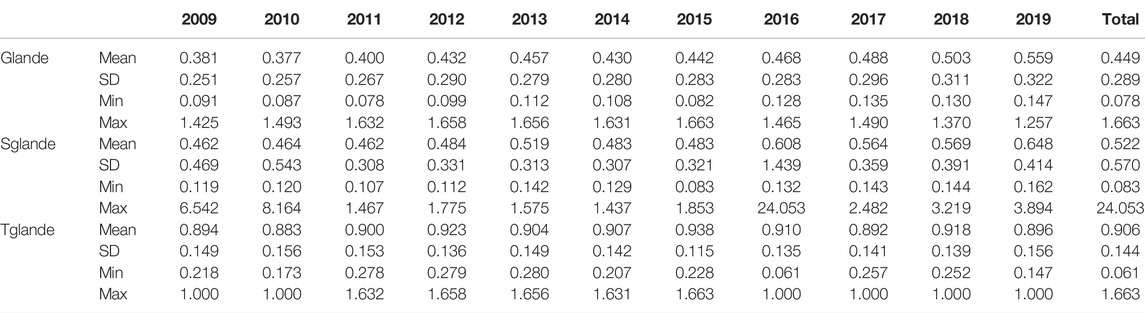
TABLE 4. The geometric mean of Glande over the years.
As can be seen from Figure 3, Glande shows the pattern of western > eastern > central. The geometric mean of Glande in eastern, central, and western regions all reached the maximum in 2019, which were 0.543, 0.571, and 0.563 respectively. The growth rate of Glande in the eastern and central regions is higher than that in the western regions. The above shows that there is spatial heterogeneity in Glande in China. The reason for the higher Glande in cities in western China may be that Glande takes into account the undesired output, that is, environmental pollution. This also suggests that we should change from the absolute level of economic development to the efficiency, from only the efficiency of land utilization efficiency to Glande.
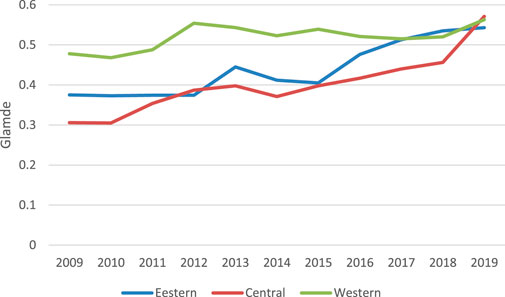
FIGURE 3. The geometric mean of Glande by regions.
We further divide cities according to whether they are innovative cities, low-carbon cities and resource-based cities, and analyze the differences of Glande of different types of cities. Innovative city refers to a city that takes scientific and technological innovation as the core driving force of economic and social development, with rich innovation resources, dynamic innovation subjects, efficient innovation services and government governance, and a good environment for innovation and entrepreneurship. Innovative cities agglomerate and allocate innovative resources, establish an innovation-driven intensive urban economic growth model, and the ultimate goal is to achieve urban economic growth and sustainable development. As can be seen from Table 5, compared with non-innovative cities, the Glande of innovative cities increased significantly, from 0.322 in 2010 to 0.522 in 2019. Low-carbon city refers to the city that keeps energy consumption and carbon dioxide emissions at a low level under the premise of rapid economic development. China announced three batches of national low-carbon pilot lists in 2010, 2012 and 2017, respectively. As can be seen from Table 5, from 2010 to 2014, the average Glande of low-carbon cities was slightly lower than that of non-low-carbon cities, but showed an upward trend, and exceeded that of non-low-carbon cities in 2015. Resource-based city is a type of city (natural land) whose leading industry is the exploitation and processing of minerals, forests and other natural resources in this region. As can be seen from Table 5, from 2010 to 2019, the average Glande of resource-based cities is higher than that of non-resource-based cities.
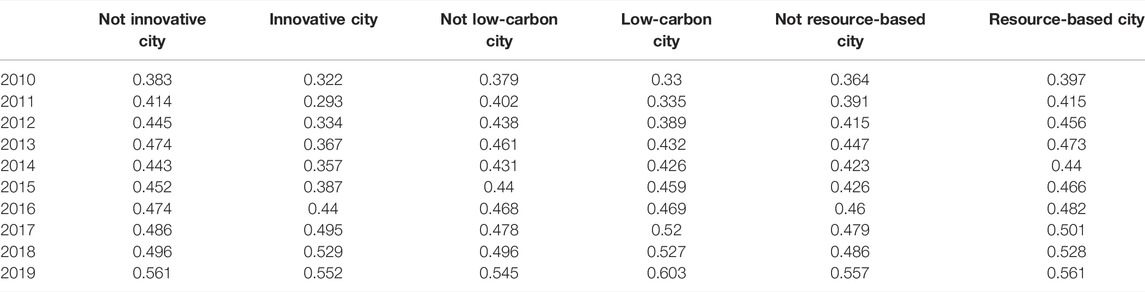
TABLE 5. Glande of different types of cities.
In order to analyze Glande more specifically, analyze the change of the relative position between each city and the production frontier and the change of the production frontier, then calculate the GML of each city from 2009 to 2019. If the GML index is greater than 1, the green total factor productivity shows a growth trend; if the GML is less than 1, the green total factor productivity shows a downward trend; the GML equals one means that the green total factor productivity remains unchanged. At the same time, GML can be decomposed into technology efficiency index (EC) and technology progress index (TC). EC greater than (less than) one represents green technology efficiency rising (decreasing), and TC greater (less than) one represents green technology progress (retrogression). Figure 4 shows the geometric mean of GML for each year in China.
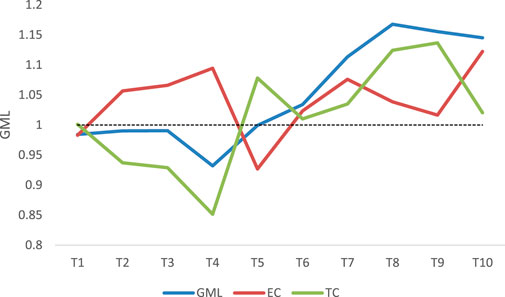
FIGURE 4. The geometric mean of GML in China.
As can be seen in Figure 4, from 2009 to 2010, the geometric mean of GML in China was close to 1, indicating that Glande decreased slightly. From 2012 to 2013, the geometric mean of GML in China was 0.93, and Glande decreased. From 2013 to 2014, Glande remained basically unchanged. From 2014 to 2019, the geometric mean of GML in China is greater than 1, indicating that Glande is on the rise.
Then, the GML index is decomposed into technological progress (TC) and technical efficiency change (EC). TC can be regarded as the displacement of the front surface constructed by the decision-making unit during the inspection period, and EC can be expressed as the position change relative to the front surface. By comparing the values of TC and EC, it can be found that from 2009 to 2014, the contribution to the GML index mainly comes from the improvement of technical efficiency, but from 2014 to 2019, the contribution to the GML index mainly comes from the improvement of technological progress. The inconsistency between EC and TC shows that Chinese cities pay attention to the utilization of technology under the existing resources in the early stage of development and the progress of technology in the later stage.
Table 6 shows the results of Global Moran index of Glande in China. It can be seen from Table 5 that in the 7 years from 2009 to 2012 and from 2016 to 2018, the Moran index of Glande passed the 15% significance test. The Moran index is negative, which indicates that Glande has negative spatial autocorrelation. It is necessary to measure the specific effects of various driving factors on Glande through spatial panels.
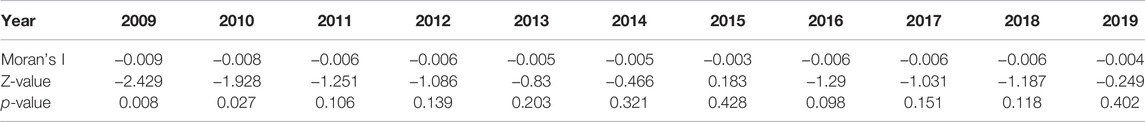
TABLE 6. Results of the global moran’s I test.
Since the Global Moran’s I can not reasonably obtain the spatial correlation of each region, this paper analyzes the spatial characteristics of the local area with a Moran scatter plot. In terms of quadrants, Moran’s I scatter maps generally contain four quadrants: “Low-Low,” “Low-High,” “High-Low,” and “High-High”. L-L indicates that Glande in a certain area and its adjacent areas are relatively low. It shows the characteristics of low concentration and distribution in the region. L-H indicates that Glande in a certain area is low, while the surrounding areas are generally higher, showing the spatial distribution law that the low index area is surrounded by the high index area. H-L corresponds to L-H, indicating the distribution characteristics of the high index area surrounded by the low index area. H-H indicates that Glande in a certain area and its surrounding areas are relatively high, showing a high index of regional agglomeration. Figure 4 is the Moran scatter plot, taking 2009, 2014, and 2019 as examples. According to Figure 5, most cities in Henan, Hebei, Shandong and Jiangsu provinces in China show an L-L layout.
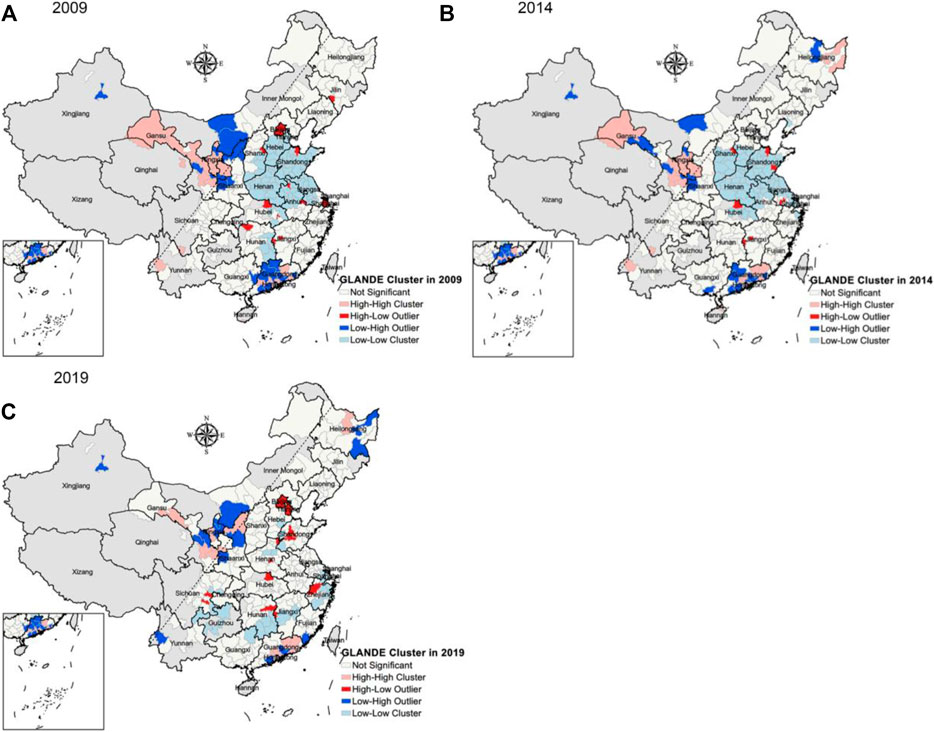
FIGURE 5. The Moran scatter plot of Glande. (A) The Moran scatter plot of Glande in China in 2009. (B) The Moran scatter plot of Glande in China in 2014. (C) The Moran scatter plot of Glande in China in 2019.
We use the spatial dynamic Durbin model and control the individual fixed effect and time fixed effect to analyze the driving factors, and the results are shown in Table 7. The R-square is 0.595 and the log-likelihood is 136.7585, indicating that the model has a high degree of fit and high reliability.
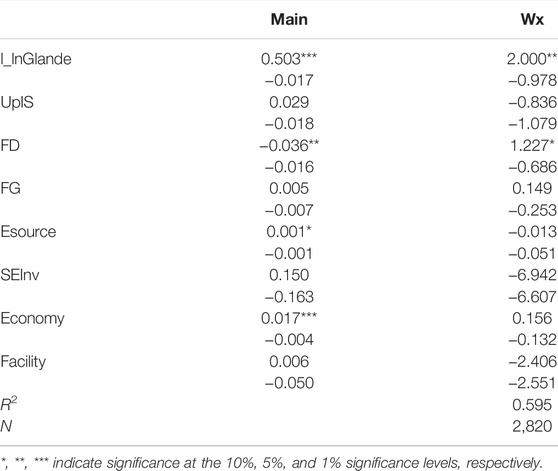
TABLE 7. Spatial econometrics results of driving factors on Glande.
According to the first column of data in Table 7, financial deepening, ecological resource endowment, and economic development level pass the significance test at 5%, 10%, and 1% levels respectively, and the coefficients are −0.036, 0.001, and 0.017 respectively, indicating that financial deepening has a negative impact on Glande, while ecological resource endowment and economic development level have a positive impact. In addition, the upgrading of industrial structure passed the significance test at a 15% level (p = 0.105), and the coefficient was 0.029, indicating that the upgrading of industrial structure has a positive impact on the green use efficiency of urban land. According to the second column data, W× financial deepening is significant at a 10% level, and the coefficient is 1.227, which shows that financial deepening has a positive spatial spillover effect, and the surrounding areas have a positive transmission effect on the local green utilization efficiency.
In addition, we carry out an LM test to test whether the model has a spatial effect. LM (error test) and Robust LM (error test) passed the significance test at 1% level (p = 0.000, p = 0.000), LM (lag) test passed the significance test at 5% level (p = 0.043) but did not pass the Robust LM (lag) test (p = 0.322), indicating that using a spatial econometric model is better than using an ordinary regression model. In addition to using the spatial Durbin model, we also test the driving factors with the spatial lag model and the spatial error model, as shown in Table 8. We carry out the joint significance test, and the Spatio-temporal fixed spatial lag model and Spatio-temporal fixed spatial error model passed the test. The results of columns 3) and 6) in Table 8 are basically consistent with the results of the spatial Durbin model in Table 7, that is, financial deepening, ecological resource endowment, and economic development are important influencing factors of Glande, and the upgrading of industrial structure has also passed the significance test of 10% level. In addition, the Hausman test significantly rejected the original hypothesis at a 1% level, indicating that the fixed effect model is more suitable than the random effect model.

TABLE 8. Estima ted results of SLM and SEM.
This paper uses the Super-SBM model to measure Glande of 282 cities in China from 2009 to 2019, further calculates the GML index, and uses the Moran index to analyze the spatial autocorrelation of Glande. Finally, we empirically analyze the spatial heterogeneity of the driving factors of Glande based on the spatial dynamic Durbin model. The conclusion are as follows: 1) Glande in China shows a fluctuating upward trend, but has not reached the effective state; 2) Glande in China has spatial heterogeneity, showing a pattern of western > estern > central; 3) from 2009 to 2019, the GML index of Chinese cities changed from slightly less than one to more than 1, and the growth of GML index depended more on technical efficiency in the early stage and technological progress in the later stage; 4) According to the results of Moran index, there is spatial autocorrelation in Glande in China; 5) Financial deepening has a negative impact on Glande, while ecological resource endowment, the level of economic development and the upgrading of the industrial structure have a positive impact. In addition, financial deepening has a positive spatial spillover effect, and the surrounding areas have a positive transmission effect on the local green utilization efficiency of urban land.
Specifically, the endowment of ecological resources plays a significant role in promoting Glande of 282 cities in China, which verifies that urban ecological resources play an important role in improving the local environment of the city, absorbing and purifying the pollutants produced in the process of urban land use, alleviating the urban heat island effect and improving the livable level. The level of economic development can promote the Glande of the city. The higher the level of economic development, the stronger the comprehensive strength of the city, and the greater the input intensity of resource factors per unit area of urban land, which can attract a large number of high-quality investment projects under the survival of the fittest, which is conducive to the improvement of Glande. Glande with advanced industrial structure can be promoted. The secondary industry, which is dominated by the resource processing industry, supports the urban development, while the tertiary industry with new energy and new technology develops relatively slowly, while the cities dominated by the secondary industry tend to emit more pollutants per unit of land. Therefore, it has a negative impact on Glande. Under the action of the market mechanism, low-quality foreign enterprises can gradually phase out and withdraw, increase productivity through the transfer and spillover of environmentally friendly technologies, enter the post-industrial development stage, and gradually reduce the input of new urban construction land. Alleviate the problem of urban sprawl and reduce industrial pollutant emissions. Financial deepening means that the government reduces excessive intervention in the financial market and allocates financial resources by adjusting interest rates, exchange rates, and other market means. With the continuous improvement of the degree of marketization, urban investment is inefficient, the investment project is not a high-quality project, emphasis on economic benefits rather than environmental benefits, Glande is reduced.
The following are implications for improving Glande in China: 1) promoting the green transformation of the economy and speeding up the development of labor-intensive industries to knowledge-and technology-intensive industries; increase support for enterprise green land development, product production, technology research and development, and tighten enterprise pollution standards and environmental protection access threshold; 2) advocating eco-environmental friendliness, further strengthening the concept that “Clear waters and green mountains are as valuable as mountains of gold and silver”, improving the ability of urban land pollution control and green GDP assessment, and building a national land carbon emissions trading market; 3) different regions should adopt differential management measures according to local conditions, and the eastern coastal areas should speed up the development of emerging scientific and technological industries and tertiary industries, speed up the construction of a modern industrial system with advanced technology, high added value and high efficiency of resource utilization, vigorously develop cleaner production, and develop diversified innovation space and highly efficient accessible and networked public space. Create an institutional environment and a livable living environment to stimulate the vitality of innovation. The central and western regions should strengthen the construction of urban infrastructure and public service facilities to meet the needs of urban residents, actively introduce advanced production technology and high-end talents, promote industrial optimization and upgrading, and increase the effect of urban industrial clusters.
The possible future research directions are as follows: 1) deepen the research on the interaction mechanism of the driving factors of Glande. In this paper, the discussion of the driving factors focuses on the independent effect of each factor on Glande, and there is a lack of discussion on the mechanism involving the interaction of two or multi-agent systems; 2) this paper focuses on the linear effect of driving factors, but in fact, there may be non-linear relations such as U-shaped relationship or inverted U-shaped relationship, which can be paid attention to in the future; 3) the driving factors studied in this paper are limited, and there may be other important factors that affect Glande (Färe et al., 1994; Huang et al., 2014).
Publicly available datasets were analyzed in this study. This data can be found here: https://www.cnrds.com/Home/Index#/.
LZ conceived and designed the frame work, YY completed data analysis and result collation, and are equal first authors. YC wrote the paper and collected data.
This research was funded by Humanities and Social Science Fund of Ministry of Education of China—grant number 18YJA630139.
The authors declare that the research was conducted in the absence of any commercial or financial relationships that could be construed as a potential conflict of interest.
All claims expressed in this article are solely those of the authors and do not necessarily represent those of their affiliated organizations, or those of the publisher, the editors and the reviewers. Any product that may be evaluated in this article, or claim that may be made by its manufacturer, is not guaranteed or endorsed by the publisher.
1Data source: https://www.yicai.com/news/101158825.html.
Aiping Wang, A., Lin, W., Liu, B., Wang, H., and Xu, H. (2021). Does Smart City Construction Improve the Green Utilization Efficiency of Urban Land? Land 10, 657. doi:10.3390/land10060657
Chen, Y., Henderson, J. V., and Cai, W. (2017). Political Favoritism in China's Capital Markets and its Effect on City Sizes. J. Urban Econ. 98, 69–87. doi:10.1016/j.jue.2015.10.003
Chen, W., Chen, W., Ning, S., Liu, E.-n., Zhou, X., Wang, Y., et al. (2019). Exploring the Industrial Land Use Efficiency of China's Resource-Based Cities. Cities 93, 215–223. doi:10.1016/j.cities.2019.05.009
Desiere, S., and Jolliffe, D. (2018). Land Productivity and Plot Size: Is Measurement Error Driving the Inverse Relationship? J. Dev. Econ. 130, 84–98. doi:10.1016/j.jdeveco.2017.10.002
Du, J., Thill, J.-C., and Peiser, R. B. (2016). Land Pricing and its Impact on Land Use Efficiency in Post-land-reform China: A Case Study of Beijing. Cities 50, 68–74. doi:10.1016/j.cities.2015.08.014
Elhorst, J. P. (2014). Matlab Software for Spatial Panels. Int. Regional Sci. Rev. 37 (3), 389–405. doi:10.1177/0160017612452429
Fan, P. F., Feng, S. Y., Su, M., and Xu, M. J. (2018). Differential Characteristics and Driving Factors of Land Use Efficiency in Different Functional Cities Based on Undesirable Outputs. Resour. Sci. 40 (5), 946–957. doi:10.18402/resci.2018.05.08
Färe, R., Grosskopf, S., Norris, M., and Zhang, Z. Z. (1994). Productivity Growth, Technical Progress, and Efficiency Change in Industri-Alized Countries. Am. Econ. Rev. 84, 66–83.
Ferreira, M. D. P., and Féres, J. G. (2020). Farm Size and Land Use Efficiency in the Brazilian Amazon. Land Use Policy 99, 104901. doi:10.1016/j.landusepol.2020.104901
Guastella, G., Pareglio, S., and Sckokai, P. (2017). A Spatial Econometric Analysis of Land Use Efficiency in Large and Small Municipalities. Land Use Policy 63, 288–297. doi:10.1016/j.landusepol.2017.01.023
Guo, W. W., and Zhou, Y. (2020). Competition of Local Governments, Land Finance and Total Factor Productivity: Based on the Empirical Test of 276 Prefecture-Level Cities in China. Collect. Essays Finance Econ. 10, 22–32. doi:10.13762/j.cnki.cjlc.2020.10.002
Hanif, I. (2018). Impact of Economic Growth, Nonrenewable and Renewable Energy Consumption, and Urbanization on Carbon Emissions in Sub-saharan Africa. Environ. Sci. Pollut. Res. Int. 25, 15057–15067. doi:10.1007/s11356-018-1753-4
Huang, J., Yang, X., Cheng, G., and Wang, S. (2014). A Comprehensive Eco-Efficiency Model and Dynamics of Regional Eco-Efficiency in China. J. Clean. Prod. 67, 228–238. doi:10.1016/j.jclepro.2013.12.003
Huang, Z., He, C., and Zhu, S. (2017). Do China's Economic Development Zones Improve Land Use Efficiency? the Effects of Selection, Factor Accumulation and Agglomeration. Landsc. Urban Plan. 162, 145–156. doi:10.1016/j.landurbplan.2017.02.008
Hui, E. C. M., Wu, Y., Deng, L., and Zheng, B. (2015). Analysis on Coupling Relationship of Urban Scale and Intensive Use of Land in China. Cities 42, 63–69. doi:10.1016/j.cities.2014.09.002
Jin, G., Deng, X., Zhao, X. D., Guo, B. S., and Yang, J. (2018). Spatio-temporal Patterns of Urban Land Use Efficiency in the Yangtze River Economic Zone during 2005-2014. Acta Geogr. Sin. 73, 1242–1252. doi:10.11821/dlxb201807005
Jing, L., Bixia, H., Kuang, B., and Chen, D. (2017). Measuring of Urban Land Use Efficiency and its Dynamic Development in China. Econ. Geogr. 37, 162–167. doi:10.15957/j.cnki.jjdl.2017.08.021
Li, H., Calder, C. A., and Cressie, N. (2007). Beyond Moran's I: Testing for Spatial Dependence Based on the Spatial Autoregressive Model. Geogr. Anal. 39, 357–375. doi:10.1111/j.1538-4632.2007.00708.x
Liang, L. T., Zhao, Q. L., and Chen, C. (2013). Analysis on the Characters of Spatial Disparity of Urban Land Use Efficiency and its Optimization in China. China Land Sci. 27 (7), 48–54. doi:10.13708/j.cnki.cn11-2640.2013.07.009
Lu, X., Chen, D., Kuang, B., Zhang, C., and Cheng, C. (2020). Is High-Tech Zone a Policy Trap or a Growth Drive? Insights from the Perspective of Urban Land Use Efficiency. Land Use Policy 95, 104583. doi:10.1016/j.landusepol.2020.104583
Martinho, V. J. P. D. (2017). Efficiency, Total Factor Productivity and Returns to Scale in a Sustainable Perspective: An Analysis in the European Union at Farm and Regional Level. Land Use Policy 68, 232–245. doi:10.1016/j.landusepol.2017.07.040
Moran, P. A. P. (1950). Notes on Continuous Stochastic Phenomena. Biometrika 37, 17–23. doi:10.1093/biomet/37.1-2.17
Oh, D.-h. (2010). A Global Malmquist-Luenberger Productivity Index. J. Prod. Anal. 34, 183–197. doi:10.1007/s11123-010-0178-y
Osman, T., Divigalpitiya, P., and Arima, T. (2016). Driving Factors of Urban Sprawl in Giza Governorate of Greater Cairo Metropolitan Region Using AHP Method. Land Use Policy 58, 21–31. doi:10.1016/j.landusepol.2016.07.013
Peng, B.-B., Xu, J.-H., and Fan, Y. (2018). Modeling Uncertainty in Estimation of Carbon Dioxide Abatement Costs of Energy-Saving Technologies for Passenger Cars in China. Energy Policy 113, 306–319. doi:10.1016/j.enpol.2017.11.010
Peng Wang, P., Shao, Z., Wang, J., and Wu, Q. (2021). The Impact of Land Finance on Urban Land Use Efficiency: A Panel Threshold Model for Chinese Provinces. Growth Change 52, 310–331. doi:10.1111/grow.12464
Ren, W., Zhang, Z., Wang, Y., Xue, B., and Chen, X. (2020). Measuring Regional Eco-Efficiency in China (2003-2016): A "Full World" Perspective and Network Data Envelopment Analysis. Int. J. Environ. Res. Public Health 17, 3456. doi:10.3390/ijerph17103456
Sun, Y., Ma, A., Su, H., Su, S., Chen, F., Wang, W., et al. (2020). Does the Establishment of Development Zones Really Improve Industrial Land Use Efficiency? Implications for China's High-Quality Development Policy. Land Use Policy 90, 104265. doi:10.1016/j.landusepol.2019.104265
Sun, Z. Q., and Sun, T. (2019). Financial Development ,industrial Development, Industrial Structure Optimization, and Eco-Efficiency Promotion. Fresenius Environ. Bull. 28, 6231–6238.
Tao, X., Wang, P., and Zhu, B. (2016). Provincial Green Economic Efficiency of China: A Non-separable Input-Output SBM Approach. Appl. Energy 171, 58–66. doi:10.1016/j.apenergy.2016.02.133
Wang, Z., Chen, J., Zheng, W., and Deng, X. (2018). Dynamics of Land Use Efficiency with Ecological Intercorrelation in Regional Development. Landsc. Urban Plan. 177, 303–316. doi:10.1016/j.landurbplan.2017.09.022
Wang, Z., Liang, L., Sun, Z., and Wang, X. (2019). Spatiotemporal Differentiation and the Factors Influencing Urbanization and Ecological Environment Synergistic Effects within the Beijing-Tianjin-Hebei Urban Agglomeration. J. Environ. Manag. 243, 227–239. doi:10.1016/j.jenvman.2019.04.088
Xie, H., Chen, Q., Lu, F., Wu, Q., and Wang, W. (2018). Spatial-temporal Disparities, Saving Potential and Influential Factors of Industrial Land Use Efficiency: A Case Study in Urban Agglomeration in the Middle Reaches of the Yangtze River. Land Use Policy 75, 518–529. doi:10.1016/j.landusepol.2018.04.027
Xie, H., Chen, Q., Lu, F., Wang, W., Yao, G., and Yu, J. (2019). Spatial-temporal Disparities and Influencing Factors of Total-Factor Green Use Efficiency of Industrial Land in China. J. Clean. Prod. 207, 1047–1058. doi:10.1016/j.jclepro.2018.10.087
Xin, G., Az, B., and Zs, C. (2020). How Regional Economic Integration Influence on Urban Land Use Efficiency? A Case Study of Wuhan Metropolitan Area, China. Land Use Policy 90, 104329. doi:10.1016/j.landusepol.2019.104329
Yan, S., Peng, J., and Wu, Q. (2020). Exploring the Non-linear Effects of City Size on Urban Industrial Land Use Efficiency: A Spatial Econometric Analysis of Cities in Eastern China. Land Use Policy 99, 104944. doi:10.1016/j.landusepol.2020.104944
Yang, C.-H., Wu, L., and Lin, H.-L. (2010). Analysis of Total-Factor Cultivated Land Efficiency in China's Agriculture. Agric. Econ. - Czech 56, 231–242. doi:10.17221/37/2009-agricecon
Yang, L., Ouyang, H., Fang, K., Ye, L., and Zhang, J. (2015). Evaluation of Regional Environmental Efficiencies in China Based on Super-efficiency-DEA. Ecol. Indic. 51, 13–19. doi:10.1016/j.ecolind.2014.08.040
Yu, J., Zhou, K., and Yang, S. (2019). Land Use Efficiency and Influencing Factors of Urban Agglomerations in China. Land Use Policy 88, 104–113. doi:10.1016/j.landusepol.2019.104143
Zhou, Y., and Tan, G. (2017). Impact of Local Government Competition on the Efficiency of Urban Land Use. Areal Res. Dev. 36, 118–122. doi:10.3969/j.issn.1003-2363.2017.03.022
Zhu, X., Li, Y., Zhang, P., Wei, Y., Zheng, X., and Xie, L. (2019a). Temporal-spatial Characteristics of Urban Land Use Efficiency of China's 35mega Cities Based on DEA: Decomposing Technology and Scale Efficiency. Land Use Policy 88, 104083. doi:10.1016/j.landusepol.2019.104083
Keywords: green utilization efficiency1, urban land2, spatial-temporal evolution3, Super-SBM model4, driving factors5
Citation: Zhang L, Yu Y and Chen Y (2022) The Spatial-Temporal Evolution Characteristics and Driving Factors of the Green Utilization Efficiency of Urban Land in China. Front. Environ. Sci. 10:955982. doi: 10.3389/fenvs.2022.955982
Received: 29 May 2022; Accepted: 13 June 2022;
Published: 07 July 2022.
Edited by:
Yanbo Qu, Shandong University of Finance and Economics, ChinaReviewed by:
He He, Shanghai University, ChinaCopyright © 2022 Zhang, Yu and Chen. This is an open-access article distributed under the terms of the Creative Commons Attribution License (CC BY). The use, distribution or reproduction in other forums is permitted, provided the original author(s) and the copyright owner(s) are credited and that the original publication in this journal is cited, in accordance with accepted academic practice. No use, distribution or reproduction is permitted which does not comply with these terms.
*Correspondence: Yongheng Chen, Y2hlbnloX0B0b25namkuZWR1LmNu
†This author shares co-first authorship
Disclaimer: All claims expressed in this article are solely those of the authors and do not necessarily represent those of their affiliated organizations, or those of the publisher, the editors and the reviewers. Any product that may be evaluated in this article or claim that may be made by its manufacturer is not guaranteed or endorsed by the publisher.
Research integrity at Frontiers
Learn more about the work of our research integrity team to safeguard the quality of each article we publish.