 Zixi Wang
 Jie Li
 Lin Wu1,2*
- 1State Key Laboratory of Atmospheric Boundary Layer Physics and Atmospheric Chemistry, Institute of Atmospheric Physics, Chinese Academy of Sciences, Beijing, China
- 2College of Earth and Planetary Sciences, University of Chinese Academy of Sciences, Beijing, China
- 3Center for Excellence in Urban Atmospheric Environment, Institute of Urban Environment, Chinese Academy of Sciences, Xiamen, China
The global atmospheric chemical transport model has become a key technology for air quality forecast and management. However, precise and rapid air quality simulations and forecast are frequently limited by the model’s computational performance. The gas-phase chemistry module is the most time-consuming module in air quality models because its traditional solution method is dynamically stiff. To reduce the solving time of the gas phase chemical module, we built an emulator based on a deep residual neural network emulator (NN) for Carbon Bond Mechanism Z (CBM-Z) mechanism implemented in Global Nested Air Quality Prediction Modeling System. A global high resolution cross-life multi-species dataset was built and trained to evaluate multi-species concentration changes at a single time step of CBM-Z. The results showed that the emulator could accelerate to approximately 300–750 times while maintaining an accuracy similar to that of CBM-Z module (the average correlation coefficient squared was 0.97) at the global scale. This deep learning-based emulator could adequately represent the stiff kinetics of CBM-Z, which involves 47 species and 132 reactions. The emulated ozone (O3), nitrogen oxides (NOx), and hydroxyl radical (OH) were consistent with those of the original CBM-Z module in different global regions, heights, and time. Our results suggest that data-driven emulations have great potential in the construction of hybrid models with process-based air quality models, particularly at larger scales.
1 Introduction
Air pollution has adverse effects on ecology and human health, and potentially influences climate change (Kampa and Castanas, 2008; Fiore et al., 2012). Global atmospheric chemical transport model simulation (CTMs) is the main research method for air quality forecast, which can accurately and comprehensively elucidate the physical and chemical processes of various atmospheric pollutants at regional and global scales (Byun and Ching, 1999; Ye et al., 2021). Global CTMs comprise emission, advection transport, turbulent diffusion, gas-phase and aqueous chemistry, heterogeneous chemistry, and deposition (Wang et al., 2001; Binkowski and Roselle, 2003; Long et al., 2015). The gas-phase chemical process is described by the detailed induction of the photochemical mechanism, including the source and sink of the complex gas-phase chemical components in the atmosphere and various photochemical reactions (Wang et al., 2001; Lu et al., 2020). It is the key component of the atmospheric chemical transport model. Photochemical kinetics in the gas-phase chemistry module is usually solved by stiff ordinary differential equations (ODE) (Zhang et al., 2011). The traditional solution methods are quasi-steady-state approximation (Hesstvedt et al., 1978; Hochbruck et al., 1998), iterative backward differential formulas method (Damian et al., 2002), implicit Runge-Kutta method extrapolation method, and Rosenbrock method (Sandu et al., 2003; Sandu and Miehe, 2010). These methods have been widely used in the Global Nested Air Quality Prediction Modeling System (GNAQPMS), Weather Research and Forecasting model coupled with chemistry (WRF-Chem), Community Multiscale Air Quality model (CMAQ), and global 3-D model of atmospheric chemistry driven by meteorological input from the Goddard Earth Observing System (GEOS-Chem) (Turco and Whitten, 1974; Byun and Ching, 1999; Wang et al., 2001; Grell et al., 2005; Lei et al., 2020). However, these methods are stiff integration algorithms, which need to be solved repeatedly by implicit time stepping algorithms (Young and Boris, 1977). Therefore, the simulation speed of gas-phase chemistry at global scales is slow, accounting for 50%–95% of the total CPU time required by the entire model (Verwer et al., 2002), which affects the simulation performance of global CTMs. Most studies have to reduce the resolution of the model to improve its computational speed and simulation performance (Linford et al., 2010; Linford and Sandu, 2011; Wang et al., 2019). The current strategy for improving the speed of the gas-phase chemistry module is mainly to optimize the code based on regional decomposition or vectorization of the analog grid by achieving instruction-level parallel operation on each core, single-core single-instruction multi-data flow and multi-core (based on multi-thread)/multi-node (based on information transfer interface) parallel operation. Simulation speed based on these methods is approximately 20–40 times faster than traditional solutions (Zhang et al., 2011; Wang et al., 2019). However, when the horizontal resolution of the model is high and the complex chemical mechanism is included, the computational cost is still high. Therefore, there is an urgent need for technology that enables the acceleration of gas-phase chemistry modules at global scales to improve the simulation efficiency of global CTMs and promote further development of air quality forecast.
As a data-driven artificial intelligence technology, deep learning models can learn and simulate complex nonlinear relations between massive data, and predict multiple targets at high speed by building neural networks (Li et al., 2016; Huang and Kuo, 2018; Wang and Song, 2018; Reichstein et al., 2019; Liao et al., 2020). Therefore, deep learning is currently being viewed as a powerful technique to explore the potential of improving the running speed of gas-phase chemistry modules (Keller and Evans, 2019; Kelp et al., 2020; Liu et al., 2021). Keller and Evans (2019) reproduced the gas-phase chemistry simulation at global scales in GEOS-Chem, based on the random forest algorithm. The training dataset consisted of the hourly global concentration of 52 pollutants at 2.5° × 2° horizontal resolution after integration. The correlation coefficients were mostly between 0.8 and 1 (Keller and Evans, 2019). However, the prediction speed was found to be even slower than that of the GEOS-Chem. Kelp et al. (2020) reproduced the gas phase chemistry module in WRF-Chem model based on residual neural network. They used encoder-operator-decoder networks to predict the hourly global concentrations of 101 pollutants at 2.5° × 2° resolution after integration and improved the simulation speed by two orders of magnitude. However, the correlation coefficients were generally between 0.5 and 1 (Kelp et al., 2018; Kelp et al., 2020). Global gas chemical simulations contain more complex characteristic information and require more computing resources, which makes it difficult to accurately capture valid and more targeted information from the data. This may have been the cause of the poor performance. Liu et al. (2021) simulated the gas-phase chemical processes in CMAQ model based on residual neural networks. The dataset covered 123 pollutant species with a 36-km horizontal resolution in China and parts of Southeast Asia. Deep learning increased the computational speed of gas-phase chemical processes by 10–90 times and the correlation coefficients were approximately 0.99 (Liu et al., 2021). This may be attributed to the pollution characteristics within the region being more obvious and the information contained being more concentrated and effective, which makes the regional simulation performance better than the global simulation. More efficient extraction of datasets is one way to improve global gas-phase chemistry simulation performance using deep learning. Simulations in previous studies for accelerating global gas phase chemistry modules all ran at 2.5° × 2° coarse horizontal resolution (Keller and Evans, 2019; Kelp et al., 2020; Liu et al., 2021). Coarse horizontal resolution global models underestimate city-scale pollution and regional transport, thereby affecting model performance (Van Dingenen et al., 2018). Higher horizontal resolution has an important effect on the performance of the CTMs (Tao et al., 2020) and contains more detailed and diverse regional features. More reactive species change more rapidly in photochemical reactions and thus have more pronounced characteristic changes. Neural networks can learn more effective characteristic information based on a higher resolution more reactive multi-species dataset, further increasing the speed and precision of higher-resolution global gas-phase chemistry simulation. This makes it possible to add more comprehensive gas phase chemistry to the Earth system model and long-term simulation of global climate change (Lu et al., 2020; Brasseur and Kumar, 2021).
In this study, we developed an emulator based on neural networks to simulate the gas phase chemistry of more reactive species in Carbon Bond Mechanism Z (CBM-Z). Previous studies could not well achieve the single timestep global gas-phase chemistry simulation with high precision and high speed, resulting in the accumulation of errors in long-term prediction (Keller and Evans, 2019; Kelp et al., 2020; Liu et al., 2021). Therefore, this study aims to simulate shorter single timestep global high resolution gas phase chemical processes and shorter numerical integration processes with high accuracy and high speed, and to explore the ability of neural network to capture the concentration changes of more reactive species in gas-phase chemical reactions. To provide effective and targeted input data for the emulator, the CBM-Z gas phase chemistry module in GNAQPMS was used to simulate the meteorological parameters, photolysis rates and concentration changes of 47 gas phase species at every grid in a single time step on 26 September 2018. Finally, we analyzed the emulated spatiotemporal results of instantaneous concentration changes of various pollutants at global high resolution and explored the simulation effect of the deep neural network emulator on the atmospheric photochemical gas phase process of multiple species with different lifetimes. Our findings verified the learning ability of the model for the gas phase chemical process at global scales.
2 Data and methods
2.1 Description of carbon bond mechanism Z
CBM-Z is a lumped-structure photochemical mechanism that can simulate tropospheric chemical processes at larger spatial scales (city-scale, regional-scale and global-scale) and long timescales (Zaveri and Peters, 1999). In CBM-Z, the inorganic chemistry consisting of inorganic reactions and their rate constants are based on the mechanism developed by Gery et al. (1989). The explicit inorganic chemistry of the troposphere contains reactions of ubiquitous inorganic trace gases such as ozone (O3), nitrogen oxides (NOx), carbon monoxide (CO), sulfur dioxide (SO2), and hydrogen peroxide (H2O2) (Zaveri and Peters, 1999). Organic chemistry (Paraffin, Olefin, Isoprene, Carbonyl and Aromatic chemistry) is treated with a lumped structure approach where organics are categorized according to the different types of carbon bonds present in their molecular structures. Organic chemistry contains 31 organic species and 72 organic reactions. CBM-Z contained 52 prognostic gas phase species and 132 gas-phase chemical reactions (Zaveri and Peters, 1999). The CBM-Z solver uses LSODE, a gear-type solver (using a faster and more robust algorithm), to solve the system of nonlinear ODEs describing the photochemical kinetics. The CBM-Z mechanism developed five chemical sub-schemes of different scenarios, which include the background conditions, urban areas, suburban areas, biological areas, and the ocean (Li et al., 2012; Wang et al., 2017; Wang et al., 2019). Therefore, the CBM-Z containing more comprehensive chemical mechanisms can be used to satisfy the simulation of diverse scenarios and larger scales, which has been used in the GNAQPMS and WRF-Chem (Wang et al., 2017; Kelp et al., 2018).
2.2 Global atmospheric chemical transport model
In this study, the dataset covering the troposphere around the globe was constructed from the gas phase chemistry module of GNAQPMS, an offline global atmospheric chemical transport model developed by the Institute of Atmospheric Physics, Chinese Academy of Sciences (Wang et al., 2002; Li et al., 2008; Chen et al., 2015). It comprises advection transport, turbulent diffusion, gas phase chemistry based on CBM-Z mechanism (Zaveri and Peters, 1999), aqueous chemistry (Stockwell et al., 1990), heterogeneous chemistry (Li et al., 2012), deposition (Byun and Dennis, 1995), and smoke flow module (Wang et al., 2001). The horizontal resolution of the model is variable, and a resolution of 0.5° × 0.5° and 20 vertical layers were used in this study. Twenty photolysis rates of gas species including the gaseous, aerosol and cloud species effects on photolysis were calculated online using atmospheric radiative transport model (TUV) (Madronich, 1987; Li et al., 2011; Ye et al., 2021). Meteorological fields including convection and boundary layer diffusion process were derived from the Global Weather Research and Forecasting (GWRF v3.6) model driven by the final analyses (FNL) dataset of National Centers for Environmental Prediction (NCEP) (Zhang et al., 2012). Top boundaries and initial conditions for each species were obtained from the climatic mean output from MOZART v2.4 (Ye et al., 2021). The CBM-Z gas phase chemistry module in GNAQPMS comprised 52 chemical species and 132 chemical reactions with a lifetime ranging from milliseconds to years. Photochemical kinetics in the chemical mechanism of the gas phase was calculated using LSODE algorithm in iterative backward differential method (Zaveri and Peters, 1999; Li et al., 2016). GNAQPMS can reproduce physical and chemical processes in the atmosphere at regional and global scales. They have therefore been widely used to predict the global distribution and trans-national transport of gaseous species.
2.3 Dataset establishment
The gas phase chemistry module of GNAQPMS based on CBM-Z mechanism was used to simulate the global concentration change process on 26 September 2018. The GNAQPMS resolution was set as 0.5° × 0.5° and the simulated heights covered 0–20 km above ground level. During GNAQPMS simulation, we output the pollutant concentration before and after CBM-Z solver in each time step (Supplementary Figure S1). The concentration before calculation was used as the input field, and the difference between the concentration, after and before calculation, was used as the learning object. The interval time step was 20 min. We explored 47 important gas phase species that are involved in many chemical processes based on neural networks, ignoring five less important intermediates that are very reactive and often not observed. The input features included the initial concentration of 47 important gas phase species in CBM-Z module, three meteorological parameters (temperature, relative humidity, and air pressure) and related to the gas phase photochemical reaction of 20 basic photolysis rates. The output variables were the concentration changes of 47 gas phase pollutants. The concentration change is the concentration difference in a single time step (20 min) calculated by subtracting the input concentration data from the output concentration data of corresponding species in the CBM-Z gas phase chemical mechanism module. The concentration of many substances calculated by the gas phase chemistry module changed very little compared to the initial concentration before the reaction. Therefore, we set the concentration change as the output variable, instead of the final concentration after the reaction. This enabled the neural network emulator to sensitively capture such changes and learn the concentration micro-changes of various species in the photochemical reaction process. Finally, the dataset generated by running the CBM-Z gas phase chemistry module consisted of 72 time steps of 20 min, covering approximately 373 million higher-resolution input features and output variables worldwide.
2.4 Emulator (Neural network model)
A neural network emulator was built based on a deep learning algorithm driven by large amounts of data. The deep structure of the neural network enables the emulator to perform multi-target nonlinear regression (Liao et al., 2020). The emulator can conduct multi-target regression empirical modeling for multiple continuous input features and finally predict multiple continuous output variables (Reyes and Ventura, 2019; Seo et al., 2021). As the solution of photochemical kinetics in gas phase chemical mechanism is expressed by stiff ODEs, we chose a deep residual neural network (ResNet) suitable for solving ODE in this study (Paoletti et al., 2019). ResNet uses multiple stacked layers to fit residual maps instead of the basic mapping that directly fits the expectations of the entire connection layer (He et al., 2016). Compared with other neural networks, ResNet shows better network precision performance as the network layer gets deeper. The architecture principle of this network is very similar to the solution of ODEs. The expression of ODEs resembles a residual connection in ResNet. The sum of the initial conditions and the output of the neural network at a certain time is equal to the expected output of the dataset. Therefore, these residual connections can represent the time step of Euler discretization (Li et al., 2020). By constantly optimizing the depth of the neural network, the prediction of the model can reach the optimal solution. Skip connections in ResNet largely solve the problem of gradient disappearance, gradient explosion and model degradation in the process of deepening neural network training (Glorot and Bengio, 2010; Simonyan and Zisserman, 2014; Srivastava et al., 2017), thereby making the deep network structure more accurate (Zhu et al., 2021). Owing to the complex nonlinear relationship between the input and output of the original dataset and the large difference in the magnitude of concentration change, this study optimized the traditional ResNet. Figure 1 shows the concrete structure of the neural network emulator. First, the input features (initial concentration, meteorological parameters, and photoluminescence rate) were normalized using minimum and maximum values and introduced into the fully connected layer. Tanh function can scale large-scale input data into an interval of [−1, 1] and provide noise-robust and non-linear representation (Abdelouahab et al., 2017). So we used tanh as the activation function layer for input data to amplify the features of smaller values and retained the original negative data information. Then, the eight residual blocks were then connected (each of which consists of the full connection layer, the rectified linear unit activation layer, the residual connection block and the tanh activation layer). The number of neurons in the adjacent connection layer was equal to the CBM-Z input variable (70). The last residual block was connected to the output full connection layer, and the number of output neurons was equal to the number of CBM-Z chemical substances (47).
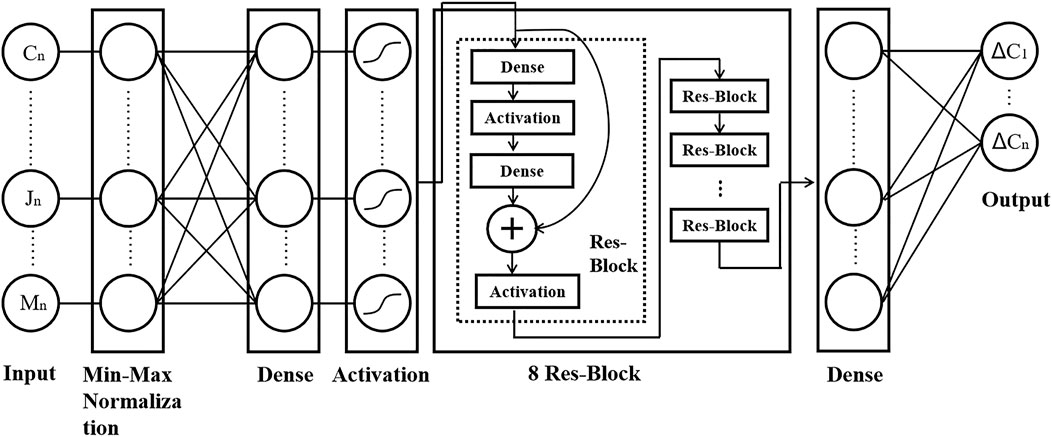
FIGURE 1. Structure diagram of neural network emulator in this study. Cn represents the initial concentration of 47 gas phase species, Mn represents three meteorological parameters (temperature, relative humidity, and air pressure), and Jn represents 20 photolysis rates.
2.5 Model training and testing
To ensure full coverage of the training set in space, the total dataset was divided into training and testing data according to time series. The data was divided into two separated sets based on the hold-out method (Kim, 2009). One part of the data was used as the training set and the other separated part was used as the testing set. The proportion of the training set is usually 66.6%–80% of the total dataset (Crowther and Cox, 2005; Nurhayati et al., 2014; Li et al., 2016). In some studies, 2/3 of the data used as the training set and 1/3 of the data used as testing data are considered to be the recommended algorithm for splitting data (Crowther and Cox, 2005; Nurhayati et al., 2014). To test more data and emulator’s generalization capability based on the premise of sufficient training, we chose 2/3 of the dataset as a training dataset and the rest as testing data. The training set accounts for approximately 67% of the total dataset, and the testing set accounts for approximately 33% of the total dataset, which is sufficient to enable us to test the generalization ability of the emulator on the testing set. Data of 16 h (48 single timesteps) was used to train the emulator. More than 124 million samples of the remaining 8 h (24 single timesteps) were used to test the emulator. We chose the last 1 h data every 3 h as testing data (3:00, 6:00, 9:00, 12:00, 15:00, 18:00, 21:00, 24:00 UTC) to ensure that the global training set and testing set contained more information of different lighting conditions and continuous photochemical reaction process as far as possible. To avoid unbalanced data and to extract global data sets more effectively, a stratified sampling method was adopted for targeted sampling of training data, which mainly filtered out parts of data with minimal changes. The dropout and regularization factors were not introduced in this emulator because the ResNet structure was well protected against overfitting and gradient explosion (He et al., 2016). To continuously optimize the emulator’s hyperparameters and performance, the training data was randomly and averagely divided into 10 equal parts, among which, nine were used as final training data of the emulator, and one was used as validation data for the training of the emulator. The neural network emulator was continuously trained and optimized by minimizing the mean square error (MSE) of the CBM-Z module in GNAQPMS enabling it to predict all pollutant concentration changes. By using the stochastic gradient descent method and Adam optimizer (Kingma and Ba, 2014), the initial learning rate was 0.001 (You et al., 2019), the batch size was 1,024 (Takase, 2021), and the training duration was 400 epochs (Supplementary Table S1). The residual neural network emulator in this study was built using TensorFlow-GPU 1.8 version, and the remaining undescribed hyperparameters were set to TensorFlow default values (Abadi et al., 2016). After determining the hyperparameters, the final emulator with the best effect of multi-species average correlation coefficient and diurnal variation simulation performance was selected. Finally, the simulation performance of the trained emulator on the testing dataset was evaluated. Simultaneously, we use a single CPU core [Intel(R) Xeon(R) CPU E5-2630 V4.4@ 2.20 GHz] running CBM-Z module, a single CPU core [Intel(R) Xeon(R) CPU E5-2630 V4.4@ 2.20 GHz], and a single GPU core (NVIDIA Tesla V100) running the residual neural network emulator to simulate gas phase chemistry processes on 518.4 million independent grid cells (a global simulation of 20 vertical layers at 0.5° × 0.5° horizontal resolution) and compared their running times.
2.6 Statistical indicators
The following four standard statistical indicators were used to systematically evaluate the performance of the residual neural network emulator used in this study. We compared the predicted concentration change of the neural network emulator (NN) with the CBM-Z module in the GNAQPMS model on the testing set. For the predicted concentration change of the nth species, four standard statistical indicators were used for comparison: Pearson correlation coefficient square (R2), root mean square error (RMSE), normalized square mean root difference (NRMSE) and mean absolute error (MAE). The detailed statistical indicator calculation methods were listed in Supplementary Eqs S1–S4.
3 Results and discussion
3.1 Evaluation of prediction effect of concentration change
The test results of the testing dataset showed that the neural network emulator used in this study could simulate the gas phase chemical mechanism module of the GNAQPMS in a short time step (20 min). More accurate simulation of all species in shorter time steps is the basis and the key for neural network emulators to accurately predict chemical processes over a prolonged period of time. Table 1 lists in detail the statistical indicators of the 20-min concentration changes of 47 more reactive species in photochemical reactions predicted by the CBM-Z module of GNAQPMS and neural network emulator (all species names were listed in Supplementary Table S2), as well as the mean values of all species’ statistical indicators. There were 35 species with R2 values greater than 0.96. RMSE and MAE of all species were within 0.001 ppb, NRMSE of all species were below 0.5, and the mean R2 of all species was approximately 0.97. The performance of the atmospheric chemical module depends to a large extent on the emulator’s ability to accurately predict the main oxidants in atmospheric photochemical reactions (Zaveri and Peters, 1999). As shown in Table 1, the correlation coefficients square of ozone (O3), hydroperoxy radical (H2O2), nitric oxide (NO), nitrogen dioxide (NO2), hydroxyl radical (OH) and hydroperoxy radical (HO2) are all above 0.96. This indicates that the neural network emulator can reproduce the atmospheric chemical mechanism in GNAQPMS well and has great potential to replace the CBM-Z gas phase chemistry module in GNAQPMS for the simulation of gas phase chemical mechanism. The correlation coefficients square of the main precursor organics of O3, such as ethane (C2H6), formaldehyde (HCHO), paraffin carbon (PAR), ethene (ETH), terminal olefin carbon (OLET), internal olefin carbon (OLEI) and acetaldehyde (ALD2), are all above 0.97, which is sufficient to indicate that the neural network emulator adopted in this study can accurately predict the short-term concentration changes of various gas phase pollutants simultaneously.
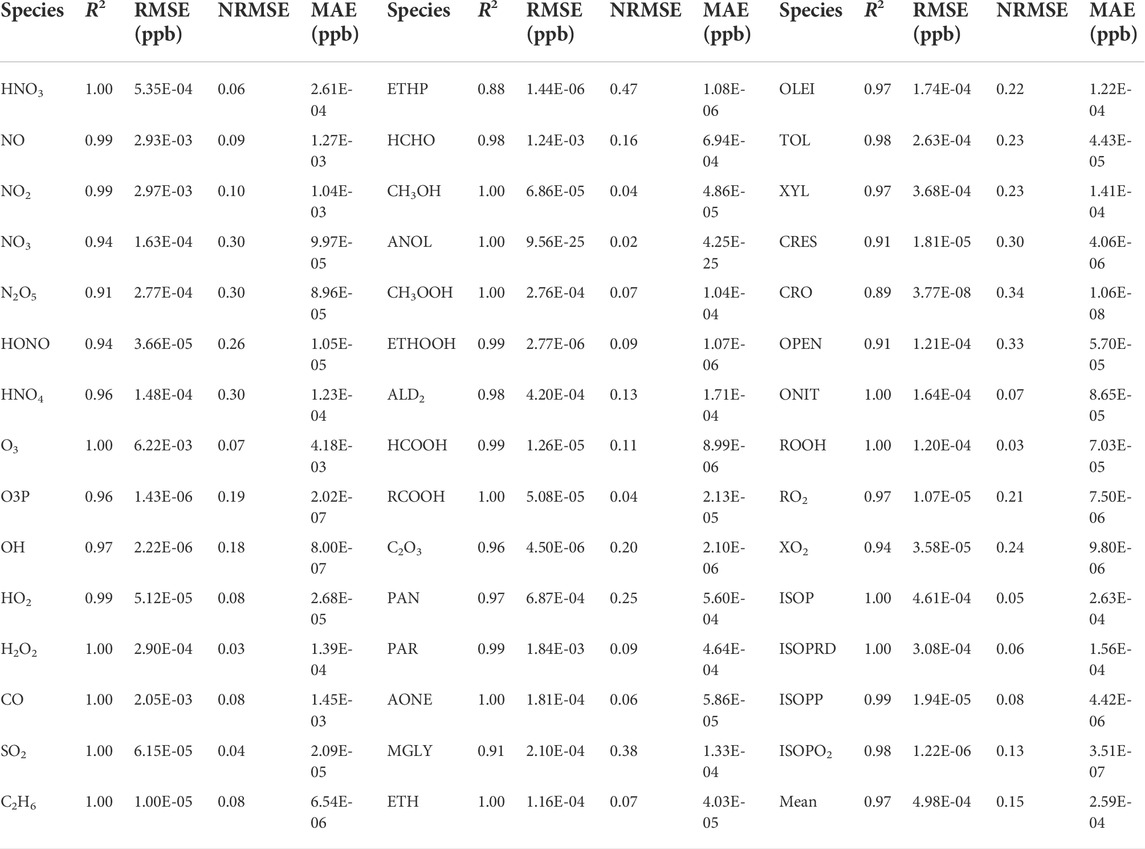
TABLE 1. Statistical index of the 20-min concentration changes of 47 species predicted by CBM-Z module of GNAQPMS and neural network (NN) emulator.
The trained neural network emulator developed in this study was used to predict the concentration change of the 8 h testing dataset on 26 September 2018. The testing set included the input data of more than 124 million grid points over 8 h. The prediction results of the neural network emulator were compared with the simulated results of CBM-Z module in GNAQPMS. The correlation diagram of predicted results for 17 typical species is shown in Figure 2 (the correlation diagram for all species is shown in Supplementary Figure S2). Figure 2 lists the testing performance of 17 key species in atmospheric photochemical reactions. The R2 of oxidizing or reducing inorganic gases such as nitric acid (HNO3), NO2, NO, O3, sulfur dioxide (SO2) and carbon monoxide (CO) was approximately 0.99. The R2 of active radicals such as OH, HO2 and lumped peroxy radical (RO2) was above 0.96. However, they seem to have slight disagreement when the number of testing set are high. OH, HO2, and RO2 are the three most reactive free radicals in the photochemical reactions. They react violently during the day and stay for a short time, so that the concentration remaining in the atmosphere is very low. Small changes of them make the emulator difficult to capture, leading to the slight disagreement of some data. Note that OH tendency is not strongly related to its initial concentrations. This is one important reason for OH larger errors than other species in this study. Although they have slight disagreement when the number of testing set is high, the overall prediction effect is still good. These reactive species were produced and consumed rapidly in specific chemical reactions, but the emulator could still predict the simulated values of the original atmospheric chemical transport model, indicating that this neural network emulator was capable of generalization. The R2 values of formaldehyde, ethylene, toluene and other organic compounds were all above 0.95, and the RMSE values of all species were less than 0.001 ppb. We found that although we used concentration change as the prediction object for the very short species OH, the absolute concentration obtained after adding the initial concentration also achieved a good simulation effect (Supplementary Figure S3). The R2 is approximately 1.00. As shown in the scatter plot, the original simulated values of most testing data in the CBM-Z module and predicted values in the emulator are very close. Some species, namely xylene (XYL), toluene (TOL), and nitrous acid (HONO), have some single-digit fluctuations against the predicted values, which may be due to the unequal sample distribution of the original dataset. However, the existing results are sufficient to show that the trained neural network emulator can well simulate most of the data characteristics of the gas phase chemistry module in the global atmospheric chemistry transport model. At the same time, we use the scatter diagram (Figure 3) to analyze the relationship between the concentration change of O3, NOx and volatile organic compounds (VOCs) per minute in the first layer of the CBM-Z module (ground-100 m above ground level). The emulator simulated the changing relationship between NOx, VOCs, and O3 simulated in CBM-Z module well. With the increase of the reducted concentration of NOx and VOCs, the formation concentration of ozone was significantly accelerated. The neural network simulator can well reflect the relationship between O3 and the precursor in CBM-Z module, which confirms that the emulator has learned the rapid change in the chemical process.
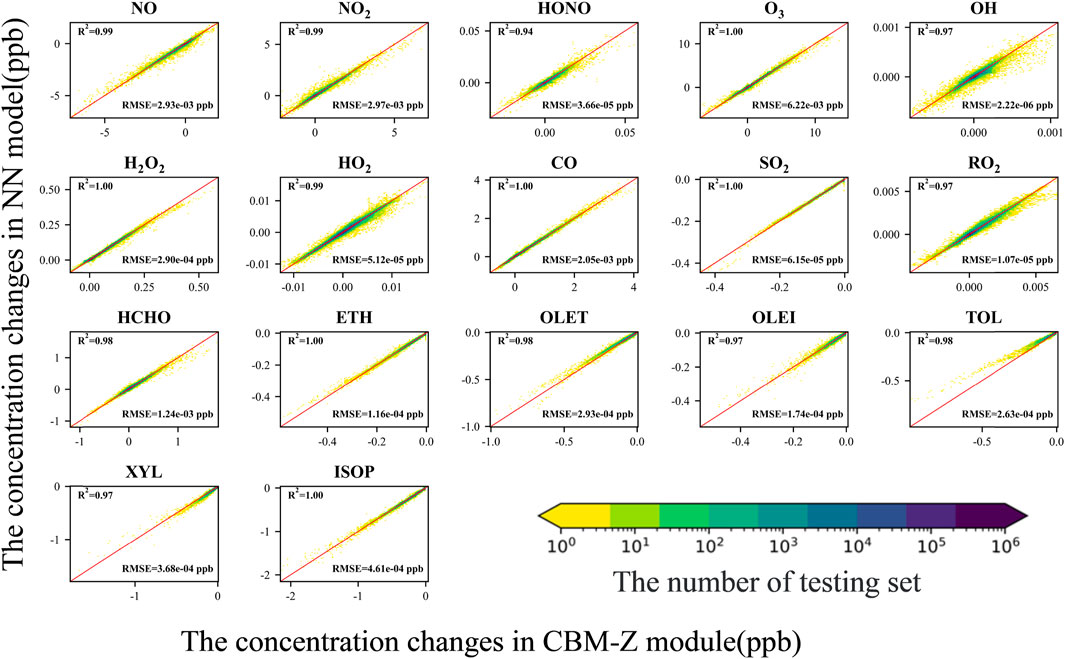
FIGURE 2. Density scatter diagram of 17 key photochemical species concentration changes predicted by the neural network emulator (y-axis) and the true value simulated by the CBM-Z module in GNAQPMS (x-axis). The color of the scatter represents the number of the testing data. The red solid lines are the 1:1 line.
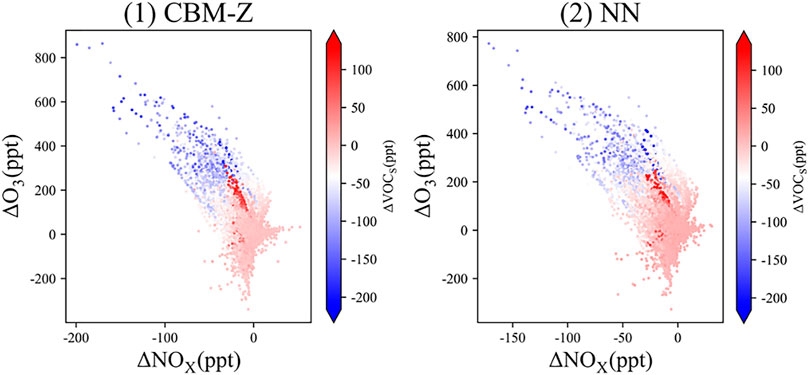
FIGURE 3. Scatter diagram of relationships between the mean concentration change per minute at 100 m above ground level of NOx, VOCs (C2H6, CH3O2, ETHP, HCHO, CH3OH, ANOL, CH3OOH, ETHOOH, ALD2, HCOOH, RCOOH, PAR, AONE, MGLY, ETH, OLET, OLEI, TOL, XYL (the major VOCs) and O3 simulated by CBM-Z module and neural network (NN) emulator. The color of the scatter represents the change in the concentration of VOCs.
Figure 4 compares the running time of a single CPU core running the CBM-Z module of GNAQPMS (CBM-Z-1CPU), a single CPU core (NN-1CPU) and a single GPU core (NN-1GPU) running the neural network emulator to simulate gas phase chemistry on 518.4 million individual grid cells (global simulation of 20 vertical layers at 0.5° × 0.5° horizontal resolution). As shown in the figure, the simulation speed of the trained neural network emulator is approximately 300 times faster than that of the CBM-Z module using one CPU core hardware simultaneously. The trained neural network emulator running on a single GPU was approximately 750 times faster than the CBM-Z module running on a single CPU. Therefore, the trained neural network emulator can not only accurately simulate the gas phase chemical process in GNAQPMS, but can also greatly accelerate the simulation of the gas phase chemical process.
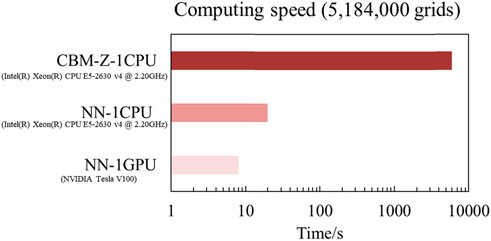
FIGURE 4. Comparison diagram of the running time of a single CPU core running the CBM-Z module of GNAQPMS (CBM-Z-1CPU), a single CPU core (NN-1CPU) and a single GPU core (NN-1GPU) running the neural network emulator to simulate gas phase chemistry on 518.4 million individual grid cells (global simulation of 20 vertical layers at 0.5 ° × 0.5 ° horizontal resolution).
3.2 Evaluation of spatial simulation effect of key species
To more obviously verify the neural network emulator’s simulation and feature capture capability of atmospheric gas phase photochemical reaction process, this study screened daytime testing data based on photolysis rate (lattice photolysis rate is not 0) from the testing dataset to evaluate the spatial simulation effect. The mean value of concentration change per minute was calculated for each grid point. Finally, we obtained high resolution global daily mean concentration change (0.5° × 0.5° grid points). For species with shorter life spans, the concentration change can reflect the strength of photochemical reaction and the rate of formation of the species, which is in line with the differential equation of chemical dynamics solution. Since near-surface pollution features are more concentrated and chemical processes are highly reactive, we mainly analyzed the change rate of horizontal concentration at the first layer of atmospheric chemical transport model (ground-100 m above ground level), to more accurately explore the ability of neural network simulator to capture the rapid change process of chemical reactions. Figure 5 shows the daytime average value of surface (100 m above ground level) O3, NOx (NO and NO2), and OH concentration changes predicted by CBM-Z mechanism gas chemistry module of GNAQPMS and neural network (NN) emulator, and the deviation of the predicted values of the two emulators. O3 with a longer life has a strong photochemical oxidation in the atmosphere. Anthropogenic emissions near the ground rapidly generate and accumulate NOx and VOCs, which are the precursors of ozone (Sillman and He, 2002; Ding et al., 2022; Zhang et al., 2022), and thus accelerate the generation of O3. As evident from the spatial distribution shown in Figure 6, the neural network emulator can well capture and fit the data characteristics, simulate the ozone generation and change trend of each region on land, and achieve a good simulation of each region in the world at the same time. NOx with long life spans will be rapidly consumed under lighting effects, and is the main precursor of O3 (Zhang et al., 2020). The neural network emulator can simulate the loss of NOx in each region. The deviation of the emulator’s prediction of spatial distribution mainly comes from the spatial distribution of concentration change in original CBM-Z module. The high deviation area is related to the concentration distribution of the original CBM-Z module. The NOx concentration changes greatly and the reaction is severe mainly in Eastern Asia, Southern Asia, central North America, Southern Africa, the Eastern coast of South America and central Europe. The neural network emulator underestimates the concentration change of NOx in some ocean areas and overestimates NOx in some coastal areas. This may be because the more concentrated pollution characteristics in the land area made the emulator strengthen the learning of the more active NOx chemical reaction process in the land area during the training process, which lead to the overestimation phenomenon in some coastal areas. However, due to the inobvious pollution characteristics and weak chemical change process in the ocean region, the emulator covered up the learning of the relatively active chemical reaction process in some ocean regions in the training process, resulting in the underestimation of the concentration change in some ocean regions. With an extremely short life of only a millisecond and the most important oxidizing species, OH is mainly produced during the photolysis of ozone, HONO, and formaldehyde and participates in a variety of photochemical reactions (Alicke et al., 2003; Elshorbany et al., 2010; Waring and Wells, 2015). Although learning the tendency for OH is somewhat meaningless, OH tendency performance was still evaluated because of its key role in aqueous and aerosol chemistry (Elshorbany et al., 2010; Song et al., 2019). The neural network emulator can well predict its generation and loss, and achieves almost the same simulation effect as the CBM-Z module. In addition, we further analyzed the simulation effect of neural network emulator on horizontal distribution at different heights above ground level (380 m, 1060 m, 2220 m) (Supplementary Figure S4). The neural network simulated the concentration changes of three key oxidizing species at different heights well. As the height increases, the emulator’s simulation deviation is consistent with the near-surface. For OH, the emulator sensitively predicted slight increase and decrease in concentration at different heights, further demonstrating that the emulator can well capture the concentration change process of key oxidizing species at different heights. These results are sufficient to demonstrate that the neural network can extract input features differently and accurately simulate the pollution situation in each region.
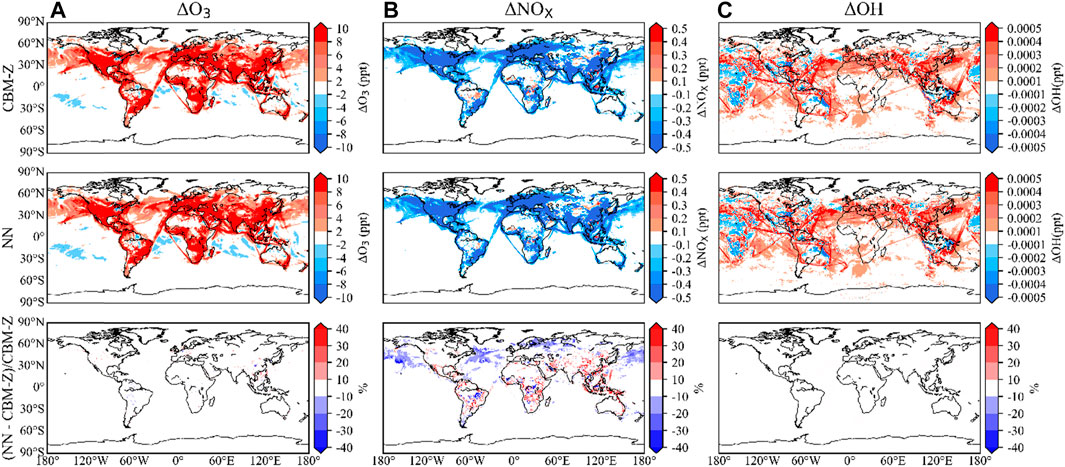
FIGURE 5. Comparison diagram of spatial distribution of daytime mean ground concentration changes (100 m above ground level) of O3 (A), NOx (B) and OH (C) simulated by CBM-Z module and neural network (NN) emulator and the deviation of the predicted values of the two emulators.
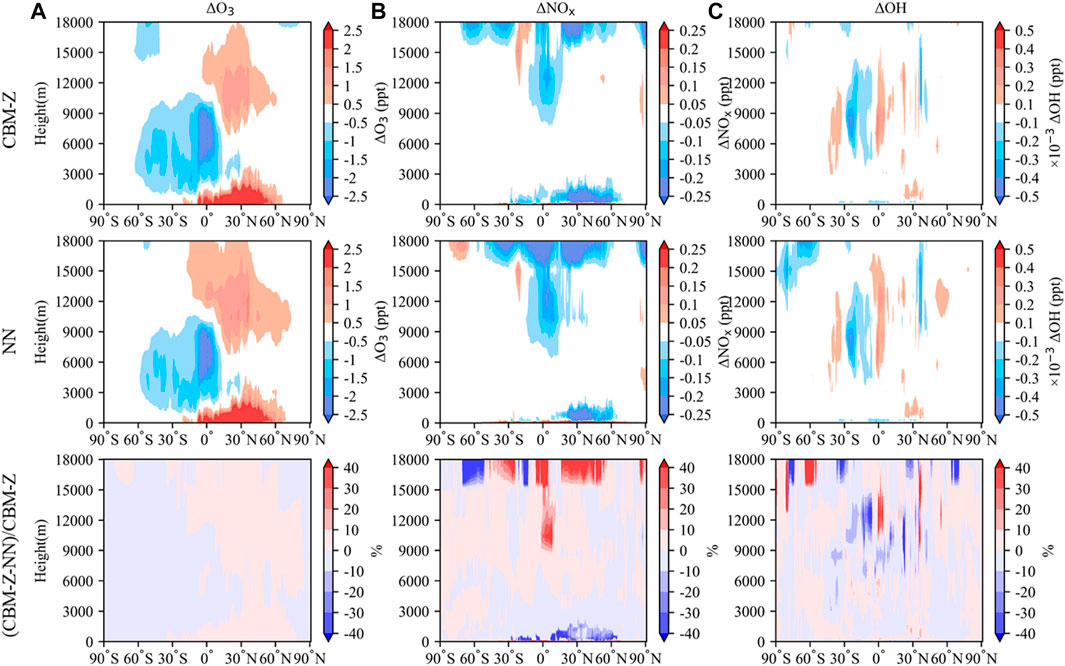
FIGURE 6. Vertical section of concentration changes of O3 (A), NOx (B) and OH (C) at 5:00-5:20 UTC simulated by CBM-Z module and neural network (NN) emulator and the deviation of the predicted values of the two emulators.
In addition, we analyzed the daily mean concentration changes of O3, NOx and OH at different vertical altitudes, and calculated the mean concentration changes per minute at different latitudes by averaging each longitude. Finally, we obtained the vertical profiles of global distribution of concentration changes of three major photooxidant species. Figure 6 shows the concentration changes of O3, NOx, and OH at different heights predicted by CBM-Z mechanism gas phase chemistry module in GNAQPMS and neural network (NN) emulator at 5:00–5:20 UTC in the testing dataset. As shown in Figure 6, the neural network emulator can well simulate the transmission of stratospheric O3 to troposphere (Zhao et al., 2021). It can also simulate the generation and loss of near-ground O3 and NOx as well as the minuscule and rapid change trend of active OH radicals at different altitudes. The simulation effect of neural network emulator can well reproduce the simulation effect of CBM-Z module in GNAQPMS. These results show that the neural network emulator can accurately simulate the gas phase photochemical process at different altitudes by effectively learning the characteristic information provided by the CBM-Z module dataset.
3.3 Evaluation of emulated temporal variation of different cities
The neural network emulator’s prediction effect for different urban regions around the globe directly reflects the possibility of replacing the gas phase chemistry module of atmospheric chemistry transport model and the simulation effect of multiple regions. Stronger and more obvious pollution characteristics are helpful for us to see the learning effect of the neural network emulator on chemical reaction processes from the results. To explore the neural network’s potential to simulate the gas phase chemical reaction in the process of daily variation, we compared the predicted concentration changes of grid points of four large cities with large population density and obvious pollution characteristics in the first layer of vertical height (100 m above ground level), and analyzed the prediction performance of the neural network emulator for the same grid point at different test times, and different grid points at the same time. Figure 7 shows the daily concentration change trend of the main photooxidants (O3, NOx, and OH) in four cities (Beijing, Shanghai, Chengdu, and New York) simulated by the neural network emulator and CBM-Z module. In the figure, the red shaded part is the prediction result of the testing dataset, and the other white shaded part is the prediction result of the training dataset. The red broken line represents the simulated diurnal concentration change trend of the CBM-Z module, and the blue broken line represents the simulated diurnal concentration change trend of the neural network emulator. As shown in Figure 7, the neural network can well simulate the diurnal variation characteristics of all cities. For O3 and NOx, the diurnal concentration change trend of CBM-Z modules in four cities and that of the neural network emulator are almost identical, thereby indicating that the neural network can accurately predict the change trend of gas phase pollutant concentration. The concentration change of the very short-lived species OH is approximately 10–5 and the relative change is very small. The neural network emulator has certain underestimated or overestimated results, which may have been caused by the unbalanced dataset and the rapid change of OH. In New York, when the change of OH is very small (near 0), the neural network has a large fluctuation. When the predicted concentration of CBM-Z increases, the neural network predicts a decreasing trend of the concentration. It may be due to the large concentration change of NOx at the same time and the small data distribution of data containing the large change of NOx generation concentration in the original training dataset. Strong learning of other more obvious input features causes more obvious interference to the learning process of sensitive OH, leading to the opposite prediction effect of OH. Overall, the emulator can still well predict the diurnal variation trend and decline inflection point, which indicates that it can well learn the relationship between photolytic rate, meteorological parameters, initial concentration, and concentration change, and characterize the change characteristics of different species, to predict the concentration changes in shorter time step and achieve accurate simulation and prediction of multiple grid points at the same time.

FIGURE 7. Diurnal variation diagram of CBM-Z and neural network (NN) emulator simulation effect in four cities (Bei Jing, BJ; Shang Hai, SH; Cheng Du, CD; New York, NY) at 100 m above ground level. The red shaded part is the prediction effect of testing dataset, and the other white shaded part is the prediction effect of training dataset. The red broken line represents the simulated diurnal concentration change trend of CBM-Z module, and the blue broken line represents the simulated diurnal concentration change trend of the neural network emulator.
In addition, we further analyzed the simulation effect of these four cities at different heights. Figure 8 shows the vertical profile of the 20-min daytime mean concentration changes of O3, NOx, and OH in the 8-h testing dataset predicted by the CBM-Z module and neural network emulator. The neural network emulator can well reproduce the vertical distribution of ozone and nitrogen oxide in the four different regions of CBM-Z module. There is a slight difference between the prediction of OH concentration changes predicted by the CBM-Z above 5000 m in different cities. The life of OH is very short compared to that of other species, so the magnitude of concentration change is very different from other species. Firstly, OH in the stratosphere and the top of the troposphere mainly comes from the photolysis of stratospheric ozone and its downward transport, which is closely related to humidity, photolysis and temperature, and the reaction is relatively rapid and lively. Secondly, the chemical reaction change process of most other species near the ground is obviously stronger than that of the upper troposphere and the stratosphere. However, OH at different altitudes is strongly reactive. The weak change process of other species at high altitudes may make the emulator poor in learning the fast change of OH. Therefore, the emulator is difficult for the neural network to capture the rapid change of OH in the upper troposphere and lower stratosphere. But the deviation is very small, about 0.0001–0.005 ppt. Overall, the neural network emulator can also well simulate the vertical distribution characteristics of OH in different urban regions. Therefore, the neural network emulator can reproduce not only the CBM-Z module’s global simulation of the concentration changes of key gas phase chemical reactions, but also the simulation process under different vertical heights and complex atmospheric conditions.
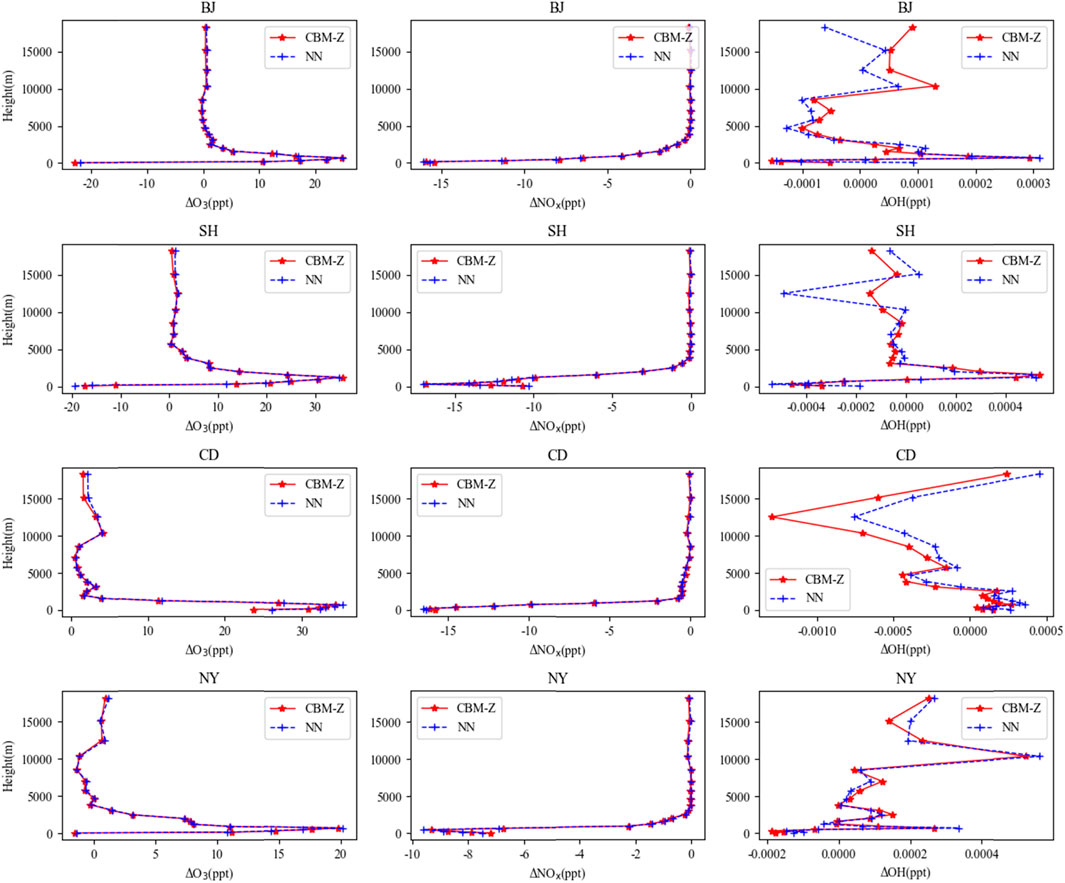
FIGURE 8. Vertical profile of the 20-min daytime average concentration changes of O3, NOx, OH in the 8-h testing dataset predicted by CBM-Z module and neural network emulator in four cities (Bei Jing, BJ; Shang Hai, SH; Cheng Du, CD; New York, NY). The red broken line represents the simulated diurnal concentration change of CBM-Z module, and the blue broken line represents the simulated diurnal concentration change of the neural network emulator.
4 Conclusion
We constructed a neural network based on the gas phase chemical mechanism (CBM-Z) in a three-dimensional air quality model to predict more cross-life reactive species concentration changes in shorter time steps at a higher global resolution. The structure of the emulator used in this study has been proved by previous studies to avoid gradient disappearance, gradient explosion, model degradation, and other problems in the process of neural network deep training (He et al., 2016). It can simulate the nonlinear relationship between multiple inputs and multiple outputs of original dataset in deeper neural network structure. The skipping connection in this emulator is very similar to the solving process of ODEs. This neural network emulator running on one CPU core is approximately 300 times faster than the CBM-Z module, and the neural network emulator running on a single GPU is approximately 750 times faster than the CBM-Z module running on a single CPU. The neural network emulator can simulate the global gas phase chemical process at a higher speed.
We evaluated the performance of the emulator using a dataset consisting of 47 species and covering the entire troposphere (0–20 km above ground level) generated by a global chemical transport model (GNAQPMS). The emulator was able to predict the evolution of concentration changes of 47 chemical species all 124 million grid cells of the global model domain over time. The average correlation coefficient square between the emulator and CBM-Z module of GNAQPMS for the predicted 20-min concentration changes of 47 species exceeded 0.97. The RMSE were all within 0.001 ppb. The correlation coefficients square of O3, H2O2, NO, NO2, OH, and HO2 were all above 0.96, indicating that the neural network emulator can well reproduce the simulation ability of CBM-Z gas phase chemistry module in GNAQPMS.
We conducted simulation analysis on the concentration changes of O3, NOx, and OH of key oxidizing species in photochemical reactions of different heights, different regions, different time and different cities. The results of spatial distribution, temporal variation and vertical profile show that the simulation performance of the neural network emulator is consistent with that of the CBM-Z module. It was confirmed that the neural network emulator can effectively learn the characteristic information provided by the CBM module dataset, and accurately simulate the gas phase photochemical process of different heights, different times and different cities. Based on deep learning, we reproduce the concentration changes of shorter single timestep for more active multi-species in global gas chemistry modules with high speed and precision. We reproduced short-term concentration trends of more reactive multi-species in global gas chemistry modules with high speed and precision. The neural network emulator in this study can well capture the rapid concentration change and numerical integration processes of more active species in the process of gas phase chemical reaction.
The neural network emulator established in this study to replace the gas phase chemistry module in GNAQPMS is a useful tool model, which has preliminarily realized a short single time-step gas chemistry simulation. However, its simulation performance in entire air pollution real-simulation applications still needs to be explored (both in terms of speedup and skill). The main limitation of this study is that the time coverage scale of the dataset is insufficient, which may lead to deviations in the future long-term simulation process. In the future, we will train global high-resolution datasets covering longer time and evaluate the long-term simulation effects. At the same time, we will explore the more proper cause of deviations through appropriate perturbation of input parameters in the future study and try to couple the gas phase chemistry emulator into the 3-dimensional global CTMs to simulate the whole process of long-term air pollution. Deploying the NN emulator into CTMs could decrease the emulator performance over time because of the compounding errors. Overall, our work provides an additional path to a more efficient atmospheric chemical simulation and prediction at a high resolution.
Data availability statement
The raw data supporting the conclusion of this article will be made available by the authors, without undue reservation.
Author contributions
Conceptualization, JL and LW; methodology, JL and LW; software, JL and LW; formal analysis, ZXW and MMZ; investigation, ZXW; writing—original draft preparation, ZXW; project administration, ZFW, JL, and LW; writing—review and editing, ZXW, JL, LW, MMZ, YJZ, and ZLY; supervision, ZFW, JL, and LW. All authors have read and agreed to the published version of the manuscript.
Funding
This study was supported by the Cultivating Project of Strategic Priority Research Program of Chinese Academy of Sciences (XDPB 1903), the National Natural Science Foundation of China (No. 92044302), the Strategic Priority Research Program of the Chinese Academy of Sciences (Grant No. XDA19040202), The Informatization Plan (Grant No. CAS-WX2021SF-0107) and the Pioneer Hundred Talents Program of the Chinese Academy of Sciences.
Acknowledgments
We thank the National Key Scientific and Technological Infrastructure project “Earth System Science Numerical Simulator Facility” (EarthLab).
Conflict of interest
The authors declare that the research was conducted in the absence of any commercial or financial relationships that could be construed as a potential conflict of interest.
Publisher’s note
All claims expressed in this article are solely those of the authors and do not necessarily represent those of their affiliated organizations, or those of the publisher, the editors and the reviewers. Any product that may be evaluated in this article, or claim that may be made by its manufacturer, is not guaranteed or endorsed by the publisher.
Supplementary material
The Supplementary Material for this article can be found online at: https://www.frontiersin.org/articles/10.3389/fenvs.2022.955980/full#supplementary-material
References
Abadi, M., Barham, P., Chen, J., Chen, Z., Davis, A., Dean, J., et al. (2016). “Tensorflow: A system for large-scale machine learning,” in Proceedings of the 12th USENIX conference on operating systems design and implementation, 265–283.
Abdelouahab, K., Pelcat, M., and Berry, F. (2017). “Phd forum: Why tanh is a hardware friendly activation function for CNNs,” in 11th international conference on distributed smart cameras (Vienna, Austria: ICDSC), 199–201. Acm.
Alicke, B., Geyer, A., Hofzumahaus, A., Holland, F., Konrad, S., Patz, H. W., et al. (2003). OH formation by HONO photolysis during the berlioz experiment. J. Geophys. Res. 108, 8247. doi:10.1029/2001jd000579
Binkowski, F. S., and Roselle, S. J. (2003). Models-3 community Multiscale Air quality (CMAQ) model aerosol component - 1. Model description. J. Geophys. Res. 108, 2001JD001409. doi:10.1029/2001jd001409
Brasseur, G. P., and Kumar, R. (2021). Chemical weather and chemical climate. AGU Adv. 2, e2021AV000399. doi:10.1002/essoar.10506601.1
Byun, D. W., and Ching, J. (1999). Science algorithms of the EPA models-3 community Multiscale Air quality (CMAQ) modeling system. Nerl.
Byun, D. W., and Dennis, R. (1995). Design artifacts in eulerian air quality models: Evaluation of the effects of layer thickness and vertical profile correction on surface ozone concentrations. Atmos. Environ. 29, 105–126. doi:10.1016/1352-2310(94)00225-A
Chen, H. S., Wang, Z. F., Li, J., Tang, X., Ge, B. Z., Wu, X. L., et al. (2015). GNAQPMS-Hg V1.0, a global nested atmospheric mercury transport model: Model description, evaluation and application to trans-boundary transport of Chinese anthropogenic emissions. Geosci. Model Dev. 8, 2857–2876. doi:10.5194/gmd-8-2857-2015
Crowther, P. S., and Cox, R. J. (2005). “A method for optimal division of data sets for use in neural networks,” in Knowledge-based intelligent information and engineering systems (Springer Berlin Heidelberg), 1–7.
Damian, V., Sandu, A., Damian, M., Potra, F., and Carmichael, G. R. (2002). The kinetic preprocessor KPP- a software environment for solving chemical kinetics. Comput. Chem. Eng. 26, 1567–1579. doi:10.1016/s0098-1354(02)00128-x
Ding, D., Xing, J., Wang, S., Dong, Z., Zhang, F., Liu, S., et al. (2022). Optimization of a NOx and VOC cooperative control strategy based on clean air benefits. Environ. Sci. Technol. 56, 739–749. doi:10.1021/acs.est.1c04201
Elshorbany, Y., Barnes, I., Becker, K. H., Kleffmann, J., and Wiesen, P. (2010). Sources and cycling of tropospheric hydroxyl radicals - an overview. Z. für Phys. Chem. 224, 967–987. doi:10.1524/zpch.2010.6136
Fiore, A. M., Naik, V., Spracklen, D. V., Steiner, A., Unger, N., Prather, M., et al. (2012). Global air quality and climate. Chem. Soc. Rev. 41, 6663–6683. doi:10.1039/c2cs35095e
Gery, M. W., Whitten, G. Z., Killus, J. P., and Dodge, M. C. (1989). A Photochemical Kinetics Mechanism for Urban and Regional Scale Computer Modeling. J. Geophys. Res.: Atmos. 94, 12925–12956. doi:10.1029/JD094iD10p12925
Glorot, X., and Bengio, Y. (2010). Understanding the difficulty of training deep feedforward neural networks. J. Mach. Learn. Res. 9, 249–256.
Grell, G. A., Peckham, S. E., Schmitz, R., Mckeen, S. A., Frost, G., Skamarock, W. C., et al. (2005). Fully coupled "online" chemistry within the wrf model. Atmos. Environ. 39, 6957–6975. doi:10.1016/j.atmosenv.2005.04.027
He, K., Zhang, X., Ren, S., and Sun, J. (2016). “Deep residual learning for image recognition,” in 2016 IEEE conference on computer vision and pattern recognition (CVPR) (IEEE), 770–778.
Hesstvedt, E., Hov, O., and Isaksen, I. S. A. (1978). Quasi-steady-state approximations in air pollution modeling: Comparison of two numerical schemes for oxidant prediction. Int. J. Chem. Kinet. 10, 971–994. doi:10.1002/kin.550100907
Hochbruck, M., Lubich, C., and Selhofer, H. (1998). Exponential integrators for large systems of differential equations. SIAM J. Sci. Comput. 19, 1552–1574. doi:10.1137/s1064827595295337
Huang, C-J., and Kuo, P-H. (2018). A deep CNN-LSTM model for particulate matter (Pm2.5) forecasting in smart cities. Sensors 18, 2220. doi:10.3390/s18072220
Kampa, M., and Castanas, E. (2008). Human health effects of air pollution. Environ. Pollut. 151, 362–367. doi:10.1016/j.envpol.2007.06.012
Keller, C. A., and Evans, M. J. (2019). Application of random forest regression to the calculation of gas-phase chemistry within the geos-chem chemistry model V10. Geosci. Model Dev. 12, 1209–1225. doi:10.5194/gmd-12-1209-2019
Kelp, M. M., Jacob, D. J., Kutz, J. N., Marshall, J. D., and Tessum, C. W. (2020). Toward stable, general machine‐learned models of the atmospheric chemical system. J. Geophys. Res. Atmos. 125, e2020JD032759. doi:10.1029/2020jd032759
Kelp, M. M., Tessum, C. W., and Marshall, J. D. (2018). Orders-of-Magnitude speedup in atmospheric chemistry modeling through neural network-based emulation. arXiv. arXiv:1808.03874.
Kim, J-H. (2009). Estimating classification error rate: Repeated cross-validation, repeated hold-out and bootstrap. Comput. Statistics Data Analysis 53, 3735–3745. doi:10.1016/j.csda.2009.04.009
Lei, Y., Yue, X., Liao, H., Gong, C., and Zhang, L. (2020). Implementation of yale interactive terrestrial biosphere model V1.0 into geos-chem V12.0.0: A tool for biosphere-chemistry interactions. Geosci. Model Dev. 13, 1137–1153. doi:10.5194/gmd-13-1137-2020
Li, J., Wang, Z., Akimoto, H., Yamaji, K., Takigawa, M., Pochanart, P., et al. (2008). Near-ground ozone source attributions and outflow in central eastern China during Mtx2006. Atmos. Chem. Phys. 8, 7335–7351. doi:10.5194/acp-8-7335-2008
Li, J., Wang, Z., Wang, X., Yamaji, K., Takigawa, M., Kanaya, Y., et al. (2011). Impacts of aerosols on summertime tropospheric photolysis frequencies and photochemistry over central eastern China. Atmos. Environ. 45, 1817–1829. doi:10.1016/j.atmosenv.2011.01.016
Li, J., Wang, Z., Zhuang, G., Luo, G., Sun, Y., and Wang, Q. (2012). Mixing of asian mineral dust with anthropogenic pollutants over east Asia: A model case study of a super-duststorm in march 2010. Atmos. Chem. Phys. 12, 7591–7607. doi:10.5194/acp-12-7591-2012
Li, J., Yang, W., Wang, Z., Chen, H., Hu, B., Li, J., et al. (2016a). Modeling study of surface ozone source-receptor relationships in east Asia. Atmos. Res. 167, 77–88. doi:10.1016/j.atmosres.2015.07.010
Li, M., He, L., and Lin, Z. (2020). “Implicit euler skip connections: Enhancing adversarial robustness via numerical stability,” in International conference on machine learning (ICML) (CA, USA: PMLR).
Li, X., Peng, L., Hu, Y., Shao, J., and Chi, T. (2016b). Deep learning architecture for air quality predictions. Environ. Sci. Pollut. Res. Int. 23, 22408–22417. doi:10.1007/s11356-016-7812-9
Liao, Q., Zhu, M., Wu, L., Pan, X., Tang, X., and Wang, Z. (2020). Deep learning for air quality forecasts: A review. Curr. Pollut. Rep. 6, 399–409. doi:10.1007/s40726-020-00159-z
Linford, J. C., Michalakes, J., Vachharajani, M., and Sandu, A. (2010). Automatic generation of multicore chemical kernels. IEEE Trans. Parallel Distrib. Syst. 22, 119–131. doi:10.1109/tpds.2010.106
Linford, J. C., and Sandu, A. (2011). Scalable heterogeneous parallelism for atmospheric modeling and simulation. J. Supercomput. 56, 300–327. doi:10.1007/s11227-010-0380-8
Liu, C., Zhang, H., Cheng, Z., Shen, J., Zhao, J., Wang, Y., et al. (2021). Emulation of an atmospheric gas-phase chemistry solver through deep learning: Case study of Chinese mainland. Atmos. Pollut. Res. 12, 101079. doi:10.1016/j.apr.2021.101079
Long, M. S., Yantosca, R., Nielsen, J. E., Keller, C. A., Da Silva, A., Sulprizio, M. P., et al. (2015). Development of a grid-independent GEOS-chem chemical transport model (V9-02) as an atmospheric chemistry module for Earth system models. Geosci. Model Dev. 8, 595–602. doi:10.5194/gmd-8-595-2015
Lu, X., Zhang, L., Wu, T., Long, M. S., Wang, J., Jacob, D. J., et al. (2020). Development of the global atmospheric chemistry general circulation model BCC-GEOS-Chem V1.0: Model description and evaluation. Geosci. Model Dev. 13, 3817–3838. doi:10.5194/gmd-13-3817-2020
Madronich, S. (1987). Photodissociation in the atmosphere: 1. Actinic flux and the effects of ground reflections and clouds. J. Geophys. Res. 92, 9740–9752. doi:10.1029/JD092iD08p09740
Nurhayati, S. I., Hadihardaja, I. K., and Cahyono, M. (2014). “A study of hold-out and K-fold cross validation for accuracy of groundwater modeling in tidal lowland reclamation using extreme learning machine,” in 2014 2nd international conference on technology, informatics (Bandung, Indonesia: Management, Engineering & Environment), 228–233.
Paoletti, M. E., Haut, J. M., Plaza, J., and Plaza, A. (2019). “Solving deep neural networks with ordinary differential equations for remotely sensed hyperspectral image classification,” in IEEE international geoscience and remote sensing symposium (IGARSS) (IEEE), 576–579.
Reichstein, M., Camps-Valls, G., Stevens, B., Jung, M., Denzler, J., Carvalhais, N., et al. (2019). Deep learning and process understanding for data-driven Earth system science. Nature 566, 195–204. doi:10.1038/s41586-019-0912-1
Reyes, O., and Ventura, S. (2019). Performing multi-target regression via a parameter sharing-based deep network. Int. J. Neural Syst. 29, 1950014. doi:10.1142/s012906571950014x
Sandu, A., Daescu, D. N., and Carmichael, G. R. (2003). Direct and adjoint sensitivity analysis of chemical kinetic systems with KPP: Part I - theory and software tools. Atmos. Environ. 37, 5083–5096. doi:10.1016/j.atmosenv.2003.08.019
Sandu, A., and Miehe, P. (2010). Forward, tangent linear, and adjoint Runge-Kutta methods for stiff chemical kinetic simulations. Int. J. Comput. Math. 87, 2458–2479. doi:10.1080/00207160802676562
Seo, J., Yang, Y., Hong, Y-G., and Park, J. (2021). Transfer learning-based radar imaging with deep convolutional neural networks for distributed frequency modulated continuous waveform multiple-input multiple-output radars. IET Radar Sonar &. Navig. 15, 1209–1220. doi:10.1049/rsn2.12105
Sillman, S., and He, D. Y. (2002). Some theoretical results concerning O3-NOx-VOC chemistry and NOx-VOC indicators. J. Geophys. Res. 107, 4659. doi:10.1029/2001jd001123
Simonyan, K.,, and Zisserman, A. (2014). Very deep convolutional networks for large-scale image recognition. arXiv preprint arXiv:1409.1556,
Song, M., Zhang, C., Wu, H., Mu, Y., Ma, Z., Zhang, Y., et al. (2019). The influence of oh concentration on soa formation from Isoprene photooxidation. Sci. Total Environ. 650, 951–957. doi:10.1016/j.scitotenv.2018.09.084
Srivastava, S., Prabhu, S., Ramesh, S., Pratapneni, S., Abraham, A., and Bhandary, S. V. (2017). “Visualizing the indicators of diabetic retinopathy learnt by convolutional neural networks,” in 8th IEEE international conference on computational intelligence and computing research (IEEE ICCIC), 912–914.
Stockwell, W. R., Middleton, P., Chang, J. S., and Tang, X. Y. (1990). The second generation regional acid deposition model chemical mechanism for regional air quality modeling. J. Geophys. Res. 95, 16343–16367. doi:10.1029/JD095iD10p16343
Takase, T. (2021). Dynamic batch size tuning based on stopping criterion for neural network training. Neurocomputing 429, 1–11. doi:10.1016/j.neucom.2020.11.054
Tao, Z., Chin, M., Gao, M., Kucsera, T., Kim, D., Bian, H., et al. (2020). Evaluation of nu-wrf model performance on air quality simulation under various model resolutions – an investigation within the framework of mics-asia phase iii. Atmos. Chem. Phys. 20, 2319–2339. doi:10.5194/acp-20-2319-2020
Turco, R. P., and Whitten, R. C. (1974). A comparison of several computational techniques for solving some common aeronomic problems. J. Geophys. Res. 79, 3179–3185. doi:10.1029/JA079i022p03179
Van Dingenen, R., Dentener, F., Crippa, M., Leitaol, J., Marmer, E., Rao, S., et al. (2018). Tm5-Fasst: A global atmospheric source-receptor model for rapid impact analysis of emission changes on air quality and short-lived climate pollutants. Atmos. Chem. Phys. 18, 16173–16211. doi:10.5194/acp-18-16173-2018
Verwer, J. G., Hundsdorfer, W. H., and Blom, J. G. (2002). Numerical time integration for air pollution models. Surv. Math. Industry 114, 265–268.
Wang, H., Chen, H., Wu, Q., Lin, J., Chen, X., Xie, X., et al. (2017). Gnaqpms V1.1: Accelerating the global nested air quality prediction modeling system (gnaqpms) on intel Xeon phi processors. Geosci. Model Dev. 10, 2891–2904. doi:10.5194/gmd-10-2891-2017
Wang, H., Lin, J., Wu, Q., Chen, H., Tang, X., Wang, Z., et al. (2019). MP CBM-z V1.0: Design for a New carbon bond mechanism Z (CBM-Z) gas-phase chemical mechanism architecture for next-generation processors. Geosci. Model Dev. 12, 749–764. doi:10.5194/gmd-12-749-2019
Wang, J., and Song, G. (2018). A deep spatial-temporal ensemble model for air quality prediction. Neurocomputing 314, 198–206. doi:10.1016/j.neucom.2018.06.049
Wang, Z. F., Akimoto, H., and Uno, I. (2002). Neutralization of soil aerosol and its impact on the distribution of acid rain over east Asia: Observations and model results. J. Geophys. Res. 107, 4389. doi:10.1029/2001jd001040
Wang, Z., Maeda, T., Hayashi, M., Hsiao, L. F., and Liu, K. Y. (2001). A nested air quality prediction modeling system for urban and regional scales: Application for high-ozone episode in taiwan. Water Air Soil Pollut. 130, 391–396. doi:10.1023/A:1013833217916
Waring, M. S., and Wells, J. R. (2015). Volatile organic compound conversion by ozone, hydroxyl radicals, and nitrate radicals in residential indoor air: Magnitudes and impacts of oxidant sources. Atmos. Environ. 106, 382–391. doi:10.1016/j.atmosenv.2014.06.062
Ye, Q., Li, J., Chen, X., Chen, H., Yang, W., Du, H., et al. (2021). High-resolution modeling of the distribution of surface air pollutants and their intercontinental transport by a global tropospheric atmospheric chemistry source–receptor model (GNAQPMS-SM). Geosci. Model Dev. 14, 7573–7604. doi:10.5194/gmd-14-7573-2021
You, K., Long, M., Wang, J., and Jordan, M. I. (2019). How does learning rate decay help modern neural networks. arXiv. arXiv: 1908.01878.
Young, T. R., and Boris, J. P. (1977). A numerical technique for solving stiff ordinary differential equations associated with the chemical kinetics of reactive-flow problems. J. Phys. Chem. 81, 2424–2427. doi:10.1021/j100540a018
Zaveri, R. A., and Peters, L. K. (1999). A New lumped structure photochemical mechanism for large-scale Applications. J. Geophys. Res. 104, 30387–30415. doi:10.1029/1999jd900876
Zhang, H., Linford, J. C., Sandu, A., and Sander, R. (2011). Chemical mechanism solvers in air quality models. Atmosphere 2, 510–532. doi:10.3390/atmos2030510
Zhang, Y., Hemperly, J., Meskhidze, N., and Skamarock, W. C. (2012). The global weather research and forecasting (GWRF) model: Model evaluation, sensitivity study, and future year simulation. Atmos. Clim. Sci. 2, 231–253. doi:10.4236/acs.2012.23024
Zhang, Y., Li, J., Li, J., Pan, X., Wang, W., Zhu, L., et al. (2022). An intercomparison of ozone taken from the copernicus atmosphere monitoring service and the second modern-era retrospective analysis for research and applications over China during 2018 and 2019. J. Environ. Sci. 114, 514–525. doi:10.1016/j.jes.2022.01.045
Zhang, Y., Zhao, Y., Li, J., Wu, Q., Wang, H., Du, H., et al. (2020). Modeling ozone source apportionment and performing sensitivity analysis in summer on the North China plain. Atmosphere 11, 992. doi:10.3390/atmos11090992
Zhao, K., Huang, J., Wu, Y., Yuan, Z., Wang, Y., Li, Y., et al. (2021). Impact of stratospheric intrusions on ozone enhancement in the lower troposphere and implication to air quality in Hong Kong and other South China regions. JGR. Atmos. 126, e2020JD033955. doi:10.1029/2020jd033955
Keywords: atmospheric chemical transport model, CBM-Z, resnet, deep learning-based emulator, air quality simulation
Citation: Wang Z, Li J, Wu L, Zhu M, Zhang Y, Ye Z and Wang Z (2022) Deep learning-based gas-phase chemical kinetics kernel emulator: Application in a global air quality simulation case. Front. Environ. Sci. 10:955980. doi: 10.3389/fenvs.2022.955980
Received: 29 May 2022; Accepted: 25 July 2022;
Published: 19 August 2022.
Edited by:
Yu Wang, ETH Zürich, SwitzerlandReviewed by:
Christoph Andrea Keller, Morgan State University, United StatesGang Chen, Paul Scherrer Institute (PSI), Switzerland
Copyright © 2022 Wang, Li, Wu, Zhu, Zhang, Ye and Wang. This is an open-access article distributed under the terms of the Creative Commons Attribution License (CC BY). The use, distribution or reproduction in other forums is permitted, provided the original author(s) and the copyright owner(s) are credited and that the original publication in this journal is cited, in accordance with accepted academic practice. No use, distribution or reproduction is permitted which does not comply with these terms.
*Correspondence: Jie Li, bGlqaWU4MDc0QG1haWwuaWFwLmFjLmNu; Lin Wu, d2xpbkBtYWlsLmlhcC5hYy5jbg==