 Sajjad Raza
 Bhupinder Singh Farmaha
- Edisto Research and Education Center, Department of Plant & Environmental Sciences, Clemson University, Blackville, SC, United States
Nitrogen (N) fertilizer recommendations based on yield goals are common and do not consider variability in soil N supply between fields. Nitrogen transformations in soils are dynamic and may vary widely among different soils, climates, cropping systems, and management practices, making it difficult to provide general N recommendation rates for a region, state, or even a county. To optimize N fertilization rates for corn (Zea mays L.), eight field trials were conducted on different fields at the Edisto Research and Education Center of Clemson University in 2018–2021. The soils varied in pH, inorganic N, management practices (irrigate, dryland, cover, and no-cover crop), and climatic conditions (temperature and precipitation). Six nitrogen fertilizer rate treatments were used during 2018 and 2019, eight in 2020, and five in 2021 trials. Test sites were different in each year except in 2021 in which trials were conducted on the same site but were differentiated by multi-species and no-cover crop treatments. Nitrogen fertilizer was applied as a complete one-time dose in all trials in 2018 and 2021 and in several splits in 2019 and 2020. The corn yields generally increased with N fertilization rates; however, a strong variation of up to 4–11 Mg ha−1 existed at each N level among different fields. Based on yield responses, the eight field trials were divided into two groups: low-yielding and high-yielding sites. The low-yielding sites on average produced 3.8 Mg ha−1 of corn, which was 137% less than the corn harvested from high-yielding sites (9.0 Mg ha−1). The agronomic N use efficiency (AgNUE) in high-yielding sites was almost double (32.68 kg kg−1 N) compared to low-yielding sites (17.16 kg kg−1 N), and the differences were even wider for partial factor productivity of N (PFPN). The economic optimum N rate (EONR) remained below 300 kg N ha−1 for all sites with no marked difference among sites. However, relative yield (ratio of corn yield in unfertilized control to the N level giving the highest yield) was comparatively lower in low-yielding sites (29.45%). Baseline inorganic N, pH, and precipitation were identified as the major factors controlling corn yield responses to N fertilization. The yield variations driven by several factors make N management challenging, indicating the need for site-specific N management for corn in the southeast United States.
Introduction
Corn (Zea mays L.) is among the most widely cultivated crops worldwide (190 million ha) and is used as a food, animal feed, and biofuel source (USDA, 2022). Corn is the greatest consumer of N fertilizer worldwide (16.2%), but in the United States alone, it consumes about half of the total N fertilizer (International Fertilizer Association and International Plant Nutrition Institute, 2017). The cereal N use efficiency (NUE) in the US is the highest in the world (41%), but we are still losing about half of the N fertilizer (Omara et al., 2019), and this is leading to several soil, environmental, and ecological problems (Billen et al., 2010; Kahrl et al., 2010; Raza et al., 2021). Therefore, effective management of N fertilizer is very important to increase crop yields while keeping N losses and associated environmental risks to a minimum.
Corn responses to N fertilization depend on N availability and its uptake by crops. Nitrogen transformations depend on a wide range of factors and processes such as microbial activity, microbe-derived nitrification and denitrification processes, and soil characteristics (texture, pH, organic matter, and electrical conductivity) (Nair et al., 2021). Management practices like tillage operations, amount and method of irrigation, time, source and method of N fertilizer application, and climatic conditions like temperature, moisture, and wind speed can all strongly affect N availability in the soil (Halvorson et al., 2010). The coastal plain soils in the southeastern United States are highly weathered, with a sandy or loamy sand texture, and generally have low cation exchange capacity, water holding capacity, and organic matter (Birkeland, 1999). Crop yield responses to N application can vary significantly in coastal plain soils because of considerable variation in the soil texture, depth of clay pan, and other site characteristics (Khalilian et al., 2011). Nitrate leaching is an important N loss pathway in these soils because of warm temperatures and relatively high rainfall and drainage (Hubbard et al., 2004). All these factors make N management challenging and can lead to marked changes in optimum crop N demand every year, even in the same location.
The rising N prices and dropping corn commodity prices over time demand corn production with optimum N use. Nitrogen is the most challenging nutrient to manage optimally because its availability, losses, transport, and transformations are contributed by several factors and vary considerably within and between fields (Tremblay et al., 2012). Nitrogen fertilization generally contributes about half of the crop N uptake, another half comes from soil residual N and organic matter pools (Gardner and Drinkwater, 2009; Yan et al., 2020). Therefore, crop yield in the soil with high residual N generally does not respond to added N fertilizer (Blackmer et al., 1989; Binford et al., 1992). Overfertilization may not always produce extra grain yield; similarly, less N fertilization can lead to economic losses. Moreover, N fertilizer application at a time when the crop does not need it can lead to losses or immobilization (Wuest and Cassman, 1992). Therefore, profitable and efficient N utilization requires developing management strategies that are agronomically sound and environmentally appropriate.
As optimum N rates can differ widely, there is a need to encourage corn producers to use different N rates over the years, keeping in view the soil N levels and crop demand. Furthermore, existing N management approaches do not generally consider yearly variations in weather and their effects on indigenous N supply from soil and organic matter pools (Shanahan et al., 2008). The aim of this research was to establish eight field trials across variable soils and climatic conditions in South Carolina, United States, to 1) determine optimum N application rates to achieve higher corn yield at test sites variable in soil characteristics and climatic conditions, 2) recommend N levels yielding maximum economic returns, NUE, and relative yield, and 3) develop a relationship between corn yield, pH, residual N, and precipitation. We hypothesized that corn yield responses to various N levels will be varied depending on the soil and climatic conditions.
Materials and methods
Site description
Eight field trials were performed at the Edisto Research and Education Center, Blackville, South Carolina, United States. The research center has more than 950 ha of land, which is divided into several field plots to carry out multiple research trials every year. For this study, two different field sites were selected each year, and the experiment was continued for 4 years during 2018–2021. The average air temperature and mean precipitation in Blackville were 17.7°C and 1,174 mm, respectively, during 1991–2020 (https://www.ncei.noaa.gov). Around 42% of the precipitation occurs in the 4 months between June and September. Corn is an important crop in the region that is generally grown as a single crop in 1 year but in rotation with soybeans, cotton, and peanuts for the following years. Before and after the corn harvest, the soil is usually left fallow or cover crops are grown. Corn was planted in mid-March and harvested at the end of August or early September. The data about temperature and precipitation were collected from the weather station installed at the research station. The monthly distribution of total precipitation and average temperature changes during the 4 years of experimental periods are shown in Figure 1.
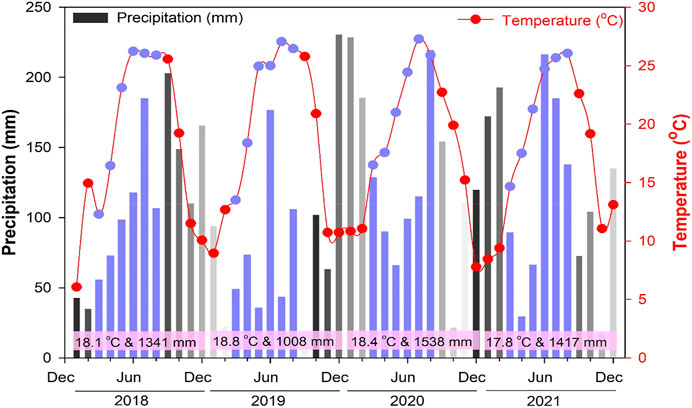
FIGURE 1. Monthly changes in temperature (°C) and precipitation (mm) during the study period. The purple-colored circled bullet points and vertical bars represent temperature and precipitation changes during the crop season (March–August). The text in rectangles above the bars shows the annual average temperature and total precipitation for a single year.
All the eight field trials had coastal plain soil, which was characterized as Varina loamy sand (Bellamy, 2009). These soils often comprised three layers: a sandy topsoil (A horizon), a sand to sandy-clay layer (E horizon), and a sandy-clay subsoil (Bt horizon). The sites have differences in pH, EC, and inorganic N contents. The basic soil chemical properties of all eight trials are given in Table 1.
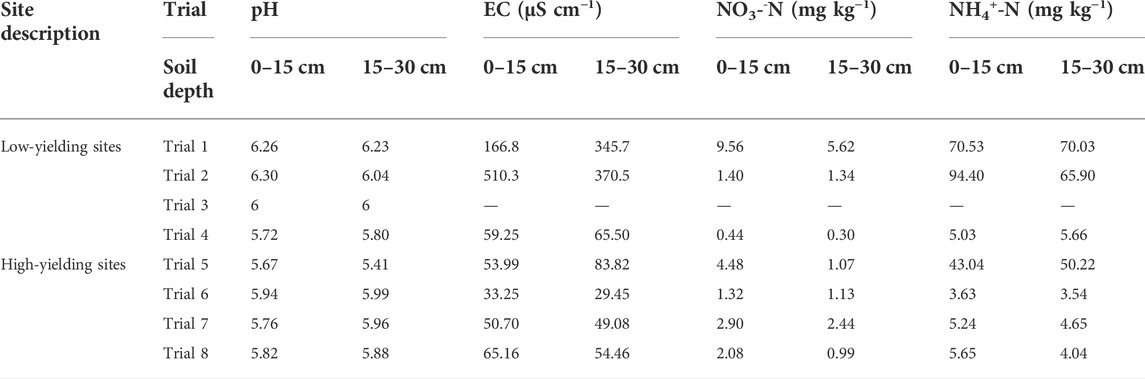
TABLE 1. Chemical properties of the coastal plain soils used in the study.
Experimental design
Six N fertilizer rates were used as treatments for the 2018 and 2019 trials, while eight rates were used in the 2020 trial, and five rates were used in the 2021 trial (Table 2). Different test sites were selected each year except in 2021 which had the same site but was differentiated by multi-cover crop and no-cover crop treatments. Nitrogen fertilizer was applied as a complete one-time dose in all trials in 2018 and 2021 and in multiple splits in 2019 and 2020. The specific details about the treatment plan, corn variety, mode of irrigation, and methods of N fertilization are given in Table 2. The area of each plot was 22.8 m2. The fertilizer was evenly broadcasted in all plots just before the time of planting. All the treatments were arranged in a randomized block design with four replications, except for the 2021 trial, which had three replications. Corn was grown by providing optimum irrigation at all trials except for the 2019 trial which had a dryland site. Crops were regularly monitored and maintained following optimum management practices same as of local farmers. Weeds and pests were controlled by applying appropriate herbicides and pesticides, respectively.
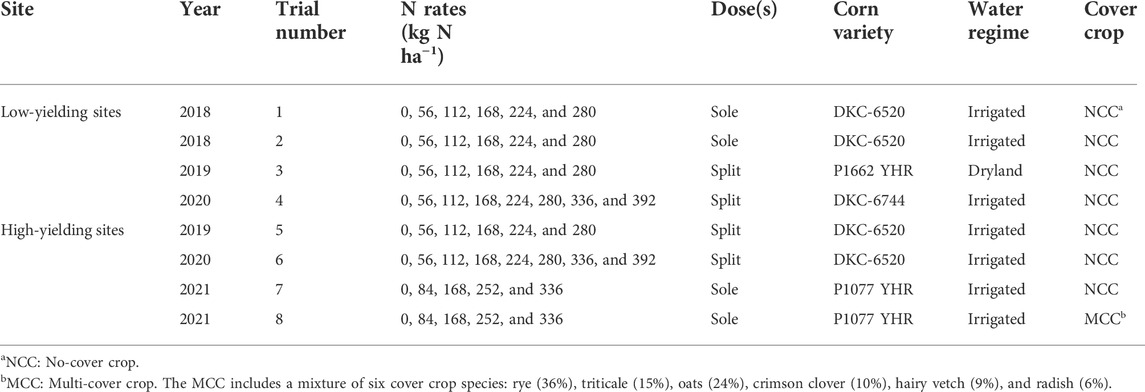
TABLE 2. Information about the sites, treatments, plot area, corn variety, and mode of water regime.
Soil sampling and analysis
Baseline soil samples were collected from each field before corn planting. The whole field was divided into four blocks, and eight soil cores were randomly taken at two depths (0–15 cm and 15–30 cm) from each block, mixed properly, and a composite soil sample was prepared. Surface soil samples (0–15 cm) were taken using an auger with an inner diameter of 4.0 cm, and subsoil samples (15–30 cm) were taken using an electric drill. Soil samples were air-dried and passed through a 2.0-mm sieve before the analysis of baseline soil characteristics (soil pH, electrical conductivity, NO3−-N, and NH4+-N). Soil pH and EC were measured at a 1:1 ratio (soil-to-water) using pH and conductivity meters, respectively. The NO3−-N and NH4+-N contents in the soil samples were extracted using 1 M KCl with a soil-to-solution ratio of 1:10, followed by 1 h shaking and then analyzed using a Timberline flow analyzer (TL-2900).
Plant sampling and corn yield
The corn yield was measured using a plot combine by harvesting 12 m length of the middle two rows. Test weight and moisture content were measured using the grain moisture meter, and yields were adjusted to 15.5% moisture content.
Nitrogen use efficiency indexes
Agronomic N use efficiency and partial factor productivity of N were calculated using the following equations:
where YN and Y0 are the corn yield (kg ha−1) in the N fertilized treatment and non-fertilized control. N Applied is total fertilizer N input (kg N ha−1).
Economic optimum N rate and relative yield
Economic optimum N fertilization rate (EONR) is the level where the last N increment gives a yield that is sufficient enough to pay for the cost of extra N added. The quadratic model was most appropriate to describe the corn yield response to N fertilizer which we used to calculate the EONRs. (Scharf et al., 2005; Nyiraneza et al., 2010). The quadratic model fits data better with less bias than other models (square root and exponential) (Bélanger et al., 2000). The EONR was quantified by taking the first derivative of the N response curve equal to the ratio between the N fertilizer and the corn grain price ($1.55 kg−1 N: $0.155 kg−1 grain). Relative yield is defined as the maximum (numerically highest) treatment yield mean among all treatment yield means, including the unfertilized control (Breker et al., 2019). Relative yield was quantified by dividing the plot corn yield in an unfertilized control by the treatment giving the highest average corn yield within each site.
where RY is relative yield, Y0 is the yield of the no-fertilization treatment (Mg ha−1), and YR is the maximum yield for a treatment, where additional N input did not result in a yield increase (Kitchen et al., 2017).
All the results were organized using Excel 2019. The differences among treatments with respect to the corn yield, relative yield, EONR, and N use efficiency were examined by ANOVA (analyses of variance) using the general linear model (GLM). The treatment means were compared at p ≤ 0.05 using Tukey’s HSD test. All the statistical analyses of the results were done with SPSS 18.0 (SPSS Inc., Chicago, United States).
Results
Changes in temperature and precipitation
The average annual temperature during 2018–2021 remained around 18.25°C in the study region (Figure 1). The temperature during the corn growing season (March–August) was higher (22°C) than the yearly average. The year 2019 (22.56°C) was hotter compared to other years. The average annual precipitation was 1,326 mm. Precipitation was above 1,300 mm in all years except 2019 which had the lowest precipitation (1,008 mm), and the same trend was observed during the corn growing season time. The precipitation in the 2019 corn growing season was 483 mm, which on average was 209 mm lower than the other 3 years, making 2019 a dry and hot year.
The overall response of corn yield to nitrogen fertilization
The overall results of the eight field experiments generally showed increases in corn yield with N fertilization (Figure 2). However, yield responses were diverse, and a strong variation existed ranging between 4 and 11 Mg ha−1 at each N level among different fields. The variation was low (between 2 and 8 Mg ha−1) at initial N levels (below 150 kg ha−1) and the differences widened greatly at higher N levels. Based on the yield responses, the eight field trials were divided into two groups: low-yielding and high-yielding (Figure 2). Both low- and high-yielding sites showed increases in corn yield with increases in N fertilization rates. However, the yield increases were significantly higher in high-yielding sites (p < 0.05). The low-yielding sites, on average, had a corn yield of 3.8 Mg ha−1, whereas the high-yielding sites produced a significantly higher corn yield of 9.0 Mg ha−1 (p < 0.05).
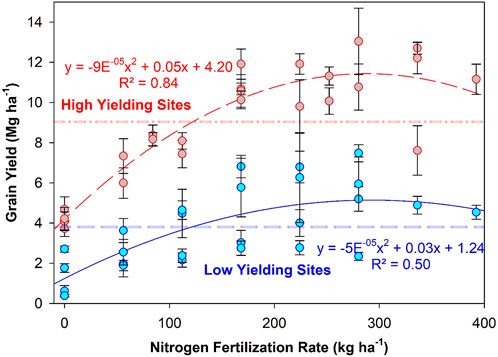
FIGURE 2. Overall response of corn yield to varied rates of N fertilization at low- and high-yielding sites. The red and blue colored outlines of circular bullet points show responses of high-yielding and low-yielding sites, respectively. The dashed-dotted red line and dashed blue line represent average corn yield at high- and low-yielding sites, respectively.
Corn yield responses to nitrogen fertilization at low-yielding sites
Corn yield at both sites (trials 1 and 2) in 2018 increased linearly (R2 > 0.95) with N fertilization levels (Figure 3). The maximum corn yield was found at the highest N level, producing 177 and 747% more grain yield than control in trials 1, and 2, respectively. The dryland site (trial 3) in 2019 did not respond well to N fertilization and had the lowest yield (1.77 Mg ha−1–2.34 Mg ha−1) among all low-yielding sites. The corn yield in dryland systems was 74% lower on average than in irrigated systems, and this yield gap increased with the rise in N input level. The corn yield in trial 4 gave a curve-like response, increasing sharply at the start till 112 kg N ha−1 and then remained relatively consistent between 5.77 Mg ha−1 and 6.26 Mg ha−1 for the next 3 N levels, and then decreased again at N levels above 300 kg N ha−1.
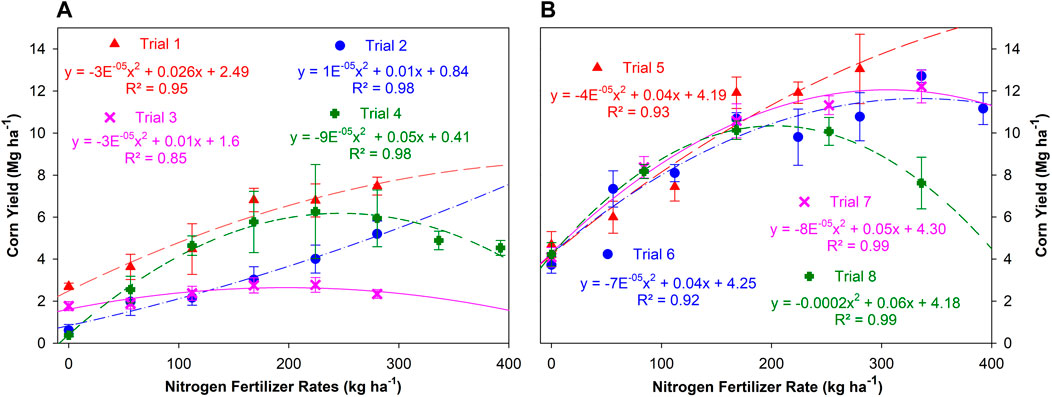
FIGURE 3. Corn yield responses to varied N rates. Subfigure (A) represents corn N response for low-yielding sites (trials 1–4), and subfigure (B) shows responses for high-yielding sites (trials 5–8). The regression equation for each trend line is represented by the same bullet and color.
Corn yield responses to nitrogen fertilization at high-yielding sites
N fertilization levels linearly (R2 = 0.93) increased corn yield (6 Mg ha−1–13 Mg ha−1) in trial 5 (Figure 3). The corn yield increases were slow at lower N levels and rose sharply at the N level of 168 kg ha−1. The corn yield at higher N levels remained relatively constant. The corn yield responses in trial 6 also showed the same pattern. The yield increased from 7.3 Mg ha−1 to 12.7 Mg ha−1, which was on average, 51% higher than the control. The yield increased sharply at N levels above 112 kg N ha−1 and thereon remained relatively constant between 10 and 12 Mg ha−1 (Figure 3).
The corn yield increased by 160% in trial 7 (with no-cover crop) and by 113% in trial 8 (multi-cover crop) in N fertilized treatments compared to control. The yield responses were nearly similar in trials 7 and 8 for initial N fertilization levels (0 kg ha−1–168 kg ha−1) (Figure 3). However, the yield gap started at N fertilization levels beyond 200 kg ha−1, with multi-cover crop fields showing yield decreases at higher N levels, and the no-cover crop fields continuing to show yield increases. The yield in the no-cover crop field was 12 and 60% higher than the multi-cover crop field at N levels of 252 kg ha−1 and 336 kg ha−1, respectively.
Agronomic N use efficiency and partial factor productivity (PFPN)
The low- and high-yielding sites showed strong differences in AgNUE (Figure 4). The AgNUE was generally at its maximum at lower N fertilization levels and decreased at higher N doses, except in trials 1, 3, and 5 (Figure 4). The average AgNUE in low-yielding sites was 17.16 kg kg−1 N (2.05–38.70 kg kg−1 N) which was about half of the AgNUE in high-yielding sites (32.68 kg kg−1 N), ranging between 10.10 and 64.52 kg kg−1 N. The AgNUE in trial 3 was the lowest and remained below 6% at all N levels. AgNUE in trial 4 started with the maximum and linearly decreased reaching the minimum at the highest N level. The AgNUE in all high-yielding sites (except trial 5) started with a maximum (∼50 kg kg−1 N) and continuously decreased with increases in N levels. Trial 5 gave a curve-like response, started with a minimum, gradually increased, reached a maximum (43 kg kg−1 N) at 168 kg N ha−1, and then decreased again.
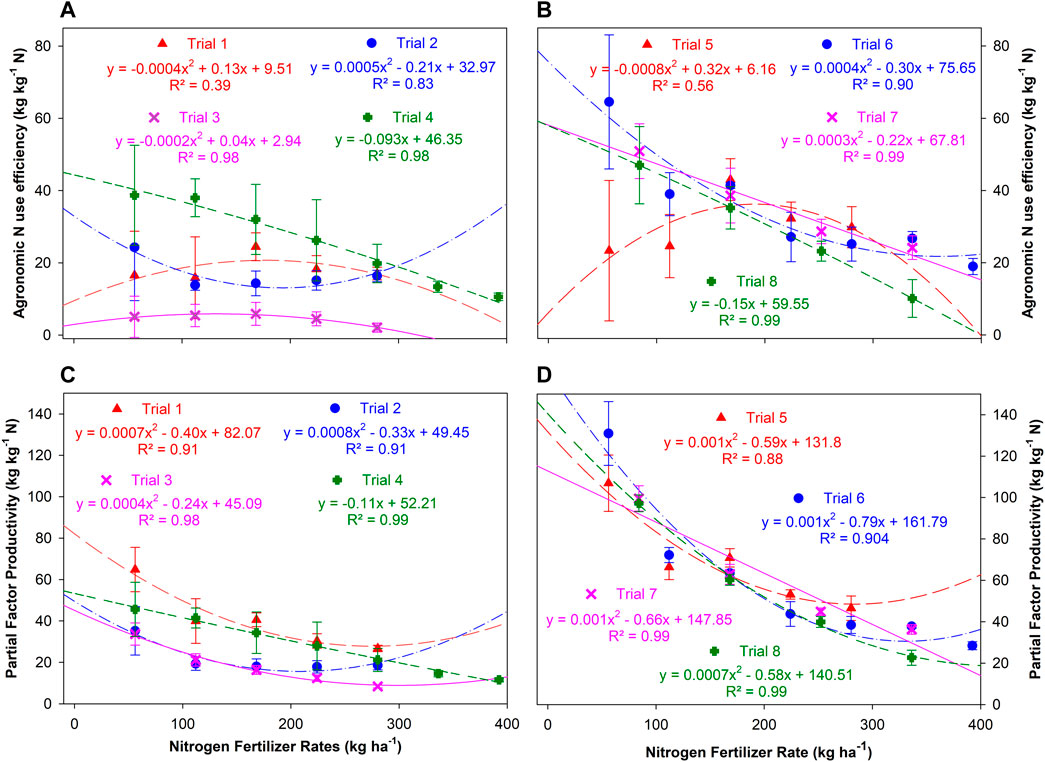
FIGURE 4. Changes in agronomic N use efficiency (A,B) and partial factor productivity (C,D) of N at variable N fertilization rates across different field trials. Subfigures (A) and (C) are low-yielding sites (trials 1–4), and subfigures (B) and (D) are high-yielding sites (trials 5–8). The regression equation for each trend line is represented by the same bullet and color.
All sites generally showed a significant negative relationship between N levels and PFPN (Figure 4). The PFPN response was maximum at the lowest N level and then gradually decreased with increments in N levels. The PFPN in low-yielding sites averaged 25.12 kg kg−1 N, ranging between 8.36 and 64.82 kg kg−1 N, which was significantly lower when compared to high-yielding sites (61.13 kg kg−1 N). The PFPN in all high-yielding sites at the lowest N level was above 97 kg kg−1 N.
Economic optimum N rate (kg N ha−1), relative yield (%), and their relationship
The EONR for all sites was generally above 200 kg N ha−1 except for two sites (trials 3 and 8) (Figure 5). There was no marked difference for EONR at both low- and high-yielding sites. The lowest EONR was 7 kg N ha−1 (trial 3), and the maximum was 280 kg N ha−1 (trials 2 and 5).
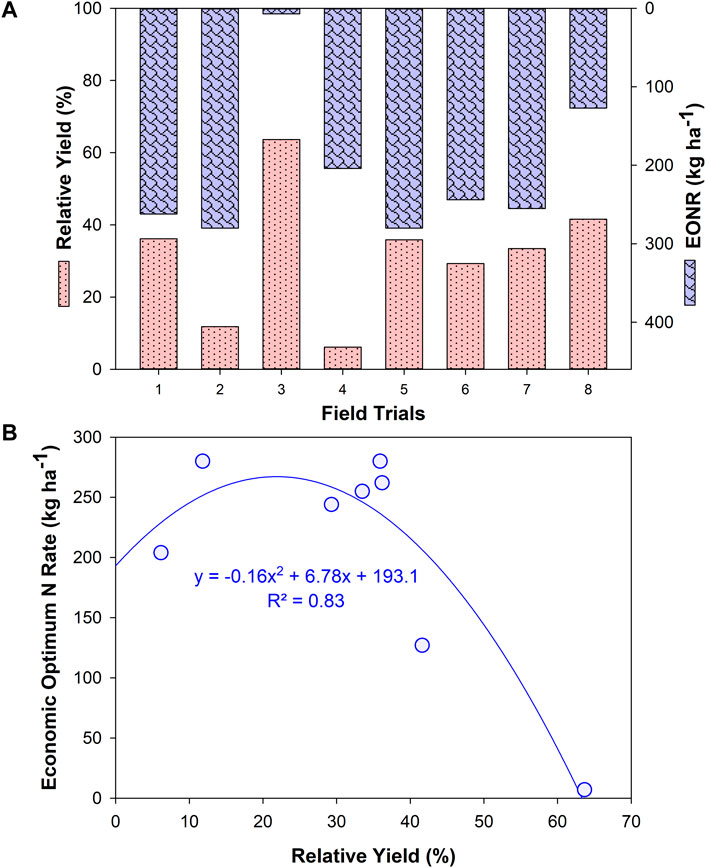
FIGURE 5. Changes in relative yield and economic optimum N rates (EONR) across low- and high-yielding sites subfigure (A). The subfigure (B) shows the relationship between relative yield and EONR.
Relative yield was on average 29.45% for low-yielding sites and 35.08% for high-yielding sites (Figure 5). All four low-yielding sites showed remarkable variations in relative yield, ranging between 6.15 and 63.66%. However, the relative yield at high-yielding sites was comparatively consistent, ranging between 29.3 and 41.6%. A significant negative relationship (R2 = 0.83) was found between relative yield and EONR. The EONR was very high (average 254 kg N ha−1) at a lower relative yield, and it decreased sharply when the relative yield increased above 36%.
Relationship between corn yield and baseline soil pH and inorganic N
Baseline soil pH had a negative relationship (R2 = 0.78) with corn yield (Figure 6). Corn yield was high and averaged 8.95 Mg ha−1 in high acidic soils with an average pH of 5.74 and decreased sharply by 59% to 3.71 Mg ha−1 when pH increased above 5.93. Baseline soil inorganic N contents were also negatively correlated (R2 = 0.64) with corn yield. The corn yield was high, averaging 8.04 Mg ha−1 when inorganic N contents were low (29.57 mg kg−1) and decreased sharply to about 4.07 Mg ha−1 at inorganic N contents of above 100 mg kg−1.
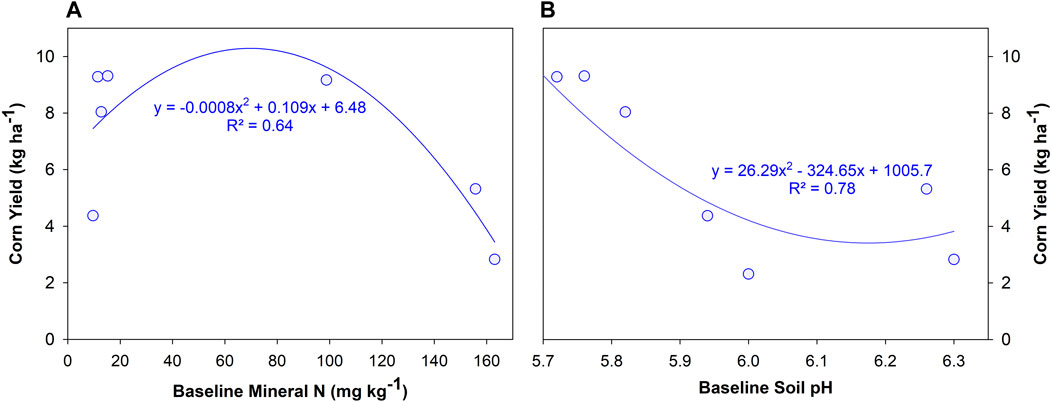
FIGURE 6. Relationship between baseline soil mineral N (mg kg−1) and pH with corn yield in all field trials. Subfigure (A) shows relationship between baseline mineral N and corn yield, and subfigure (B) shows relationship between baseline soil pH and corn yield.
Discussion
Variability in corn yield and site-specific management of N fertilizer
Even after decades of research, a question is still there of how much N is enough to achieve high crop yields, mainly because N transformations are quite rapid and vary widely among sites and climatic conditions (Kablan et al., 2017). Optimizing N rates is important for weathered soils in the southeast coastal plain which generally have low N supply capacity because of less organic N and organic matter content and thus require annual N fertilization to fulfill crop demand (Wiatrak and Liu, 2014). The maximum yield and EONR were generally found at higher N rates above 204 kg N ha−1 in most sites (Figures 3, 5). The irrigated and dryland corn grown in Florence, South Carolina, also showed maximum yield at N levels above 200 kg N ha−1 (Stone et al., 2010). This could be due to the high nitrate leaching potential of coastal plain soils because of sandy texture, low water holding capacity, and high rainfall during the corn season, decreasing N availability for plant uptake at lower rates (Hubbard et al., 2004; Wiatrak and Liu, 2014). A previous study conducted at the same location showed that N addition at 45 kg N ha−1 yr−1–180 kg N ha−1 yr−1 for 3 years increased NO3− accumulation by 28–177% in 0–900 cm soil profile (Wiatrak and Liu, 2014).
All eight field trials were conducted in the same area within a radius of 10 km2 and still showed great yield variation at each N level, more evidently in low-yielding sites (Figure 2; Figure 3). The corn yield trends were quite similar in high-yielding sites, and variation started after 200 kg N ha−1 (Figure 3). Several studies have reported wide variability in corn yield among sites located in the same area (Scharf et al., 2005; Miao et al., 2006; Kablan et al., 2017). The corn-N trials conducted in Paris, IL at six sites showed strong variability in yield, ranging from 93 to 195 kg ha−1 (Miao et al., 2006). Scharf et al. (2005) found that the corn yield in three major soil groups (Mississippi Delta alluvial, claypan, and deep loess) varied widely between and within fields. A field experiment conducted for 3 years in Quebec, Canada also showed significant variation in corn yield among two sandy-texture soils (Cambouris et al., 2016).
Crop N responses are influenced by several inherent characteristics, such as soil type, pH, EC, residual N, soil organic carbon, NO3−-N, NH4+-N, total N, aggregate stability, microbial activity, temperature, and moisture (Nyiraneza et al., 2009; Kablan et al., 2017; Tao et al., 2018). An 8-year field experiment conducted on 45 sites showed that soil texture, planting date, and rainfall were the major factors driving variability in corn yield (Kablan et al., 2017). Nyiraneza et al. (2009) reported that out of 16 soil attributes, N fractions (organic and inorganic) are the major determinants of corn yield. Tao et al. (2018) surveyed 920 corn fields across the US Corn Belt and, based on 3,680 corn stalk samples, found that the N rate is not the only driving factor that affects N availability and corn yield during the growing season. These variations advocate that N recommendations can differ greatly between fields within the same geographical location. Therefore, site-specific N management strategies should be tested and encourage farmers to use different N fertilizer levels for different fields considering the variation in soil characteristics and climatic conditions.
Soil inorganic N and pH as the main drivers of corn yield responses to N fertilization
The strong negative relationship of corn yield between pH and inorganic N explains that these could be the two main factors controlling corn yield variability in this study (Figure 6). The corn yield responded positively to N rates in soils that had lower residual N and yield decreased with N fertilization when residual N was above 100 mg kg−1 (Figure 6). Studies based on 15N-labeled fertilizers have shown that corn plants fulfill about 10–50% of their N requirements from current year fertilization, and soil N reserve usually supplies the remaining N (Omay et al., 1998; Stevens et al., 2005). Corn grain yield in the United States did not respond to N addition when the N contents in the 0–30 cm soil layer surpassed 20–30 mg NO3−-N kg−1 (Blackmer et al., 1989; Binford et al., 1992). Cui et al. (2008) reported that N availability of more than 87 kg ha−1 is enough for corn growth without affecting its grain yield. In fact, corn yield is negatively affected when N availability exceeds 150 kg N ha−1 (Bundy and Malone, 1988).
Corn yield was high (8.95 Mg ha−1) in soils that were more acidic (pH: 5.74), and yield decreased to 3.71 Mg ha−1 where pH was high (pH: 5.93) (Figure 6). This could be because acidic soils generally have lower nitrification potential because the activity of nitrifiers (ammonia-oxidizing bacteria and ammonia-oxidizing archaea) starts decreasing at pH below 6.0 (De Boer and Kowalchuk, 2001). This retarded nitrification can prolong NH4+ availability in the soil. As NH4+ leaching is far less when compared to NO3−, extended NH4+ availability will give an opportunity for the corn plants to uptake more N, translating into better yield (Raza et al., 2019). This could be the main reason we observed higher corn yields in acidic conditions (Figure 6).
Response of corn yield to N rates affected by multi-cover crop species
The yield responses were similar in no-cover and multi-cover species trials at lower N rates (0–168 kg N ha−1) but yield started decreasing sharply in the latter trial at higher N fertilization rates (Figure 3). A 5-year field trial in Illinois reported that cover crops decreased corn yield by 3.5% (Qin et al., 2021). A global meta-analysis of 372 experimental sites showed that cover crops decreased crop yield by about 4% compared to control (Abdalla et al., 2019). Another meta-analysis focusing on the Argentine Pampa reported decreases in corn yield by 8% with non-legume cover crops (Alvarez et al., 2017). Declining yield benefits with increasing N rates in multi-cover crop trials could be attributed to reduced N availability because the decomposition of cover crop residues that is high in the C:N ratio can cause N immobilization (Karlen and Doran, 1991; Wyland et al., 1995). The O2 consumption by microbes during the decomposition of cover crop residues can induce O2 stress which can also decrease crop yield (Fischer et al., 1989; Kavdır and Smucker, 2005). Cover crops can slow soil warming by decreasing evaporation and increasing ground albedo (Carrer et al., 2018).
Corn yield dependence on climatic variability
Variability in weather also makes it difficult to determine the overall impact of N fertilization on corn yield. This is particularly true for the coastal plain climate, where crop production mainly depends on rainfall. The annual precipitation in the South Carolina Coastal Plain is about 1,310 mm (SCDNR, 2010), which is enough for row crop production. However, crop water stress is also common in this region because of unequal temporal rainfall distribution and poor soil water storage because of sandy soil texture. The lowest corn yield in the study was in 2019 in trial 3 (2.32 Mg ha−1), which was the only dryland site, and all others were irrigated. The year 2019 was the hottest and driest, receiving 209 mm less rainfall during corn season than other years, which might be the main reason behind the lowest corn production. The dry spell during the corn growing season in 2008 severely decreased corn yields (3.8–4.7 Mg ha−1) in Darlington, South Carolina, and the yield doubled in the following year (8.4–9.3 Mg ha−1) having sufficient rainfall (Novak and Busscher, 2013). Therefore, inconsistent rainfall patterns and dry spells ranging from days to a few weeks can severely reduce corn production (Busscher and Schomberg, 2010). The strong relationship between weather conditions and soil properties greatly influences the response of crop yield to N fertilizer (Tremblay and Pandalai, 2004; Tremblay et al., 2012). Several other studies also reported that the relationship between yield and soil properties was largely influenced by the variability in precipitation and soil water holding capacity (Taylor et al., 2003; Armstrong et al., 2009; Shahandeh et al., 2011). Therefore, the interaction between weather conditions and soil properties should be considered before revising N recommendations for an area.
The existing N recommendation systems give correct estimates of average N rates needed to apply across geographic regions but are not designed to provide specific N goals for individual fields. The continued ineffective and erratic N use in corn could lead to a major nonpoint source of soil and environmental pollution (Chen et al., 2010; Küstermann et al., 2010). Knowing the gaps between soil N supply, nitrate leaching, and crop N demand for a particular crop on a specific soil type can improve the decision-making of the site-specific N management to achieve an economic optimum crop yield with better NUE (Pasuquin et al., 2014; Muschietti-Piana et al., 2018). There is a need to establish a system where field-specific N rates are recommended for individual fields based on site-specific factors. The amount of N added to soils through organic matter mineralization, residual N accumulated in the soil profile, and atmospheric N deposition should all be considered while making recommendations for N fertilization synchronized with crop demand. Failure to do so can result in faulty fertilization practices, leading to economic or environmental losses.
Conclusion
This study indicated a large variation in corn yield at each N level among eight field trials. Half of the trials (low-yielding sites) responded poorly to increments in N levels, and the other half (high-yielding sites) showed strong increases in corn yield. The N fertilization at 224 kg N ha−1 was generally most effective in producing maximum corn yield compared to control at most sites, and corn yield started decreasing at very high N levels (>300 kg ha−1). Increasing N fertilization cannot guarantee maximum corn yield as such responses are governed by a combination of several factors, such as soil inorganic N, pH, and precipitation, identified for this study. The EONR was below 300 kg N ha−1 for all trials, suggesting overfertilization should be avoided to avoid economic losses and soil and environmental pollution. Therefore, the optimal N rate for a site should be revised annually according to soil residual N contents and crop demand. More studies are required to establish practical soil-specific N management approaches considering soil and weather variations to better account for varied on-farm situations.
Data availability statement
The original contributions presented in the study are included in the article further inquiries can be directed to the corresponding author.
Author contributions
BF planned the study, carried out field activities, and supported funding. SR and BF carried out lab analyses and analyzed data. SR prepared tables, figures and wrote the original draft of the manuscript. BF reviewed the manuscript.
Funding
This work is supported by the USDA-Natural Resources Conservation Service Conservation Innovation Grants (NR213A750013G007 and NR184639XXXXG009) and the USDA-National Institute of Food and Agriculture Hatch project (SC-1700593).
Acknowledgments
We thank Edisto Research and Education Center’s farm crew and technical support staff at Blackville, SC.
Conflict of interest
The authors declare that the research was conducted in the absence of any commercial or financial relationships that could be construed as a potential conflict of interest.
Publisher’s note
All claims expressed in this article are solely those of the authors and do not necessarily represent those of their affiliated organizations, or those of the publisher, the editors, and the reviewers. Any product that may be evaluated in this article, or claim that may be made by its manufacturer, is not guaranteed or endorsed by the publisher.
References
Abdalla, M., Hastings, A., Cheng, K., Yue, Q., Chadwick, D., Espenberg, M., et al. (2019). A critical review of the impacts of cover crops on nitrogen leaching, net greenhouse gas balance and crop productivity. Glob. Change Biol. 25 (8), 2530–2543. doi:10.1111/gcb.14644
Alvarez, R., Steinbach, H. S., and De Paepe, J. L. (2017). Cover crop effects on soils and subsequent crops in the pampas: a meta-analysis. Soil Tillage Res. 170, 53–65. doi:10.1016/j.still.2017.03.005
Armstrong, R. D., Fitzpatrick, J., Rab, M. A., Abuzar, M., Fisher, P. D., O’Leary, G. J., et al. (2009). Advances in precision agriculture in South-eastern Australia: III. interactions between soil properties and water use help explain spatial variability of crop production in the victorian mallee. Crop Pasture Sci. 60, 870. doi:10.1071/cp08349
Bélanger, G., Walsh, J. R., Richards, J. E., Milburn, P. H., and Ziadi, N. (2000). Comparison of three statistical models describing potato yield response to nitrogen fertilizer. Agron. J. 92, 902–908. doi:10.2134/agronj2000.925902x
Bellamy, C. A. (2009). Sensor-based soil water monitoring to more effectively manage agricultural water resources in coastal plain soils. Doctoral Dissertation. Clemson, SC: Clemson University.
Billen, G., Beusen, A., Bouwman, L., and Garnier, J. (2010). Anthropogenic nitrogen autotrophy and heterotrophy of the world's watersheds: past, present, and future trends. Glob. Biogeochem. Cycles 24, 12. doi:10.1029/2009gb003702
Binford, G. D., Blackmer, A. M., and Cerrato, M. E. (1992). Relationships between corn yields and soil nitrate in late spring. Agron. J. 84, 53–59. doi:10.2134/agronj1992.00021962008400010012x
Blackmer, A. M., Pottker, D., Cerrato, M. E., and Webb, J. (1989). Correlations between soil nitrate concentrations in late spring and corn yields in Iowa. J. Prod. Agric. 2 (2), 103–109. doi:10.2134/jpa1989.0103
Breker, J. S., DeSutter, T., Rakkar, M. K., Chatterjee, A., Sharma, L., Franzen, D. W., et al. (2019). Potassium requirements for corn in north Dakota: influence of clay mineralogy. Soil Sci. Soc. Am. J. 83 (2), 429–436. doi:10.2136/sssaj2018.10.0376
Bundy, L. G., and Malone, E. S. (1988). Effect of residual profile nitrate on corn response to applied nitrogen. Soil Sci. Soc. Am. J. 52, 1377–1383. doi:10.2136/sssaj1988.03615995005200050032x
Busscher, W. J., and Schomberg, H. H. (2010). “Soil and water conservation in the southeastern United States: a look at conservation practices past, present and future,” in Soil and water conservation in the United States. Editors T. M. Zobeck, and W. F. Schllinger (Madison: Soil Science Society of America Special Publication 60. SSSA).
Cambouris, A. N., Ziadi, N., Perron, I., Alotaibi, K. D., Luce, St.M., Tremblay, N., et al. (2016). Corn yield components response to nitrogen fertilizer as a function of soil texture. Can. J. Soil Sci. 96 (4), 386–399. doi:10.1139/cjss-2015-0134
Carrer, D., Pique, G., Ferlicoq, M., Ceamanos, X., and Ceschia, E. (2018). What is the potential of cropland albedo management in the fight against global warming? a case study based on the use of cover crops. Environ. Res. Lett. 13 (4), 044030. doi:10.1088/1748-9326/aab650
Chen, X. P., Zhang, F. S., Cui, Z. L., Li, F., and Li, J. L. (2010). Optimizing soil nitrogen supply in the root zone to improve maize management. Soil Sci. Soc. Am. J. 74, 1367–1373. doi:10.2136/sssaj2009.0227
Cui, Z., Zhang, F., Miao, Y., Sun, Q., Li, F., Chen, X., et al. (2008). Soil nitrate-N levels required for high yield maize production in the North China Plain. Nutr. Cycl. Agroecosyst. 82 (2), 187–196. doi:10.1007/s10705-008-9180-4
De Boer, W., and Kowalchuk, G. A. (2001). Nitrification in acid soils: micro-organisms and mechanisms. Soil Biol. Biochem. 33 (7-8), 853–866. doi:10.1016/s0038-0717(00)00247-9
Fischer, W. R., Flessa, H., and Schaller, G. (1989). pH values and redox potentials in microsites of the rhizosphere. Z. Pflanzenernaehr. Bodenk. 152 (2), 191–195. doi:10.1002/jpln.19891520209
Gardner, J. B., and Drinkwater, L. E. (2009). The fate of nitrogen in grain cropping systems: a meta-analysis of 15N field experiments. Ecol. Appl. 19 (8), 2167–2184. doi:10.1890/08-1122.1
Halvorson, A. D., Del Grosso, S. J., and Alluvione, F. (2010). Tillage and inorganic nitrogen source effects on nitrous oxide emissions from irrigated cropping systems. Soil Sci. Soc. Am. J. 74 (2), 436–445. doi:10.2136/sssaj2009.0072
Hubbard, R. K., Sheridan, J. M., Lowrance, R., Bosch, D. D., and Vellidis, G. E. O. R. G. E. (2004). Fate of nitrogen from agriculture in the southeastern Coastal Plain. J. Soil Water Conservation 59 (2), 72–86.
International Fertilizer Association and International Plant Nutrition Institute (2017). Assessment of fertilizer use by crop at the global level. Available at: https://www.fertilizer.org/images/Library_Downloads/2017_IFA_AgCom_17_134%20rev_FUBC%20assessment%202014.pdf (Accessed May 04, 2022).
Kablan, L. A., Chabot, V., Mailloux, A., Bouchard, M. È., Fontaine, D., Bruulsema, T., et al. (2017). Variability in corn yield response to nitrogen fertilizer in eastern Canada. Agron. J. 109 (5), 2231–2242. doi:10.2134/agronj2016.09.0511
Kahrl, F., Li, Y., Su, Y., Tennigkeit, T., Wilkes, A., Xu, J., et al. (2010). Greenhouse gas emissions from nitrogen fertilizer use in China. Environ. Sci. policy 13 (8), 688–694. doi:10.1016/j.envsci.2010.07.006
Karlen, D. L., and Doran, J. W. (1991). Cover crop management effects on soybean and corn growth and nitrogen dynamics in an on-farm study. Am. J. Alt. Ag. 6 (2), 71–82. doi:10.1017/s0889189300003891
Kavdır, Y., and Smucker, A. J. (2005). Soil aggregate sequestration of cover crop root and shoot-derived nitrogen. Plant Soil 272 (1), 263–276. doi:10.1007/s11104-004-5294-x
Khalilian, A., Porter, W., Henderson, W., Han, Y., and Barnes, E. (2011). “Sensor based nitrogen management for cotton production in coastal plain soils,” in Proceedings of the Beltwide Cotton Conferences, National Cotton Council of America, Memphis, TN, January 4–7, 2011, 531–537.
Kitchen, N. R., Shanahan, J. F., Ransom, C. J., Bandura, C. J., Bean, G. M., Camberato, J. J., et al. (2017). A public-industry partnership for enhancing corn nitrogen research and datasets: project description, methodology, and outcomes. Agron. J. 109, 2371–2389. doi:10.2134/agronj2017.04.0207
Küstermann, B., Christen, O., and Hülsbergen, K. (2010). Modelling nitrogen cycles of farming systems as basis of site- and farm-specific nitrogen management. Agric. Ecosyst. Environ. 135, 70–80. doi:10.1016/j.agee.2009.08.014
Miao, Y., Mulla, D. J., Robert, P. C., and Hernandez, J. A. (2006). Within field variation in corn yield and grain quality responses to nitrogen fertilization and hybrid selection. Agron. J. 98 (1), 129–140. doi:10.2134/agronj2005.0120
Muschietti-Piana, M. D. P., Cipriotti, P. A., Urricariet, S., Peralta, N. R., and Niborski, M. (2018). Using site-specific nitrogen management in rainfed corn to reduce the risk of nitrate leaching. Agric. Water Manag. 199, 61–70. doi:10.1016/j.agwat.2017.12.002
Nair, D., Abalos, D., Philippot, L., Bru, D., Mateo-Marín, N., Petersen, S. O., et al. (2021). Soil and temperature effects on nitrification and denitrification modified N2O mitigation by 3, 4-dimethylpyrazole phosphate. Soil Biol. Biochem. 157, 108224. doi:10.1016/j.soilbio.2021.108224
Novak, J. M., and Busscher, W. J. (2013). “Selection and use of designer biochars to improve characteristics of southeastern USA Coastal Plain degraded soils,” in Advanced biofuels and bioproducts (New York, NY: Springer), 69–96.
Nyiraneza, J., N'Dayegamiye, A., Chantigny, M. H., and Laverdière, M. R. (2009). Variations in corn yield and nitrogen uptake in relation to soil attributes and nitrogen availability indices. Soil Sci. Soc. Am. J. 73 (1), 317–327. doi:10.2136/sssaj2007.0374
Nyiraneza, J., N’Dayegamiye, A., Gasser, M. O., Giroux, M., Grenier, M., Landry, C., et al. (2010). Soil and crop parameters related to corn nitrogen response in Eastern Canada. Agron. J. 102, 1478–1490. doi:10.2134/agronj2009.0458
Omara, P., Aula, L., Oyebiyi, F., and Raun, W. R. (2019). World cereal nitrogen use efficiency trends: review and current knowledge. Agrosyst. Geosci. Environ. 2 (1), 1–8. doi:10.2134/age2018.10.0045
Omay, A. B., Rice, C. W., Maddux, L. D., and Gordon, W. B. (1998). Corn yield and nitrogen uptake in monoculture and in rotation with soybean. Soil Sci. Soc. Am. J. 62 (6), 1596–1603. doi:10.2136/sssaj1998.03615995006200060017x
Pasuquin, J. M., Pampolino, M. F., Witt, C., Dobermann, A., Oberthür, T., Fisher, M. J., et al. (2014). Closing yield gaps in maize production in southeast ASIA through site-specific nutrient management. Field Crops Res. 156, 219–230. doi:10.1016/j.fcr.2013.11.016
Qin, Z., Guan, K., Zhou, W., Peng, B., Villamil, M. B., Jin, Z., et al. (2021). Assessing the impacts of cover crops on maize and soybean yield in the US Midwestern agroecosystems. Field Crops Res. 273, 108264. doi:10.1016/j.fcr.2021.108264
Raza, S., Chen, Z., Ahmed, M., Afzal, M. R., Aziz, T., Zhou, J., et al. (2019). Dicyandiamide application improved nitrogen use efficiency and decreased nitrogen losses in wheat-maize crop rotation in Loess Plateau. Archives Agron. Soil Sci. 65 (4), 450–464. doi:10.1080/03650340.2018.1506584
Raza, S., Zamanian, K., Ullah, S., Kuzyakov, Y., Virto, I., Zhou, J., et al. (2021). Inorganic carbon losses by soil acidification jeopardize global efforts on carbon sequestration and climate change mitigation. J. Clean. Prod. 315, 128036. doi:10.1016/j.jclepro.2021.128036
SCDNR (2010). Climate of South Carolina. South Carolina Department of Natural Resources. Available at: http://www.dnr.sc.gov/climate/SCD/Education/facts/climate_SC.pdf.
Scharf, P. C., Kitchen, N. R., Sudduth, K. A., Davis, J. G., Hubbard, V. C., Lory, J. A., et al. (2005). Field-scale variability in optimal nitrogen fertilizer rate for corn. Agron. J. 97 (2), 452–461. doi:10.2134/agronj2005.0452
Shahandeh, H., Wright, A. L., and Hons, F. M. (2011). Use of soil nitrogen parameters and texture for spatially-variable nitrogen fertilization. Precis. Agric. 12, 146–163. doi:10.1007/s11119-010-9163-8
Shanahan, J. F., Kitchen, N. R., Raun, W. R., and Schepers, J. S. (2008). Responsive in-season nitrogen management for cereals. Comput. Electron. Agric. 61, 51–62. doi:10.1016/j.compag.2007.06.006
Stevens, W. B., Hoeft, R. G., and Mulvaney, R. L. (2005). Fate of nitrogen-15 in a long-term nitrogen rate study: II. nitrogen uptake efficiency. Agron. J. 97 (4), 1046–1053. doi:10.2134/agronj2003.0313
Stone, K. C., Camp, C. R., Sadler, E. J., Evans, D. E., and Millen, J. A. (2010). Corn yield response to nitrogen fertilizer and irrigation in the southeastern coastal plain. Appl. Eng. Agric. 26 (3), 429–438. doi:10.13031/2013.29954
Tao, H., Morris, T. F., Kyveryga, P., and McGuire, J. (2018). Factors affecting nitrogen availability and variability in cornfields. Crops Soils 110 (5), 1974–1979. doi:10.2134/cs2019.52.0107
Taylor, J. C., Wood, G. A., Earl, R., and Godwin, R. J. (2003). Soil factors and their influence on within-field crop variability, Part II: spatial analysis and determination of management zones. Biosyst. Eng. 84, 441–453. doi:10.1016/s1537-5110(03)00005-9
Tremblay, N., and Pandalai, S. G. (2004). Determining nitrogen requirements from crops characteristics: benefits and challenges. Recent Res. Dev. Agron. Hortic. 1, 157–182.
Tremblay, N., Bouroubi, Y. M., Bélec, C., Mullen, R. W., Kitchen, N. R., Thomason, W. E., et al. (2012). Corn response to nitrogen is influenced by soil texture and weather. Agron. J. 104, 1658–1671. doi:10.2134/agronj2012.0184
USDA (2022). United States department of agriculture foreign agricultural Service circular series WAP. Available at: https://apps.fas.usda.gov/psdonline/circulars/production.pdf.
Wiatrak, P., and Liu, K. (2014). Soil nutrient distribution affected by nitrogen fertilization under conventional tillage system. Commun. Soil Sci. Plant Analysis 45 (6), 819–828. doi:10.1080/00103624.2013.871726
Wuest, S. B., and Cassman, K. G. (1992). Fertilizer-nitrogen use efficiency of irrigated wheat: I. uptake efficiency of preplant versus late-season application. Agron. J. 84, 682–688. doi:10.2134/agronj1992.00021962008400040028x
Wyland, L. J., Jackson, L. E., and Schulbach, K. F. (1995). Soil-plant nitrogen dynamics following incorporation of a mature rye cover crop in a lettuce production system. J. Agric. Sci. 124 (1), 17–25. doi:10.1017/s0021859600071203
Keywords: corn yield, nitrogen use efficiency, relative yield, EONR, residual N, irrigated, dryland
Citation: Raza S and Farmaha BS (2022) Contrasting corn yield responses to nitrogen fertilization in southeast coastal plain soils. Front. Environ. Sci. 10:955142. doi: 10.3389/fenvs.2022.955142
Received: 28 May 2022; Accepted: 11 July 2022;
Published: 09 August 2022.
Edited by:
Rosa María Martínez-Espinosa, University of Alicante, SpainReviewed by:
Olga Walsh, University of Idaho, United StatesFernando Shintate Galindo, University of São Paulo, Brazil
Copyright © 2022 Raza and Farmaha. This is an open-access article distributed under the terms of the Creative Commons Attribution License (CC BY). The use, distribution or reproduction in other forums is permitted, provided the original author(s) and the copyright owner(s) are credited and that the original publication in this journal is cited, in accordance with accepted academic practice. No use, distribution or reproduction is permitted which does not comply with these terms.
*Correspondence: Bhupinder Singh Farmaha, YmZhcm1haEBjbGVtc29uLmVkdQ==