
94% of researchers rate our articles as excellent or good
Learn more about the work of our research integrity team to safeguard the quality of each article we publish.
Find out more
ORIGINAL RESEARCH article
Front. Environ. Sci., 03 November 2022
Sec. Environmental Informatics and Remote Sensing
Volume 10 - 2022 | https://doi.org/10.3389/fenvs.2022.950547
 Xiaoning Zhang1,2
 Lili Nian1,2
 Samuel Adingo3Quanxi Wang4
 Xiaodan Li1,5
 Xuelu Liu1,2*Xingyu Y. Liu1
 Yingbo Yang2Caihong Hui2Miaomiao Zhang5
 Zixuan Mao2Quanxi Li2Li Luo5
 Biao Ma2
Soil water–salt variations at different spatiotemporal scales and their influencing factors are essential for regional vegetation restoration and management. However, the study of soil water–salt of the alpine area has not taken into account the effect of topography, especially in the long time series. This work investigated the spatiotemporal characteristics of water and salt in topsoil from 2000 to 2021, using regression analysis of on-site data and MODIS products. The heterogeneity and trends of soil water–salt in various topographic factors (elevation, slope, and aspect) were also explored by selecting the maximum area of each gradient factor as the constrained condition with the help of ArcGIS software. The results revealed that 1) the models applied to SWC (soil water content), EC (electrical conductivity), and pH utilizing vegetation indices were suitable for estimating the spatiotemporal variations of soil water–salt. 2) Soil water–salt exhibited local aggregation characteristics with an upward trend in SWC and a downward trend in EC and pH as a whole. 3) Mean annual SWC peaked at 3,400–3,800 m with increasing elevation and trended downward with increasing slope. The aspect of mean annual SWC was characterized by lower values in the southwest and south and higher values in the north, while the results for pH were reversed. The slope had a greater influence on EC than on SWC and pH. 4) The trend change of SWC, EC, and pH fluctuated at 2000–2,400 m and >4,600 m with a clear inflection point at 4°–8° and 20°–24°, respectively. In summary, the effects of topography responded to the distribution and trends of soil water–salt. The results have significant implications for implementing ecological improvements in regions with complicated topography and can serve as a reference for formulating future ecological policies.
Topography is a fundamental characteristic in the formation of geomorphic processes and includes three primary topographic factors: elevation, slope, and aspect (Zhu et al., 2019). A growing scientific literature suggests that topography can control soil biochemical processes and define the spatial distribution patterns of soil properties (Unamunzaga et al., 2014; Kong et al., 2019; Suleymanov et al., 2021). In addition, topography has been shown to play an important role in the distribution and redistribution of soil moisture (Qiu et al., 2001; Zhu and Shao, 2008; Yang et al., 2015), which indirectly affects soil salinity (An et al., 2019).
To date, it has been demonstrated that topography-induced variations in microclimatic, hydrological, and ecological conditions can lead to regional variability of soil water–salt at different spatial scales in the alpine areas (Zhang et al., 2018; Zhu et al., 2019), but the quantitative assessment of spatial and temporal variations in soil water–salt and its response to different topographic factors are still insufficient. With the gradual improvement of remote sensing technology, it has become an important tool for studying regional soil water–salt distribution and its spatiotemporal variations (Xu and Wang, 2015; Wang et al., 2020b; Salcedo et al., 2022), which is particularly advantageous and feasible in the alpine areas with complex topography due to the availability of spatially sequential data in a short time (Tran et al., 2019).
The Tibetan Plateau is a typical alpine region known as the “Asian Water Tower” (Li et al., 2021). The region is more sensitive than other regions to environmental changes (Zhang et al., 2016) and is affected by both climate warming (Du et al., 2021) and human disturbance (Li et al., 2021), which have directly altered soil properties (Zhang et al., 2016) and resulted in the deterioration of alpine grasslands (Wang et al., 2022a). The Chinese government has adopted several policies to address the phenomenon, such as “returning grazing land to grassland” and “compensating for fencing degraded grassland and rewarding livestock with forage balanced on healthy rangelands” (Li et al., 2021). The study was carried out in the northeastern part of the Qinghai–Tibet Plateau with the Gannan Water Conservation Area, which is part of the source area of the Yellow River Basin and an important ecological functional area of water supply in China.
It is well-known that the water–salt properties of soil are closely related to those of vegetation (González-Alcaraz et al., 2014; Wu et al., 2021b) and that vegetation growth and distribution have a great influence on the water–salt properties of soil (He et al., 2015; Yu et al., 2018; Li et al., 2022). Soil moisture and its spatiotemporal variation are crucial quantitative methods to reflect the spatial pattern of vegetation (Legates et al., 2011), while soil salinity is related to variations in soil moisture (Wang et al., 2020a; Shah et al., 2021). In addition, quantitative relationships between soil properties and reflectance have been reported in the literature (Davari et al., 2021; Mzid et al., 2022; Taghdis et al., 2022). Wu et al., (2021), who examined the SWC and EC of soil samples and combined remote sensing with mathematical models to develop predictive models for determining soil salinity. In addition, the vegetation index from MODIS NDVI was used to estimate the spatial distribution of EC (Gorji et al., 2020) and pH (Zhang et al., 2018b; Webb et al., 2021). To sum up, the regression equations were developed in this work with NDVI, NPP, and LAI as independent variables and SWC, EC, and pH as dependent variables, using and modifying the methods from the literature aforementioned.
Based on the background, and in order to better understand the factors that influence the spatial and temporal variation of soil water–salt in the alpine area, the northeastern Tibetan Plateau was selected as the study area, and the topographic factors were adopted as the driving force to investigate its characteristics (the flowchart is shown in Figure 1). The objectives of this study were as follows: 1) to evaluate the applicability of constructing soil water–salt distribution models using vegetation indices; 2) to explore the spatiotemporal variation of soil water–salt distribution; 3) to investigate the relationship between the spatiotemporal distribution of soil water–salt and topographic factors; and 4) to identify the intervals or inflection points where topographic factors influence soil water–salt. The quantitative approach will be useful to government agencies in land management and soil condition assessment.
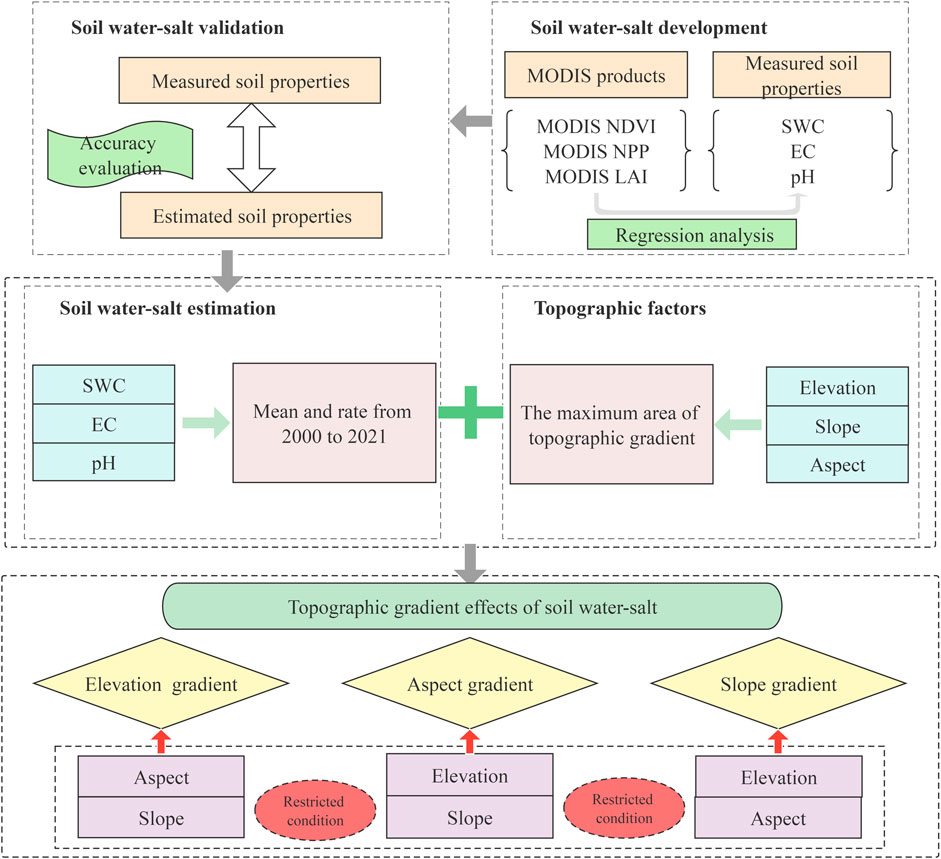
FIGURE 1. Flowchart of this study.
The location of the study area in the Yellow River Basin and the Tibetan Plateau is shown in Figure 2. The terrain of the area is mainly inclined to the north, and most of the area is at about 3,000 m above sea level and has a cold and humid climate. The annual mean temperature ranges from 1°C to 3°C, while the annual mean precipitation ranges from 400 to 800 mm (Meng et al., 2018). Grasslands, woodlands, and wetlands are the main carriers of ecosystem service functions in the research region. Among them, grassland resources are the most abundant, especially in Maqu, Luqu, Xiahe, and Zhuoni counties, while subalpine meadows make up the majority of the natural grassland.
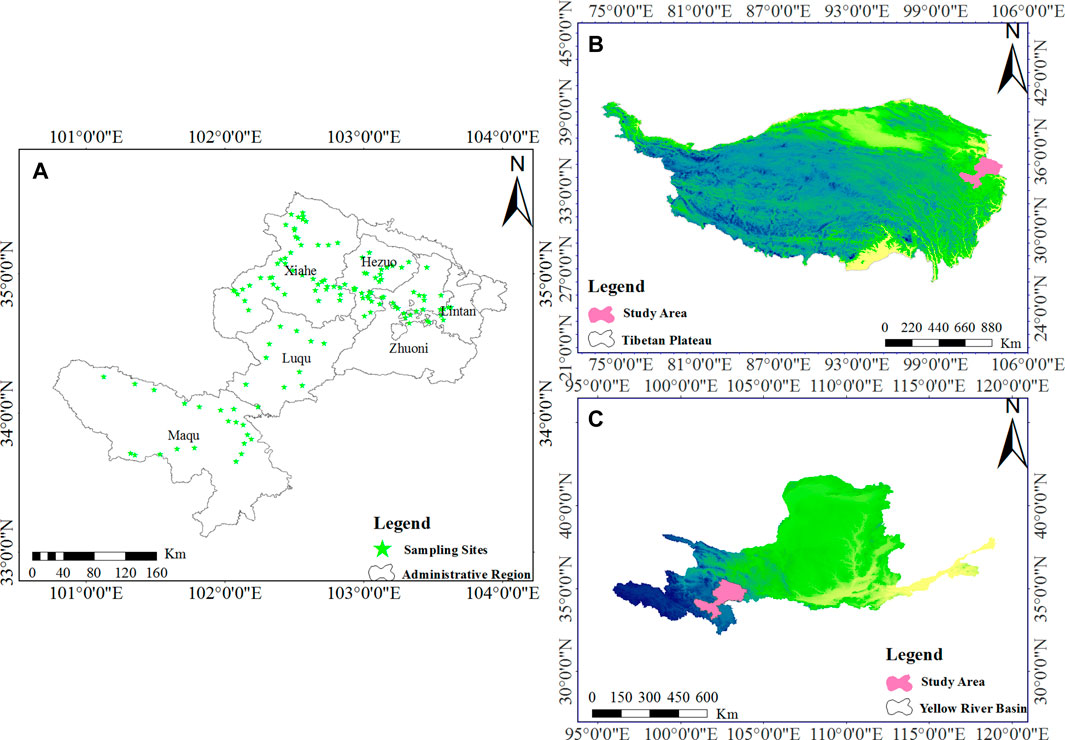
FIGURE 2. Geographical map of the study area. (A) Location of the sampling points, (B) location of the study area on the Tibetan Plateau, and (C) location of the study area on the Yellow River Basin.
A total of 130 soil samples were collected randomly throughout the research region from July to August 2021, according to the land-use type, landscape features, and soil type, with sample locations more than 1 km apart (Figure 2). Two quadrants were taken from each sampling site more than 100 m apart, located and recorded using GPS with latitude and longitude, and numbered sequentially according to the order of sampling sites (Wu et al., 2021a). The weeds on the surface were removed, and the soil was extracted using stainless cutting rings (100 cm3) and used to determine the water content of the soil using the oven-drying method at 105°C and the bulk density of the surface soil (0–10 cm) (Wang et al., 2015; Ahmed et al., 2020). Soil samples were also collected from the surface at a depth of 0–10 cm using a soil auger. Soil samples were collected in labeled, self-sealing bags and transported to the laboratory where they were air-dried and the debris of plants and foreign materials removed. The air-dried soil was then ground and filtered through a 1-mm sieve. The sieved samples were used to determine soil pH and EC using a soil to water suspension ratio of 1:5 (Lesch et al., 1992; Sharma et al., 2017; Tran et al., 2019).
The boundaries of the administrative area, the Tibetan Plateau and the Yellow River Basin were downloaded from the Resource and Environment Science and Data Center (https://www.resdc.cn/), which can generate raster images of the research region using the Extract by Mask tool in ArcGIS 10.5. The different types of raster data corresponding to the soil sample data were also extracted. The Extract by Point tool in ArcGIS 10.5 was used to extract the raster images corresponding to the period of the soil survey to ensure the reliability of the experimental data.
The vegetation index products of MODIS NDVI (MOD13A1), MODIS LAI (MOD15A2), and MODIS NPP (MOD17A2) were downloaded from the United States Geological Survey (USGS) (https://lpdaacsvc.cr.usgs.gov/appeears/explore) with a spatial resolution of 500 m. In this study, the monthly dataset was synthesized using Maximum Value Composites (MVC) (Holben, 1986), and the June–August data were averaged to produce the 2000–2021 summer datasets. Finally, the datasets were re-projected and re-sampled to verify the coordinate system of WGS_1984_UTM_zone_48N and a resolution of 90 m uniformity with the DEM.
A DEM was also obtained from SRTMGL3DEM provided by USGS at 90 m resolution. Topographic factors such as elevation, slope, and aspect were extracted in ArcGIS. According to the actual situation of the Gannan Water Conservation Area, elevation was divided into 14 bands of 200 m, slope into 11 bands of 4°, and aspect into north, northeast, east, southeast, south, southwest, west, and northwest (Figure 3). To reduce the interaction between the topographic factors, the intersection of the other two factors should be used as a constrained condition when studying one of the factors (Chang et al., 2015). The percentages of the total area divided by elevation, slope, and aspect were calculated separately, and elevation of 3,400–3,600 m, slope of 4°–8°, and aspect of south were selected as constrained conditions for later analysis (Table 1).
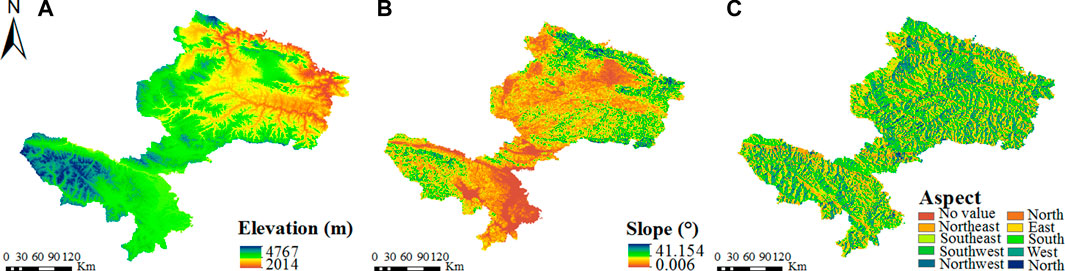
FIGURE 3. Various topographical factors: (A) elevation, (B) slope, and (C) aspect.
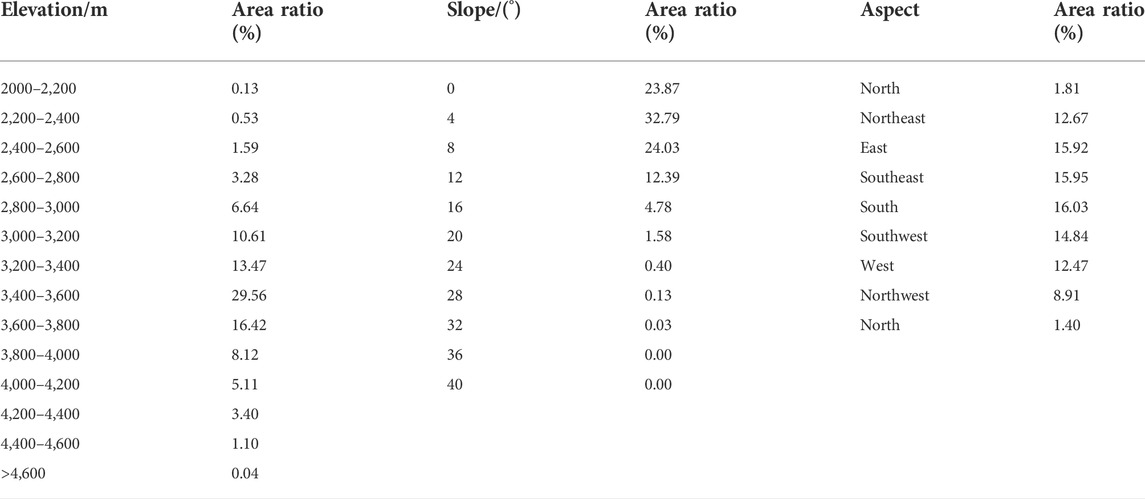
TABLE 1. Area distribution of various topographical factors.
We sorted the soil attribute data in the study by sample number and removed outliers and then evenly distributed two-thirds of the data to select as the calibration set and the rest as the validation set (Madonsela et al., 2018). The results of the Histograms for Descriptive in IBM SPSS statistics showed that the soil property data had a significant normal distribution, which allowed multiple stepwise regression analyses and curve estimation (Wu et al., 2021a). Soil water content and soil salinity were modeled separately using vegetation index as the independent variable and observed soil properties as the dependent variable (Wu et al., 2021a). The optimal model was determined based on the higher coefficient of determination (R2) and lower root mean square error (RMSE) of the regression equation (Madonsela et al., 2018; Mngadi et al., 2022).
Spatial autocorrelation analysis is a statistical analysis method for identifying spatial correlations (Anselin, 1995). Currently, Moran’s I index developed by Moran (1948) is a powerful tool for detecting spatial clustering effects, and the global Moran’s I index is widely used to test the spatial dependence of indicators at spatiotemporal scales (Zhong et al., 2021). In general, Moran’s index values close to +1.0 or -1.0 indicate clustering or dispersion, respectively, while the p-value and z-score represent the statistical significance of the index (Rabii et al., 2017). The formula is described in the literature (Zhong et al., 2021).
Hot-spot analysis can detect similar high (hot) or low (cold) values within a geographic area and group them, revealing hot and cold areas with spatial characteristics at different levels of statistical significance. It is a generic tool implemented in the ArcGIS software (Xu et al., 2019). The equation is presented in the study by Xu et al. (2019).
The regression coefficient (
The Hurst exponent (H) was used to analyze the sustainability of time-series trends (Tong et al., 2018b), and the formula could be found in the literature (Chen et al., 2020). The H-value ranges from 0 to 1 and can be divided into three categories with a threshold of 0.5: (A) H-value = 0.5 means that the future trend is uncertain; (B) H-value > 0.5 means that the future change is consistent with the current trend; and (C) H-value < 0.5 means that the future change is opposite to the current trend (Chen et al., 2020).
The
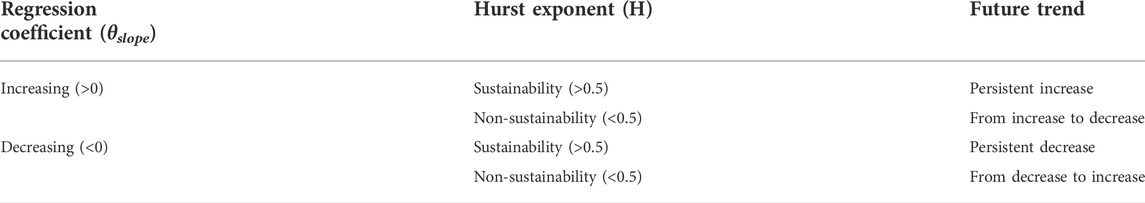
TABLE 2. Future trend characteristic.
The indicators for the statistical analysis of the soil samples are shown in Table 3. The results showed that the coefficients of variation for both soil properties and vegetation indices were >1, indicating strong spatial variability, which means that the obtained soil samples were suitable for model construction and were applied (Wu et al., 2022a). Soil water–salt was modeled using vegetation indices and measured soil properties as independent and dependent variables, respectively. Optimal models for soil properties are listed in Table 4, which shows R2 for SWC, EC, and pH of 0.557, 0.302, and 0.678, respectively. Regression analysis was performed between the predicted and observed values to verify the accuracy of the model, and the results proved that the model was reliable (Figure 4).
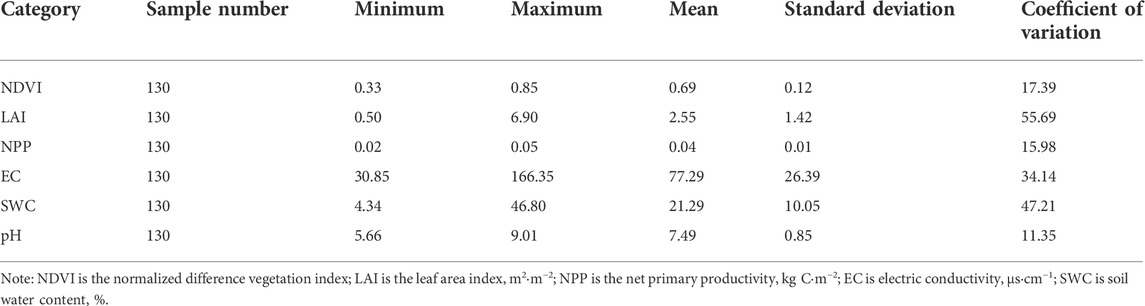
TABLE 3. Statistical characteristics of vegetation indices and soil properties.
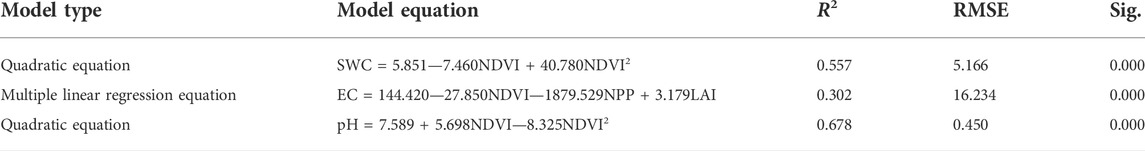
TABLE 4. Optimal model of the soil properties.
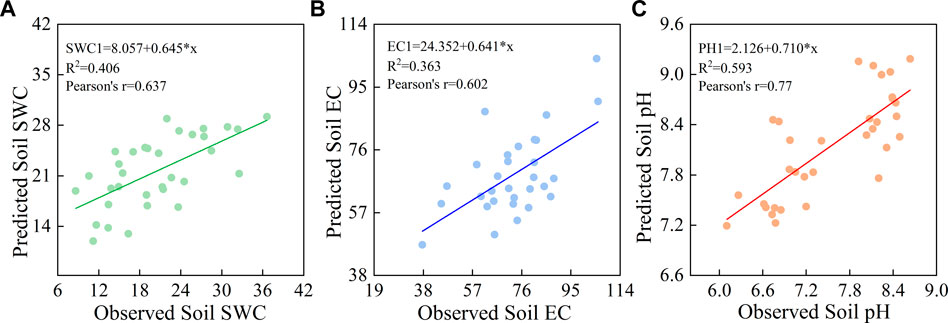
FIGURE 4. Accuracy validation of soil water–salt models: (A) accurate validation of SWC, (B) accurate validation of EC, and (C) accurate validation of pH.
Figure 5 shows the mean annual variations of SWC, EC, and pH from 2000 to 2021 in summer. The results showed an upward trend in SWC with large variations during the study period, while EC and pH showed a reversed trend. SWC and PH had their minimum and maximum values in 2000, while they had their maximum and minimum in 2018, respectively. In addition, the trend line for pH showed a significant downward trend compared to that of EC, while SWC showed an upward trend from 2000 to 2021. Thus, it could be inferred that the ecological environment of the study area is gradually improving.
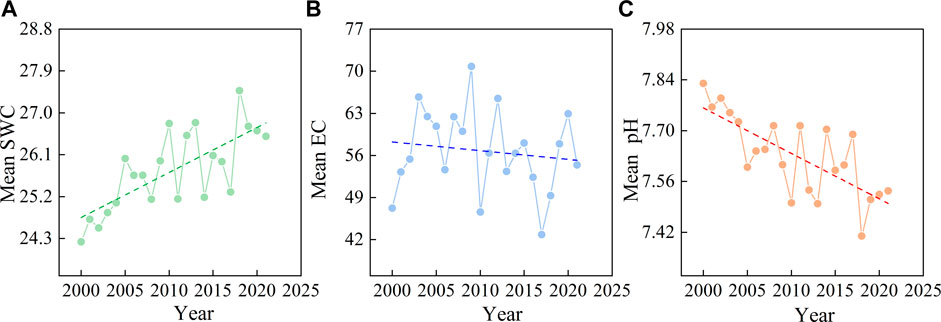
FIGURE 5. Mean annual of soil water–salt during 2000–2021: (A) mean annual of SWC, (B) mean annual of EC, and (C) mean annual of pH.
The mean value from 2000 to 2021 was estimated per pixel to understand the geographic distribution of SWC, EC, and pH in the study region (Figures 6A–C). It clearly showed that most regions had higher SWC values, while the regions with high values of EC and pH were fewer and had a similar distribution. In particular, the local low values of SWC and the local high values of EC and pH were mainly located in the northwest of Maqu, the north of Xiahe, and the west of Lintan.
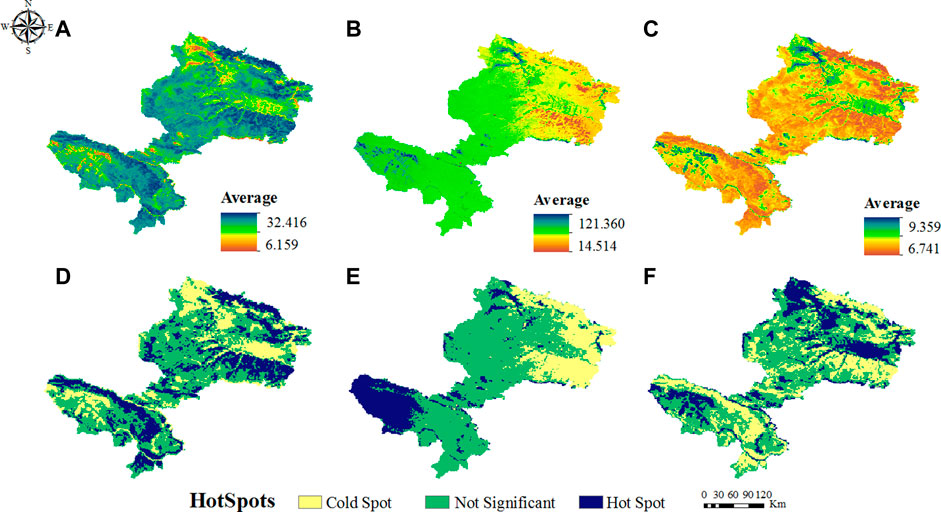
FIGURE 6. Spatial patterns of mean multi-annual and Getis-Ord Gi*: (A) mean multi-annual of SWC, (B) mean multi-annual of EC, (C) mean multi-annual of pH, (D) hot spot of SWC, (E) hot spot of EC, and (F) hot spot of pH.
The Moran’s I index and hot-spot analysis (Getis-Ord Gi*) were used to gain insight into the global spatial correlation and local aggregation of soil water–salt, respectively. Moran’s I indices for SWC, EC, and pH were 0.892, 0.821, and 0.892, respectively, with Z scores and p values indicating the significance of the index. Then, the aggregation characteristics of soil water–salt in the region were further investigated based on the hot-spot analysis, and the spatial distribution was mapped (Figures 6D–F). Figures 6D,F show that hot spots (high values) and cold spots (low values) of SWC and pH were opposite, while EC was not significant in most regions, except for localized cold spots and hot spots in the northeast and southwest, respectively (Figure 6E).
The
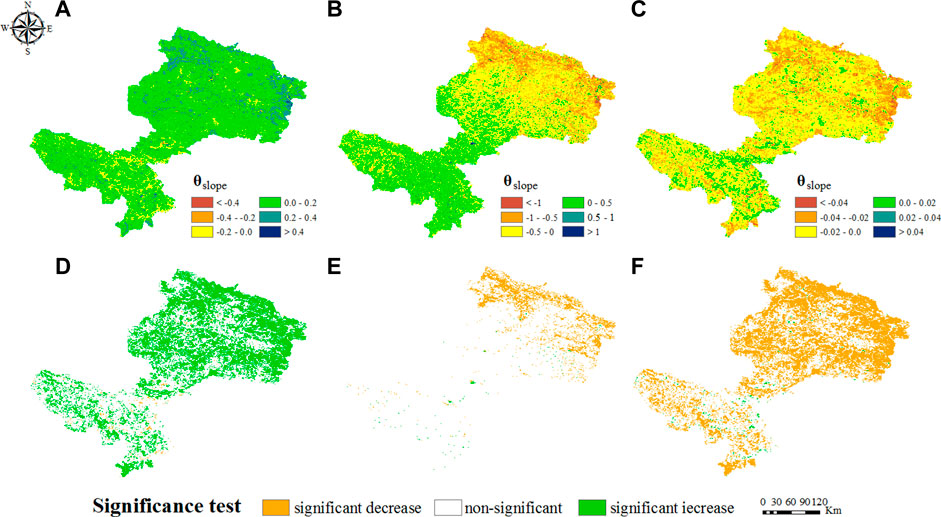
FIGURE 7. Spatial pattern of the
The Hurst exponent (H) was introduced to further explore the future trend of soil water–salt (Figure 8). The H-value for SWC ranged from 0.10 to 0.82 with a mean of 0.46 < 0.5, indicating a future trend opposite to the current situation (Figure 8A). The statistical spatial distribution of Figures 8B,C showed that the H-value of EC and pH was greater than 0.5 in 16.36% and 14.55% of the entire region, respectively, while 82.68% and 85.45% were less than 0.5, respectively, indicating that the future trend of soil salinity will be reversed in most areas of the Gannan Water Conservation Area.
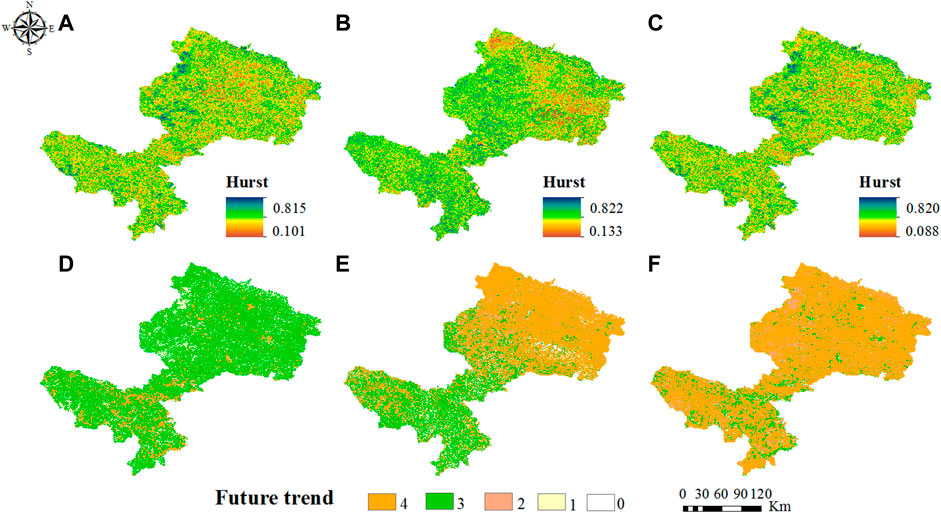
FIGURE 8. Spatial distribution of the H-value and future trend: (A) H-value of SWC, (B) H- value of EC, (C) H-value of pH, (D) future trend of SWC, (E) future trend of EC, and (F) future trend of pH. Note: 0–4 represent not significant, persistence and increase, persistence and decrease, from increase to decrease, and from decrease to increase, respectively.
Since neither the
The mean and
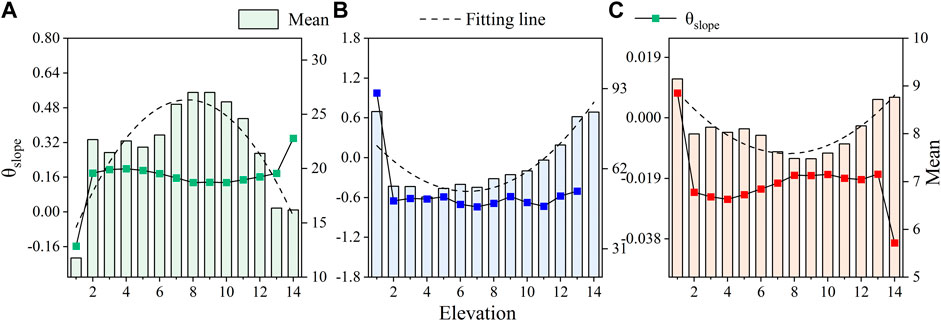
FIGURE 9. Effect of elevation on soil water–salt: (A) effect of elevation on SWC, (B) effect of elevation on EC, and (C) effect of elevation on pH. Note: 1–14 represent 2000–2,100, 2,100–2,200, 2,200–2,300, 4,500–4,600, 4,600–4,700, and >4,700, respectively; constrained conditions: the slope of 4°–8° and aspect of southern.
By determining the area intersected by 3,400–3,600 m and the south, the mean and
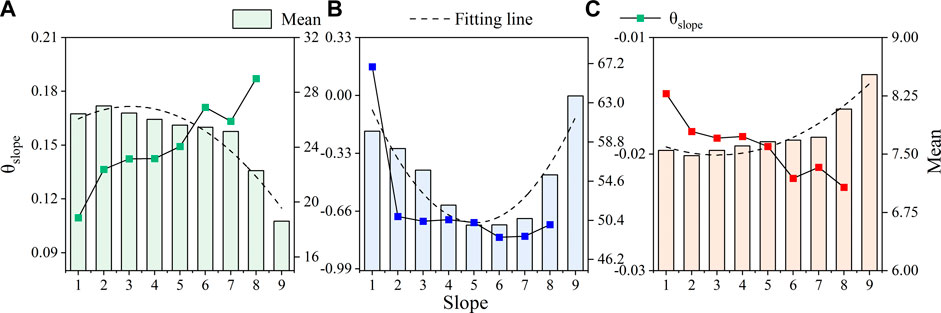
FIGURE 10. Effect of slope on soil water–salt: (A) effect of slope on SWC, (B) effect of slope on EC, and (C) effect of slope on pH. Note: 1–21 respectively represent 0°–4°, 4°–8°, 8°–12°, ... 32°–36°, 36°–40°, >40°; constrained conditions: elevation of 3,400–3,600 m and aspect of southern.
Aspects were extracted by ArcGIS and automatically classified into nine categories. The overlapping regions with an elevation of 3,400–3,600 m and a slope of 4°–8° were used as constrained conditions, and the mean and
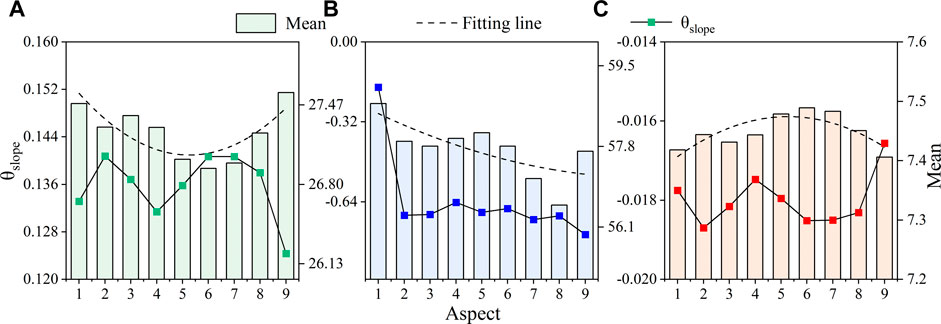
FIGURE 11. Effect of aspect on soil water–salt: (A) effect of aspect on SWC, (B) effect of aspect on EC, and (C) effect of aspect on pH. Note: 1–9 represent north, northeast, east, southeast, south, southwest, west, northwest, and north, respectively; constrained conditions: elevation of 3,400–3,600 m and slope of 4°–8°.
In contrast to Gorji et al., 2020 and Webb et al., 2021, where EC and pH were estimated using the vegetation index NDVI, in this work, NDVI, NPP, and LAI were introduced to ensure adequacy of vegetation information. As shown in Table 4, the R2 for SWC, EC, and pH was 0.557, 0.302, and 0.678, respectively, indicating the correlation between vegetation indices and soil moisture and salinity. The results showed that vegetation index could characterize the spatiotemporal distribution of soil water–salt. Regression analysis of the predicted and observed values indicated that the model could be used in subsequent studies (Figure 4).
The spatial and temporal distribution of SWC, EC, and pH were estimated and plotted for the period from 2000 to 2021 using the aforementioned model (Figures 5, 6). Soil water–salt was locally aggregated throughout the study area for 22 years (Figure 6), with an upward trend in SWC and a corresponding downward trend in EC and pH (Figure 7). The results were similar to those of Shu et al. (2017) in which vegetation restoration improved soil infiltration rate and soil water retention, while soil moisture was negatively correlated with soil salinity (An et al., 2019). The aforementioned study speculated that the overall ecological environment of the Gannan Water Conservation Area was gradually becoming more favorable, which may be influenced by human activities such as the promotion of the Gannan grazing restoration project after 2000 (Shao et al., 2016).
In addition, the ecological situation in Maqu County in the study area was the opposite of that in other regions, namely, a decrease in SWC with a simultaneous increase in EC and pH. These results are mainly due to the fact that Maqu County is located in the degraded alpine highlands in northwest China (Zhao et al., 2019), and the causes of its degradation are well-documented and discussed (Hu et al., 2011; Niu et al., 2019; Yang et al., 2021). Moreover, the results of the Hurst exponent calculations in the research predict that the future distribution of soil water–salt will be opposite to the current trend, i.e., SWC will decrease rather than increase, while EC and pH show the opposite trend (Figure 8). The mechanisms underlying the prediction of the results need to be further investigated by including climatic, socioeconomic, and other factors. In summary, these approaches and findings will allow land managers to quickly identify salinized areas and remediate the soil.
To more accurately assess the spatiotemporal distribution of soil water–salt in the alpine area in response to topography, the map of topographic factors was overlaid with the map of soil water–salt distribution, and the mean and
The study showed that the mean multi–annual SWC increases to decreases with elevation, reaching a maximum at 3,400–3,800 m and appearing as a single peak, while EC and pH show the opposite trend (Figure 9). These results differ from those of Praeg et al. (2020), who studied the elevation gradient of pastures less than 2000 m and found that soil pH decreased with increasing elevation. The reason for this difference may be that atmospheric circulation influences precipitation so that it gradually increases with elevation at lower elevations (Yao et al., 2016; Li et al., 2017; Preece et al., 2021) and then shows a decreasing trend, probably due to the peculiarity of the study region which has a difference of about 2,700 m between high and low elevations. However, the regions above 3,800 m are mainly located in the northwest of Maqu County, where some literatures indicate that the region is vulnerable to climatic effects (Wu et al., 2019; Yang et al., 2021). In addition, soil water–salt is more sensitive at lower elevations than at higher elevations, probably because lower elevations are more susceptible to human activities (Liu et al., 2021). Therefore, the specific intrinsic mechanism need to be further explored.
Mean annual SWC showed a downward trend with increasing slope, while EC and pH showed an upward trend (Figure 10). Previous studies have shown that regions with steeper slopes are more susceptible to erosion, and thus soil and water loss (Li et al., 2018; Leuthold et al., 2021) and that increasing slopes lead to less soil infiltration (Mu et al., 2015), which can be used to explain the results. Another finding was that the multi-annual trend was prominent on various slopes, which may be because regions on gentle slopes are more susceptible to external disturbances that affect the soil water–salt distribution (Keesstra et al., 2016; He et al., 2021), and further investigation is needed.
The differences in soil water–salt response to different aspects were also significant, showing lower SWC in the south and lower pH in the north (Figure 11). The results are consistent with some previous works, indicating that the south is more affected by solar radiation than the north (Griffiths et al., 2009) and that high temperature promotes evapotranspiration (Hanna et al., 1982). Moreover, there was an obvious regularity in the trend of soil water–salt over the years under different aspects, and in terms of absolute value, the aspects had an influence on soil water–salt as well as elevation and slope. The causes of this phenomenon should be further investigated.
A convenient and efficient method was to invert the spatiotemporal distribution of soil water–salt by vegetation indices, which were easy to calculate and not limited by geographic location. Most importantly, this represented a departure from traditional field measurements and allowed the exploration of variations in long-term time series. However, since the spatial resolution of the MODIS data in this study was 500 m, there may be problems such as projection errors and multiple geographic phenomena covered by a single pixel, which makes the results of the study uncertain to some extent. Therefore, the study should be deepened considering the current situation, and remote sensing data with medium to high resolution should be used in the future.
In exploring the influence of topography on water–salt distribution in soil, the control factors selected in the study were based only on the proportion of the area affected by various topographic factors. This approach had its limitations and could ignore the results of gradations other than the control factors. Therefore, a more comprehensive study of the topographic control factors for each gradation is needed. In addition, the results of the variation of soil water–salt distribution with topography showed only the approximate interval of the inflexion point of the topographic factor. In future studies, the soil water–salt distribution of microtopography should be further explored by remote sensing to obtain a more accurate turning point. This study is limited to the topography as a driving factor for the variations of soil water–salt concentration. The broader effects of climate and human activities need to be further explored.
This work investigated the spatiotemporal variation of soil water–salt in the alpine area from 2000 to 2021 and explored the influence of elevation, slope, and aspect. The methodology and findings of this study could provide a reference for soil and water conservation in alpine grassland ecosystems and for achieving sustainable development. The following results were obtained:
The vegetation indices were used to build models for SWC, EC, and pH, and the estimated values were regressed with field measurements to verify the accuracy of the models. The results showed that the inversion models were suitable for estimating the spatiotemporal variation of soil water–salt.
The mean SWC value showed a fluctuating upward trend during 2000–2021, while EC and pH showed the opposite trend. In terms of spatial distribution, the hot spots (high values) and cold spots (low values) of SWC and pH showed opposite conditions, with areas of high SWC predominating. In terms of trend variations, the θslope of SWC showed an overall upward trend, while EC and pH showed a significant upward trend in Maqu County and a downward trend in other regions. Furthermore, the Hurst exponent indicated that the future trend of SWC is generally increasing to decreasing, while that of EC and pH is decreasing to increasing, a conclusion that needs to be verified by more intensive studies.
The mean multi–annual SWC showed an upward trend and then a downward trend with increasing elevation and a downward trend with increasing slope. Elevation for EC and pH, showing similar trends, were both opposite to that of SWC. The slope had a more significant effect on EC than on SWC and pH, and the opposite effect of aspect on SWC and pH was observed. In summary, the effects of elevation, slope, and aspect are responsive to soil water–salt to some extent.
The θslope of SWC, EC, and pH was more stable at 2,400–4,600 m and had an inflexion point at 4°–8° and 20°–24°. The absolute value of θslope shows that the influence of elevation, slope, and aspect on the spatiotemporal trend of SWC, EC, and pH was significant.
The datasets presented in this article are not readily available because they need to be used in future work. Requests to access the datasets should be directed to Xiaoning Zhang, enhuODkzNzA3NjA3QDE2My5jb20=.
XZ: conceptualization, methodology, and writing—original draft. LN: data curation and formal analysis. SA: writing—review and editing. QW: software and formal analysis. XDL: data curation. XL: supervision and validation. XYL: software and formal analysis. YY: resources and validation. CH: investigation and visualization. MZ: investigation and visualization. ZM: investigation and visualization. QL: investigation and visualization. LL: investigation and visualization. BM: investigation and visualization.
This work was supported by the Self-initiated Project of Gansu Agricultural University, grant number GSAU-ZL-2015046; the research on ecological land consolidation and barrier function in the context of multi-regulation of Gansu Provincial Land and Resources Department, grant number XZ-20160812; unified confirmation of right registration of natural resources of Gansu Provincial Land and Resources Department, grant number XZ-20180914; the Youth Science and Technology Fund of Gansu Province, grant number 20JR5RA014; and the National Natural Science Foundation of China grant number 31601984.
The authors would like to thank the editors and anonymous reviewers for their thoughtful suggestions, and thank the teachers and students of the Land Use Research Institute of Gansu Agricultural University for their efforts in data collection, processing, and verification.
The authors declare that the research was conducted in the absence of any commercial or financial relationships that could be construed as a potential conflict of interest.
All claims expressed in this article are solely those of the authors and do not necessarily represent those of their affiliated organizations, or those of the publisher, the editors, and the reviewers. Any product that may be evaluated in this article, or claim that may be made by its manufacturer, is not guaranteed or endorsed by the publisher.
Ahmed, F., Arthur, E., Liu, H., and Andersen, M. N. (2020). New rootsnap sensor reveals the ameliorating effect of biochar on in situ root growth dynamics of maize in sandy soil. Front. Plant Sci. 11, 949. doi:10.3389/fpls.2020.00949
An, Y., Gao, Y., Zhang, Y., Tong, S., and Liu, X. (2019). Early establishment of Suaeda salsa population as affected by soil moisture and salinity: Implications for pioneer species introduction in saline-sodic wetlands in Songnen Plain, China. Ecol. Indic. 107, 105654. doi:10.1016/j.ecolind.2019.105654
Anselin, L. (1995). Local indicators of spatial association—Lisa. Geogr. Anal. 27 (2), 93–115. doi:10.1111/j.1538-4632.1995.tb00338.x
Chang, X., Lü, S., Feng, Z., and Ye, S. (2015). Impact of topography on the spatial distribution pattern of net primary productivity in a meadow. Acta eco. Sin. 35 (10), 3339–3348. doi:10.5846/stxb201306201748
Chen, J., Yan, F., and Lu, Q. (2020). Spatiotemporal variation of vegetation on the Qinghai–Tibet Plateau and the influence of climatic factors and human activities on vegetation trend (2000–2019). Remote Sens. (Basel). 12 (19), 3150. doi:10.3390/rs12193150
Davari, M., Karimi, S. A., Bahrami, H. A., Hossaini, S. M. T., and Fahmideh, S. (2021). Simultaneous prediction of several soil properties related to engineering uses based on laboratory Vis-NIR reflectance spectroscopy. Catena 197, 104987. doi:10.1016/j.catena.2020.104987
Du, R., Peng, X., Wang, K., Frauenfeld, O. W., Chen, C., Sun, W., et al. (2021). Response of peat-rich permafrost to a warming climate on the northeast Tibetan Plateau. Agric. For. Meteorol. 311, 108681. doi:10.1016/j.agrformet.2021.108681
González-Alcaraz, M., Jiménez-Cárceles, F., Álvarez, Y., and Álvarez-Rogel, J. (2014). Gradients of soil salinity and moisture, and plant distribution, in a mediterranean semiarid saline watershed: A model of soil–plant relationships for contributing to the management. Catena 115, 150–158. doi:10.1016/j.catena.2013.11.011
Gorji, T., Yildirim, A., Hamzehpour, N., Tanik, A., and Sertel, E. (2020). Soil salinity analysis of Urmia Lake Basin using Landsat-8 OLI and Sentinel-2A based spectral indices and electrical conductivity measurements. Ecol. Indic. 112, 106173. doi:10.1016/j.ecolind.2020.106173
Griffiths, R., Madritch, M., and Swanson, A. (2009). The effects of topography on forest soil characteristics in the Oregon Cascade Mountains (USA): Implications for the effects of climate change on soil properties. For. Ecol. Manage. 257 (1), 1–7. doi:10.1016/j.foreco.2008.08.010
Hanna, A., Harlan, P., and Lewis, D. (1982). Soil available water as influenced by landscape position and aspect 1. Agron. J. 74 (6), 999–1004. doi:10.2134/agronj1982.00021962007400060016x
He, B., Cai, Y., Ran, W., Zhao, X., and Jiang, H. (2015). Spatial and seasonal variations of soil salinity following vegetation restoration in coastal saline land in eastern China. Catena 127, 147–153. doi:10.1016/j.catena.2014.02.007
He, J., Shi, X., and Fu, Y. (2021). Identifying vegetation restoration effectiveness and driving factors on different micro-topographic types of hilly Loess Plateau: From the perspective of ecological resilience. J. Environ. Manage. 289, 112562. doi:10.1016/j.jenvman.2021.112562
Holben, B. N. (1986). Characteristics of maximum-value composite images from temporal AVHRR data. Int. J. Remote Sens. 7 (11), 1417–1434. doi:10.1080/01431168608948945
Hu, Y., Maskey, S., Uhlenbrook, S., and Zhao, H. (2011). Streamflow trends and climate linkages in the source region of the Yellow River, China. Hydrol. Process. 25 (22), 3399–3411. doi:10.1002/hyp.8069
Keesstra, S., Pereira, P., Novara, A., Brevik, E. C., Azorin-Molina, C., Parras-Alcántara, L., et al. (2016). Effects of soil management techniques on soil water erosion in apricot orchards. Sci. Total Environ. 551, 357–366. doi:10.1016/j.scitotenv.2016.01.182
Kong, J.-j., Yang, J., and Cai, W. (2019). Topography controls post-fire changes in soil properties in a Chinese boreal forest. Sci. Total Environ. 651, 2662–2670. doi:10.1016/j.scitotenv.2018.10.164
Legates, D. R., Mahmood, R., Levia, D. F., DeLiberty, T. L., Quiring, S. M., Houser, C., et al. (2011). Soil moisture: A central and unifying theme in physical geography. Prog. Phys. Geogr. Earth Environ. 35 (1), 65–86. doi:10.1177/0309133310386514
Lesch, S., Rhoades, J., Lund, L., and Corwin, D. (1992). Mapping soil salinity using calibrated electromagnetic measurements. Soil Sci. Soc. Am. J. 56 (2), 540–548. doi:10.2136/sssaj1992.03615995005600020031x
Leuthold, S. J., Quinn, D., Miguez, F., Wendroth, O., Salmeron, M., and Poffenbarger, H. (2021). Topographic effects on soil microclimate and surface cover crop residue decomposition in rolling cropland. Agric. Ecosyst. Environ. 320, 107609. doi:10.1016/j.agee.2021.107609
Li, M., Zhang, X., Wu, J., Ding, Q., Niu, B., and He, Y. (2021). Declining human activity intensity on alpine grasslands of the Tibetan Plateau. J. Environ. Manage. 296, 113198. doi:10.1016/j.jenvman.2021.113198
Li, W., Wang, Y., Yang, J., and Deng, Y. (2022). Time-lag effect of vegetation response to volumetric soil water content: A case study of guangdong Province, southern China. Remote Sens. (Basel). 14 (6), 1301. doi:10.3390/rs14061301
Li, X., McCarty, G. W., Karlen, D. L., and Cambardella, C. A. (2018). Topographic metric predictions of soil redistribution and organic carbon in Iowa cropland fields. Catena 160, 222–232. doi:10.1016/j.catena.2017.09.026
Li, X., Wang, L., Guo, X., and Chen, D. (2017). Does summer precipitation trend over and around the Tibetan Plateau depend on elevation? Int. J. Climatol. 37, 1278–1284. doi:10.1002/joc.4978
Liu, Y., Tian, J., Liu, R., and Ding, L. (2021). Influences of climate change and human activities on NDVI changes in China. Remote Sens. (Basel). 13 (21), 4326. doi:10.3390/rs13214326
Madonsela, S., Cho, M. A., Ramoelo, A., Mutanga, O., and Naidoo, L. (2018). Estimating tree species diversity in the savannah using NDVI and woody canopy cover. Int. J. Appl. Earth Obs. Geoinf. 66, 106–115. doi:10.1016/j.jag.2017.11.005
Meng, B., Gao, J., Liang, T., Cui, X., Ge, J., Yin, J., et al. (2018). Modeling of alpine grassland cover based on unmanned aerial vehicle technology and multi-factor methods: A case study in the east of Tibetan plateau, China. Remote Sens. (Basel). 10 (2), 320. doi:10.3390/rs10020320
Mngadi, M., Odindi, J., Mutanga, O., and Sibanda, M. (2022). Estimating aboveground net primary productivity of reforested trees in an urban landscape using biophysical variables and remotely sensed data. Sci. Total Environ. 802, 149958. doi:10.1016/j.scitotenv.2021.149958
Moran, P. A. (1948). The interpretation of statistical maps. J. R. Stat. Soc. Ser. B 10 (2), 243–251. doi:10.1111/j.2517-6161.1948.tb00012.x
Mu, W., Yu, F., Li, C., Xie, Y., Tian, J., Liu, J., et al. (2015). Effects of rainfall intensity and slope gradient on runoff and soil moisture content on different growing stages of spring maize. Water 7 (6), 2990–3008. doi:10.3390/w7062990
Mzid, N., Castaldi, F., Tolomio, M., Pascucci, S., Casa, R., and Pignatti, S. (2022). Evaluation of agricultural bare soil properties retrieval from landsat 8, sentinel-2 and PRISMA satellite data. Remote Sens. (Basel). 14 (3), 714. doi:10.3390/rs14030714
Niu, Y., Zhu, H., Yang, S., Ma, S., Zhou, J., Chu, B., et al. (2019). Overgrazing leads to soil cracking that later triggers the severe degradation of alpine meadows on the Tibetan Plateau. Land Degrad. Dev. 30 (10), 1243–1257. doi:10.1002/ldr.3312
Praeg, N., Seeber, J., Leitinger, G., Tasser, E., Newesely, C., Tappeiner, U., et al. (2020). The role of land management and elevation in shaping soil microbial communities: Insights from the Central European Alps. Soil Biol. Biochem. 150, 107951. doi:10.1016/j.soilbio.2020.107951
Preece, J. R., Shinker, J. J., Riebe, C. S., and Minckley, T. A. (2021). Elevation-dependent precipitation response to ElNino-Southernoscillation revealed in headwater basins of theUScentral Rocky Mountains. Int. J. Climatol. 41 (2), 1199–1210. doi:10.1002/joc.6790
Qiu, Y., Fu, B., Wang, J., and Chen, L. (2001). Spatial variability of soil moisture content and its relation to environmental indices in a semi-arid gully catchment of the Loess Plateau, China. J. Arid. Environ. 49 (4), 723–750. doi:10.1006/jare.2001.0828
Rabii, F., Achour, H., Rebai, N., and Jallouli, C. (2017). Hypsometric integral for the identification of neotectonic and lithology differences in low tectonically active area (Utica-Mateur region, north-eastern Tunisia). Geocarto Int. 32 (11), 1229–1242. doi:10.1080/10106049.2016.1195890
Salcedo, F. P., Cutillas, P. P., Cabañero, J. J. A., and Vivaldi, A. G. (2022). Use of remote sensing to evaluate the effects of environmental factors on soil salinity in a semi-arid area. Sci. Total Environ. 815, 152524. doi:10.1016/j.scitotenv.2021.152524
Shah, S. H. H., Wang, J., Hao, X., and Thomas, B. W. (2021). Modeling the effect of salt-affected soil on water balance fluxes and nitrous oxide emission using modified DNDC. J. Environ. Manage. 280, 111678. doi:10.1016/j.jenvman.2020.111678
Shao, H., Sun, X., Wang, H., Zhang, X., Xiang, Z., Tan, R., et al. (2016). A method to the impact assessment of the returning grazing land to grassland project on regional eco-environmental vulnerability. Environ. Impact Assess. Rev. 56, 155–167. doi:10.1016/j.eiar.2015.10.006
Sharma, R., Bell, R., and Wong, M. (2017). Dissolved reactive phosphorus played a limited role in phosphorus transport via runoff, throughflow and leaching on contrasting cropping soils from southwest Australia. Sci. Total Environ. 577, 33–44. doi:10.1016/j.scitotenv.2016.09.182
Shu, X., Zhang, K., Zhang, Q., and Wang, W. (2017). Response of soil physico-chemical properties to restoration approaches and submergence in the water level fluctuation zone of the Danjiangkou Reservoir, China. Ecotoxicol. Environ. Saf. 145, 119–125. doi:10.1016/j.ecoenv.2017.07.023
Suleymanov, A., Abakumov, E., Suleymanov, R., Gabbasova, I., and Komissarov, M. (2021). The soil nutrient digital mapping for precision agriculture cases in the trans-ural steppe zone of Russia using topographic attributes. ISPRS Int. J. Geoinf. 10 (4), 243. doi:10.3390/ijgi10040243
Taghdis, S., Farpoor, M. H., and Mahmoodabadi, M. (2022). Pedological assessments along an arid and semi-arid transect using soil spectral behavior analysis. Catena 214, 106288. doi:10.1016/j.catena.2022.106288
Tong, S., Lai, Q., Zhang, J., Bao, Y., Lusi, A., Ma, Q., et al. (2018a). Spatiotemporal drought variability on the Mongolian Plateau from 1980–2014 based on the SPEI-PM, intensity analysis and Hurst exponent. Sci. Total Environ. 615, 1557–1565. doi:10.1016/j.scitotenv.2017.09.121
Tong, S., Zhang, J., Bao, Y., Lai, Q., Lian, X., Li, N., et al. (2018b). Analyzing vegetation dynamic trend on the Mongolian Plateau based on the Hurst exponent and influencing factors from 1982–2013. J. Geogr. Sci. 28 (5), 595–610. doi:10.1007/s11442-018-1493-x
Tran, T. V., Tran, D. X., Ho, N., Latorre-Carmona, P., and Myint, S. W. (2021). Characterising spatiotemporal vegetation variations using LANDSAT time-series and Hurst exponent index in the Mekong River Delta. Land Degrad. Dev. 32 (13), 3507–3523. doi:10.1002/ldr.3934
Tran, T. V., Tran, D. X., Myint, S. W., Huang, C.-Y., Pham, H. V., Luu, T. H., et al. (2019). Examining spatiotemporal salinity dynamics in the Mekong River Delta using Landsat time series imagery and a spatial regression approach. Sci. Total Environ. 687, 1087–1097. doi:10.1016/j.scitotenv.2019.06.056
Unamunzaga, O., Besga, G., Castellón, A., Usón, M., Chéry, P., Gallejones, P., et al. (2014). Spatial and vertical analysis of soil properties in a Mediterranean vineyard soil. Soil Use Manag. 30 (2), 285–296. doi:10.1111/sum.12110
Wang, D., Zhou, H., Zuo, J., Chen, P., She, Y., Yao, B., et al. (2022a). Responses of soil microbial metabolic activity and community structure to different degraded and restored grassland gradients of the Tibetan plateau. Front. Plant Sci. 13, 770315. doi:10.3389/fpls.2022.770315
Wang, J., Ding, J., Yu, D., Teng, D., He, B., Chen, X., et al. (2020a). Machine learning-based detection of soil salinity in an arid desert region, northwest China: A comparison between landsat-8 oli and sentinel-2 msi. Sci. Total Environ. 707, 136092. doi:10.1016/j.scitotenv.2019.136092
Wang, X., Li, T., Ikhumhen, H. O., and Sá, R. M. (2022b). Spatio-temporal variability and persistence of PM2. 5 concentrations in China using trend analysis methods and Hurst exponent. Atmos. Pollut. Res. 13 (1), 101274. doi:10.1016/j.apr.2021.101274
Wang, Y., Zhang, C., Han, X., Mao, T., and Jia, X. (2015). Choosing an optimal land-use pattern for restoring eco-environments in a semiarid region of the Chinese Loess Plateau. Ecol. Eng. 74, 213–222. doi:10.1016/j.ecoleng.2014.10.001
Wang, Z., Zhang, F., Zhang, X., Chan, N. W., Kung, H.-t., Zhou, X., et al. (2020b). Quantitative evaluation of spatial and temporal variation of soil salinization risk using GIS-based geostatistical method. Remote Sens. (Basel). 12 (15), 2405. doi:10.3390/rs12152405
Webb, H., Barnes, N., Powell, S., and Jones, C. (2021). Does drone remote sensing accurately estimate soil pH in a spring wheat field in southwest Montana? Precis. Agric. 22 (6), 1803–1815. doi:10.1007/s11119-021-09812-z
Wu, D., Jia, K., Zhang, X., Zhang, J., El-Hamid, A., and Hazem, T. (2021a). Remote sensing inversion for simulation of soil salinization based on hyperspectral data and ground analysis in Yinchuan, China. Nat. Resour. Res. 30 (6), 4641–4656. doi:10.1007/s11053-021-09925-2
Wu, J., Zheng, H., and Xi, Y. (2019). SWAT-based runoff simulation and runoff responses to climate change in the headwaters of the Yellow River, China. Atmosphere 10 (9), 509. doi:10.3390/atmos10090509
Wu, Y., Zhao, S., Dai, L., Liu, Y., Xie, L., Zhang, Z., et al. (2021b). Tides affect plant connectivity in coastal wetlands on a small-patch scale. Chemosphere 262, 127977. doi:10.1016/j.chemosphere.2020.127977
Xu, H., Demetriades, A., Reimann, C., Jiménez, J. J., Filser, J., Zhang, C., et al. (2019). Identification of the co-existence of low total organic carbon contents and low pH values in agricultural soil in north-central Europe using hot spot analysis based on GEMAS project data. Sci. Total Environ. 678, 94–104. doi:10.1016/j.scitotenv.2019.04.382
Xu, L., and Wang, Q. (2015). Retrieval of soil water content in saline soils from emitted thermal infrared spectra using partial linear squares regression. Remote Sens. (Basel). 7 (11), 14646–14662. doi:10.3390/rs71114646
Yang, L., Chen, L., and Wei, W. (2015). Effects of vegetation restoration on the spatial distribution of soil moisture at the hillslope scale in semi-arid regions. Catena 124, 138–146. doi:10.1016/j.catena.2014.09.014
Yang, S., Liu, X., Cheng, T., Luo, Y., Li, Q., Liu, L., et al. (2021). Stepwise weakening of aeolian activities during the holocene in the gannan region, eastern Tibetan plateau. Front. Earth Sci. (Lausanne). 9, 686677. doi:10.3389/feart.2021.686677
Yao, J., Yang, Q., Mao, W., Zhao, Y., and Xu, X. (2016). Precipitation trend-Elevation relationship in arid regions of the China. Glob. Planet. Change 143, 1–9. doi:10.1016/j.gloplacha.2016.05.007
Yin, L., Feng, X., Fu, B., Chen, Y., Wang, X., and Tao, F. (2020a). Irrigation water consumption of irrigated cropland and its dominant factor in China from 1982 to 2015. Adv. Water Resour. 143, 103661. doi:10.1016/j.advwatres.2020.103661
Yin, L., Wang, X., Feng, X., Fu, B., and Chen, Y. (2020b). A comparison of SSEBop-Model-Based evapotranspiration with eight evapotranspiration products in the Yellow River Basin, China. Remote Sens. (Basel). 12 (16), 2528. doi:10.3390/rs12162528
Yu, X., Huang, Y., Li, E., Li, X., and Guo, W. (2018). Effects of rainfall and vegetation to soil water input and output processes in the Mu Us Sandy Land, northwest China. Catena 161, 96–103. doi:10.1016/j.catena.2017.10.023
Zhang, X., Liu, M., Zhao, X., Li, Y., Zhao, W., Li, A., et al. (2018a). Topography and grazing effects on storage of soil organic carbon and nitrogen in the northern China grasslands. Ecol. Indic. 93, 45–53. doi:10.1016/j.ecolind.2018.04.068
Zhang, Y., Dong, S., Gao, Q., Liu, S., Zhou, H., Ganjurjav, H., et al. (2016). Climate change and human activities altered the diversity and composition of soil microbial community in alpine grasslands of the Qinghai-Tibetan Plateau. Sci. Total Environ. 562, 353–363. doi:10.1016/j.scitotenv.2016.03.221
Zhang, Y., Sui, B., Shen, H., and Wang, Z. (2018b). Estimating temporal changes in soil pH in the black soil region of Northeast China using remote sensing. Comput. Electron. Agric. 154, 204–212. doi:10.1016/j.compag.2018.09.005
Zhao, Y., Wang, X., Ou, Y., Jia, H., Li, J., Shi, C., et al. (2019). Variations in soil δ13C with alpine meadow degradation on the eastern Qinghai–Tibet Plateau. Geoderma 338, 178–186. doi:10.1016/j.geoderma.2018.12.005
Zhong, Y., Lin, A., Xiao, C., and Zhou, Z. (2021). Research on the spatio-temporal dynamic evolution characteristics and influencing factors of electrical power consumption in three urban agglomerations of Yangtze River Economic Belt, China based on DMSP/OLS night light data. Remote Sens. (Basel). 13 (6), 1150. doi:10.3390/rs13061150
Zhu, M., Feng, Q., Qin, Y., Cao, J., Zhang, M., Liu, W., et al. (2019). The role of topography in shaping the spatial patterns of soil organic carbon. Catena 176, 296–305. doi:10.1016/j.catena.2019.01.029
Keywords: Alpine grasslands, topography, spatiotemporal dynamics, soil water content, soil salinity, the source region of Yellow river
Citation: Zhang X, Nian L, Adingo S, Wang Q, Li X, Liu X, Liu XY, Yang Y, Hui C, Zhang M, Mao Z, Li Q, Luo L and Ma B (2022) Spatiotemporal dynamics of soil water-salt and its topographic gradient effects on Alpine area over the Northeastern Tibetan Plateau, China. Front. Environ. Sci. 10:950547. doi: 10.3389/fenvs.2022.950547
Received: 23 May 2022; Accepted: 12 October 2022;
Published: 03 November 2022.
Edited by:
Shuisen Chen, Guangzhou Institute of Geography, ChinaReviewed by:
Dong Wang, Henan University, ChinaCopyright © 2022 Zhang, Nian, Adingo, Wang, Li, Liu, Liu, Yang, Hui, Zhang, Mao, Li, Luo and Ma. This is an open-access article distributed under the terms of the Creative Commons Attribution License (CC BY). The use, distribution or reproduction in other forums is permitted, provided the original author(s) and the copyright owner(s) are credited and that the original publication in this journal is cited, in accordance with accepted academic practice. No use, distribution or reproduction is permitted which does not comply with these terms.
*Correspondence: Xuelu Liu, bGl1eGxAZ3NhdS5lZHUuY24=
Disclaimer: All claims expressed in this article are solely those of the authors and do not necessarily represent those of their affiliated organizations, or those of the publisher, the editors and the reviewers. Any product that may be evaluated in this article or claim that may be made by its manufacturer is not guaranteed or endorsed by the publisher.
Research integrity at Frontiers
Learn more about the work of our research integrity team to safeguard the quality of each article we publish.