 Erin Kiskaddon
 Kara Gadeken
 Sarah K. Berke
 Susan Bell5
 Jenna M. Moore
95% of researchers rate our articles as excellent or good
Learn more about the work of our research integrity team to safeguard the quality of each article we publish.
Find out more
ORIGINAL RESEARCH article
Front. Environ. Sci. , 22 July 2022
Sec. Freshwater Science
Volume 10 - 2022 | https://doi.org/10.3389/fenvs.2022.950493
This article is part of the Research Topic Gulf of Mexico Estuaries: Ecology of the Nearshore and Coastal Ecosystems Impacted by the Deepwater Horizon Oil Spill View all 14 articles
Infaunal organisms are susceptible to disturbances such as hypoxia and sediment contamination; changes in infaunal community structure are therefore often used as indicators of anthropogenic disturbance. Susceptibility to disturbance varies across taxa, either due to physiological factors or to behaviors or functional roles that increase exposure. Both sources of variability are likely to be heritable and shared among related taxa. Thus, we would expect oil disturbance to disproportionately affect related taxa and therefore decrease phylogenetic diversity (PD). We test this hypothesis for a shallow water marine infaunal community using a simulation approach that iteratively removes clades with shared vulnerability to oil exposure. Infauna were sampled at two sites in the Chandeleur Islands, LA, that reflect different exposures to crude oil after the Deepwater Horizon event. Seagrass and adjacent bare sediment habitats were sampled in 2015, 5 years after initial oil exposure, and again in 2016 after an acute re-oiling event. We found that strong correlation between PD and family richness masked any detectable PD patterns with oil exposure. For our full community tree, sensitivity analysis indicated that the removal of larger clades did not disproportionately reduce PD, against our prediction. For this pair of sites, PD did not provide a better metric for assessing the impacts of oil exposure than family richness alone. It is possible, however, that finer-scale taxonomic resolution of infaunal communities may better decouple PD from taxonomic richness. More work is needed to fully evaluate the impacts of disturbance on PD.
Marine benthic invertebrate taxa facilitate many critical ecosystem functions, including serving as an important trophic link between the base of the food chain and higher trophic levels (Grebmeier et al., 2006; Davis et al., 2014). Sediment invertebrates play important roles in nutrient cycling, organic matter burial, and remineralization (Boudreau and Jørgensen, 2001; Middleburg 2019). Benthic macroinfauna are well-recognized biological indicators of ecosystem quality in coastal areas (Dutertre et al., 2013) and are commonly integrated into biological indices of ecosystem integrity and water quality (Dauvin and Ruellet, 2007). Benthic macrofaunal diversity is also a key variable in the development of coastal management plans (Carstensen et al., 2014). LA, United states, is a hotspot for coastal management activities focused on maintenance of coastal habitats, including emergent wetlands and barrier islands threatened by subsidence, sea level rise, extreme weather events, and oil spills (CPRA, 2017). However, there remain significant gaps in our understanding of benthic macroinfaunal community composition, dynamics, and resilience to perturbation at the base of marine food chains in coastal Louisiana.
Crude oil exposure, like the Deepwater Horizon (DWH) oil spill of 2010, is an ecosystem stressor capable of defaunating large areas of the seafloor and decreasing species diversity (Montagna et al., 2013), with long-lasting effects that may inhibit ecosystem recovery for decades after exposure (Bejarano and Michel, 2010; Pashaei et al., 2015). Montagna and Harper (1996) show that chronic oil exposure resulted in decreased abundance of harpacticoid copepods and amphipods and increased abundances of deposit feeding polychaetes and nematodes, which implies that related taxa may respond similarly to oil. In recent work by Han et al. (2017), Antarctic copepods of the genus Tigriopus exposed to a water accommodated fraction (WAF) of crude oil exhibited oxidative stress and reproductive impairment through upregulation of certain enzymes, but the effects differed among species within the genus. Reproductive impairment of certain families or genera of marine invertebrates when exposed to WAF (Scarlett et al., 2007; Lewis et al., 2008) further strengthens the hypothesis that oil exposure has the potential to alter population dynamics.
One metric that ecologists can use to detect heritable susceptibility to disturbance is an evaluation of Phylogenetic Diversity (PD). PD is defined as the sum of branch lengths in the phylogenetic tree connecting all members of a given community together, indicating diversity of evolutionary lineages of a given biological community (Faith, 1992). PD was first introduced as a tool for conservation practitioners to determine conservation priorities amongst diverse taxa based on quantitative measures of feature diversity held within related phylogenetic groups or clades (Faith, 1992). PD is commonly used to evaluate diversity in ecosystems, measure the impacts of ecosystem stressors on communities, and predict future biodiversity declines. If related taxa are susceptible to the same stressor and are lost from a community, then the resulting measure of PD will be lower than if taxa were lost at random (Faith 1992; Cadotte et al., 2008; Srivastava et al., 2012). The concept of shared susceptibility to stress based on evolutionary relatedness has been used to describe a broad array of taxa and contexts, including assessing urbanization impacts on birds (Carvajal-Castro etal., 2021), evaluating historical extinction patterns of mammals (Russell et al., 1998; Purvis et al., 2000), determining geographic distributions of threatened amphibians (Bielby et al., 2006), and identifying biodiversity hotspots and regions of potential biodiversity decline of plants (Davies et al., 2011; Yessoufou et al., 2012). These studies indicate that some incidences of stress can disproportionately impact some taxa over others (Russel et al., 1998; Purvis et al., 2000). However, recent research has shown that PD is less useful for detecting responses of macroinvertebrate communities to stress. Boda et al. (2021) found no phylogenetic signal of stream restoration impacts on macroinvertebrate communities using and Arbi et al. (2017) observed no differences between species-level indicators (richness, diversity) and measures of PD in macrobenthic communities in response to nutrient pollution.
The objective of this study is to evaluate whether PD captures changes in infaunal communities sampled from a site that was heavily impacted by oil versus those from a site that was less impacted. We used PD to examine whether oil exposure disproportionately affects benthic invertebrate families based on evolutionary relatedness and inherited susceptibility. We hypothesize that responses to crude oil would be conserved at the family level, resulting in lower PD overall. We also explicitly test the prediction that removal of related taxa rather than random taxa from a marine infaunal community phylogenetic tree would result in a substantially lower measure of PD as described for other biological communities.
This study was conducted in 2015 and 2016 on the inshore side of the Chandeleur Islands, LA, a barrier island system that received patchy oiling during the DWH oil spill in 2010. Macroinfauna were collected in shallow water (<1 m depth) at two sites roughly 3.7 km apart, one moderately to highly oiled (29.894658N, −88.828155W) and the other only lightly oiled (29.864039N, −88.842443W; sites B and A, respectively, described by Berke et al., this issue). Sampling was conducted in the summer and fall of 2015 and 2016. During sampling efforts in summer 2016, a visible layer of oil was observed at the sediment surface in the nearby marsh at the previously oiled site. The origin of the oil is unknown, but it is possible that it was transported or unearthed during a storm event over the winter of 2016 (see Berke et al., in this issue for further details). We therefore concluded that the samples collected in the summer and fall of 2015 reflect long-term oil recovery after the DWH oiling event, and the samples collected in 2016 (especially in summer) reflect short-term recovery after acute re-oiling. At each shallow water site, we sampled two distinct habitat types: seagrass (Ruppia sp., most likely R. maritima) and unvegetated sediment. Due to a lack of baseline data prior to the DWH event, differences in infauna communities between sites is used as an indicator of oiling impact.
Infaunal community analysis of these sites and habitats by Berke et al. (this issue) showed that community structures were significantly different between the sites and habitats for all sampling efforts. Furthermore, after the summer 2016 re-oiling event, abundance, family richness, and Shannon diversity were significantly lower at the oiled site. Here, we use the same dataset as Berke et al. (this issue) to determine whether phylogenetic diversity calculations contribute to our understanding of the impacts of oil on these communities. Sampling methods are described in detail by Berke et al., (this issue). Briefly, infauna samples were collected using sediment cores (10 or 15 cm diam., 15 cm depth) from both habitat types at each site. Upon collection, sediment was sieved (500 μm) in the field and macroinfauna immediately preserved in 95% EtOH with Rose Bengal stain. All preserved animals were later sorted, enumerated and identified to species-level if possible, otherwise to genus-level. Juvenile crustaceans and mollusks too small for confident identification were not included in this analysis.
To estimate phylogenetic diversity, we constructed a maximum likelihood (ML) phylogeny based on 18S ribosomal RNA and mitochondrial cytochrome oxidase subunit 1 (COI). These genes are commonly used for phylogenetic reconstruction of the four phyla included in our dataset: Annelida (Struck et al., 2006; Struck et al., 2015), Arthropoda (Koenemann et al., 2010), Mollusca (Sharma et al., 2012; Galindo et al., 2016), and Echinodermata (Janies 2001; Okanishi and Fujita, 2013). Published 18S and COI gene sequences were obtained from GenBank for most identified families, and sequences were selected from the lowest level of identification (species level where possible) to more accurately represent their phylogenetic placement. We attempted to use 18S and COI genes from the same species, however, in a few taxa this was not possible (see Supplementary Material). For taxa with no publicly available 18S and COI sequences, sequences were generated using the DNeasy Blood and Tissue Kit (Qiagen©) for DNA extraction using the manufacturer’s instructions, followed by PCR amplification using taxon-specific primers (Supplementary Table 2). PCR products were sent to Integrated DNA Technologies, Inc. for purification and sequencing using Sanger sequencing methods. Unfortunately, a few taxa had no 18S or COI sequence data available on GenBank at the time of analysis and sequencing attempts failed. We therefore omitted the families Cossuridae (Annelida), Mysidacea (Arthropoda), Tornatinidae (Mollusa), Cystiscidae (Mollusca), and Litiopidae (Mollusca), none of which were abundant in our samples. A complete list of identified families, associated GenBank accession numbers (if applicable), and DNA preparation protocols are provided in the Supplementary Material.
Sequences were trimmed and checked using Geneious v. 9.0.5 software. Each gene was aligned separately using MAFFT (Katoh and Standley, 2013); for COI, the L-INS-I algorithm with default settings was used. For 18S, the E-INS-I algorithm with default settings was used, and alignment positions comprising at least 75% gap sites were stripped from the alignment. Alignment ends were trimmed to exclude sites with poor coverage. The final gene alignments were concatenated in Geneious Pro to produce an alignment with 2,404 sites. Partitioned maximum likelihood (ML) tree reconstruction was performed using RAxML-NG v. 1.1.0-master on the CIPRES Science Gateway (Miller et al., 2010), under a gene-partitioned GTR + G model with 10 replicate tree searches and 1,000 non-parametric bootstrap replicates. Because there are limitations to the accurate reconstruction of deeper nodes based on only two genes (Hou et al., 2007; Heimeier et al., 2010; Zanol et al., 2010), particularly at the scale of multiple phyla, a constraint topology based on several more robust ML phylogenetic analyses and multiple genetic loci (Taylor et al., 2007; Bracken et al., 2009; Toon et al., 2009; Zrzavý et al., 2009; Bracken et al., 2010; Kocot et al., 2011; Okanishi et al., 2011; Smith et al., 2011; Weigert et al., 2014; Weigert et al., 2014; Struck et al., 2015; Verheye et al., 2015; Kocot et al., 2017) was generated in the Mesquite software package (v3.51; Maddison and Maddison, 2018) and applied in the ML analysis (Figure 1). Use of a constrained topology during tree building ensured that robustly supported phylogenetic relationships were retained while allowing for variable branch lengths to calculate PD. The tree was rooted using the sole deuterostome clade Echinodermata as the outgroup.
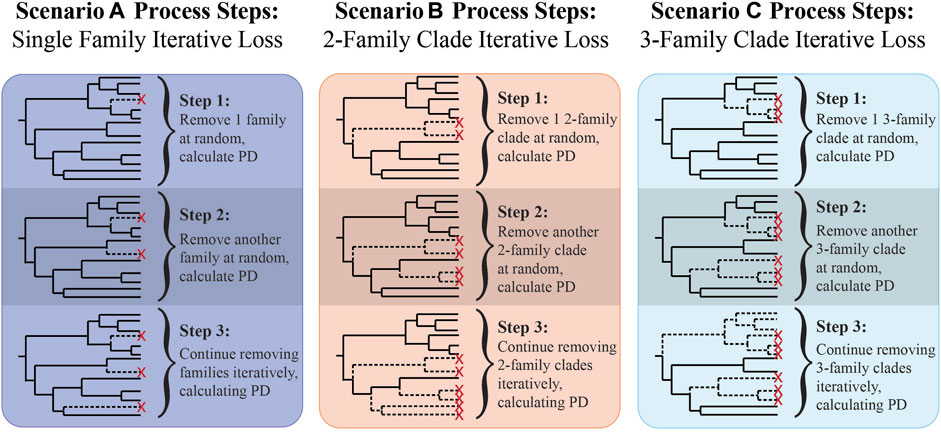
FIGURE 1. Illustration of scenario A, B, and C process steps used in the sensitivity analysis to test the effects of family clade size removal.
The final comprehensive family-level ML tree was pruned (i.e., branches removed) to obtain sub-trees that reflect the snapshot community composition found in each of the 16 community treatments (oiled/unoiled sites x seagrass/unvegetated x summer/fall x 2015/2016), hereafter referred to as “community trees.” Topologies of all community trees are given in Supplementary Figures 1–16. PD and family richness were calculated for all samples (Supplementary Material) and each of the 16 community trees.
PD analyses were conducted separately by site, year, season, and habitat by community tree. PD and family richness were calculated for each individual sample and each of the 16 community trees using the PD function (Picante v1.8 package; Kembel et al., 2010) in R (R Core Team, 2018). Prior studies have shown that PD decreases nearly linearly with taxon richness (Flynn et al., 2011; Voskamp et al., 2017); we therefore needed to statistically determine whether the observed value of PD significantly departs from the expected value for a given number of families. A significantly lower observed PD value could indicate that an environmental stressor (i.e., oil) disproportionately impacted certain families. To achieve this, we used a bootstrapping method to construct a distribution of PD values generated through randomized taxa groups. In other words, we created a null distribution of PD for richness. This null distribution was created by randomly subsampling n = family richness (with replacement) from the comprehensive tree, then calculating PD for each subsample using the PhyloMeasures v2.1 and ape v5.3 packages in R (Tsirogiannis and Sandel, 2015; Paradis and Schliep, 2018). This subsampling was repeated 10,000 times for each family richness value to obtain a null distribution of PD values associated with a given family richness. We compared PDobserved for each community against this bootstrapped null distribution for a given richness. One-tailed p-values were calculated as the proportion of the null distribution ≤ PDobserved (a one-tailed test was appropriate because we hypothesized a priori that PD would be reduced following oil disturbance).
To test our prediction that successive losses of related families would result in lower PD values, we implemented three extinction scenarios using our comprehensive family tree: A) single family loss: iterative random removal of one family branch; B) two-family clade loss: iterative random removal of clades containing two families; C) three-family clade loss: iterative random removal of clades containing three families (Figure 1). Starting with PD of the full tree, PD was calculated for the remaining branches at each removal step until no families or specified clade sizes remained. Each scenario was repeated for 100 iterations. For each iteration, the order of families removed was randomized. PD values for all 100 iterations were then plotted against family richness for each scenario. Upper bounds were used to highlight each scenario’s lowest possible rate of PD loss; upper bounds were calculated by sequentially removing families or clades based on terminal branch length ordered from shortest to longest. We predicted that PD would decrease more rapidly when larger clades were removed, therefore scenario C would result in the greatest rate of PD decline with decreasing richness. We also predicted that if oiling disproportionately eliminated groups of related taxa (i.e., larger clades), the observed PDs from the oiled site would be closer to scenario C. If oiling did not result in loss of related taxa, observed PD values would more closely reflect scenario A.
The comprehensive family-level constrained ML phylogenetic tree included 70 families across four phyla: Echinodermata, Arthropoda, Mollusca, and Annelida (Figure 2). Linear regression constrained through the origin for oiled and unoiled community trees indicated strong correlation (slope = 0.33–0.36) between PD and richness (all R2 > 0.95, Figure 3).
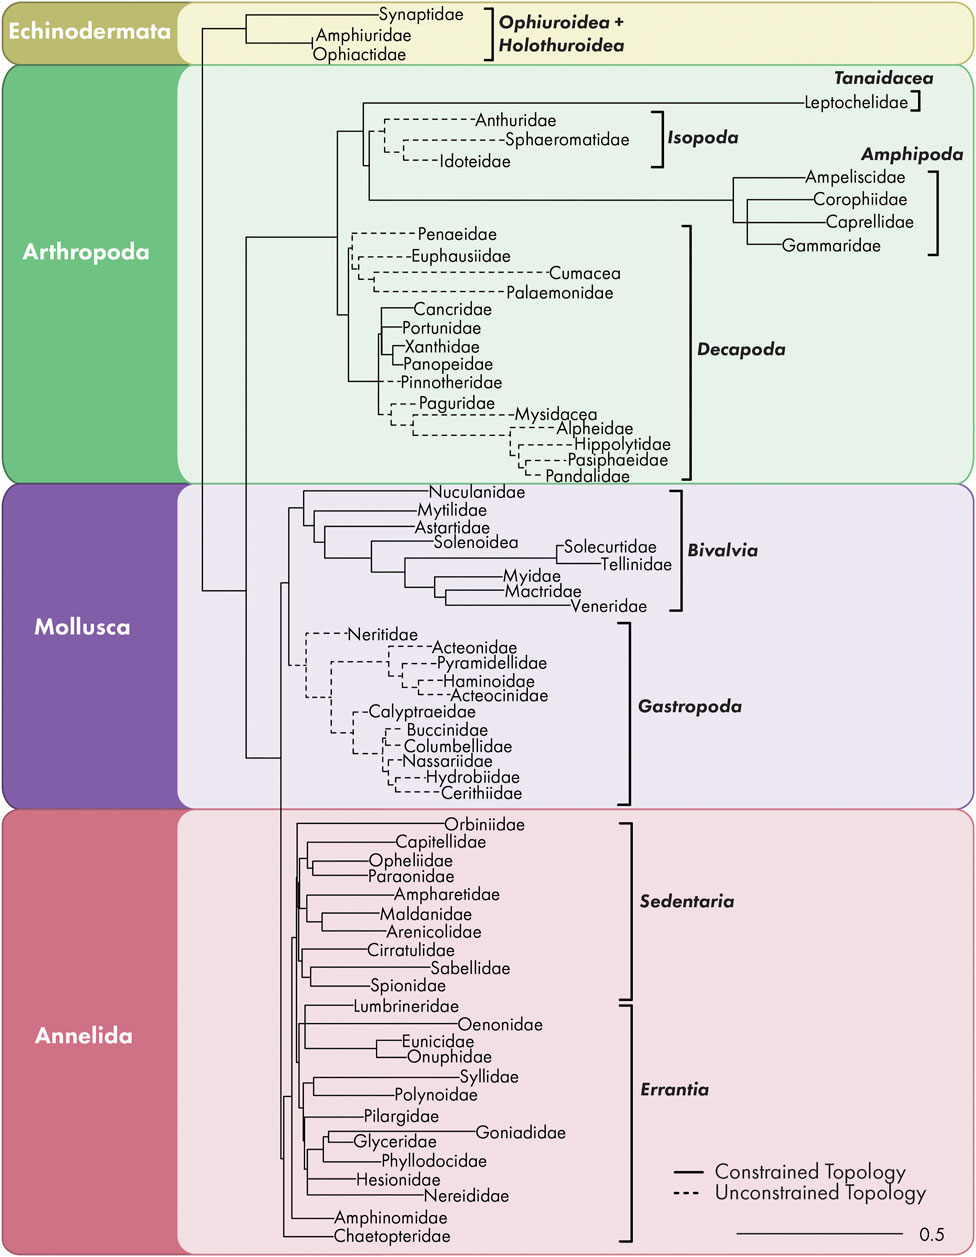
FIGURE 2. Comprehensive family-level ML phylogenetic tree showing all 70 families identified during sampling at both oiled and unoiled locations. Dashed branches indicate families were not constrained during tree building.
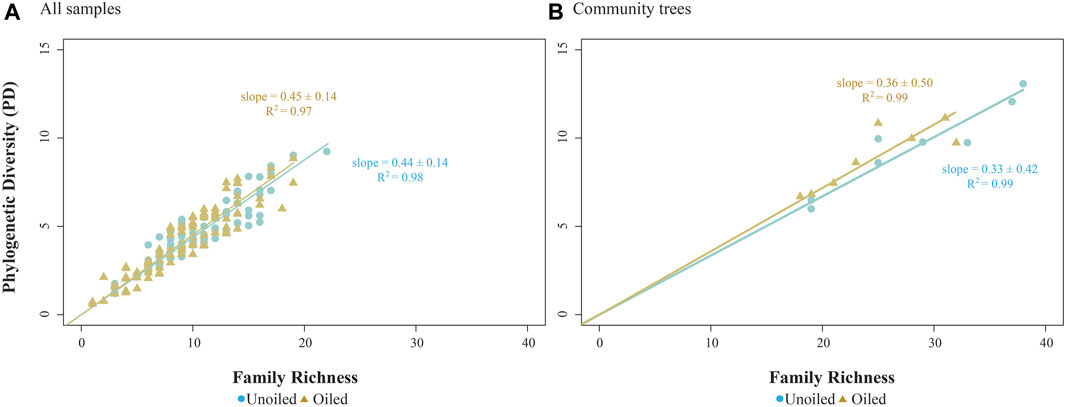
FIGURE 3. Scatterplot of PD and family richness values calculated for (A) all samples, and (B) each of the 16 community trees, separated by site. Linear regression lines constrained through the origin are given for each site, with slope ± 95% confidence interval and R2 provided.
Family richness declined markedly following the summer 2016 reoiling event (Figure 4, see also Berke et al., this volume), but was otherwise similar for samples from both the oiled and unoiled sites. Samples from seagrass versus unvegetated habitats, however, showed more pervasive differences, with two-fold higher family richness in seagrass in some instances. As expected, the null PD distributions were strongly correlated with family richness (Figure 4). None of the observed PD values were significantly lower than the randomized null distributions of PD, indicating the observed values were not different than those generated by a random group of families. The only exception was summer 2015 in which observed PD in unvegetated habitat at the oiled site was significantly greater than the distribution created using randomized trees that maintained richness (Table 1).
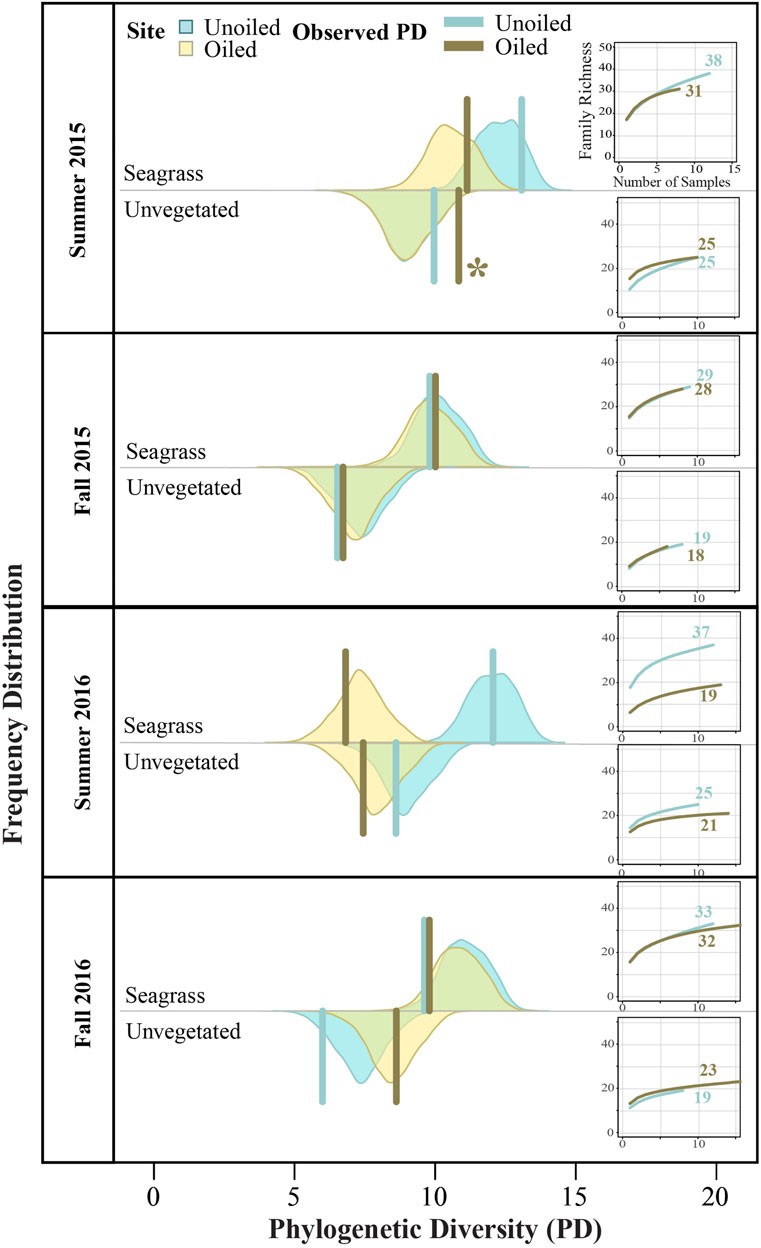
FIGURE 4. Observed community tree phylogenetic diversity (PD; solid bars) compared to null distributions (shaded areas) of PD values for the observed family richness generated for each season, year and habitat type for both sites. The asterisk (*) indicates significantly lower community PD than expected using one-tailed p-values calculated as the proportion of the null distribution ≤ PDobserved (Table 1). Sample-based rarefaction curves and associated values of family richness are also shown for each site by sampling effort. Shaded colors are transparent, green shading indicates overlap of yellow and blue regions.
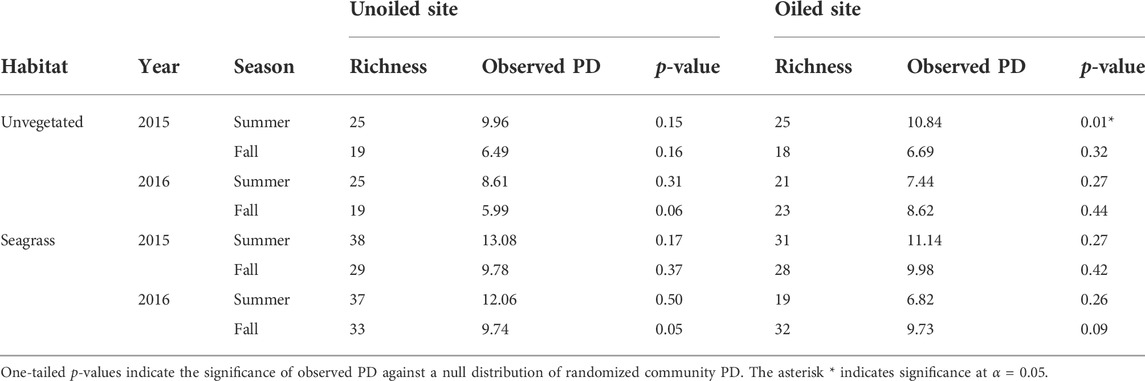
TABLE 1. Observed PD values and family richness by site, habitat, season, and sampling year for each of the 16 community trees.
We predicted that 1) PD would decline more sharply if larger clades were removed (i.e., that the PD would be lower for Scenario C than A), and 2) that PD for the oiled sites to fall within the range for Scenario C and below those of the unoiled sites, which would more closely follow Scenario A. In contrast, we found that the trends in PD decline were highly similar across all scenarios (Figure 5). Furthermore, the PD values from our community trees were within the range or slightly higher than our modelled results, regardless of oiling history.
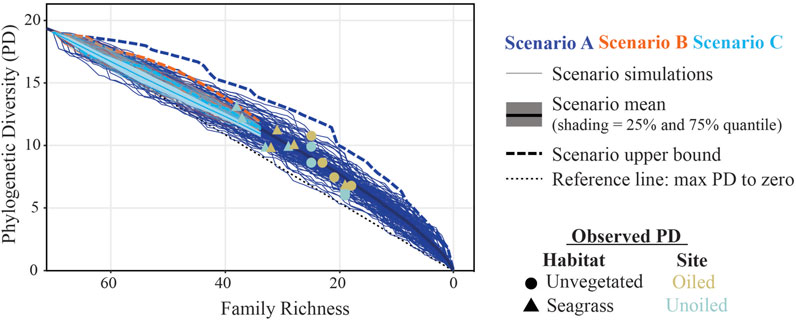
FIGURE 5. Clade loss scenarios modeling PD decline as a function of family richness. The three scenarios include: (A) single family, (B) two-family clade, and (C) three-family clade iterative PD loss. Iterations (n = 100 per scenario) and scenario mean (with 25 and 75% shaded quantiles) are plotted. The upper bounds of each scenario and a line through the origin are provided for reference. For all scenarios, the iterations fell below what would be expected from the slowest possible rate of PD loss based on removing branches/clades ordered shortest to longest total branch length (upper bound). Individual points reflect PD values from each community tree.
This analysis confirmed that family richness and PD are tightly correlated for marine infaunal communities, as expected from studies in other biological communities (Flynn et al., 2011; Voskamp et al., 2017). We predicted that PD would be significantly lower than expected for a given richness at the oiled sites, assuming that related taxa would be removed. However, the data indicate that in most of our sampling events, the PD of each community showed no effect of oiling, and in the one event in which an effect was observed, it was captured by the simpler metric of richness and calculation of PD did not contribute to better detection of the effects of oiling. We did find a significantly higher PD for one sampling effort, the oiled site in the unvegetated habitat in summer 2015 (Figure 4). Examination of the community-level tree for that effort (Supplementary Figure 14) showed the presence of the Arthropoda family Leptochelidae, a family with a noticeably long terminal branch length. Some arthropods are commonly characterized with proportionally long terminal branches when phylogenies are resolved using 18S rRNA data (Jenner et al., 2009) which explains the higher PD observed in summer 2015. More favorable genes and phylogenetic analyses are still being determined for resolving the class Malacostraca.
Our prediction that the loss of related taxa would result in lower PD, as shown in other studies (Faith 1992; Cadotte et al., 2008; Srivastava et al., 2012), was not supported for our community tree. We found substantial overlap in possible PD values when simulating loss of single family, 2-family, and 3-family clades (Figure 5). This is consistent, however, with Parhar and Mooers’ (2011) finding that PD estimates could not distinguish between random and targeted cladal extinction patterns. Phylogenetic tree topology can strongly affect how extinction of taxa from the tree decrease PD (Nee and May 1997; Malleit et al., 2018). For trees that are comb-shaped (short terminal branches) rather than bush-shaped (long terminal branches), the loss of a single taxon removes a greater proportion of the phylogenetic diversity in the tree, and phylogenetic diversity is more closely correlated with taxon richness (Nee and May 1997; Malleit et al., 2018). To better understand why our prediction was not supported, we examined our tree topology. Tree shape can be quantified using two parameters, ß and α (Maliet et al., 2018). ß quantifies variation in the species richness of clades, with higher values of ß indicating more even distributions of species among clades. ß < 0 indicates an unbalanced tree with large variation, and ß = −2 converges on a comb-like tree in which all branches connect at the spine of the tree. α describes the relationship between the age and richness of a clade, with α < 0 indicating that small clades contain evolutionarily distinct species, i.e., have long branches. Using ß and α, Maliet et al. (2018) show that PD in unbalanced trees (β < −1 or a < 0) can decrease almost as quickly as taxon richness, whereas PD loss is more gradual for more balanced trees. A post-hoc analysis of our full community tree using apTreeshape, a package that uses statistical analysis to compare tree topologies against null topologies generated from standard stochastic models of evolution (Bortolussi et al., 2006), results in a ß value of −0.80 ± (1.22) and an a value of −0.15. These ß and α values indicate that the community tree is unbalanced in favor of a comb-like structure, potentially explaining our finding of tight correlation between family richness and PD. In this case, PD may be less useful as a metric to assess disturbances because our community tree was strongly unbalanced when analyzed at a family level. We opted for a family-level analysis because a key goal of our study was to assess whether PD might be a useful metric in identifying effects of disturbances on infaunal communities. Many infaunal community studies identify organisms only to the family level (e.g., Gomez Gesteira et al., 2003; Hernández-Arana et al., 2003; Bernardino et al., 2012). Identification of infaunal taxa to species level is much more time consuming and requires much greater taxonomic expertise than identification to family-level. Additionally, a species-based tree would have required us to sequence every species rather than using available sequences from closely related species available on GenBank. This amount of effort was not feasible under the constraints of our study, and indeed would not be feasible for most community-level studies of environmental impacts.
That said, our results raise the question of whether species-level identification of taxa would result in a more balanced tree, and if so, whether PD might then be a useful metric for characterizing disturbances in sediment communities. This question is especially relevant as high-throughput DNA sequencing (HTS) is increasingly being used to survey diversity of microbial communities (Liu et al., 2021), fungal communities (Nilsson et al., 2018), microphytobenthos (An et al., 2020), meiobenthic communities (Broman et al., 2020), and macroinvertebrate communities (Carew et al., 2018; Mauffrey et al., 2020), among others. It would be interesting to know whether community trees based on HTS of sediments are more balanced than our family-level tree. Whereas HTS is increasingly used for meiofauna (Brannock et al., 2018; Broman et al., 2020), and has been shown to perform well for benthic monitoring (Lejzerowicz et al., 2015; Mauffrey et al., 2020), family richness using HTS can be much lower than that detected using traditional morphological analysis (Lejzerowicz et al., 2015). Additionally, Nascimento et al. (2018) found that large sample volumes are needed for robust analysis of sediment community diversity. However, this field is advancing rapidly, and HTS will likely become increasingly common for surveying macrofaunal communities as well as meiofauna. PD will be relatively easy to calculate for HTS data, and it appears that its usefulness depends strongly upon the tree topology.
PD is calculated from presence/absence data, but moderate oil stress can reduce abundances without completely removing taxa. Therefore, we explored the possibility of phylogenetic patterning in the distribution of effect sizes for changes in abundance at the oiled site (not shown). However, many families were rare, making it difficult to robustly estimate effect sizes and complicating the phylogenetic analysis. Berke et al. (this issue) provide further analysis of differences in infaunal communities between sites across sampling efforts.
Overall, for this pair of sites, PD did not provide a better metric for assessing the impacts of oil exposure on benthic macroinfaunal communities than family richness alone. It is possible, however, that finer taxonomic resolution of infaunal communities achieved through high throughput sequencing may better decouple PD from richness, justifying further study of the acute impacts of disturbance on PD.
The datasets presented in this study can be found in online repositories. The names of the repository/repositories and accession number(s) can be found below: https://data.gulfresearchinitiative.org/, R4.x262.000:0010, R4.x262.000:0003.
All authors contributed to project planning and coordination. EK, KD, and KG, and SB developed the idea of the paper. EK and KG led and conducted all laboratory analyses. EK, KD, and JM analysed the data and, with KG, contributed to writing the final manuscript. SB and SB were invaluable in the manuscript review and revision process.
This research was made possible by a grant from The Gulf of Mexico Research Initiative through the Alabama Center of Ecological Resilience (ACER) Consortium.
We thank Captain Gagnon and the Southern Way crew of Southern Magnolia Charters in Pass Christian, MS, for facilitating access to our field sites. We also thank Cy Clemo, Alison Robertson, Will Ballentine, Erin Keller, Tess Caffray, Erica Weldin, Shelby Budai and Stephen Hesterberg for assistance with field work and invertebrate identification. We thank Ken Halanych for helpful discussions and advice on phylogenetic analysis.
The authors declare that the research was conducted in the absence of any commercial or financial relationships that could be construed as a potential conflict of interest.
All claims expressed in this article are solely those of the authors and do not necessarily represent those of their affiliated organizations, or those of the publisher, the editors and the reviewers. Any product that may be evaluated in this article, or claim that may be made by its manufacturer, is not guaranteed or endorsed by the publisher.
The Supplementary Material for this article can be found online at: https://www.frontiersin.org/articles/10.3389/fenvs.2022.950493/full#supplementary-material
An, S. M., Choi, D. H., and Noh, J. H. (2020). High-throughput sequencing analysis reveals dynamic seasonal succession of diatom assemblages in a temperate tidal flat. Estuar. Coast. Shelf Sci. 237, 106686. doi:10.1016/j.ecss.2020.106686
Arbi, I., Jingping, Z., Songlin, L., Yunchao, W., and Ziaoping, H. (2017). Benthic habitat health assessment using macrofauna communities of a sub-tropical semi-enclosed bay under excess nutrients. Mar. Pollut. Bull. 119, 39–49. doi:10.1016/j.marpolbul.2017.03.042
Bejarano, A. C., and Michel, J. (2010). Large-scale risk assessment of polycyclic aromatic hydrocarbons in shoreline sediments from Saudi arabia: Environmental legacy after twelve years of the Gulf war oil spill. Environ. Pollut. 158, 1561–1569. doi:10.1016/j.envpol.2009.12.019
Bernardino, A. F., Levin, L. A., Thurber, A. R., and Smith, C. R. (2012). Comparative composition, diversity and trophic ecology of sediment macrofauna at vents, seeps and organic falls. PLoS ONE 7, e33515. doi:10.1371/journal.pone.0033515
Bielby, J., Cunningham, A. A., and Purvis, A. (2006). Taxonomic selectivity in amphibians: Ignorance, geography or biology? Anim. Conserv. 9, 135–143. doi:10.1111/j.1469-1795.2005.00013.x
Bortolussi, N., Durand, E., Blum, M., and François, M. (2006). apTreeshape: Statistical analysis of phylogenetic tree shape. Bioinformatics 22, 363–364. doi:10.1093/bioinformatics/bti798
Boda, P., Bozóki, T., Krasznai-K, E. Á., Vábíró, G., Móra, A., and Csabai, Z. (2021). Restoration-mediated alteration induces substantial structural changes, but negligible shifts in functional and phylogenetic diversity of a non-target community: A case study from a soda pan.. Hydrobiologia 848, 857–871.
Boudreau, B. P., and Jørgensen, B. (2001). The benthic boundary layer: Biogeochemistry and transport processes. New York: Oxford University Press.
Bracken, H. D., De Grave, S., and Felder, D. L. (2009). “Phylogeny of the infraorder caridea based on mitochondrial and nuclear genes (Crustacea: Decapoda),” in Decapod Crustacean phylogenetics (Boca Raton, FL: CRC Press).
Bracken, H. D., De Grave, S., Toon, A., Felder, D. L., and Crandall, K. A. (2010). Phylogenetic position, systematic status, and divergence time of the procarididea (Crustacea: Decapoda). Zool. Scr. 39, 198–212. doi:10.1111/j.1463-6409.2009.00410.x
Brannock, P. M., Learman, D. R., Mahon, A. R., Santos, S. R., and Halanych, K. M. (2018). Meiobenthic community composition and biodiversity along a 5500 km transect of western Antarctica: A metabarcoding analysis. Mar. Ecol. Prog. Ser. 603, 47–60. doi:10.3354/meps12717
Broman, E., Bonaglia, S., Norkko, A., Creek, S., and Nascimento, F. J. A. (2020). High throughput shotgun sequencing of eRNA reveals taxonomic and derived functional shifts across a benthic productivity gradient. Mol. Ecol. 30, 3023–3039. doi:10.1111/mec.15561
Cadotte, M. W., Cardinale, B. J., and Oakley, T. H. (2008). Evolutionary history and the effect of biodiversity on plant productivity. Proc. Natl. Acad. Sci. U. S. A. 105, 17012–17017. doi:10.1073/pnas.0805962105
Carew, M. E., Kellar, C. R., Pettigrove, V. J., and Hoffmann, A. A. (2018). Can high-throughput sequencing detect macroinvertebrate diversity for routine river monitoring of an urban river? Ecol. Indic. 85, 440–450. doi:10.1016/j.ecolind.2017.11.002
Carstensen, J., Conley, D. J., Bonsdorff, E., Gustafsson, B. G., Hietanen, S., Janas, U., et al. (2014). Hypoxia in the Baltic Sea: Biogeochemical cycles, benthic fauna, and management. Ambio 43, 26–36. doi:10.1007/s13280-013-0474-7
Carvajal-Castro, J. D., Ospina-L, A. M., Toro-López, Y., Pulido-G, A., Cabrera-Casas, L. X., Guerrero-Peláez, S., et al. (2021). Urbanization is associated to a loss of phylogenetic diversity of birds in a medium size city on the Andes of Colombia. South America: Studies on Neotropical Fauna and Environment. doi:10.1080/01650521.2021.1974709
CPRA (2017). Louisiana’s comprehensive master plan for a sustainable coast: Committed to our coast. Coastal protection and restoration authority (CPRA). Baton Rouge, Louisiana1: Coastal Protection.
Dauvin, J. C., and Ruellet, T. (2007). Polychaete/amphipod ratio revisited. Mar. Pollut. Bull. 55, 215–224. doi:10.1016/j.marpolbul.2006.08.045
Davies, T. J., Smith, G. F., Bellstedt, S. U., Boatwright, J. S., Bytebier, B., Cowling, R. M., et al. (2011). Extinction risk and diversification are linked in a plant biodiversity hotspot. PLoS Biol. 9, e1000620. doi:10.1371/journal.pbio.1000620
Davis, B., Mattone, C., and Sheaves, M. (2014). Bottom-up control regulates patterns of fish connectivity and assemblage structure in coastal wetlands. Mar. Ecol. Prog. Ser. 500, 175–186. doi:10.3354/meps10671
Dutertre, M., Hamon, D., Chevalier, C., and Ehrhold, A. (2013). The use of the relationships between environmental factors and benthic macrofaunal distribution in the establishment of a baseline for coastal management. ICES J. Mar. Sci. 2, 294–308. doi:10.1093/icesjms/fss170
Faith, D. P. (1992). Conservation evaluation and phylogenetic diversity. Biol. Conserv. 61, 1–10. doi:10.1016/0006-3207(92)91201-3
Flynn, D. F. B., Mirotchnick, N., Jain, M., Palmer, M. I., and Naeem, S. (2011). Functional and phylogenetic diversity as predictors of biodiversity-ecosystem-function relationships. Ecology 92, 1573–1581. doi:10.1890/10-1245.1
Galindo, L. A., Puillandre, N., Utge, J., Lozouet, P., and Bouchet, P. (2016). The phylogeny and systematics of the Nassariidae revisited (Gastropoda, Buccinoidea). Mol. Phylogenetics Evol. 99, 337–353. doi:10.1016/j.ympev.2016.03.019
Gomez Gesteira, J. L., Dauvin, J. C., and Salvande Fraga, M. (2003). Taxonomic level for assessing oil spill effects on soft-bottom sublittoral benthic communities. Mar. Pollut. Bull. 46, 562–572. doi:10.1016/s0025-326x(03)00034-1
Grebmeier, J. M., Overland, J. E., Moore, S. E., Farley, E. V., Carmack, E. C., Cooper, L. W., et al. (2006). A major ecosystem shift in the northern Bering Sea. Science 311, 1461–1464. doi:10.1126/science.1121365
Han, J., Kim, H. S., Kim, I. C., Kim, S., Hwang, U. K., Lee, J. S., et al. (2017). Effects of water accommodated fractions (WAFs) of crude oil in two congeneric copepods Tigriopus sp. Ecotoxicol. Environ. Saf. 145, 511–517. doi:10.1016/j.ecoenv.2017.07.065
Heimeier, D., Lavery, S., and Sewell, M. A. (2010). Using DNA barcoding and phylogenetics to identify Antarctic invertebrate larvae: Lessons from a large scale study. Mar. Genomics 3, 165–177. doi:10.1016/j.margen.2010.09.004
Hernández-Arana, H. A., Rowden, A. A., Attrill, M. J., Warwick, R. M., and Gold-Bouchot, G. (2003). Large-scale environmental influences on benthic macroinfauna in the southern Gulf of Mexico. Estuarine. Coast. Shelf Sci. 58, 825–841. doi:10.1016/S0272-7714(03)00188-4
Hou, Z., Fu, J., and Li, S. (2007). A molecular phylogeny of the genus gammarus (Crustacea: Amphipoda) based on mitochondrial and nuclear gene sequences. Mol. Phylogenetics Evol. 45, 596–611. doi:10.1016/j.ympev.2007.06.006
Janies, D. (2001). Phylogenetic relationships of extant echinoderm classes. Can. J. Zool. 79, 1232–1250. doi:10.1139/z00-215
Jenner, R. A., Dhubhghaill, C. N., Ferla, M. P., and Wills, M. A. (2009). Eumalacostracan phylogeny and total evidence: Limitations of the usual suspects. BMC Evol. Biol. 9, 21. doi:10.1186/1471-2148-9-21
Katoh, K., and Standley, D. M. (2013). MAFFT multiple sequence alignment software version 7: Improvements in performance and usability. Mol. Biol. Evol. 30, 772–780. doi:10.1093/molbev/mst010
Kembel, S. W., Cowan, P. D., Helmus, M. R., Cornwell, W. K., Morlon, H., Ackerly, D. D., et al. (2010). Picante: R tools for integrating phylogenies and ecology. Bioinformatics 26, 1463–1464. doi:10.1093/bioinformatics/btq166
Kocot, K. M., Cannon, J. T., Todt, C., Citarella, M. R., Kohn, A. B., Meyer, A., et al. (2011). Phylogenomics reveals deep molluscan relationships. Nature 477, 452–456. doi:10.1038/nature10382
Kocot, K. M., Struck, T. H., Merkel, J., Waits, D. S., Todt, C., Brannock, P. M., et al. (2017). Phylogenomics of Lophotrochozoa with consideration of systematic error. Syst. Biol. 66, 256–282. doi:10.1093/sysbio/syw079
Koenemann, S., Jenner, R. A., Hoenemann, M., Stemme, T., and von Ruemont, B. M. (2010). Arthropod phylogeny revisited, with a focus on crustacean relationships. Arthropod Struct. Dev. 39, 88–110. doi:10.1016/j.asd.2009.10.003
Lejzerowicz, F., Esling, P., Pillet, L., Wilding, T. A., Black, K. D., Pawlowski, J., et al. (2015). High-throughput sequencing and morphology perform equally well for benthic monitoring of marine ecosystems. Sci. Rep. 5, 13932. doi:10.1038/srep13932
Lewis, C., Pook, C., and Galloway, T. (2008). Reproductive toxicity of the water accommodated fraction (WAF) of crude oil in the polychaetes Arenicola marina (L.) and Nereis virens (Sars). Aquat. Toxicol. 90, 73–81. doi:10.1016/j.aquatox.2008.08.001
Liu, Q., Zhao, Q., McMinn, A., Yang, E. J., and Jiang, Y. (2021). Planktonic microbial eukaryotes in polar surface waters: Recent advances in high-throughput sequencing. Mar. Life Sci. Technol. 3, 94–102. doi:10.1007/s42995-020-00062-y
Maddison, W. P., and Maddison, D. R. (2018). Mesquite: A modular system for evolutionary analysis. Report.
Maliet, O., Gascuel, F., and Lambert, A. (2018). Mesquite: A modular system for evolutionary analysis. Version 3.51. Available at: https://www.mesquiteproject.org.
Mauffrey, F., Cordier, T., Apothéloz-Perret-Gentil, L., Cermakova, K., Merzi, T., Delefosse, M., et al. (2020). Benthic monitoring of oil and gas offshore platforms in the North Sea using environmental DNA metabarcoding. Mol. Ecol. 30, 3007–3022. doi:10.1111/mec.15698
Miller, M. A., Pfeiffer, W., and Schwartz, T. (2010). “Creating the CIPRES Science Gateway for inference of large phylogenetic trees,” in Proceedings of the Gateway Computing Environments Workshop (GCE), New Orleans, LA, 14-14 November 2010 (IEEE), 1–8. doi:10.1109/GCE.2010.5676129
Montagna, P. A., Baguley, J. G., Cooksey, C., Hartwell, I., Hyde, L. J., Hyland, J. L., et al. (2013). Deep-sea benthic footprint of the Deepwater Horizon blowout. PLoS ONE 8, e70540. doi:10.1371/journal.pone.0070540
Montagna, P., and Harper, D. E. (1996). Benthic infaunal long-term response to offshore production platforms in the Gulf of Mexico. Can. J. Fish. Aquat. Sci. 53, 2567–2588. doi:10.1139/f96-215
Nascimento, F. J. A., Lallias, D., Bik, H. M., and Creer, S. (2018). Sample size effects on the assessment of eukaryotic diversity and community structure in aquatic sediments using high-throughput sequencing. Sci. Rep. 8, 11737. doi:10.1038/s41598-018-30179-1
Nee, S., and May, R. M. (1997). Extinction and the loss of evolutionary history. Science 278, 692–694. doi:10.1126/science.278.5338.692
Nilsson, R. H., Anslan, S., Bahram, M., Wurzbacher, C., Baldrian, P., Tedersoo, L., et al. (2018). Mycobiome diversity: High-throughput sequencing and identification of fungi. Nat. Rev. Microbiol. 17, 95–109. doi:10.1038/s41579-018-0116-y
Okanishi, M., and Fujita, T. (2013). Molecular phylogeny based on increased number of species and genes revealed more robust family-level systematics of the order Euryalida (Echinodermata: Ophiuroidea). Mol. Phylogenetics Evol. 69, 566–580. doi:10.1016/j.ympev.2013.07.021
Okanishi, M., O’Hara, T. D., and Fujita, T. (2011). Molecular phylogeny of the order Euryalida (Echinodermata: Ophiuroidea), based on mitochondrial and nuclear ribosomal genes. Mol. Phylogenetics Evol. 61, 392–399. doi:10.1016/j.ympev.2011.07.003
Paradis, E., and Schliep, K. (2018). Ape 5.0: An environment for modern phylogenetics and evolutionary analyses in R. Bioinformatics 35, 526–528. doi:10.1093/bioinformatics/bty633
Parhar, R. K., and Mooers, A. Ø. (2011). Phylogenetically clustered extinction risks do not substantially prune the Tree of Life. PLoS One 6 (8), e23528. doi:10.1371/journal.pone.0023528
Pashaei, R., Gholizadeh, M., Iran, K. J., and Hanifi, A. (2015). The effects of oil spills on ecosystem at the Persian Gulf. Int. J. Rev. Life Sci. 5, 82–89. doi:10.13140/RG.2.1.2239.3684
Purvis, A., Agapow, P. M., Gittleman, J. L., and Mace, G. M. (2000). Nonrandom extinction and the loss of evolutionary history. Science 288, 328–330. doi:10.1126/science.288.5464.328
R Core Team (2018). R: A language and environment for statistical computing. Vienna, Austria: R Foundation for Statistical Computing. Available at: https://www.R-project.org.
Russell, G. J., Brooks, T. M., McKinney, M. M., and Anderson, C. G. (1998). Present and future taxonomic selectivity in bird and mammal extinctions. Conserv. Biol. 12, 1365–1376. doi:10.1111/j.1523-1739.1998.96332.x
Scarlett, A., Rowland, S. J., Canty, M., Smith, E. L., and Galloway, T. S. (2007). Method for assessing the chronic toxicity of marine and estuarine sediment-associated contaminants using the amphipod Corophium volutator. Mar. Environ. Res. 63, 457–470. doi:10.1016/j.marenvres.2006.12.006
Sharma, P. P., González, V. L., Kawauchi, G. Y., Andrade, S. C. S., Guzmán, A., Collins, T. M., et al. (2012). Phylogenetic analysis of four nuclear protein-encoding genes largely corroborates the traditional classification of Bivalvia (Mollusca). Mol. Phylogenetics Evol. 65, 64–74. doi:10.1016/j.ympev.2012.05.025
Smith, S. A., Wilson, N. G., Goetz, F. E., Feehery, C., Andrade, S. C. S., Rouse, G. W., et al. (2011). Resolving the evolutionary relationships of molluscs with phylogenomic tools. Nature 480, 364–367. doi:10.1038/nature10526
Srivastava, S. D., Cadotte, M. W., MacDonald, A. A. M., Marushia, R. G., and Mirotchnick, N. (2012). Phylogenetic diversity and the functioning of ecosystems. Ecol. Lett. 15, 637–648. doi:10.1111/j.1461-0248.2012.01795.x
Struck, T. H., Golombek, A., Weigert, A., Franke, F. A., Westheide, W., Purschke, G., et al. (2015). The evolution of Annelids reveals two adaptive routes to the interstitial realm. Curr. Biol. 25, 1993–1999. doi:10.1016/j.cub.2015.06.007
Struck, T. H., Purschke, G., and Halanych, K. M. (2006). Phylogeny of Eunicida (Annelida) and exploring data congruence using a partition addition bootstrap alteration (PABA) approach. Syst. Biol. 55, 1–20. doi:10.1080/10635150500354910
Taylor, J. D., Williams, S. T., Glover, E. A., and Dyal, P. (2007). A molecular phylogeny of heterodont bivalves (Mollusca: Bivalvia: Heterodonta): New analyses of 18S and 28S rRNA genes. Zool. Scr. 36, 587–606. doi:10.1111/j.1463-6409.2007.00299.x
Toon, A., Finley, M., Staples, J., and Crandall, K. A. (2009). “Decapod phylogenetics and molecular evolution,” in Decapod Crustacean phylogenetics. Editors J. W. Martin, K. A. Crandall, and D. L. Felder (Noca Raton, FL: CRC Press).
Tsirogiannis, C., and Sandel, B. (2015). PhyloMeasures: A package for computing phylogenetic biodiversity measures and their statistical moments. Ecography 39, 709–714. doi:10.1111/ecog.01814
Verheye, M. L., Martin, P., Backeljau, T., and D’Udekem D’Acoz, C. (2015). DNA analyses reveal abundant homoplasy in taxonomically important morphological characters of Eusiroidea (Crustacea, Amphipoda). Zool. Scr. 45, 300–321. doi:10.1111/zsc.12153
Voskamp, A., Baker, D. J., Stephens, P. A., Valdes, P. J., and Willis, S. G. (2017). Global patterns in the divergence between phylogenetic diversity and species richness in terrestrial birds. J. Biogeogr. 44, 709–721. doi:10.1111/jbi.12916
Weigert, A., Helm, C., Meyer, M., Nickel, B., Arendt, D., Hausdorf, B., et al. (2014). Illuminating the base of the annelid tree using transcriptomics. Mol. Biol. Evol. 31, 1391–1401. doi:10.1093/molbev/msu080
Yessoufou, K., Daru, B. H., and Davies, T. J. (2012). Phylogenetic patterns of extinction risk in the eastern arc ecosystems, an african biodiversity hotspot. PLoS ONE 7, e47082. doi:10.1371/journal.pone.0047082
Zanol, J., Halanych, K. M., Struck, T. H., and Fauchald, K. (2010). Phylogeny of the bristle worm family Eunicidae (Eunicida, Annelida) and the phylogenetic utility of noncongruent 16S, COI and 18S in combined analyses. Mol. Phylogenetics Evol. 55, 660–676. doi:10.1016/j.ympev.2009.12.024
Keywords: Deepwater Horizon, seagrass, sediment ecology, annelids, Gulf of Mexico
Citation: Kiskaddon E, Gadeken K, Berke SK, Bell S, Moore JM and Dorgan KM (2022) Oil disturbance reduces infaunal family richness but does not affect phylogenetic diversity. Front. Environ. Sci. 10:950493. doi: 10.3389/fenvs.2022.950493
Received: 22 May 2022; Accepted: 29 June 2022;
Published: 22 July 2022.
Edited by:
Charles William Martin, University of Florida, United StatesReviewed by:
Jeffrey Baguley, University of Nevada, United StatesCopyright © 2022 Kiskaddon, Gadeken, Berke, Bell, Moore and Dorgan. This is an open-access article distributed under the terms of the Creative Commons Attribution License (CC BY). The use, distribution or reproduction in other forums is permitted, provided the original author(s) and the copyright owner(s) are credited and that the original publication in this journal is cited, in accordance with accepted academic practice. No use, distribution or reproduction is permitted which does not comply with these terms.
*Correspondence: Erin Kiskaddon, ZWtpc2thZGRvbkBnbWFpbC5jb20=
Disclaimer: All claims expressed in this article are solely those of the authors and do not necessarily represent those of their affiliated organizations, or those of the publisher, the editors and the reviewers. Any product that may be evaluated in this article or claim that may be made by its manufacturer is not guaranteed or endorsed by the publisher.
Research integrity at Frontiers
Learn more about the work of our research integrity team to safeguard the quality of each article we publish.