 Rui Zhao1†
 Jun Meng
 Zunqi Liu
95% of researchers rate our articles as excellent or good
Learn more about the work of our research integrity team to safeguard the quality of each article we publish.
Find out more
ORIGINAL RESEARCH article
Front. Environ. Sci. , 12 August 2022
Sec. Soil Processes
Volume 10 - 2022 | https://doi.org/10.3389/fenvs.2022.950482
This article is part of the Research Topic Nitrogen Dynamics and Load in Soils View all 5 articles
Urea is a commonly used nitrogen (N) fertilizer that contributes to world food production, and there have been increasing concerns about relatively low urea-N use efficiency. Biochar has shown the potential to mitigate N loss, but how biochar influences urea hydrolysis and the underlying mechanisms are still unclear. In this study, long-term biochar-amended upland, paddy and greenhouse soils were sampled at depths of 0–20 and 20–40 cm in Haicheng City, Northeast China. Soil N contents, urea hydrolysis rates (UHRs), and total, intracellular and extracellular urease activities were determined, as well as the total bacterial and ureolytic microbial gene abundance were quantified. The results showed that biochar increased total urease activity by 32.64–66.39% in upland soil and by 2.90–2.13-fold in paddy soil. Both intracellular and extracellular ureases contributed to the increase in total urease activity. However, in greenhouse soil, extracellular (+35.07–74.22%) and intracellular (−40.14–77.68%) urease activities responded inconsistently to biochar incorporation. Increases in ureC gene copy numbers (2.15- to 4.47-fold) in upland and greenhouse (20.93%) soil implied that biochar stimulated microorganisms capable of producing urease, and the biochar liming effect increased the soil pH (0.11–0.60 units), which optimized the ureolytic reaction, together explained the increases in urease activity. We found that the decreased soil N content was accompanied by a higher UHR in upland and greenhouse soils, suggesting that the accelerated UHR exerted a negative effect on the soil N content, possibly caused by excessive NH3 volatilization. In paddy soil, where the UHR was not increased, biochar was an effective amendment for simultaneously improving soil urease activity and N content.
Nitrogen (N) fertilizer is a major contributor to global food production, and approximately 56% of the protein consumed by humans is produced with nitrogen fertilizer (Zhang et al., 2013). Urea is one of the most commonly used N fertilizers in the world, accounting for approximately 60% of N fertilizer consumption according to reported statistics (Glibert et al., 2014). The applied urea cannot be absorbed and utilized by plants directly in the soil; it is hydrolyzed to NH3/NH4 by urease (urea amidohydrolase, EC 3.5.1.5) in a short time and then provides available N for plants and soil microbes (Mobley and Hausinger, 1989). The urea hydrolysis rate (UHR) is related to the future fate of the applied N, such as its utilization, immobilization, and loss. The rapid hydrolysis of urea often results in excessive NH3 volatilization, N leaching and N2O emission, thereby decreasing N use efficiency. According to Singh et al. (2013), more than 40% of applied N is reportedly lost as NH3 under specific environmental and edaphic conditions. In calcareous soil under rice cropping, N losses through nitrification–denitrification, NH3 volatilization and leaching were shown to account for 12–33, 20–56, and 0.59–22.7% of the applied fertilizer, respectively (Lan et al., 2022).
Biochar is a carbon-rich material that is pyrolyzed from waste biomass, and it has been proposed as an alternative soil amendment to mitigate N losses and promote N acquisition by plants, which benefits from its positive effect on soil physicochemical properties and nutrient cycling within the soil profile (Gul and Whalen, 2016; Dong et al., 2017; Sun et al., 2021). An early field study showed that by reducing leaching and gaseous N losses, biochar increased fertilizer N retention in soil and promoted N utilization by plants (Güereña and Riha, 2013; Wang et al., 2020). Via the modification of N-related microorganisms, biochar soil incorporation was found to affect N transformation, benefit N availability and decrease N2O emissions (Nguyen et al., 2017; Xiao et al., 2019; Ji et al., 2020). Although many studies have been conducted to determine the effect of biochar on soil nitrification and denitrification processes, few studies have focused on the urea hydrolysis process, the exiting results with regarding to urease activity also varied with biochar material and soil type, ranging from increases (Wu et al., 2012; Amoakwah et al., 2022) to decreases (Song et al., 2019; Zhou et al., 2021) or no effect (Zhu et al., 2017).
Urease is synthesized by numerous organisms, including plants, bacteria, algae, fungi and invertebrates, and also occur in soils as a soil enzyme (Krajewska, 2009). According to Klose and Tabatabai (1999), soil urease can be divided into intracellular and extracellular pools, and the combined activity of these urease pools determines the rate at which urea is hydrolyzed in soils (Fisher et al., 2016). Soil ureolytic microorganisms are considered to be the main source of urease, and among these organisms, bacteria are considered to be the major contributors. Soil ureolytic microorganisms and urease activity are greatly affected by environmental factors. According to previous research, urease activity is usually positively correlated with soil pH, microbial biomass and soil N fertility (Fisher et al., 2017; Wang et al., 2018; Sun et al., 2019). Therefore, the biochar-induced influence on urease was mainly attributed to the shifts in soil physical-chemical properties, organic matter status, etc. (Amoakwah et al., 2022), thereby affecting the ureolytic microbial community. However, no direct evidence obtained to date has shown how biochar affects the abundance and composition of ureolytic microbial communities in agronomic soils under field conditions. Despite the effect on biological origin, extracellular urease derived from cell lysis and its activity can be directly affected by soil abiotic factors. Liu et al. (2018) investigated the effects of biochar on urease activity where soil organisms were not growing, and they found that the polycyclic aromatic hydrocarbons (PAHs), heavy metals, and free radicals in biochar were toxic to urease, resulting in the inhibition of urea hydrolysis. Hence, to evaluate the influence of biochar on urea hydrolysis, both intracellular and extracellular activity should be taken into consideration.
As aged biochar often influences soil properties differently from fresh biochar (Zhang X. et al., 2019; Joseph et al., 2021), the majority of the results obtained from short-term incubation studies in the laboratory have limited applicability to field production. Moreover, in addition to the influence of biochar, the soil ureolytic microbial community and enzyme activities are greatly affected by soil management practices, including crop rotation, fertilization, tillage and crop residue placement (Klose and Tabatabai, 2000; Sun et al., 2019). Therefore, it is of great significance to study the effects of biochar on soil urea characteristics in ecologically different areas under field conditions.
In the present study, long-term biochar-amended farmland soil managed under different crop cultivation practices was collected, the soil UHRs and urease activities of various pools were determined, and the abundance of genes with ureolytic functions and basic soil properties were measured. The results provide insight into the response of urea hydrolysis to long-term biochar application in different farmland soils and will allow us to identify the key underlying mechanisms responsive to the UHR.
Three types of farmland soil, including upland, paddy and solar greenhouse soils, were collected in Haicheng City, northeastern China. The soils originated from the same parent material (Hapli-Udic Cambisol, FAO) and have been cultivated with maize, rice and vegetables for more than 10 years. The biochar adopted in this experiment was pyrolyzed from maize stover with a vertical kiln at a temperature of 500–600°C for 2 h. The basic properties of the biochar were as follows: pH: 9.5, total C: 64.50%, total N: 1.27%, total P: 7.78 g kg−1, available N: 38.8 mg kg−1, average pore size: 16.23 nm and surface area: 8.87 m2 g−1.
The biochar was passed through a 2-mm sieve and mixed into the topsoil (0–20 cm) by a rotary cultivator. In the upland soil, biochar was applied annually at a rate of 7.5 t ha−1 yr−1 beginning in autumn 2017; in the paddy and greenhouse soils, one-off biochar application at a rate of 20 t ha−1 was performed in 2016. Each soil site was repeated three times (3 plot) with a plot area of approximately 200 m2. The maize and rice were cultivated for one year as a single crop that was sown or transplanted in May and harvested in October. Vegetable production in the solar greenhouses was conducted between October and June, and multiple types of vegetables, such as cucumber and tomato, were planted depending on market demand.
In spring of 2021, biochar-amended soil (BC) and corresponding control soil (CK) samples were collected from two layers (0–20 and 20–40 cm), in each plot, three soil cores was mixed evenly and then separated into three parts for future analysis: air-dried soil was sieved through a 2 mm sieve for basic property determination; one part of the fresh soil was stored at −80°C for DNA extraction and analysis; and the remainder of the fresh soil was stored in double plastic bags at 4°C to determine the urea hydrolysis rate and urease activity. Previous work indicated that urease activity was not affected by storing field-moist soils for up to six months at temperatures ranging from -10–40°C (Fisher et al., 2017).
The chloroform fumigation method was used to analyze soil MBC and MBN (Wu et al., 1990). The moist equivalent of 10 g of oven-dried soil was held with or without fumigation for 24 h at 25°C in the dark. Thereafter, a 0.5 mol L−1 K2SO4 solution was used to extract soil organic carbon (SOC) from both the fumigated and nonfumigated treatments. After shaking and centrifugation, the supernatant was filtered through a 0.22 mm syringe filter and diluted 50-fold, and SOC was measured using a TOC analyzer (Multi C/N 3100, Analytik Jena, Germany). The MBC content was calculated using the following equation:
where EC is the difference between the SOCs extracted from the fumigated and nonfumigated soils, and KEC is 0.45.
To determine MBN, the fumigated and nonfumigated soils were extracted using a 2 mol L−1 KCl solution. After shaking and filtering, the NH4+-N in the leachate was determined using a continuous flow analyzer (Seal AA3, Jean Germany). MBN was calculated using the following equation (Klose and Tabatabai, 1999):
where EN is the difference between the NH4+-N extracted from the fumigated and nonfumigated soils, and KIN is 0.54.
The soil total and inorganic N (NH4+-N and NO3--N) contents were determined by using the elemental analyzer (Elementar Macro Cube, Langenselbold, Germany) and continuous flow analyzer, respectively. pH was measured at a soil: water ratio of 1:2.5, and the cation exchange capacity (CEC) was measured by the leaching method with an ammonium acetate (1 mol L−1, pH 8.7) solution. Other basic properties were measured according to the guidelines of the National Agricultural Technology Extension Service Center of China (2006).
The rate of urea hydrolysis in each soil was determined via multiday incubation in triplicate. For each repetition, moist soil samples equivalent to 40 g oven-dried soil were weighed into a 100-mL flask, and 4 mL of a 3 g L−1 urea solution was applied to the soil to achieve a concentration of 140 mg urea-N·kg−1 soil, after which the mixture was incubated at 27°C in the dark. At 4, 12, 24, 48, and 72 h, samples of 8 g of soil were collected and extracted with a 2 mol L−1 KCl solution, and the remaining urea was analyzed via the colorimetric method (Douglas and Bremner, 1970). The UHR (mg N kg−124 h−1) was calculated based on the remaining urea in the soil at 24 h. The NH4+-N concentration of the extract was also determined by AA3.
Urease activity in soils was assayed via the buffer method (Klose and Tabatabai, 1999) with minor modifications to make the method faster and easier. Specifically, for the evaluation of extracellular urease activity, fresh soil (equal to 5 g air-dried soil) was incubated with 9 mL sodium acetate buffer (50 mM, pH 7.0) and 1 mL of a 0.2 mol L−1 urea solution (1.12 g N kg−1 soil) in a 50-mL flask; 1 mL of double distilled-water instead of urea was used as a blank, with incubation at 37°C for 2 h. The generated NH4+-N was extracted with 40 mL KCl and quantified via the Berthelot reaction with AA3. Urease activity (mg N kg−12 h−1) was calculated from the difference in the NH4+-N content between the urea-flask and blank flask.
For the assessment of total urease activity, fresh soil was fumigated using chloroform, and NH4+-N was then extracted and measured via the methods mentioned above within 1 h after removing the chloroform fumes. The urease activity of the microbial biomass (intracellular urease activity) was calculated as the difference between the total and the extracellular activities (Klose and Tabatabai, 1999).
Soil DNA was extracted from 0.25 g of fresh soil using the TIANamp Soil DNA Kit (Tiangen Biotech, China) following the manufacturer’s instructions. The genes were amplified with the following primers: bacterial 16S rRNA: 338-F (5′–3′): ACTCCTACGGGAGGCAGCAG, 806-R (5′–3′): GGACTACHVGGGTWTCTAAT (Liu Y. et al., 2021), ureC: ureC-F (5′–3′): TGGGCCTTAAAATHCAYGARGAYTGGG, ureC-R (5′–3′): SGGTGGTGGCACACCATNANCATRTC (Reed, 2001). The amplified genes were purified and recovered using a Puc-T TA Cloning Kit (CoWin Biosciences, China) in preparation for the quantitative PCR (qPCR) analysis of total gene copy numbers. The reactions were run on an Applied Biosystems 7500 Fast Real-Time PCR System (Applied Biosystems, United States); the detailed procedure was described in our previous research (Liu Z. et al., 2021).
Statistical analyses of each independently sampled soil type were performed using SPSS version 19 (SPSS, Inc. United States), since biochar was applied inconsistently (rate and aging time) across different soils. The homogeneity of variance was first tested with Levene’s test, and significant differences between the control and biochar treatments in the same soil layer were tested using an independent t test, as well as the differences between the 0–20 and 20–40 cm soil samples from the same treatment. Pearson correlation coefficients were computed using Origin 2022 (OriginLab Corporation, United States). The figures presented in the article were generated using Microsoft Excel.
Although the soils tested in this study came from the same parent material, they showed different N contents after years of different soil management practices. As shown in Figure 1, both the total N and NO3−-N contents were highest in the greenhouse soil, where they ranged from 0.33–0.35% and 649–654 mg kg−1, respectively, while they showed intermediate levels in the paddy soil and the lowest levels in the upland soil. The soil N content did not change with soil depth in the upland and greenhouse soils (Figure 1), but in the paddy soil, the soil total N, NH4+-N and NO3−-N contents at 0–20 cm were 47.97, 43.63 and 72.21% higher than those at 20–40 cm (Figures 1B,E,H).
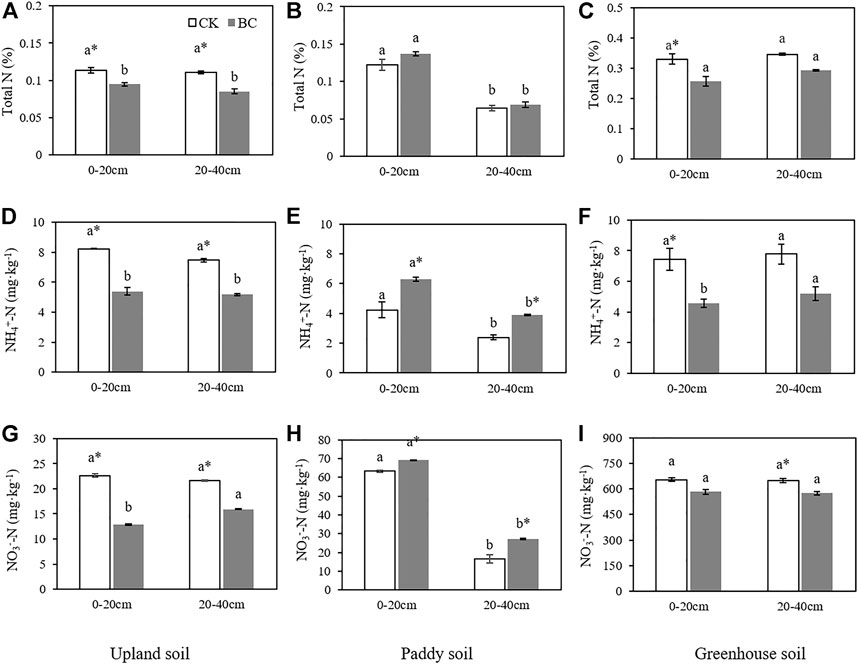
FIGURE 1. The soil total N (TN), NH4+-N and NO3−-N concentrations in the control and biochar-amended soils upland soil (A,D,G); paddy soil (B,E,H); greenhouse soil (C,F,I). Bars represent the standard error of the mean. Different lowercase letters indicate significant differences between the 0–20 and 20–40 cm soil layers, the * and ** indicate significant differences between the control and biochar treatments within the same soil depth based on an independent t test at p < 0.05 and 0.01, respectively.
The application of biochar had different effects on the soil N content. In paddy soil amended with biochar, the NH4+-N contents were 48.47% and 62.90% higher than those in the control in the surface and subsurface layers, respectively, and the corresponding values for NO3−-N were 9.46% and 64.54%. However, the difference was statistically nonsignificant (p > 0.05) for the total N content (Figures 1B,E,H). In upland soil, all forms of soil N showed significant (p < 0.05) decreases under biochar incorporation in both the 0–20 and 20–40 cm layers (Figures 1A,D,G). The biochar-amended greenhouse soil N content also showed a tendency to decrease, with soil total N, 0–20 cm NH4+-N and 20–40 cm NO3−-N contents all being significantly (p < 0.05) lower than their corresponding controls (Figures 1C,F,I).
The highest soil MBC and MBN contents were found in the greenhouse soil (Figure 2). However, one-off biochar application decreased MBC by 8.58% (p < 0.05) and 44.37% (p < 0.01) in the surface and subsurface layers, respectively, and decreased MBN by 56.09% (p < 0.05) in the subsurface layer. The only positive effect of biochar on microbial biomass was found in the upland soil, where MBC was increased by 34.24% (p < 0.01) in the subsurface layer. In the biochar-amended paddy soil, both MBC and MBN were not significantly different from their levels in CK (p > 0.05).
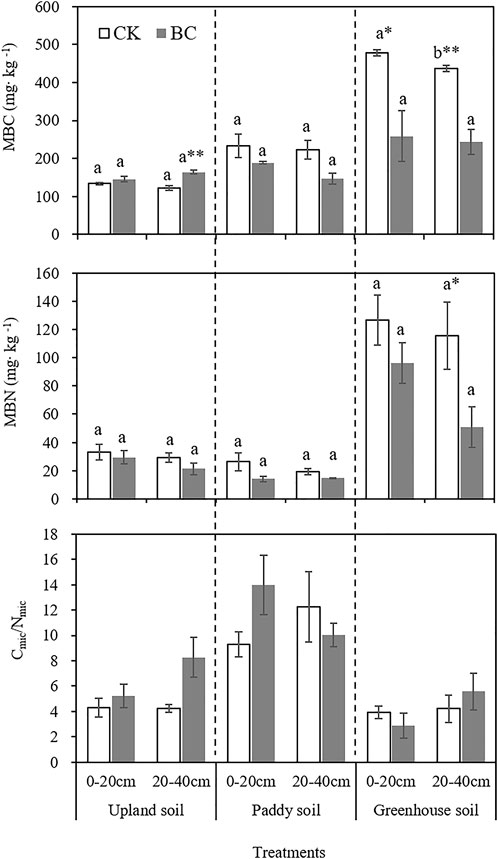
FIGURE 2. Effect of long-term biochar application on microbial biomass C and N (MBC and MBN). Cmic/Nmic refers to the ratio of MBC to MBN. Bars represent the standard error of the mean. Different lowercase letters indicate significant differences between 0–20 and 20–40 cm soil layer, the * and ** indicate significant differences between the control and biochar treatments within same soil depth at p < 0.05 and 0.01, based on an independent t test.
The complete hydrolysis times of the added urea-N (140 mg urea-N·kg−1) were approximately 48 and 72 h in the upland and paddy soils, respectively. However, approximately 6.78–35.48 mg urea-N·kg−1 remained in the greenhouse soil after 72 h of incubation (Figure 3). The results suggested that upland soil presented the highest, while greenhouse soil had the lowest rate of urea hydrolysis, specifically, In the surface layers of the control, the UHR was 120.76 mg urea-N kg−124 h−1 in upland soil versus 38.78 mg urea-N kg−124 h−1 in greenhouse soil.
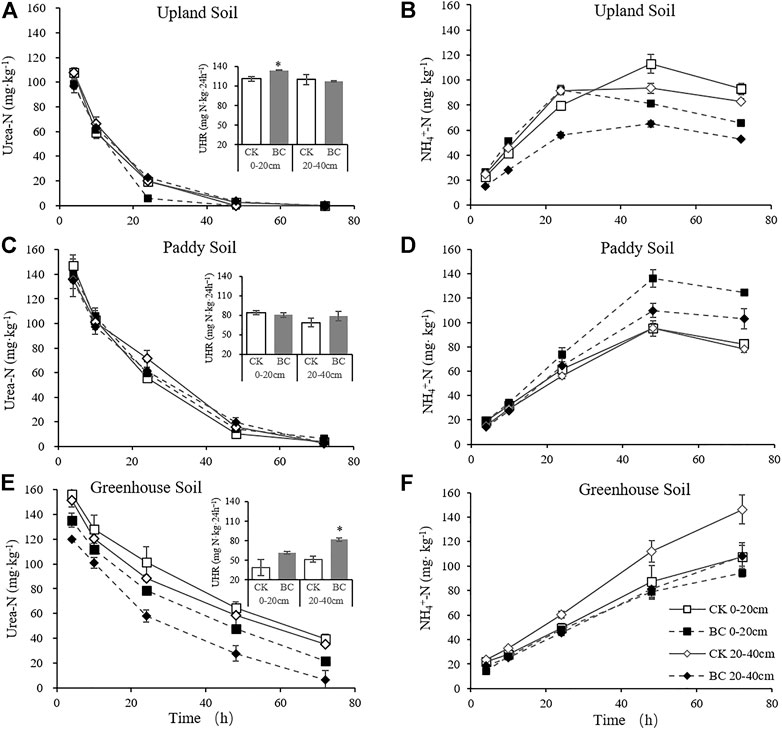
FIGURE 3. Dynamic of Urea-N and NH4+-N concentration during 72 h of incubation after 140 mg kg−1 urea-N addition. Upland soil (A,B); paddy soil (C,D); greenhouse soil (E,F). Bars represent the standard error of the mean. Column charts in A, C and E represent urea hydrolysis rate, * indicate significant difference between BC and CK within same soil layer at p < 0.05.
Biochar application tended to increase the UHRs of the greenhouse and upland soils (Figure 3). For instance, up to 95.66% of the added urea-N was hydrolyzed in the biochar-treated upland soil within 24 h, versus 86.25% in the corresponding CK treatment. In the greenhouse soil, the UHRs in the surface and subsurface control were 38.79 and 51.47 mg urea-N kg−124 h−1, respectively, and increased to 61.43 and 81.95 mg urea-N kg−124 h−1 in response to biochar addition.
NH4+-N generation through urea hydrolysis peaked at 48 h in the upland and paddy soils, but the NH4+-N content in the greenhouse soil continued to increase during 72 h of incubation, since urea-N remained in the soil (Figures 3E,F). The NH4+-N content in the biochar-amended soil was generally lower than that in CK in the upland and greenhouse soil, while in the paddy soil, biochar increased the NH4+-N concentration after 24 h of urea application.
For the control soil, the urease activities of various pool as well the specific activity showed the following general tendency: greenhouse soil > upland soil > paddy soil (Table 1). Extracellular urease activity accounted for 67.99–69.46, 74.07–85.86, and 36.58–42.28% of the total urease activity in greenhouse, upland and paddy soil, respectively. Statistically, no major difference was detected between the different layers of the unamended soils, while in the soil that received biochar, both intra- and extracellular urease activities in the surface soil were higher than those in the deeper soil.
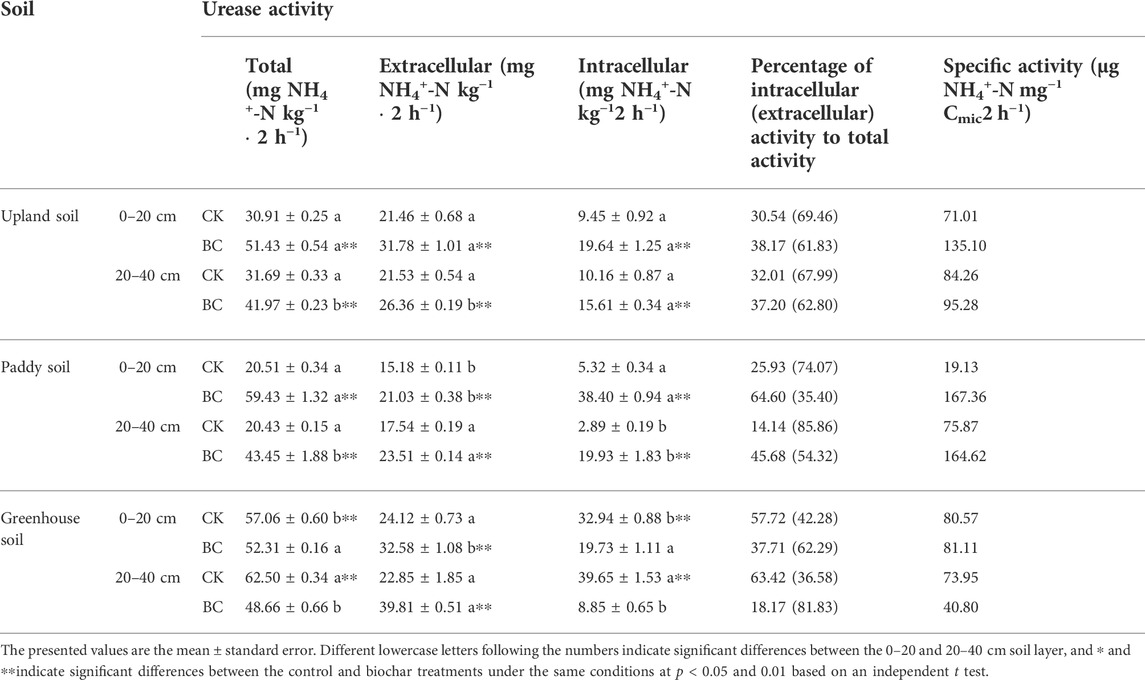
TABLE 1. Effect of long-term biochar application on the urease activity of various pools in the soils.
Overall, urease activity responded inconsistently to biochar incorporation in different soils. As shown in Table 1, both intra- and extracellular urease activities were increased by biochar application in the upland and paddy soils, with a more pronounced effect in the surface layer than in the subsurface layer. In upland soil, biochar incorporation increased the total urease activity by 66.39% (0–20 cm) and 32.64% (20–40 cm) relative to the control, and intracellular enzymes contributed 49.71% and 52.67% of the total urease activity increase, respectively. In paddy soil, a greater effect was detected after the incorporation of biochar, and the total urease activity was 2.90- and 2.13-fold higher than that in CK in the surface and subsurface soils, respectively. The increase in total enzyme activity was mainly derived from intracellular, which contributed 84.99% (0–20 cm) and 85.11% (20–40 cm) of the total urease activity increases. However, in biochar-treated greenhouse soil, intracellular urease activity declined by 40.14 and 77.68% in the 0–20 and 20–40 cm depths soil, resulting in 8.32 and 22.14% reductions in the total urease activity, respectively, relative to the control.
The abundance of ureolytic microbes and total bacteria, expressed as ureC and 16S rRNA gene copy numbers, ranged from 1 to 37×106 and 4 to 106 ×108 (Figure 4), respectively. Paddy soil presented the highest abundance, while greenhouse soil contained the lowest number of microbial genes; similarly, 0.1–1% of bacteria were ureolytic. The lowest ratio of ureC to 16S indicated that ureolytic microbes were not the dominant microorganism in the greenhouse soil.
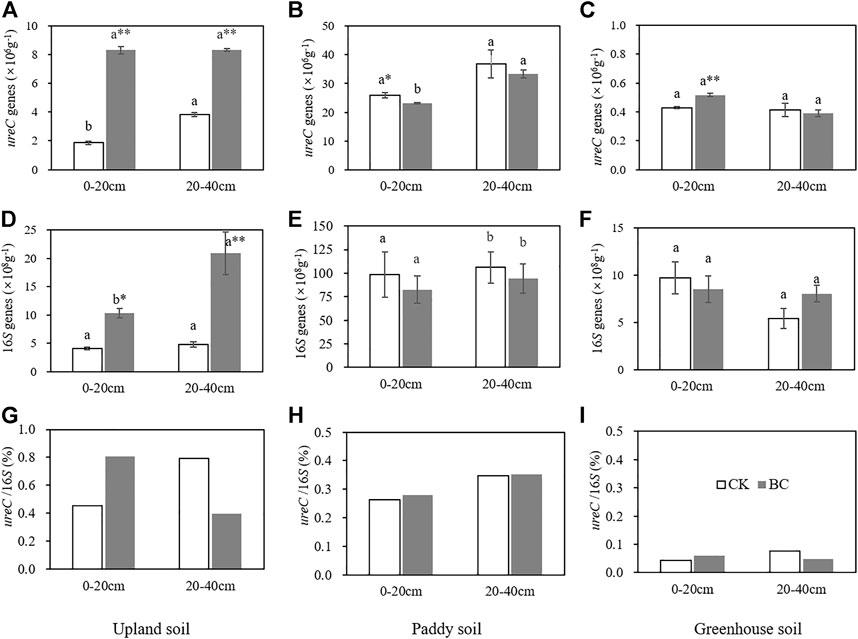
FIGURE 4. The soil ureC and 16S gene copy numbers and their ratio in upland soil (A,D,G), paddy soil (B,E,H) and greenhouse soil (C,F,I). Bars represent the standard error of the mean. Different lowercase letters indicate significant differences between 0–20 and 20–40 cm soil layer, the * and **indicate significant differences between the control and biochar treatments within same soil depth at p < 0.05 and 0.01, based on an independent t test.
The microbial genes extracted from the biochar-amended soils did not always show a consistent pattern of increasing or decreasing. In the upland soil, biochar increased ureC copy numbers by 4.47- and 2.15-fold and the 16S rRNA copy numbers by 1.52- and 3.32-fold over the control in the surface and subsurface soil samples (Figure 4), respectively. Significant (p < 0.01) increases in ureC gene copy numbers were also found in the surface layer of the greenhouse soil treated with biochar. However, in the paddy soil, the number of ureC genes was slightly decreased by 10.54% after the soil was amended with biochar in the surface layer, which resulted in a higher of ureC to 16S ratio.
Biochar incorporation has been reported to improve the soil N content due to its ability to retain N and decrease N losses via gaseous emissions and leaching (Güereña and Riha, 2013; Fan et al., 2020; Banik et al., 2021). However, in the present study, both soil total and available N were found to have decreased in upland and greenhouse soils after biochar incorporation despite its application method. Earlier research showed that plant available N (NH4+-N and NO3−-N) may be reduced owing to biochar’s high C content, which stimulates microbial N immobilization (Phillips et al., 2022). However, the unchanged or even decreased MBC and MBN contents of the greenhouse soil demonstrated that the decline in soil N could not be ascribed to the microbial N-immobilization effect. Considering that NH3 volatilization is a major pathway of N loss in agricultural systems that results from N fertilization (Sun et al., 2017; Lan et al., 2022), we speculated that biochar-stimulated NH3 volatilization was the primary reason for the decrease in soil N. As the present results showed, biochar accelerated the soil UHR (Figure 3) and increased soil pH (Supplementary Table S1), thereby influencing the equilibrium dynamics of NH4+-N dissociation and increasing the NH3 concentration, which may result in excessive NH3 volatilization and then a decrease in the soil NH4+-N content (Figure 3), ultimately decreasing soil N content after long-term biochar application (Figure 1). Our previous incubation study showed that 14.18–20.25% more NH3 was volatilized from biochar-treated brown and sandy soils than from corresponding controls (Liu et al., 2017). The increase in soil pH caused by biochar application was identified as the primary factor favoring NH3 volatilization in fertilized soils (Sun et al., 2017; He et al., 2018; Sha et al., 2019), and our results suggested that when biochar was coapplied with urea, the accelerated UHR may also contribute to NH3 volatilization.
While in paddy soil, we observed a positive effect of biochar application on the soil N content (albeit not significantly on total N, Figure 1), suggesting that biochar-induced NH3 volatilization may not occur in paddy soil under consideration of the unaccelerated UHRs. This is in line with the results reported by He et al. (2018), who also showed that despite an increase in the first year, biochar applied to paddy soil likely reduced the NH3 emissions in the second year. These authors explained that aged biochar was more capable increasing the NH3 adsorption capacity and the nitrification rate of the soil than fresh biochar (Wu et al., 2018). Moreover, without considering biochar’s effect, the widespread postponement of N fertilization during rice production is also conducive to reducing N losses (Zhang et al., 2011).
One of the main objectives of this study was to reveal the impacts of biochar on the urease activity of various pools and the underlying mechanisms. We found that urease activity responded sensitively to biochar, regardless of whether biochar was applied one-off or annually, and both biotic and abiotic factors were relevant to the increases in urease activity.
In the upland soil, intracellular urease contributed 49.71–52.67% of the total urease activity increase induced by biochar application. The increase in intracellular enzymes could be primarily ascribed to the release of more ureolytic microbes from microbial biomass (Amoakwah et al., 2022). As shown in Figure 4A and Figure 5A, the ureolytic microbial abundance represented by the ureC gene copy numbers was increased by biochar addition and showed a significant positive correlation with intracellular urease (R2 > 0.88, p < 0.01); the ureC gene copy numbers were also well correlated with the bacterial 16S gene copy numbers and MBC. These results demonstrated that in upland soil, by thriving microbial biomass and ureolytic microbial abundance, biochar increased intracellular urease activity. The positive effect of biochar on microorganisms can be traditionally explained by supplement of the considerable amount of bioavailable C and modification of soil physicochemical properties by biochar, which contribute to improving the soil microbial community structure and increasing microbial populations and activity (Zhang L. et al., 2019; Li et al., 2020; Pokharel et al., 2020; Amoakwah et al., 2022). Here, we detected that the soil organic matter and pH increased with biochar incorporation, and as shown in Figures 5A,B, the soil pH was positively correlated with intracellular urease activity and the number of ureC genes in upland and paddy soils. This was consistent with the findings of Fisher et al. (2017), who also reported that an increase in the soil pH resulted in bloom the growth of total and ureolytic bacteria, resulting in an increase in the soil urea hydrolysis rate.
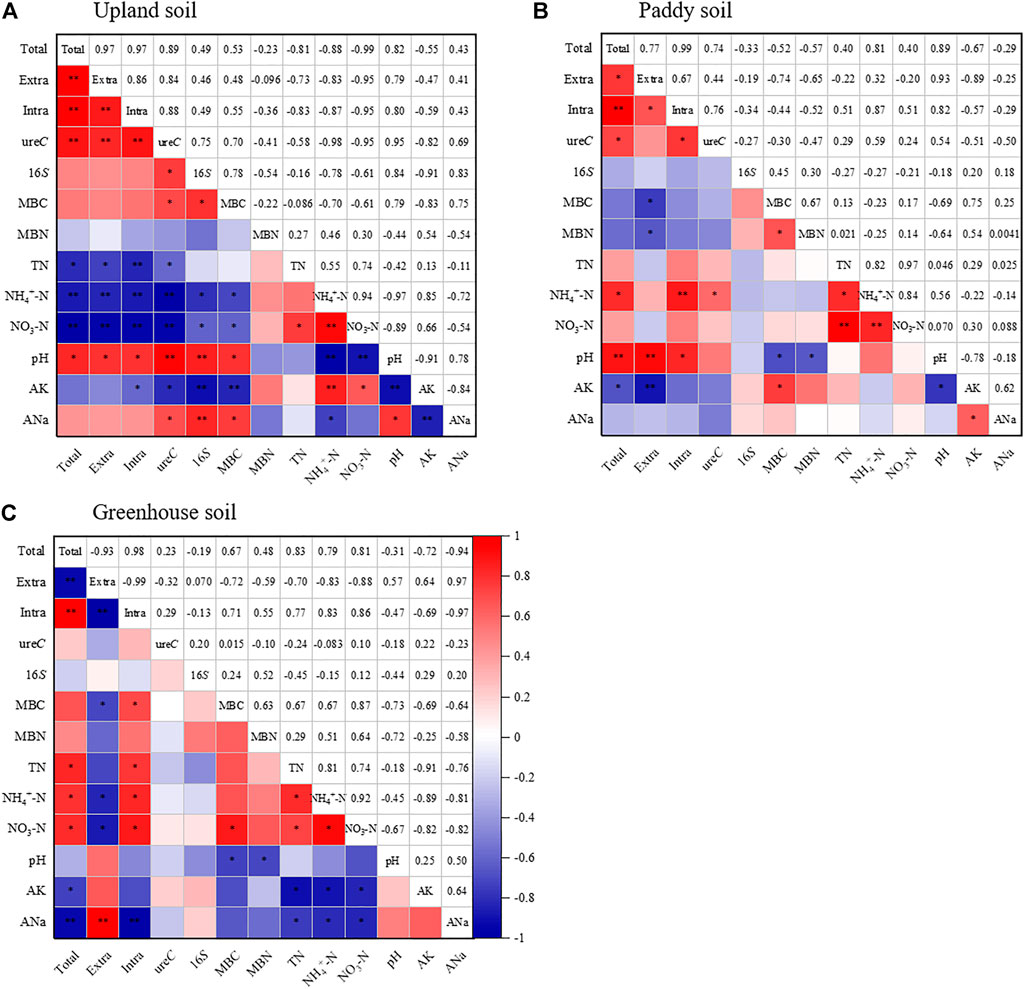
FIGURE 5. Correlations of soil properties, urease activity of various pools, total bacteria and ureC gene abundances in the upland soil (A), paddy soil (B) and greenhouse soil (C). Warm and cold color represent positive and negative correlations, respectively. Significant correlations are highlighted with asterisks *p < 0.05; **p < 0.01.
In the paddy soil, although biochar somewhat decreased the bacterial ureolytic gene abundance, the intracellular urease activity was greatly increased. These findings can probably be ascribed to the ureC primer used in the present study being of bacterial origin; sources such as crop roots, fungi and archaea (Hasan, 2000; Krajewska, 2009) are also urease producers that contribute to maintaining and increasing intracellular urease activity. For instance, Amoakwah et al. (2022) reported that biochar application significantly increased the abundance of arbuscular mycorrhizae (AMF) and soil fungi by modifying the soil microbial community composition.
An increase in extracellular urease activity as a result of biochar addition was observed in all tested soils. The reasons responsible for the increase, despite the biological origin, namely, intracellular urease, could also be explained by variations in soil abiotic properties, such as moisture, pore structure and especially soil pH (Fisher et al., 2016). Because some authors concluded that an alkaline pH represents the optimum condition for the urease reaction (Frankenberger and Johanson, 1982; Acosta-Martínez and Tabatabai, 2000; Liu Z. et al., 2021). Our results showed that even 4-years aged biochar in paddy and greenhouse soil could significantly increase soil pH (Supplementary Table S1), and the increased pH exhibited a positive correlation with extracellular urease (Figure 5), illustrating that an increase in reaction kinetics followed by a biochar-mediated increase in the soil matrix pH could be one reason underlying the increase in extracellular urease.
Greenhouse soil is characterized by high nutrient and organic matter contents, which benefit from precise farming and high inputs of diverse organic materials (Hu et al., 2017). Therefore, before conducting the present study, we hypothesized that the greenhouse soil would show a higher urease activity and UHR than the other two soils. However, even though the greenhouse soil exhibited the highest fertility and total urease activity, its total numbers of microbial genes and UHR were the lowest. This was most likely attributed to the differences in fertilization and greenhouse management strategies between the soils that were tested.
First, the overuse of organic fertilizers and agrochemicals such as pesticides and antibiotics is very common in soils under greenhouse vegetable production (Wang et al., 2006; Bhandari et al., 2021). Organic fertilizer has been found to favor the growth of fungi or nonbacterial microorganisms (Wen et al., 2020; Sabir et al., 2021), implying that the microbial biomass and urease activity in greenhouse soil largely originate from these nonbacterial microorganisms; however, in the present study, only bacterial 16S and ureC genes were quantified, so it would have been interesting to investigate the total genes in the greenhouse soil to reveal ureolytic microbial abundance. Residual pesticides and antibiotics in soil are substances that inhibit microbial growth and soil enzyme activity, which may be related to ureolytic activity (Wang et al., 2006; Hao et al., 2008), and we observed relatively low ureC to 16S ratios (0.04–0.08%), indicating that only a minimal proportion of the bacteria are ureolytic in greenhouse soil.
Second, vegetable production is often reported to lead to severe soil problems such as nutrient imbalances, salinization and acidification (Hu et al., 2017; Bai et al., 2020; Liu et al., 2022), and these problems cause negative effects on soil biological processes. Partially consistent with this idea, our results showed that the available K+ and Na+ concentrations in the greenhouse soil were much higher than those in the upland and paddy soils, while the greenhouse soil pH was the lowest among the tested soils (Supplementary Table S1). Pearson correlation analysis revealed that the concentrations of these ions were negatively correlated with total and intracellular urease activities (Figure 5C, R2 > -0.69 and -0.97), indicating that the mass of salt ions inhibited the growth of ureolytic microbes. As biochar usually contains considerable amounts of Na+, K+, and Mg2+ (Chen et al., 2019), the detected negative effects on the microbial biomass (Figure 2) and intracellular urease (Table 1) were unsurprising.
Moreover, from a methodological perspective, urease activity measurements were conducted under optimum conditions with a sufficient reaction substrate (urea) and buffer system and a suitable temperature (Cordero et al., 2019), which may offset the negative effect on urease and could be supposed to represent the full potential of urea hydrolysis. However, the UHR was considered to reflect the real soil ureolytic ability since it was determined to be closely related to the field environment. Hence, the analytical conditions could be one reason for the observed higher urease activity but lower UHR in the greenhouse soil.
To our knowledge, no studies have been conducted to investigate the relationship between the UHR and soil urease activities of various pools, let alone in long-term biochar-amended field soil. In the present study, a rapid urease analysis method to quantify intracellular and extracellular enzyme activities in a short time was developed. The method involved the incubation of soil that has been chloroform fumigated (or not) with sodium acetate buffer for 2 h, and the generated NH4+-N was measured by using an AA3 to express urease activity (we also attempted to use THAM buffer but failed to achieve a Berthelot reaction). The results showed that in the control soil, the average intracellular urease activity accounted for 20.04–60.57% of the total enzyme activity, which was generally comparable with previous results obtained from Klose and Tabatabai (1999), Klose and Tabatabai (2000), confirming that the method is credible.
Through correlation analysis, we found that the UHR was more highly correlated with extracellular than with intracellular ureases in upland soil; moreover, in greenhouse soils, positive correlations were only observed between UHR and extracellular ureases (Table 2). This indicates that extracellular ureases adsorbed to soil clays and colloids are the primary enzymes responsible for urea hydrolysis (Fisher et al., 2017); the results are consistent with those of others who have shown that extracellular urease contributes over half of the observed activity in some soils (Klose and Tabatabai, 1999; Klose and Tabatabai, 2000; Krajewska, 2009).
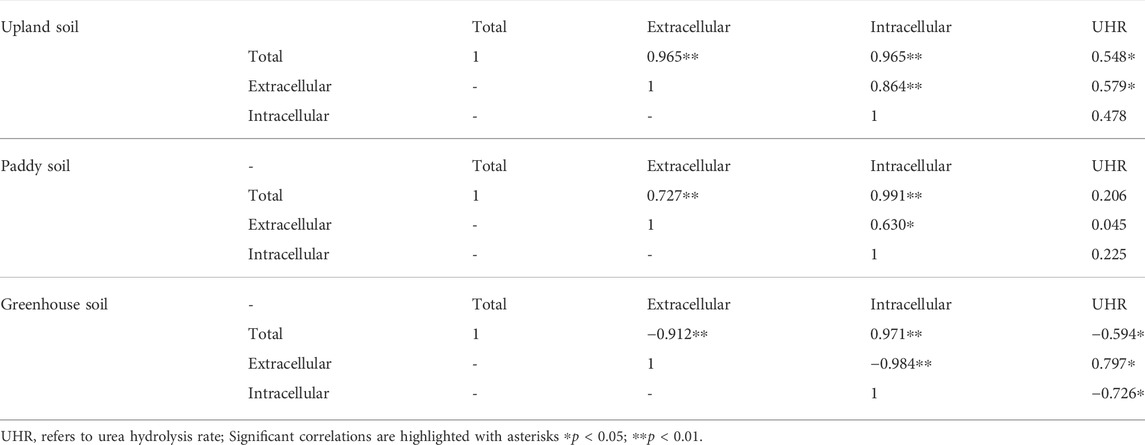
TABLE 2. Correlations between the urea-N hydrolysis rate and urease activity of various pools.
Long-term biochar application improved the ureolytic ability of the three farmland soils, but the related mechanisms were inconsistent. In general, biochar increased soil extracellular urease activity and thereby accelerated soil UHR (upland and greenhouse soil), as our results indicated that the extracellular urease was the primary pool to catalyze hydrolysis of urea. The increased extracellular urease activity was first attributed to biochar encouraging the growth of microorganisms capable of producing urease, which was identified by the greater numbers of soil ureC (upland and greenhouse soils) and intracellular urease activity (upland and paddy soils). Second, but importantly, biochar increased the soil pH by liming effect and directly optimized ureolytic reaction, which also contributed to improving the extracellular urease activity. However, even though the increase in ureolytic ability is conductive to improving the soil native N availability, the higher UHR also possibly causes excessive N loss, as we observed that the accelerated UHR was accompanied by declined soil N content in the upland and greenhouse soils. Altogether, biochar is an effective amendment for soil ureolytic ability improvement, but special attention should be given when biochar is coapplied with urea since biochar may stimulate urea-N loss by accelerating urea hydrolysis.
In addition, our results indicated that soil UHR and the abundance of total ureolytic genes may be more effective indicators to reflect soil ureolytic ability than urease activity and bacterial ureolytic genes; therefore, we suggest that they can be used to reveal soil urea hydrolysis ability in future studies.
The original contributions presented in the study are included in the article/Supplementary Material, further inquiries can be directed to the corresponding authors.
RZ and JL: Validation, Investigation and Data curation; NX: Investigation; TH and JM: Editing and Funding acquisition, ZL: Data curation, Writing and Funding acquisition.
This work was supported by the National Natural Science Foundation of China (42007081, 31901449); and the earmarked fund for Modern Agro-industry Technology Research System (CARS-01–51).
The authors declare that the research was conducted in the absence of any commercial or financial relationships that could be construed as a potential conflict of interest.
All claims expressed in this article are solely those of the authors and do not necessarily represent those of their affiliated organizations, or those of the publisher, the editors and the reviewers. Any product that may be evaluated in this article, or claim that may be made by its manufacturer, is not guaranteed or endorsed by the publisher.
The Supplementary Material for this article can be found online at: https://www.frontiersin.org/articles/10.3389/fenvs.2022.950482/full#supplementary-material
Acosta-Martínez, V., and Tabatabai, M. (2000). Enzyme activities in a limed agricultural soil. Biol. Fertil. Soils 31, 85–91. doi:10.1007/s003740050628
Amoakwah, E., Arthur, E., Frimpong, K. A., Lorenz, N., Rahman, M. A., Nziguheba, G., et al. (2022). Biochar amendment impacts on microbial community structures and biological and enzyme activities in a weathered tropical sandy loam. Appl. Soil Ecol. 172, 104364. doi:10.1016/j.apsoil.2021.104364
Bai, X., Gao, J., Wang, S., Cai, H., Chen, Z., and Zhou, J. (2020). Excessive nutrient balance surpluses in newly built solar greenhouses over five years leads to high nutrient accumulations in soil. Agric. Ecosyst. Environ. 288, 106717. doi:10.1016/j.agee.2019.106717
Banik, C., Koziel, J. A., De, M., Bonds, D., Chen, B., Singh, A., et al. (2021). Biochar-swine manure impact on soil nutrients and carbon under controlled leaching experiment using a midwestern mollisols. Front. Environ. Sci. 9, 609621. doi:10.3389/fenvs.2021.609621
Bhandari, G., Atreya, K., Vašíčková, J., Yang, X., and Geissen, V. (2021). Ecological risk assessment of pesticide residues in soils from vegetable production areas: a case study in S-Nepal. Sci. Total Environ. 788, 147921. doi:10.1016/j.scitotenv.2021.147921
Chen, W., Meng, J., Han, X., Lan, Y., and Zhang, W. (2019). Past, present, and future of biochar. Biochar 1, 75–87. doi:10.1007/s42773-019-00008-3
Cordero, I., Snell, H., and Bardgett, R. D. (2019). High throughput method for measuring urease activity in soil. Soil Biol. Biochem. 134, 72–77. doi:10.1016/j.soilbio.2019.03.014
Dong, X., Li, G., Lin, Q., and Zhao, X. (2017). Quantity and quality changes of biochar aged for 5 years in soil under field conditions. Catena 159, 136–143. doi:10.1016/j.catena.2017.08.008
Douglas, L. A., and Bremner, J. M. (1970). Extraction and colorimetric determination of urea in soils. Soil Sci. Soc. Am. J. 34, 859–862. doi:10.2136/sssaj1970.03615995003400060015x
Frankenberger, W. T. F., and Johanson, J. B. (1982). Effect of pH on enzyme stability in soils. Soil Biol. Biochem. 14 (5), 433–437. doi:10.1016/0038-0717(82)90101-8
Fan, C., Duan, P., Zhang, X., Shen, H., Chen, M., and Xiong, Z. (2020). Mechanisms underlying the mitigation of both N2O and NO emissions with field-aged biochar in an Anthrosol. Geoderma 364, 114178–178. doi:10.1016/j.geoderma.2020.114178
Fisher, K. A., Meisinger, J. J., and James, B. R. (2016). Urea hydrolysis rate in soil toposequences as influenced by pH, carbon, nitrogen, and soluble metals. J. Environ. Qual. 45 (1), 349–359. doi:10.2134/jeq2015.05.0228
Fisher, K. A., Yarwood, S. A., and James, B. R. (2017). Soil urease activity and bacterial ureC gene copy numbers: Effect of pH. Geoderma 285, 1–8. doi:10.1016/j.geoderma.2016.09.012
Glibert, P. M., Maranger, R., Sobota, D. J., and Bouwman, L. (2014). The Haber Bosch-harmful algal bloom (HBHAB) link. Environ. Res. Lett. 9, 105001–105013. doi:10.1088/1748-9326/9/10/105001
Güereña, D., Riha, S., Hanley, K., Enders, A., and Hyland, C. (2013). Nitrogen dynamics following field application of biochar in a temperate north American maize-based production system. Plant Soil 365, 239–254. doi:10.1007/s11104-012-1383-4
Gul, S., and Whalen, J. K. (2016). Biochemical cycling of nitrogen and phosphorus in biochar-amended soils. Soil Biol. Biochem. 103, 1–15. doi:10.1016/j.soilbio.2016.08.001
Hao, H., Bo, S., and Zhao, Z. (2008). Effect of land use change from paddy to vegetable field on the residues of organochlorine pesticides in soils. Environ. Pollut. 156 (3), 1046–1052. doi:10.1016/j.envpol.2008.04.021
Hasan, H. A. H. (2000). Ureolytic microorganisms and soil fertility: a review. Commun. Soil Sci. Plant Anal. 31, 2565–2589. doi:10.1080/00103620009370609
He, T., Liu, D., Yuan, J., Ni, K., Zaman, M., Luo, J., et al. (2018). A two years study on the combined effects of biochar and inhibitors on ammonia volatilization in an intensively managed rice field. Agric. Ecosyst. Environ. 264, 44–53. doi:10.1016/j.agee.2018.05.010
Hu, W., Zhang, Y., Huang, B., and Teng, Y. (2017). Soil environmental quality in greenhouse vegetable production systems in eastern China: current status and management strategies. Chemosphere 170, 183–195. doi:10.1016/j.chemosphere.2016.12.047
Ji, C., Li, S., Geng, Y., Miao, Y., Ding, Y., Liu, S., et al. (2020). Differential responses of soil N2O to biochar depend on the predominant microbial pathway. Appl. Soil Ecol. 145, 103348. doi:10.1016/j.apsoil.2019.08.010
Joseph, S., Cowie, A. L., Van Zwieten, L., Bolan, N., Budai, A., Buss, W., et al. (2021). How biochar works, and when it doesn't: a review of mechanisms controlling soil and plant responses to biochar. GCB Bioenergy 13, 1731–1764. doi:10.1111/gcbb.12885
Klose, S., and Tabatabai, M. A. (1999). Urease activity of microbial biomass in soils. Soil Biol. Biochem. 31, 205–211. doi:10.1016/S0038-0717(98)00090-X
Klose, S., and Tabatabai, M. A. (2000). Urease activity of microbial biomass in soils as affected by cropping systems. Biol. Fertil. Soils 31 (3-4), 191–199. doi:10.1007/s003740050645
Krajewska, B. (2009). Ureases I. Functional, catalytic and kinetic properties: a review. J. Mol. Catal. B Enzym. 59, 9–21. doi:10.1016/j.molcatb.2009.01.003
Lan, T., He, X., Wang, Q., Deng, O., Zhou, W., Luo, L., et al. (2022). Synergistic effects of biological nitrification inhibitor, urease inhibitor, and biochar on NH3 volatilization, N leaching, and nitrogen use efficiency in a calcareous soil-wheat system. Appl. Soil Ecol. 174, 104412. doi:10.1016/j.apsoil.2022.104412
Li, X., Wang, T., Chang, S. X., Jiang, X., and Song, Y. (2020). Biochar increases soil microbial biomass but has variable effects on microbial diversity: a meta-analysis. Sci. Total Environ. 749, 141593. doi:10.1016/j.scitotenv.2020.141593
Liu, G., Huang, B., Hu, W., Kalkhajeh, Y. K., Chen, Z., and Gong, H. (2022). Long-term vegetable production significantly reduces the selenium adsorption in two typical plastic shed soils. Agric. Ecosyst. Environ. 331, 107910. doi:10.1016/j.agee.2022.107910
Liu, Y., Dai, Q., Jin, X., Dong, X., Peng, J., Wu, M., et al. (2018). Negative impacts of biochars on urease activity: high pH, heavy metals, polycyclic aromatic hydrocarbons, or free radicals? Environ. Sci. Technol. 52, 12740–12747. doi:10.1021/acs.est.8b00672
Liu, Y., GaoBai, J., Wu, Z. S., Li, X., Wang, N., Du, X., et al. (2021a). Unraveling mechanisms and impact of microbial recruitment on oilseed rape (Brassica napus L.) and the rhizosphere mediated by plant growth-promoting rhizobacteria. Microorganisms 9, 161. doi:10.3390/microorganisms9010161
Liu, Z., E, Y., Lan, Y., He, T., Chen, W., and Meng, J. (2021b). Effect of biochar on urea hydrolysis rate and soil ureC gene copy numbers. J. Soil Sci. Plant Nutr. 21, 3122–3131. doi:10.1007/s42729-021-00593-y
Liu, Z., He, T., Cao, T., Yang, T., Meng, J., and Chen, W. (2017). Effects of biochar application on nitrogen leaching, ammonia volatilization and nitrogen use efficiency in two distinct soils. J. Soil Sci. Plant Nutr. 17 (2), 528. doi:10.4067/S0718-95162017005000037
Mobley, H. L., and Hausinger, R. P. (1989). Microbial ureases: significance, regulation, and molecular characterization. Microbiol. Rev. 53, 85–108. doi:10.1128/mr.53.1.85-108.1989
National Agricultural Technology Extension Service Center (2006). Specification for soil analysis techniques. Beijing: China Agricultural Press.
Nguyen, T. T. N., Xu, C. Y., Tahmasbian, I., Che, R., Xu, Z., Zhou, X., et al. (2017). Effects of biochar on soil available inorganic nitrogen: a review and meta-analysis. Geoderma 288, 79–96. doi:10.1016/j.geoderma.2016.11.004
Phillips, C. L., Meyer, K. M., Garcia-Jaramillo, M., Weidman, C., Stewart, C. E., Wanzek, T., et al. (2022). Towards predicting biochar impacts on plant-available soil nitrogen content. Biochar 4, 9. doi:10.1007/s42773-022-00137-2
Pokharel, P., Ma, Z., and Chang, S. X. (2020). Biochar increases soil microbial biomass with changes in extra-and intracellular enzyme activities: a global meta-analysis. Biochar 2, 65–79. doi:10.1007/s42773-020-00039-1
Reed, K. E. (2001). Restriction enzyme mapping of bacterial urease genes: using degenerate primers to expand experimental outcomes. Biochem. Mol. Biol. Educ. 29, 239–244. doi:10.1016/S1470-8175(01)00095-9
Sabir, M. S., Shahzadi, F., Ali, F., Shakeela, Q., Niaz, Z., and Ahmed, S. (2021). Comparative effect of fertilization practices on soil microbial diversity and activity: An overview. Curr. Microbiol. 78 (10), 3644–3655. doi:10.1007/s00284-021-02634-2
Sha, Z., Li, Q., Lv, T., Misselbrook, T., and Liu, X. (2019). Response of ammonia volatilization to biochar addition: A meta-analysis. Sci. Total Environ. 655, 1387–1396. doi:10.1016/j.scitotenv.2018.11.316
Singh, J., Kunhikrishnan, A., Bolan, N. S., and Sajjar, S. (2013). Impact of urease inhibitor on ammonia and nitrous oxide emissions from temperate pasture soil cores receiving urea fertilizer and cattle urine. Sci. Total Environ. 465, 56–63. doi:10.1016/j.scitotenv.2013.02.018
Song, Y., Li, Y., Cai, Y., Fu, S., Lou, Y., Wang, H., et al. (2019). Biochar decreases soil N2O emissions in Moso bamboo plantations through decreasing labile N concentrations, N-cycling enzyme activities and nitrification/denitrification rates. Geoderma 348, 135–145. doi:10.1016/j.geoderma.2019.04.025
Sun, H., Lu, H., Chu, L., Shao, H., and Shi, W. (2017). Biochar applied with appropriate rates can reduce N leaching, keep N retention and not increase NH3 volatilization in a coastal saline soil. Sci. Total Environ. 575, 820–825. doi:10.1016/j.scitotenv.2016.09.137
Sun, Q., Meng, J., Lan, Y., Shi, G., Yang, X., Cao, D., et al. (2021). Long-term effects of biochar amendment on soil aggregate stability and biological binding agents in Brown Earth. Catena 205, 105460. doi:10.1016/j.catena.2021.105460
Sun, R., Li, W., Hu, C., and Liu, B. (2019). Long-term urea fertilization alters the composition and increases the abundance of soil ureolytic bacterial communities in an upland soil. FEMS Microbiol. Ecol. 95, fiz044. doi:10.1093/femsec/fiz044
Wang, F., Bian, Y., Jiang, X., Gao, H., Yu, G., and Deng, J. (2006). Residual characteristics of organochlorine pesticides in lou soils with different fertilization modes. Pedosphere 16, 161–168. doi:10.1016/S1002-0160(06)60039-8
Wang, L., Luo, X., Liao, H., Chen, W., Wei, D., Cai, P., et al. (2018). Ureolytic microbial community is modulated by fertilization regimes and particle-size fractions in a black soil of northeastern China. Soil Biol. Biochem. 116, 171–178. doi:10.1016/j.soilbio.2017.10.012
Wang, Z., Wang, Z., Luo, Y., Zhan, Y., Meng, Y., and Zhou, Z. (2020). Biochar increases 15N fertilizer retention and indigenous soil N uptake in a cotton-barley rotation system. Geoderma 357, 113944. doi:10.1016/j.geoderma.2019.113944
Wen, Y., Li, H., Lin, Z., Zhao, B., Sun, Z., Yuan, L., et al. (2020). Long-term fertilization alters soil properties and fungal community composition in fluvo-aquic soil of the north China plain. Sci. Rep. 10, 7198. doi:10.1038/s41598-020-64227-6
Wu, F., Jia, Z., Wang, S., Chang, S. X., and Startsev, A. (2012). Contrasting effects of wheat straw and its biochar on greenhouse gas emissions and enzyme activities in a Chernozemic soil. Biol. Fertil. Soils 49, 555–565. doi:10.1007/s00374-012-0745-7
Wu, J., Joergensen, R. G., Pommerening, B., Chaussod, R., and Brookes, P. C. (1990). Measurement of soil microbial biomass C by fumigation-extraction-an automated procedure. Soil Biol. Biochem. 22 (8), 1167–1169. doi:10.1016/0038-0717(90)90046-3
Wu, Z., Zhang, X., Dong, Y., Xu, X., and Xiong, Z. (2018). Microbial explanations for field-aged biochar mitigating greenhouse gas emissions during a rice-growing season. Environ. Sci. Pollut. Res. 25, 31307–31317. doi:10.1007/s11356-018-3112-x
Xiao, Z., Rasmann, S., Le, Y., Lian, F., Zou, H., and Wang, Z. (2019). The effect of biochar amendment on N-cycling genes in soils: a meta-analysis. Sci. Total Environ. 696, 133984. doi:10.1016/j.scitotenv.2019.133984
Zhang, H., Wu, G., Dai, Q., Hou, Z., Xu, K., Gao, Hui., et al. (2011). Precise postponing nitrogen application and its mechanism in rice. A. A. S. 37, 1837–1851. doi:10.3724/SP.J.1006.2011.01837
Zhang, L., Xiang, Y., Jing, Y., and Zhang, R. (2019a). Biochar amendment effects on the activities of soil carbon, nitrogen, and phosphorus hydrolytic enzymes: a meta-analysis. Environ. Sci. Pollut. Res. 26 (2), 22990–23001. doi:10.1007/s11356-019-05604-1
Zhang, W., Ma, L., Huang, G., Wu, L., Chen, X., and Zhang, F. (2013). The development and contribution of nitrogenous fertilizer in China and challenges faced by the country. Sci. Agric. Sin. 46 (15), 3161–3317. doi:10.3864/j.issn.0578-1752.2013.15.010
Zhang, X., Duan, P., Wu, Z., and Xiong, Z. (2019b). Aged biochar stimulated ammonia-oxidizing archaea and bacteria-derived N2O and NO production in an acidic vegetable soil. Sci. Total Environ. 687, 433–440. doi:10.1016/j.scitotenv.2019.06.128
Zhou, S., Wen, X., Cao, Z., Cheng, R., Qian, Y., Mi, J., et al. (2021). Modified cornstalk biochar can reduce ammonia emissions from compost by increasing the number of ammonia-oxidizing bacteria and decreasing urease activity. Bioresour. Technol. 319, 124120. doi:10.1016/j.biortech.2020.124120
Keywords: biochar, intracellular urease activity, extracellular urease activity, urea hydrolysis rate, ureC gene
Citation: Zhao R, Liu J, Xu N, He T, Meng J and Liu Z (2022) Urea hydrolysis in different farmland soils as affected by long-term biochar application. Front. Environ. Sci. 10:950482. doi: 10.3389/fenvs.2022.950482
Received: 22 May 2022; Accepted: 18 July 2022;
Published: 12 August 2022.
Edited by:
Ryusuke Hatano, Hokkaido University, JapanReviewed by:
Xixi Cai, Fujian Agriculture and Forestry University, ChinaCopyright © 2022 Zhao, Liu, Xu, He, Meng and Liu. This is an open-access article distributed under the terms of the Creative Commons Attribution License (CC BY). The use, distribution or reproduction in other forums is permitted, provided the original author(s) and the copyright owner(s) are credited and that the original publication in this journal is cited, in accordance with accepted academic practice. No use, distribution or reproduction is permitted which does not comply with these terms.
*Correspondence: Zunqi Liu, bGl1enVucWlAc3lhdS5lZHUuY24=
†These authors have contributed equally to this work and share first authorship.
Disclaimer: All claims expressed in this article are solely those of the authors and do not necessarily represent those of their affiliated organizations, or those of the publisher, the editors and the reviewers. Any product that may be evaluated in this article or claim that may be made by its manufacturer is not guaranteed or endorsed by the publisher.
Research integrity at Frontiers
Learn more about the work of our research integrity team to safeguard the quality of each article we publish.