 Muhlis Can
 Ihsan Oluc
 Bodo Sturm
 Ihsan Guzel4†
 Beata Gavurova
- 1BETA Akademi, Social Sciences Research Lab (SSR Lab), Istanbul, Turkey
- 2Department of Economics, Mehmet Akif Ersoy University, Burdur, Turkey
- 3Faculty of Business Administration and Industrial Engineering, HTWK Leipzig and ZEW, Mannheim, Germany
- 4Department of Economics, Sirnak University, Sirnak, Turkey
- 5Faculty of Mining, Ecology, Process Control and Geotechnologies, Technical University of Košice, Kosice, Slovakia
- 6Hungarian National Bank—Research Center, John von Neumann University, Kecskemét, Hungary
- 7TRADE Research Entity, North-West University, Vanderbijlpark, South Africa
Trade is a significant parameter that may impact environment positively or negatively. However, there is no consensus on this issue among the researchers. It seems likely that tradable products will affect the environmental quality level. However, this requires the separation of the international trade basket. Thus, this research asks whether trade in non-green products affects the level of environmental degradation in the 25 European Union (EU) member states? To answer this question, we develop an index of trade openness in non-green products and empirically investigate whether this index influences the ecological footprint. Non-green trade openness index represents the ratio of the total export and import of non-green products in a country’s international trade basket to that country’s Gross Domestic Product. Advanced panel estimation techniques are employed for a sample of 25 EU countries over the period between 2003 and 2016. The core finding–supporting the Pollution Haven Hypothesis–is that non-green trade openness reduces environmental degradation. We discuss several implications of this result for recent environmental policies, particularly for the EU climate policy.
1 Introduction
Climate change is without doubt one of the most pressing problems in recent environmental policy. With the Paris climate conference (COP21) in 2015, governments have agreed to keep global warming below 2°C above pre-industrial levels. At this conference, it was stated that greenhouse gas (GHG) emissions are a serious concern that needs to be addressed urgently (UNFCCC, 2015). It has been decided that each country will comprehensively report the national climate action plans that they will prepare by taking into account their own special conditions and the targets they need to achieve in GHG emissions (Mesagan & Chidi, 2020). It was also agreed to review these targets every 5 years in a global stocktake process and to increase the national targets gradually (Horowitz, 2016). In a more broader perspective, climate change can be seen as a very prominent example for anthropogenic environmental degradation (Shpak et al., 2021). Other examples of severe environmental degradation caused by human activity include biodiversity loss, deforestation, and local air pollution (Prokopenko et al., 2020).
The EU has set 2020, 2030 and 2050 targets as a long-term strategy in order to reach the targets set by the Paris climate agreement. Conceptualized as the “Green Deal,” this agreement represents a roadmap of key policies for the EU’s climate agenda (Siddi, 2020). These targets include reducing GHG emissions by 20% in 2020, 40% in 2030, based on 1990 levels, and becoming an economy with net zero GHG emissions by 2050 (European Commission).
While achieving these goals, one of the biggest roles falls on international trade. Since international trade, CO2 emissions, energy consumption and economic production tend to move together, these variables need to be evaluated together (Nasreen and Anwar, 2014). As a matter of fact, there have been many studies investigating the effects of energy consumption on environmental degradation, along with international trade (Hossain, 2011; Sebri and Ben-Salha, 2014; Ohlan, 2015).
Trade affects the environment in many ways and alone causes 20% of global carbon emissions (Zafar et al., 2019). On the one hand, the increase in trade is connected to more output and more energy demand due to the acceleration of economic activity (Sadorsky, 2012). Therefore, energy serves as an important input in the production process and ensures the operation of machinery and equipment. On the other hand, energy is needed in the process of transporting the outputs after the production process, that is, the finished goods or raw materials. Therefore, there are transportation costs even in the trade of sophisticated products, which increases energy consumption (Anderson and van Wincoop, 2004). In the EU, it is estimated that the share of only transportation-related GHG emissions in total emissions is 24% (Alola et al., 2021).
The strict environmental policies implemented by the EU increase the cost of producing environmentally harmful products in the European continent compared to clean products (Benzerrouk et al., 2021). In this case, products that require high energy consumption in their production are increasingly being produced outside the EU and then imported into this region. At the same time, as a result of the specialization of European countries in more environment-friendly products, it may cause a decrease in environmental pollution in rich countries and an increase in environmentally harmful production in developing countries. There are many studies supporting this process, called the Pollution Haven Hypothesis (PHH) (Cole, 2004; Nasir et al., 2019). Put simply, this could mean a cleaner Europe versus a more polluted rest of the world. As a matter of fact, the EU Emissions Trading System (EU-ETS) introduced by the EU to the energy and industrial sector within the framework of climate policies also brought these concerns along. The EU-ETS, the cornerstone of EU climate policy, is the first and largest international emissions trading system in the world and has been in operation since 2005 (Skjærseth and Wettestad, 2009). The emission trading system directly limits the GHG emissions of the power plants and industrial facilities included in this system, by placing an upper limit on these emitters (Bayer and Aklin, 2020). Therefore, the production of non-green products becomes more costly in the EU.
Within the framework of the EU Green Deal, it is planned to implement the Carbon Border Adjustment Mechanism (CBAM) to prevent carbon leakage predicted by the PHH and reduce total GHG emissions (Eicke et al., 2021). With this regulation, it is aimed to bring the prices of high-cost low-emission products manufactured as an alternative to high-emission products manufactured at low cost to the same level (Krzymowski, 2020; Bellora & Fontagne, 2021). Thus, it will protect the competitiveness of low-emission products that will not cause carbon leakage (Mehling and Ritz, 2020).
All over the world and especially in Europe, measures are taken and regulations are made due to global warming and climate change. This situation will deeply affect the international trade and production style in the coming years. Therefore, in this transition period, it is necessary to make preparations to prevent the economies from being damaged. Especially considering the EU-ETS and CBAM regulations, it is clear that EU countries want to avoid trade in non-green products. Therefore, it can be predicted that international trade will be divided into two parts, namely the trade of green products and non-green products. On the one hand, green products can be defined as those increasing energy efficiency and minimizing environmental damage due to energy consumption (Paramati, Mo, and Huang, 2021). On the other hand, non-green products can be considered as products that are subject to restrictions and carbon taxes in national and international trade. Such products are expected not to contribute to the green transformation of countries. Based on this idea, Can, Ben Jebli and Brusselaers (2022) and Can et al. (2021) separated green products from the total international trade basket and constructed a new index labelled as Green Openness Index. The index only consists of the ratio of green product exports and green product imports to Gross Domestic Product. Green trading will be helpful in finding a viable solution for building a green economy and achieving carbon neutral goals (Lengyel et al., 2021; Ahmad et al., 2022a).
The significant contribution of the Green Openness Index to the environmental literature is an undeniable fact (Ahmad et al., 2022a; Ahmad et al., 2022b). However, it is necessary to examine the environmental impact of trade consisting of products other than green products by aggregating the remaining part of the separated trade basket. Because, as the share of non-green products in exports and imports increases, the countries’ economies will have difficulties in realizing the green transformation.
The aim of this study is to separate the non-green products from the total foreign trade basket and to bring an alternative perspective to the trade openness variable, which was frequently used in the literature. With this new index, it is aimed to investigate the effects of non-green products on environmental degradation where CO2 emissions are only a prominent example. In many studies, while the effect of trade on the environment was examined, trade was proxied with trade openness and environmental pollution was discussed in this context. However, there are many green products in total trade, and the trade of more environment-friendly products can increase the environmental quality. On the other hand, studies based on trade volume assume that increasing trade in general increases environmental pollution as a whole. However, in order to clearly observe the net impact of non-green products on the environment, green products that consume less energy and are more environment-friendly should be removed from the trade basket.
Therefore, this article investigates the effects of non-green product trade on environmental degradation in 25 EU countries, taking into account other economic parameters.1 The purpose of choosing the EU sample is that this region is the second largest economy in the world with a GDP of 15.292 trillion US Dollars. In addition, considering international trade, it is the region where the most exports and imports take place in the world (The World Bank, 2022). Despite its large foreign trade volume, this region is planning to be the first carbon neutral continent in about 30 years, in line with the decisions taken by the European Commission and displaying a very strict attitude in environmental regulations (EC, 2018). Along with the EU-ETS being implemented in Europe, restrictions such as the carbon tax approach of the CBAM to be imposed by taking into account the carbon intensity of imported products also require an examination of the relationship between the foreign trade of the EU and carbon emissions and environmental degradation in general.
This study contributes to the literature at least in three ways. First, this research develops a new index of non-green products by separating green products from the trade basket. According to our best knowledge, this is the first study that separated total non-green products from the international trade basket. Secondly, by employing this index, the environmental impact of trade in non-green products was examined in a sample of EU-25 countries. Third, advanced panel estimation techniques are employed in the study to achieve consistent results.
The remainder of the work is organized as follows. In the next section, information about the calculation of the non-green trade openness index will be given. In the third section, the literature study will be presented. In the fourth, we provide data, empirical methodology, and results, respectively. Section five presents discussion and policy recommendation. Section six concludes the study.
2 Introducing Non-Green Trade Openness
There is general agreement as to which sectors pollute the air, water and soil the most compared to other sectors. These sectors are mostly carbon-intensive cement, fertilizer, iron and steel, aluminum and fossil fuel based electricity industries. In addition to these sectors, the sectors producing paper and pulp, petroleum products, stone clay glass, mining and chemicals producing sectors can also be described as “dirty industries” (Jänicke et al., 1997; Nekmahmud et al., 2020). In addition, there are many sectors that pollute the environment, even if they are not as heavy polluting as the mentioned sectors (Blecharz and Stverkova, 2014). Therefore, it is a more correct approach to characterize the products of countries that are subject to international trade as green products and non-green products (Kusumastuti and Sutoyo, 2019; Prokopenko et al., 2020; Can et al., 2022). However, there is no generally accepted “green list” in the literature. Different organizations have prepared different lists of green products. The most comprehensive of these is the “Combined List of Environmental Goods” (CLEG) consisting of 248 green products released by the OECD. It is possible to consider the products other than the green products in this list as non-green.
In this study, based on the Green Openness Index developed by Can et al. (2022), the Non-Green Openness Index, which is the complement of this index, was developed. The index was calculated for EU-25 countries using the formula below. The new index is based on the “Combined List of Environmental Goods” (CLEG) consisting of 248 different products. We calculate the index between the years 2003 and 2016 since the data for green products is available between for this time period (Can et al., 2021).
In Eq 1, Exp and Imp indicates the current value of total merchandise export and import by reporter country i at time t. GRNX indicates the current value of total environment related products (green goods) export to the world by reporter country i at time t. GRNM stands for the current value of total environment related products (green goods) import from the world to reporter country i at time t. GDP represents the total value of goods manufactured in current year t in country i. The index is calculated for the period from 2003 to 2016 based on the data available in the OECD Statistics Database. The data for environment related products for both export and import are obtained from OECD Stat, 2022), while the GDP, Exp and Imp are acquired from the World Development Indicator released by World Bank (WDI) (2021).
3 Literature Review
There are many parameters that affect environmental degradation. In this context, researchers have studied the effects of many different economic and social parameters on the environment. In this context, trade is one of the most frequently tested parameters. In recent years, researchers have studied the significance of trade on the environment. In these studies, researchers use trade openness, export product diversification, import product diversification or export concentration as a proxy of international trade. These studies are presented in Table 1. While several econometric methods were applied in these studies, in the majority of cases the effect of trade on the environment is negative. However, although the studies on trade and environment nexus contribute to the literature, none of the analyses separated the non-green products from total international trade basket.
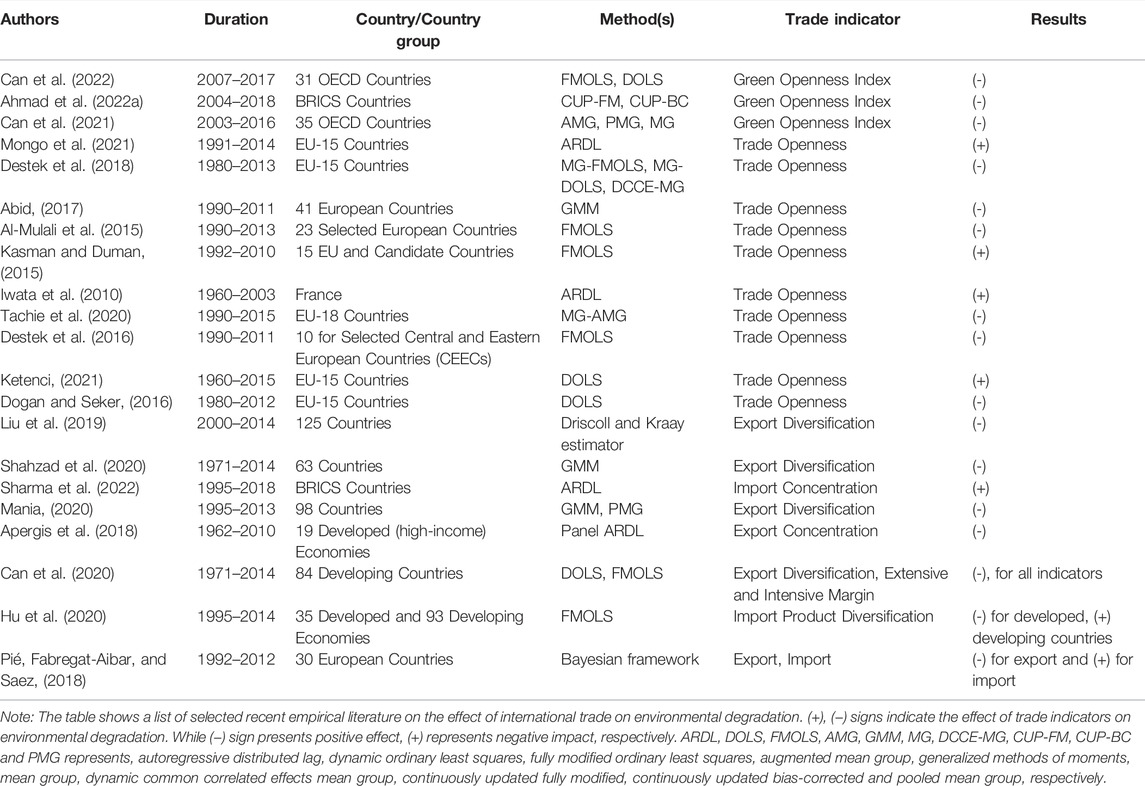
TABLE 1. Recent literature testing the impact of international trade on environmental degradation (Summarized Results).
4 Empirical Methodology and Data
4.1 Data Measurement and Model Settings
The aim of this study is to investigate the effects of non-green trade openness (NGOP), which can be described as a foreign trade basket separated from green products, on the ecological footprint for EU-25 countries. Rees (2018) defines the ecological footprint as “the area of productive land and water ecosystems that the population requires on a continuous basis to produce the (bio) resources it consumes, and to assimilate its (mostly carbon) wastes, wherever on Earth the relevant ecosystems may be located.” The ecological footprint allows to measure the pressure of humans on the environment in observing anthropogenic effects (Danish and Wang, 2019). Additionally, since the ecological footprint deals with the effects of human beings on air, water and soil together, it allows a holistic approach to reveal the effects on environmental degradation. Therefore, we prefer to use the ecological footprint as indicator for anthropogenic environmental degradation instead of CO2 emissions which represent only a small part of the degradation and can be used as indicator for climate change only.
We construct our empirical model following Uddin et al. (2017), Kongbuamai et al. (2020) and Lu (2020). We construct two separated models. The main reason doing this is to observe the effects of both renewable energy and non-renewable energy consumption separately and to test whether the results obtained are robust or not. GDP per capita, non-green trade openness, renewable energy consumption, and non-renewable energy consumption are used as explanatory variables. The empirical economic equations are specified as follows:
In the equations, EF represents the ecological footprint, GDP stands for real income per capita, NGOP indicates non-green trade openness index, RPC and NRENPC represent renewable energy consumption per capita and non-renewable energy consumption per capita, respectively. All variables represent the natural log form except the NGOP. The coefficients βi, i = 1, 2, 3, indicate the long-run elasticities. t represents a time frame (t = 1, 2, 3, …, 14) of the study, and the stochastic error term is indicated as ε. All symbols, measurements, and data sources are displayed in Table 2. Table 3 delivers descriptive statistics for all variables used in our models.
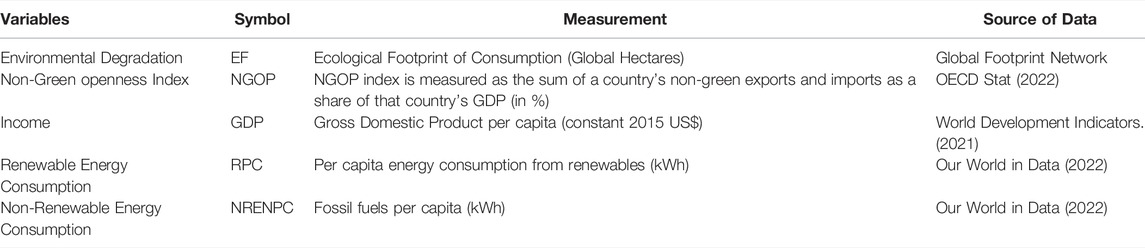
TABLE 2. Definition of variables.
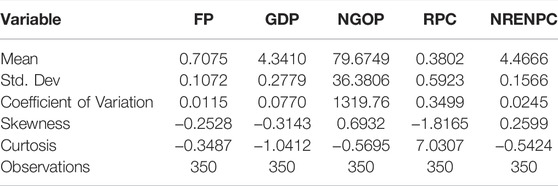
TABLE 3. Descriptive statistics.
It is expected that the
The interaction between ecological footprint, real income per capita, non-green trade openness index, renewable energy consumption per capita and non-renewable energy consumption per capita was investigated for 25 EU countries over the 2003–2016 period. The main reason for the time constraint is that the export and import data of Green Products in the OECD database are only released for the relevant period. For empirical analysis, first of all, cross-section dependence, unit root tests, and homogeneity tests were performed. Then, the cointegration relationship between the series was investigated, and finally, long-run and short-run coefficient estimates were done for the models.
4.2 Empirical Methodology
In this study, we apply the following empirical estimation in six different steps.
4.2.1 Cross Section Dependency (CD)
The CD test phase is the most important step of panel data studies. Starting the analysis without performing this test may result in inconsistent results. If there is strong correlation between cross-sections, first generation unit root tests are less likely to give reliable outcomes. In this case, a cross-section dependency test should be performed before starting unit root tests. In case of cross-sectional dependence between the units, using the second generation unit root tests gives more reliable results. The null hypothesis of the CD test is “There is no dependency relationship between cross-sections”.
4.2.2 Unit Root Analysis
After cross-sectional dependence test, we apply cross-sectionally augmented IPS (CIPS) unit root test developed by Pesaran (2008). The CIPS test considers the panel as a unit and investigates the stability of the panel. The null hypothesis is “the series are not stationary”. CIPS test statistics are compared with critical values obtained by Pesaran (1999) using Monte Carlo simulation. If the test statistics are greater than the absolute critical values, the null hypothesis is rejected and the series is considered to be stationary.
4.2.3 Homogeneity Test
The cointegration relationship should not be investigated after unit root testing since the slope coefficients of the cointegration equation may not be homogeneous. This leads to a misinterpretation of the findings. Therefore, it is beneficial to perform the homogeneity test before the cointegration test. To do that, we employ the homogeneity test developed by Pesaran and Yamagata, (2008). This homogeneity test provides two different test statistics. While
4.2.4 Durbin-Hausman Cointegration Test
In the next step of our investigation, by using Durbin-H approach developed by Westerlund (2008), we performed cointegration analysis to check whether dependent and independent variables move together in the long-run. This method allows to explore the long-run relationship of the series under the cross-sectional dependence. Additionally, Durbin-Hausman’s group test (based on panel heterogeneity) and Durbin-Hausman’s panel test (based on panel homogeneity) can produce different results depending on panel homogeneity which makes this test more useful compared to other panel cointegration tests. The null hypothesis for this test is “there is no cointegration relationship”.
4.2.5 Cointegration Test With Structural Breaks
As a result of the Durbin-H cointegration test, we conclude that there is a long-run link among the series. Durbin-H cointegration test ignores structural breaks, therefore, it may give inconsistent results from time to time. In order to get reliable outcomes, by using Westerlund and Edgerton (2008) accounting structural breaks and autocorrelation, we decided to explore whether there is a cointegration between dependent and independent variables. The null hypothesis of the test is “there is no cointegration relationship”.
4.2.6 Long-Run Estimations
After the cointegration process, we moved on to the short- and long-term coefficient estimation phase. The coefficients of the long- and short-term relationship between the variables were estimated using the PMG approach developed by Pesaran, Shin and Smith (1999). Unlike other approaches, the PMG approach allows estimating dynamic panels by taking into account the long-term equilibrium relationships between variables (Jouini, 2015). This is of great interest for our empirical study because of the fact that ecological footprint, economic growth and non-green trade openness measures may be linked by a common trend that pilots their co-movements over the long run. While PMG limits the long-term coefficients to be the same, short-term coefficients and error term variances may differ between groups (Goswami and Junayed, 2006). Since the EU countries have similar political attitudes on environmental degradation, it is in line with the expectations that the long-term trends will be similar but there may be differences in the short-term. Therefore, the PMG estimator was used for both established models.
4.3 Empirical Findings
Prior to beginning the empirical findings, the CD test is one of the most essential stages for panel studies. Without doing this examination might cause inconsistent outcomes. In this case, we tested whether there is a cross-sectional dependence between the units and we provide the results in Table 4.
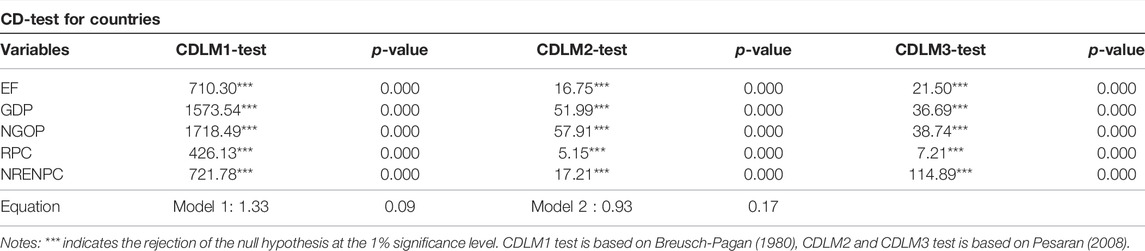
TABLE 4. Testing the cross-section dependency of the variables and models.
As observed from the results of Table 4, the null hypothesis is rejected for all variables at 1% significance level. Therefore, the alternative hypothesis should be accepted. In this case, since the first generation unit root tests may not give reliable results, the analysis will be continued by using the second generation unit root tests.
In the second step of our examination, we employ CIPS unit root approach to examine whether the series are stationary or not. The findings are reported in Table 5.
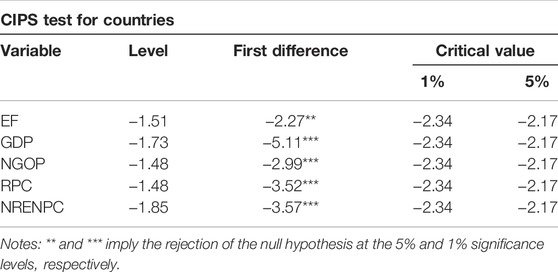
TABLE 5. Testing the order of integration of the variables.
As seen in Table 5, in the unit root test, it is confirmed that all series become stationary when the first difference is taken which means the series contain a unit root. While ecological footprint is at 5% level of significance, other variables are at 1% level of significance.
In panel studies, checking the slope homegeneity is a vital action to choose appropriate cointegration and long-run estimation techniques. The null hypothesis of “slope homogeneity” is tested and the outcomes are reported in Table 6.
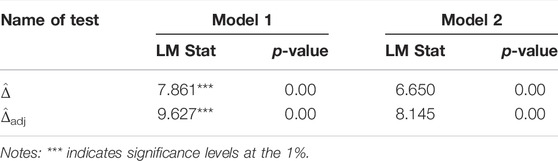
TABLE 6. Homogeneity test.
According to these findings, the null hypothesis is rejected according to both test statistics. In other words, we reject the assumption that the slope coefficients are homogeneous.
In the next step of our investigation, by employing Durbin-H panel cointegration approach, we tested whether the series are move together in the long-run or not. The findings of panel cointegration are displayed in Table 7.
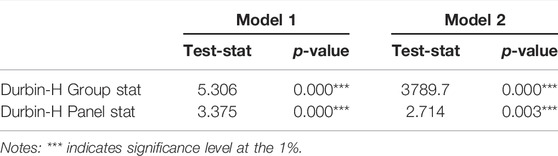
TABLE 7. Durbin-H panel cointegration test.
The findings obtained from both Durbin-H group and Durbin-H panel statistics indicate that the null hypothesis is rejected at 1% significance level. In other words, this indicates that the series move together in country groups and throughout the panel. Then after, to get robust findings, we test again whether there is cointegration the series by using Westerlund and Edgerton (2008) accounting structural breaks and autocorrelation. The empirical findings gained from analysis are provided in Table 8.
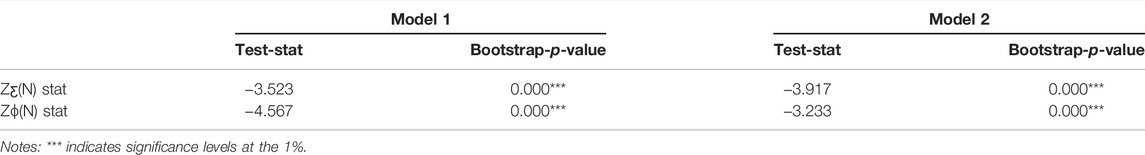
TABLE 8. Cointegration test with structural breaks.
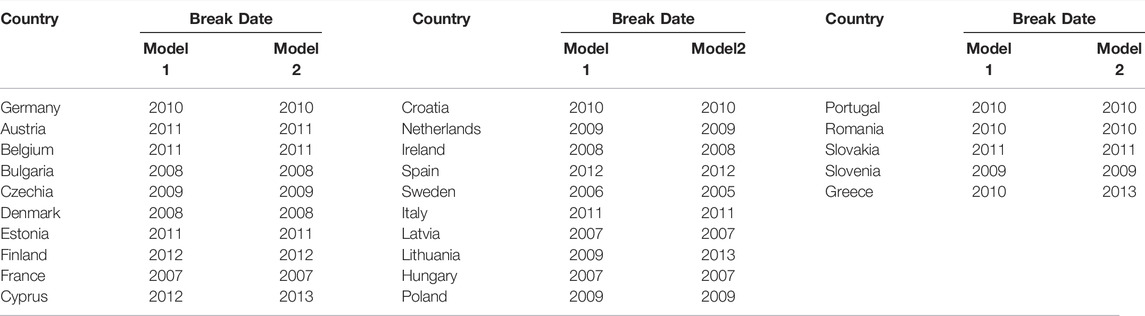
As a result of the cointegration test, the null hypothesis was rejected at 1% probability level for both models. We observe that the series are cointegrated under structural breaks.2 In other words, these results confirmed the Durbin-H cointegration test outcomes.
After confirmation of cointegration relationship among the series we intended to get the long run-coefficients of the expalanatory variables. We employ PMG estimation techniques and the estimation results are given in Table 9 below.
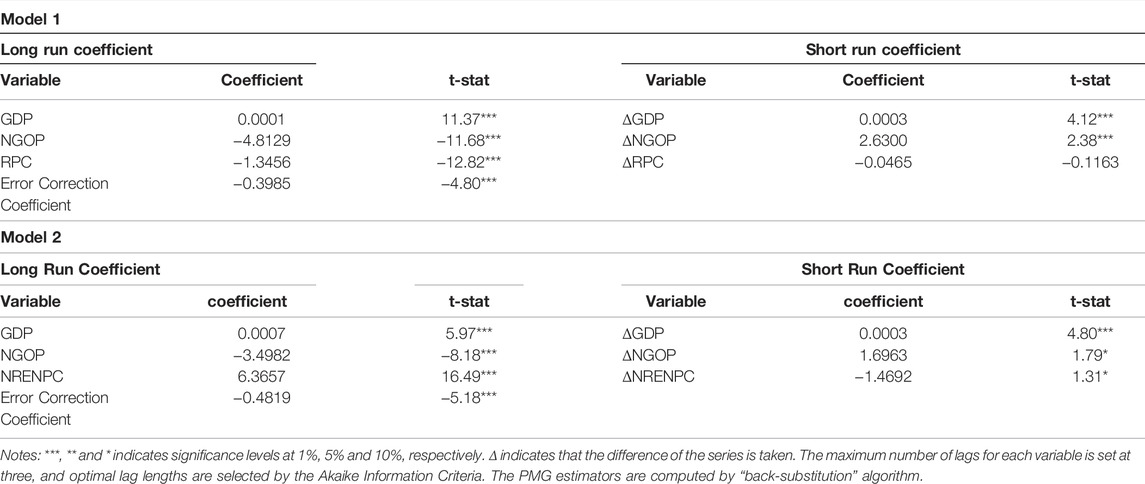
TABLE 9. Results for PMG estimations (panel ARDL).
The findings obtained from the PMG-ARDL estimation approach confirm that all coefficients are statistically significant at 1% significance level in the long run. Following the PMG-ARDL findings for model 1, we can interpret that a 1% increase in real GDP per capita increases EF by 0.0001%. This means that rise in GDP per capita worsens the ecological footprint in the long run. This finding is also valid in the short run. The outcomes collected from PMG-ARDL provide evidence that our core explanatory variable Non-Green Openness is statistically significant and has a negative sign. If non-green openness increases by one percentage point, EF decreases by 481%.3 According to our best knowledge, this is the first study that shows the impact of non-green trade basket on environment. In this context, this study is complementary to the Green Openness Index presented by Can et al. (2022). Renewable energy consumption is another significant parameter that impact environmental quality. According to outcomes gained from long-run estimation, if RPC boost by 1%, EF reduces by 1.34%. Furthermore, the negative and significant impact of renewable energy use is consistent with Usman et al. (2021) and Paramati et al. (2021), which show that renewable energy use protects the environment in various ways.
For the second model, we observe that all coefficients are significant at 1% level. Employing PMG-ARDL, results provide evidence that a 1% increase in real GDP per capita increases EF by 0.0007%. This result is in the line with GDP coefficient in model 1. Interestingly, our main indicator, i.e., NGOP, as in model 1, has a negative and significant effect on EF. The analysis of the approximated coefficient for NGOP corresponds to one percentage point increase in NGOP index, resulting in a 349% decrease in EF.4 This finding also confirms the outcomes for NGOP obtained for model 1. When we evaluate the findings for non-renewable energy consumption, we observe that NRENPC has a substantial negative impact on the environment. PMG-ARDL estimation reveals that a 1% rise in NRENPC results in a boost of the EF by 6.36%. This result is consistent with our expectations since there is widespread agreement in the literature about the harmful effects of fossil fuel-based energy use on the environment (Shafiei and Salim, 2014; Baek, 2015). Lastly, considering the short-term coefficients, the lag error correction term coefficient is negative and significant for both models.
5 Discussion and Policy Recommendation
The core result of our estimations is that for the sample of EU-25 countries non-green trade openness (NGOP) has a negative effect on environmental degradation quantified by the Ecological Footprint (EF). Put simply, more dirty trade of the EU with the rest of the world improves the environmental quality in the EU. This observation does support the PHH, which predicts that more ambitious environmental regulation imposed by a region will push pollution abroad. Whether this is a problem for the EU depends on the nature of the environmental problem, the existing environmental regulation and the policy makers’ objective function. For CO2 emissions abatement which contributes to a global public good, the reallocation of CO2 emissions from the developed world to other, less developed countries, is problematic since the net effect of abatement is reduced and it can even be negative if emitters outside the regulated region produce with higher emissions intensity. Under the existence of the EU ETS without CBAM rules the effect of carbon leakage would be definitely negative since the CO2 emissions cap is fix and increasing emissions in the rest of world can not be compensated by decreasing emissions in the EU. For local environmental problems such as local air pollution, e.g., SOX emissions, the decrease of pollution in the EU has to be weighed against the increase of pollution abroad which is finally a polical decision. If the EU–at least to some extent–also takes into account local environmental effects in other countries caused by increased trade of non-green products the latter effect also creates a need for environmental policy action. Either the EU directly increases the costs for imports of dirty production respectively non-green products linked to local pollution in the exporting countries or the EU supports the implementation of stronger regulation of local pollution in these regions. Overall, our result emphasizes the importance of measures which try to equalize the marginal costs of environmental-friendly behavior between the EU and the rest of the world like the CBAM which is complementing the EU-ETS in the area of climate change mitigation.
Related to the Paris climate agreement and the EU’s committment to make Europe the first climate-neutral continent, legal regulations, policies that support the environment and the creation of a circular economy market are required. Additionally, there is a need for an economic structure that will finance the production of environment-friendly products (Alsaleh, Zubair, & Abdul-Rahim, 2020). Undoubtedly, achieving net zero GHG emissions by 2050 will require deep structural transformation of almost the entire economy (Sachs et al., 2019). Achieving the results of this sweeping transformation will result in major changes in resource use, social and political institutions, and the composition of investment and financial support. However, in order to reach the carbon emission reduction targets until 2030, which are content of the medium-term plans, serious regulations should be made especially in energy use and industrial production (Pablo-Romero & Sánchez-Braza, 2017). Because, according to the European Environment Agency, around 25% of total energy consumption is from industry and more than 80% of total emissions in EU-28 countries are caused by energy consumption (Eurostat, 2020). Such policies include establishment respectively enlargement of effective and well-functioning carbon markets, such as the EU-ETS, and granting of carbon credits to compensate low-carbon emitting firms. All these will ensure that non-renewable energy is used in their most efficient forms with just little adverse impact on the entire ecological system.
6 Conclusion
In this study, we attempted to explore the relationship between environmental degradation quantified by the ecological footprint and real income per capita, non-green trade openness index, renewable energy consumption and non-renewable energy consumption for 25 EU countries over the period 2003–2016. We employed different panel techniques such as CD, cross-sectionally augmented IPS (CIPS), Durbin-H and cointegration test with structural breaks cointegration approaches and PMG-ARDL techniques. According to the findings obtained from PMG-ARDL results, it is concluded that renewable energy consumption decreases the ecological footprint while non-renewable energy consumption increases the environmental degradation. The outcomes related to our core variable reveal that non-green trade openness decreases the ecological footprint. This result, which supports the Pollution Haven Hypothesis, is the novel contribution of this research to the current literature. It is necessary to pay attention to the fact that non-green trade openness reduces the ecological footprint for the EU-25. The increase in foreign trade volume of non-green products causes an increase in the EU’s environmental quality. This situation has the potential to be understood as a problematic finding for global as well as local environmental problems. Global environmental problems such as GHG emissions, increased acidity of the oceans or deforestation that increases the carbon footprint do not have regional solutions. What needs to be done here is to reduce the non-green foreign trade volume as a whole and to ensure that the products subject to international trade consist of environment-friendly products. To do that, policy instruments such as a carbon tax at the border like in the EU’s CBAM are important tools that can enable countries to transform their economic structures and increase trade in green products. Given that the EU takes into account damages caused by local pollution in other countries, our result also implies a need for action in this policy area. Imported non-green products goods have to become more expensive in order to set incentives to produce more environment-friendly in the country of origin.
This research is limited by EU-25 countries. We recommend that researchers ought to check the impact of non-green trade on environment for different country groups by using numerous environmental indicators such as CO2 emissions, SOX or other pollutants. Besides, future studies can use different frameworks such as environmental Kuznets curve (EKC) or STIRPAT (Stochastic Impacts by Regression on Population, Affluence, and Technology) model to explore the impact of non-green trade on different environmental parameters. It might also be worthwhile to investigate the association between NGOP and energy demand. Researchers can examine this question both for non-renewable and renewable energy consumption. We also advice to identify the potential determinants of NGOP for different country groups. Additionally, it can be expected that NGOP may have potential impact on various economic parameters (e.g. employment, economic growth). We leave these questions for future research.
Data Availability Statement
The raw data supporting the conclusion of this article will be made available by the authors, without undue reservation.
Author Contributions
MC: Conceptualization, index calculation, data curation, formal analysis, visualization, writing original draft. IO: Conceptualization, index calculation, writing original draft. BS: writing—review, and editing, supervision IG: writing—review and editing. BG: writing—review, and editing, funding acquisition. JP: supervision, project administration, writing—review, and editing.
Funding
This research was supported by the Scientific Grant Agency of the Ministry of Education, Science, Research, and Sport of the Slovak Republic and the Slovak Academy Sciences as part of the research project VEGA No. 1/0590/22.
Conflict of Interest
The authors declare that the research was conducted in the absence of any commercial or financial relationships that could be construed as a potential conflict of interest.
Publisher’s Note
All claims expressed in this article are solely those of the authors and do not necessarily represent those of their affiliated organizations, or those of the publisher, the editors and the reviewers. Any product that may be evaluated in this article, or claim that may be made by its manufacturer, is not guaranteed or endorsed by the publisher.
Acknowledgments
The authors are very thankful to all the staff and lab members of BETA Akademi-Social Science Research Lab (SSR Lab) for their valuable suggestions and comments to MC and IO during the development of Non-Green Openness Index (NGOP).
Footnotes
1EU has 27 member states. However, in our investigation we have to exclude Luxemborg and Malta since for these countries data for trade in green goods are not available.
2The break dates are presented in Appendix 1.
3The functional relationship between EF and NGOP is estimated as log-lin model (see Eq. 3), i.e., the estimated coefficient
4See footnote 3.
References
Abid, M. (2017). Does Economic, Financial and Institutional Developments Matter for Environmental Quality? A Comparative Analysis of EU and MEA Countries. J. Environ. Manag., 188, 183–194. doi:10.1016/j.jenvman.2016.12.007
Ahmad, M., Ahmed, Z., Bai, Y., Qiao, G., Popp, J., and Oláh, J. (2022a). Financial Inclusion, Technological Innovations, and Environmental Quality: Analyzing the Role of Green Openness. Front. Environ. Sci. 10. doi:10.3389/fenvs.2022.851263
Ahmad, M., Ahmed, Z., Gavurova, B., and Oláh, J. (2022b). Financial Risk, Renewable Energy Technology Budgets, and Environmental Sustainability: Is Going Green Possible? Front. Environ. Sci. 10, 518. doi:10.3389/fenvs.2022.909190
Al-Mulali, U., Ozturk, I., and Lean, H. H. (2015). The Influence of Economic Growth, Urbanization, Trade Openness, Financial Development, and Renewable Energy on Pollution in Europe. Nat. Hazards 79 (1), 621–644. doi:10.1007/s11069-015-1865-9
Alola, A. A., Akadiri, S. S., and Usman, O. (2021). Domestic Material Consumption and Greenhouse Gas Emissions in the EU ‐28 Countries: Implications for Environmental Sustainability Targets. Sustain. Dev., 29(2), 388–397. doi:10.1002/sd.2154
Alsaleh, M., Zubair, A. O., and Abdul‐Rahim, A. S. (2020). The Impact of Global Competitiveness on the Growth of Bioenergy Industry in EU ‐28 Region. Sustain. Dev., 28(5), 1304–1316. doi:10.1002/sd.2085
Anderson, J. E., and van Wincoop, E. (2004). Trade Costs. J. Econ. Literature 42 (3), 691–751. doi:10.1257/0022051042177649
Ansari, M. A., Haider, S., and Masood, T. (2021). Do renewable Energy and Globalization Enhance Ecological Footprint: an Analysis of Top Renewable Energy Countries? Environ. Sci. Pollut. Res. 28 (6), 6719–6732. doi:10.1007/s11356-020-10786-0
Apergis, N., Can, M., Gozgor, G., and Lau, C. K. M. (2018). Effects of Export Concentration on CO2 Emissions in Developed Countries: an Empirical Analysis. Environ. Sci. Pollut. Res. 25 (14), 14106–14116. doi:10.1007/s11356-018-1634-x
Bölük, G., and Mert, M. (2014). Fossil & Renewable Energy Consumption, GHGs (Greenhouse Gases) and Economic Growth: Evidence from a Panel of EU (European Union) Countries. Energy, 74, 439–446. doi:10.1016/j.energy.2014.07.008
Baek, J. (2015). Environmental Kuznets Curve for CO2 Emissions: the Case of Arctic Countries. Energy Econ. 50, 13–17. doi:10.1016/j.eneco.2015.04.010
Bayer, P., and Aklin, M. (2020). The European Union Emissions Trading System Reduced CO 2 Emissions Despite Low Prices. Proc. Natl. Acad. Sci. U.S.A. 117 (16), 8804–8812. LP – 8812. doi:10.1073/pnas.1918128117
Bellora, C., and Fontagne, L. (2021). EU in Search of a WTO-Compatible Carbon Border Adjustment Mechanism. Mimeo. Available: http://wwwlionel-fontagneu/uploads/9/8/3/3/98330770.
Benzerrouk, Z., Abid, M., and Sekrafi, H. (2021). Pollution Haven or Halo Effect? A Comparative Analysis of Developing and Developed Countries. Energy Rep., 7, 4862–4871. doi:10.1016/j.egyr.2021.07.076
Blecharz, P., and Stverkova, H. (2014). Assessing the Service Quality in Small and Medium-Sized Companies. Актуальні Проблеми Економіки (4), 206–217.
Can, M., Dogan, B., and Saboori, B. (2020). Does Trade Matter for Environmental Degradation in Developing Countries? New Evidence in the Context of Export Product Diversification. Environ. Sci. Pollut. Res. Int. 27, 14702–14710. doi:10.1007/s11356-020-08000-2
Can, M., Ahmed, Z., Mercan, M., and Kalugina, O. A. (2021). The Role of Trading Environment-Friendly Goods in Environmental Sustainability: Does Green Openness Matter for OECD Countries? J. Environ. Manag., 295, 113038. doi:10.1016/j.jenvman.2021.113038
Can, M., Ben Jebli, M., and Brusselaers, J. (2022). Can Green Trade Save the Environment? Introducing the Green (Trade) Openness Index. Environ. Sci. Pollut. Res. doi:10.1007/s11356-022-18920-w
Cherni, A., and Essaber Jouini, S. (2017). An ARDL Approach to the CO2 Emissions, Renewable Energy and Economic Growth Nexus: Tunisian Evidence. Int. J. Hydrogen Energy, 42(48), 29056–29066. doi:10.1016/j.ijhydene.2017.08.072
Cole, M. A. (2004). Trade, the Pollution Haven Hypothesis and the Environmental Kuznets Curve: Examining the Linkages. Ecol. Econ. 48 (1), 71–81. doi:10.1016/j.ecolecon.2003.09.007
Commission, European, (2022). Climate Strategies & Targets. Available: https://ec.europa.eu/clima/eu-action/climate-strategies-targets_en.
Danish, , and wang, Z. (2019). Investigation of the Ecological Footprint's Driving Factors: What We Learn from the Experience of Emerging Economies. Sustain. Cities Soc., 49, 101626. doi:10.1016/j.scs.2019.101626
Destek, M. A., Balli, E., and Manga, M. (2016). The Relationship between CO2 Emission, Energy Consumption, Urbanization and Trade Openness for Selected CEECs. Res. World Econ. 7 (1), 52–58. doi:10.5430/rwe.v7n1p52
Destek, M. A., Ulucak, R., and Dogan, E. (2018). Analyzing the Environmental Kuznets Curve for the EU Countries: the Role of Ecological Footprint. Environ. Sci. Pollut. Res. 25 (29), 29387–29396. doi:10.1007/s11356-018-2911-4
Dogan, E., and Seker, F. (2016). Determinants of CO2 Emissions in the European Union: The Role of Renewable and Non-renewable Energy. Renew. Energy, 94, 429–439. doi:10.1016/j.renene.2016.03.078
Ec, D. (2018). A Clean Planet for All. A European Strategic Long-Term Vision for a Prosperous, Modern, Competitive and Climate Neutral Economy. Communıcatıon from the Commıssıon to the European Parlıament, the European Councıl, the Councıl, the European Economıc and Socıal Commıttee. Brussels: ComThe Commıttee Of The Regıons And The European Investment Bank, 773.
Eicke, L., Weko, S., Apergi, M., and Marian, A. (2021). Pulling up the Carbon Ladder? Decarbonization, Dependence, and Third-Country Risks from the European Carbon Border Adjustment Mechanism. Energy Res. Soc. Sci., 80, 102240. doi:10.1016/j.erss.2021.102240
Eurostat European Union (2020). Final Energy Consumption by Sector - European Environment Agency (EEA). Available: http://www.eea.europa.eu/data-and-maps/daviz/total-final-energy-consumption-by-sector-1#tab-chart_5.
Global Footprint Network, (2022). Global Footprint Network. Available: https://www.footprintnetwork.org/.
Goswami, G. G., and Junayed, S. H. (2006). Pooled Mean Group Estimation of the Bilateral Trade Balance Equation: USAvis‐à‐visher Trading Partners. Int. Rev. Appl. Econ. 20 (4), 515–526. doi:10.1080/02692170600874218
Hashem Pesaran, M., and Yamagata, T. (2008). Testing Slope Homogeneity in Large Panels. J. Econ. 142 (1), 50–93. doi:10.1016/j.jeconom.2007.05.010
Hu, G., Can, M., Paramati, S. R., Doğan, B., and Fang, J. (2020). The Effect of Import Product Diversification on Carbon Emissions: New Evidence for Sustainable Economic Policies. Econ. Analysis Policy 65, 198–210. doi:10.1016/j.eap.2020.01.004
Iwata, H., Okada, K., and Samreth, S. (2010). Empirical Study on the Environmental Kuznets Curve for CO2 in France: The Role of Nuclear Energy. Energy Policy, 38(8), 4057–4063. doi:10.1016/j.enpol.2010.03.031
Jänicke, M., Binder, M., and Mönch, H. (1997). 'Dirty Industries': Patterns of Change in Industrial Countries. Environ. Resour. Econ. 9 (4), 467–491. doi:10.1007/BF02441762
Jouini, J. (2015). Linkage between International Trade and Economic Growth in GCC Countries: Empirical Evidence from PMG Estimation Approach. J. Int. Trade & Econ. Dev. 24 (3), 341–372. doi:10.1080/09638199.2014.904394
Kasman, A., and Duman, Y. S. (2015). CO2 Emissions, Economic Growth, Energy Consumption, Trade and Urbanization in New EU Member and Candidate Countries: A Panel Data Analysis. Econ. Model. 44, 97–103. doi:10.1016/j.econmod.2014.10.022
Ketenci, N. (2021). Environmental Kuznets Curve in the Presence of Structural Breaks: New Evidence for Individual European Countries. Environ. Sci. Pollut. Res. 28 (24), 31520–31538. doi:10.1007/s11356-021-12677-4
Kongbuamai, N., Zafar, M. W., Zaidi, S. A. H., and Liu, Y. (2020). Determinants of the Ecological Footprint in Thailand: the Influences of Tourism, Trade Openness, and Population Density. Environ. Sci. Pollut. Res. 27 (32), 40171–40186. doi:10.1007/s11356-020-09977-6
Krzymowski, A. (2020). The European Union and the United Arab Emirates as Civilian and Soft Powers Engaged in Sustainable Development Goals. J. Int. Stud. 13 (3), 41–58. doi:10.14254/2071-8330.2020/13-3/3
Liu, H., Kim, H., and Choe, J. (2019). Export Diversification, CO2 Emissions and EKC: Panel Data Analysis of 125 Countries. Asia-Pac J. Reg. Sci. 3 (2), 361–393. doi:10.1007/s41685-018-0099-8
Lu, W.-C. (2020). The Interplay Among Ecological Footprint, Real Income, Energy Consumption, and Trade Openness in 13 Asian Countries. Environ. Sci. Pollut. Res. 27 (36), 45148–45160. doi:10.1007/s11356-020-10399-7
Mania, E. (2020). Export Diversification and CO 2 Emissions: An Augmented Environmental Kuznets Curve. J. Int. Dev., 32(2), 168–85. doi:10.1002/jid.3441
Mehling, M. A., and Ritz, R. A. (2020). Going beyond Default Intensities in an EU Carbon Border Adjustment Mechanism. New York: JSTOR.
Mensah, I. A., Sun, M., Gao, C., Omari-Sasu, A. Y., Zhu, D., Ampimah, B. C., et al. (2019). Analysis on the Nexus of Economic Growth, Fossil Fuel Energy Consumption, CO2 Emissions and Oil Price in Africa Based on a PMG Panel ARDL Approach. J. Clean. Prod., 228, 161–174. doi:10.1016/j.jclepro.2019.04.281
Mesagan, E. P., and Chidi, O. N. (2020). Energy Consumption, Capital Investment and Environmental Degradation: The African Experience. Forum Sci. Oeconomia 8, 1. doi:10.23762/FSO_VOL8_NO1_1
Mongo, M., Belaïd, F., and Ramdani, B. (2021). The Effects of Environmental Innovations on CO2 Emissions: Empirical Evidence from Europe. Environ. Sci. Policy, 118, 1–9. doi:10.1016/j.envsci.2020.12.004
Nasir, M. A., Duc Huynh, T. L., and Xuan Tram, H. T. (2019). Role of Financial Development, Economic Growth & Foreign Direct Investment in Driving Climate Change: A Case of Emerging ASEAN. J. Environ. Manag. 242, 131–141. doi:10.1016/j.jenvman.2019.03.112
Nasreen, S., and Anwar, S. (2014). Causal Relationship between Trade Openness, Economic Growth and Energy Consumption: A Panel Data Analysis of Asian Countries. Energy Policy, 69, 82–91. doi:10.1016/j.enpol.2014.02.009
OECD Stat (2022). OECD Data. Available: https://data.oecd.org/.
Ohlan, R. (2015). The Impact of Population Density, Energy Consumption, Economic Growth and Trade Openness on CO2 Emissions in India. Nat. Hazards 79 (2), 1409–1428. doi:10.1007/s11069-015-1898-0
Our World in Data (2022). Our World in Data. Available: https://ourworldindata.org/ April 2, 2022).
Pablo-Romero, M. d. P., and Sánchez-Braza, A. (2017). Residential Energy Environmental Kuznets Curve in the EU-28. Energy, 125, 44–54. doi:10.1016/j.energy.2017.02.091
Paramati, S. R., Alam, M. S., Hammoudeh, S., and Hafeez, K. (2021). Long‐run Relationship between R&D Investment and Environmental Sustainability: Evidence from the European Union Member Countries. Int. J. Fin. Econ. 26 (4), 5775–5792. doi:10.1002/ijfe.2093
Paramati, S. R., Mo, D., and Huang, R. (2021). The Role of Financial Deepening and Green Technology on Carbon Emissions: Evidence from Major OECD Economies. Finance Res. Lett., 41, 101794. doi:10.1016/j.frl.2020.101794
Pesaran, M. H., Shin, Y., and Smith, R. P. (1999). Pooled Mean Group Estimation of Dynamic Heterogeneous Panels. J. Am. Stat. Assoc. 94 (446), 621–634. doi:10.1080/01621459.1999.10474156
Pié, L., Fabregat-Aibar, L., and Saez, M. (2018). The Influence of Imports and Exports on the Evolution of Greenhouse Gas Emissions: The Case for the European Union. Energies 11, 1644. doi:10.3390/en11071644
Prokopenko, O., Mishenin, Y., Mura, L., and Yarova, I. (2020). Environmental and Economic Regulation of Sustainable Spatial Agroforestry. Ijgenvi 19 (1–3), 109–128. doi:10.1504/IJGENVI.2020.114868
Rees, W. (2018). “Ecological Footprint,” in Companion to Environmental Studies (London: Routledge), 43–48. doi:10.4324/9781315640051-10
Sachs, J. D., Schmidt-Traub, G., Mazzucato, M., Messner, D., Nakicenovic, N., and Rockström, J. (2019). Six Transformations to Achieve the Sustainable Development Goals. Nat. Sustain 2 (9), 805–814. doi:10.1038/s41893-019-0352-9
Sadorsky, P. (2012). Energy Consumption, Output and Trade in South America. Energy Econ. 34 (2), 476–488. doi:10.1016/j.eneco.2011.12.008
Sebri, M., and Ben-Salha, O. (2014). On the Causal Dynamics between Economic Growth, Renewable Energy Consumption, CO 2 Emissions and Trade Openness: Fresh Evidence from BRICS Countries. Renew. Sustain. Energy Rev., 39, 14–23. doi:10.1016/j.rser.2014.07.033
Shafiei, S., and Salim, R. A. (2014). Non-renewable and Renewable Energy Consumption and CO2 Emissions in OECD Countries: A Comparative Analysis. Energy Policy, 66, 547–556. doi:10.1016/j.enpol.2013.10.064
Shahzad, U., Ferraz, D., Doğan, B., and Aparecida do Nascimento Rebelatto, D. (2020). Export Product Diversification and CO2 Emissions: Contextual Evidences from Developing and Developed Economies. J. Clean. Prod., 276, 124146. doi:10.1016/j.jclepro.2020.124146
Sharif Hossain, M. (2011). Panel Estimation for CO2 Emissions, Energy Consumption, Economic Growth, Trade Openness and Urbanization of Newly Industrialized Countries. Energy Policy, 39(11), 6991–6999. doi:10.1016/j.enpol.2011.07.042
Sharma, R., Shahbaz, M., Kautish, P., and Vo, X. V. (2022). Diversified Imports as Catalysts for Ecological Footprint: Examining the BRICS Experience. Environ. Dev. Sustain. doi:10.1007/s10668-022-02177-x
Shpak, N., Melnyk, O., HORbAL, N., Ruda, M., and Sroka, W. (2021). Assessing the Implementation of the Circular Economy in the EU Countries. Forum Sci. Oeconomia 9, 25–39.
Siddi, M. (2020). The European Green Deal: Assessing its Current State and Future Implementation. UPI ReportAvailable at: https://iris.unica.it/handle/11584/313484.
Skjærseth, J. B., and Wettestad, J. (2009). The Origin, Evolution and Consequences of the EU Emissions Trading System. Glob. Environ. Polit. 9 (2), 101–122. doi:10.1162/glep.2009.9.2.101
Štreimikienė, D. (2021). Externalities of Power Generation in Visegrad Countries and Their Integration through Support of Renewables. Econ. Sociol. 14 (1), 89–102. doi:10.14254/2071-789X.2021/14-1/6
Tachie, A. K., Xingle, L., Dauda, L., Mensah, C. N., Appiah-Twum, F., and Adjei Mensah, I. (2020). The Influence of Trade Openness on Environmental Pollution in EU-18 Countries. Environ. Sci. Pollut. Res. 27 (28), 35535–35555. doi:10.1007/s11356-020-09718-9
Uddin, G. A., Salahuddin, M., Alam, K., and Gow, J. (2017). Ecological Footprint and Real Income: Panel Data Evidence from the 27 Highest Emitting Countries. Ecol. Indic., 77, 166–175. doi:10.1016/j.ecolind.2017.01.003
UNFCCC (2015). Adoption of the Paris Agreement. FCCC/CP/2015/L. 9/Rev. 1. Available at: https://unfccc.int/resource/docs/2015/cop21/eng/l09r01.pdf.
Usman, O., Iorember, P. T., Jelilov, G., Isik, A., Ike, G. N., and Sarkodie, S. A. (2021). Towards Mitigating Ecological Degradation in G-7 Countries: Accounting for Economic Effect Dynamics, Renewable Energy Consumption, and Innovation. Heliyon, 7(12), e08592. doi:10.1016/j.heliyon.2021.e08592
Westerlund, J., and Edgerton, D. L. (2008). A Simple Test for Cointegration in Dependent Panels with Structural Breaks*. Oxf. Bull. Econ. Statistics 70 (5), 665–704. doi:10.1111/j.1468-0084.2008.00513.x
Westerlund, J. (2008). Panel Cointegration Tests of the Fisher Effect. J. Appl. Econ., 23(2), 193–233. doi:10.1002/jae.967
World Bank, (2022). Data World Bank. Available: https://data.worldbank.org/ February 16, 2022).Retrieved.
World Development Indicators (Wdi), (2021). World Development Indicators (Wdi). Available: https://databank.worldbank.org/source/world-development-indicators.
Appendix 1 Structural Break Dates for Countries
Keywords: carbon neutrality, non-green products trading, non-green openness index, income, environmental sustainability, pollution haven hypothesis (PHH)
Citation: Can M, Oluc I, Sturm B, Guzel I, Gavurova B and Popp J (2022) Nexus Between Trading Non-Green Products and Environment: Introducing Non-Green Trade Openness Index. Front. Environ. Sci. 10:950453. doi: 10.3389/fenvs.2022.950453
Received: 22 May 2022; Accepted: 03 June 2022;
Published: 04 July 2022.
Edited by:
Ehsan Elahi, Shandong University of Technology, ChinaReviewed by:
Xiyue Yang, Dalian University of Technology, ChinaMuhammad Ilyas, Nanjing University of Information Science and Technology, China
Copyright © 2022 Can, Oluc, Sturm, Guzel, Gavurova and Popp. This is an open-access article distributed under the terms of the Creative Commons Attribution License (CC BY). The use, distribution or reproduction in other forums is permitted, provided the original author(s) and the copyright owner(s) are credited and that the original publication in this journal is cited, in accordance with accepted academic practice. No use, distribution or reproduction is permitted which does not comply with these terms.
*Correspondence: Beata Gavurova, YmVhdGEuZ2F2dXJvdmFAdHVrZS5zaw==
†ORCID: Muhlis Can, orcid.org/0000-0002-7315-2916; Ihsan Oluc, orcid.org/0000-0002-5167-1862; Ihsan Guzel, orcid.org/0000-0002-9525-6628; Beata Gavurova, orcid.org/0000-0002-0606-879X