 Xiaohong Dang1,2
 Ya Na1,3*
 Wenfeng Chi4,5*Jiangjia Zhao6
 Yuanyuan Zhao6Yue Wang4,5Xiaoguang Wu1,7Yuetian Wang4,5
- 1Inner Mongolia Agricultural University, Hohhot, China
- 2Inner Mongolia Hangjin Desert Ecological Position Research Station, Ordos, China
- 3Key Laboratory of Grassland Resources of the Ministry of Education, Key Laboratory of Forage Cultivation, Processing and High Efficient Utilization of the Ministry of Agriculture and Rural Affairs, Inner Mongolia Key Laboratory of Grassland Management and Utilization, Inner Mongolia Agricultural University, Hohhot, China
- 4College of Resources and Environmental Economics, Inner Mongolia University of Finance and Economics, Hohhot, China
- 5Resource Utilization and Environmental Protection Coordinated Development Academician Expert Workstation in the North of China, Inner Mongolia University of Finance and Economics, Hohhot, China
- 6Key Laboratory of Soil and Water Conservation and Desertification Combating, Ministry of Education, School of Soil and Water Conservation, Beijing Forestry University, Beijing, China
- 7Inner Mongolia Autonomous Region Land and Space Planning Institute, Hohhot, China
Continuous remote-sensing monitoring of sand in desert areas and the exploration of the spatio–temporal evolution characteristics of soil–wind erosion has an important scientific value for desertification prevention and ecological restoration. In this study, the Kubuqi Desert was selected as the study area, and the Landsat series satellite remote sensing data, supplemented by satellite remote sensing data such as GE images, SPOT-5, ZY-3, GF-1/2/6, etc., integrated object-oriented, decision tree, and auxiliary human–computer interaction interpretation methods, developed the Kubuqi Desert area dataset from 1990 to 2020, and established a soil erosion intensity database of the past 30 years based on the soil–wind erosion correction equation. The results show that the application of the training samples obtained by a high-score collaborative ground sampling to land use/cover classification in desert areas can effectively improve the efficiency of remote-sensing mapping of sand changes and the accuracy of change information identification, and the overall accuracy of the classification results is 95%. In general, the sandy area of the Kubuqi Desert area has decreased year by year, during which the mobile sand in the hinterland of the desert has expanded in a scattered distribution. The overall soil–wind erosion intensity showed a downward trend, especially since 2000; the ecological improvement trend after the implementation of desertification control projects is obvious. Changes in the sand type contributed the most to the reduction of soil–wind erosion intensity (contribution 81.14%), ecological restoration played a key role in reducing the soil–wind erosion intensity (contribution 14.42%), and the increase of forest and grass vegetation covers and agricultural oases played a positive role in solidifying the soil- and wind-proof sand fixation. The pattern of sandy land changes in desert areas is closely related to the national ecological civilization construction policy and the impact of climate change.
1 Introduction
Desertification is one of the most critical problems in the global ecological environment. The problems such as the reduction of land resources, the decline of soil quality, and the frequent dust storms seriously restrict the socio–economic development and sustainable land use (Wang, 2003; Sachs, 2004; Schimel, 2010; Pravalie, 2016). Desertified land is also affected severely by soil–wind erosion. The area of wind erosion desertification in China reaches 160.74 × 10⁴ km2, accounting for 16.7% of the total land area (Ci and Wu, 1997), which hinders the development of regional resources and sustainable ecological development (Zhang et al., 2018). Sandy lands and deserts are widely distributed in northern China. The climate changes and human activities have led to the aggravation of desertification in arid regions and have increased the intensity of soil–wind erosion (Wang et al., 2008; Uno et al., 2006; Liang et al., 2021). As the area of drylands in the world is expanding (Koutroulis, 2019), improving the desertification combating and adaption in northern China is one of the effective ways to mitigate the risks of climate change in the future (World Economic Forum, 2020). The development of the new era emphasizes the vision of “beautiful China” in 2035 and 2050. The desertification combating and ecological restoration project plays a vital role in building a beautiful China. “Greening” and ecological restoration in deserts can be realized through ecological environment protection and ecological engineering construction (Chen et al., 2019; Ge et al., 2020; Ma et al., 2020). Over the past 30 years, the intensity of soil–wind erosion in China has decreased, but the inter-annual wind erosion intensity fluctuates greatly. The desertification caused by soil–wind erosion cannot be ignored (Chi et al., 2019). Desertification monitoring and assessment is an important indicator to understand the impact of climate changes and human activities on the ecological environment. Dynamic monitoring is a significant way to combat desertification scientifically. Therefore, to carry out desertification monitoring, accurately grasping the scope and spatio–temporal dynamics of desertification, and determining the evolution process of soil–wind erosion intensity are critical prerequisites for desertification land prevention (Hamed and Rao, 1998; Chen et al., 2019).
The analysis of the land desertification pattern in evolution and its influence on soil–wind erosion is not only an important basis for exploring the simulation and prediction of ecological environmental change, ecological protection and desertification combating in northern China, but also one of the contents of the current ecological environmental protection (Ouyang et al., 2016). Relevant research mainly focuses on remote sensing monitoring and analysis, soil–wind erosion simulation, and driving force analysis. In terms of desertification monitoring, remote sensing technology has become an important means to monitor land surface (Liu et al., 2020). With its comprehensiveness, timeliness, and operability, remote sensing technology has become one of the main and efficient means to obtain desertification and ecological restoration data (Liu and Deng, 2009; Jia et al., 2014), promoting desertification combating and ecological environmental comprehensive management. Based on remotely sensed monitoring data, about a quarter of the global green area from 2000 to 2017 came from China, ranking first in terms of contribution, 42% of which comes from afforestation together with agricultural oasis as an important manifestation (Chen et al., 2019). Meanwhile, with the development of other new information technologies including cloud computing, big data, and artificial intelligence, remote sensing information extraction has become more efficient and accurate (Liu et al., 2019). In terms of monitoring and evaluating soil–wind erosion, the methods adopted in China mainly include wind erosion profile and relic observation, cutting method, wind tunnel experiment, particle size analysis, mapping and remote sensing analysis, sediment transport rate observation, 137Cs tracing method, wind erosion model, etc. Among them, the combination of ground investigation, experiment, and GIS simulation has become widely used on a regional scale. Modified Wind Erosion Equation (RWEQ) (Fryrear et al., 1996; Fryrear et al., 2001) can provide a more reliable spatio–temporal pattern of soil erosion, then explore the impact of a large-scale ecological construction on the wind erosion process (Chi et al., 2019; Zhao et al., 2020).
Kubuqi Desert is the seventh largest desert in China, the nearest desert to the capital Beijing, and a crucial part of the ecological barrier in northern China. Since the beginning of the 21st century, Kubuqi Desert has vigorously implemented the ecological protection and restoration policy, and has successively conducted a series of major ecological protection and restoration projects, such as the “Three North” shelter forest, conversion of croplands to forests and grasslands, Beijing–Tianjin Sandstorm Sources Control, grassland protection and construction, and the national closed reservation of desertification land, and achieved satisfactory results. As the only desert that has been treated in the world, the “Kubuqi Model” is a textbook-level world miracle. Kubuqi Desert has been identified as an “eco-economic demonstration zone in a global desert” by the United Nations Environment Program, and has gradually become a research hotspot concerned by scholars at home and abroad (Wang, 2017; Lin et al., 2020). Some domestic scholars have studied the macroscopic pattern evolution and the scale of soil–wind erosion sample points of the Kubuqi Desert ecosystem. However, there is still a lack of research on desertification process monitoring and spatiotemporal evolution of soil–wind erosion based on the regional scale (Meng et al., 2014; Zhao et al., 2017; Dong et al., 2019). Based on this study, a new research method is proposed to carry out sand classification in the Kubuqi Desert. The proposed method presents good accuracy to extract sandy land distribution. Then, exploring climate change and ecological engineering play an important role in the change of sandy land area. Therefore, quantitatively analyzing the spatio–temporal variation of the sandy land in the Kubuqi Desert, determining the evolution of soil wind erosion, and understanding the driving factors as well as the influence of the evolution of sandy land patterns are beneficial to better evaluate the implementation of existing ecological protection and restoration policies, finding out problems and putting forward-targeted countermeasures, which is of great significance for building an ecological security barrier in northern China. In addition, it also plays a positive role in promoting ecological protection and high-quality development in the Yellow River Basin, and can also be used as a reference for global desertification combating.
2 Materials and Methods
2.1 Study Area
Kubuqi Desert is the seventh largest desert in China, which is located in the Ordos Plateau. It is characterized by a zonal distribution, extending from east to west. The length is about 40 km and its area is about 1.45 × 10⁶ hm2, with geographical coordinates of 107°–112° E and 39°–41° N. It spans parts of the Hangjin Banner, Dalat Banner, and Jungar Banner in Inner Mongolia, among which, the Hangjin Banner has the most serious desertification (Figure 1). The study area is composed of quicksand and semi-fixed dunes, dominated by crescent mobile sand dunes with strong mobility. This area is a typical continental climate area, which is located in the transition zone between the temperate arid steppe and the desert steppe, belonging to the semi-arid continental monsoon climate zone. The area is characterized by strong arid winds and annual gale days of 25–35 days. There is less precipitation in this area, and the moisture conditions in the east are quite different from the west. The average annual precipitation is 240–360 mm, and the average annual evaporation is 2,160 mm, which is more than 8 times of the rainfall. The main vegetation types are semi-arid steppe vegetation, meadow steppe vegetation, and dry steppe sandy vegetation. The forest vegetation is mainly plantations.
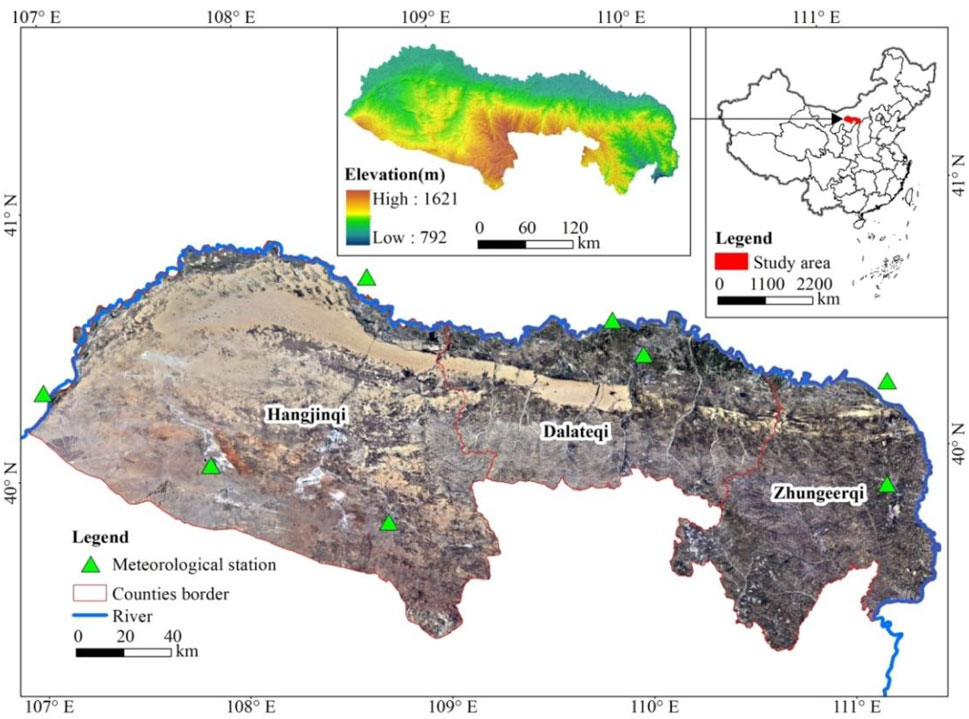
FIGURE 1. Location and elevation map of the study area.
2.2 Data
2.2.1 Landsat Data
Landsat satellite images are widely used in spatio–temporal dynamic monitoring of desertification because of their wide coverage, long time-series, and easy acquisition. In this study, remote sensing image data were obtained every 5 years (1990, 1995, 2000, 2005, 2010, 2015, and 2020) since 1990, and at least seven scenes were collected every 5 years (orbital parameters are 126/32, 126/33, 127/32, 127/33, 128/32, 128/33, and 129/32). In order to obtain the information of desert control and vegetation restoration, the data of the growing season (from June to October) were selected from remote sensing images taken by Landsat 5 (Table 1).

TABLE 1. Detailed information of the selected images.
2.2.2 Soil–Wind Erosion Model Parameters
Remote sensing monitoring of soil–wind erosion mainly collects data like vegetation cover, meteorology, soil, snow cover, and a basic geographical background for model inversion. Among them, the maximum synthetic normalized vegetation index (NDVI) time-series data of GIMMS and MODIS from 1990 to 2020 were obtained through the NASA website (https://www.nasa.gov/), using the general “dimidiate pixel model” (Shen et al., 2014) to obtain the annual and monthly vegetation coverage datasets. The meteorological data came from the National Meteorological Science Data Center (http://data.cma.cn/), and the daily average temperature, precipitation, average wind speed, wind direction, sandstorm, and sunshine duration of the meteorological stations in and around the study area were selected. The time scale of the meteorological data was from 1990 to 2020. The station-based data, interpolated based on the ANUSPLIN method, were subject to quality inspection and control to obtain the spatial data with a long time-series covering the entire study area. Snow cover factor was obtained through NASA website. The topography, digital elevation, soil type, vegetation type, basic geographic data, and other environmental background data involved in this study were obtained through the application from Resource and Environment Science and Data Center of Chinese Academy of Sciences (https://www.resdc.cn/).
2.2.3 Sampling Data
In order to construct the land use/cover classification method, set training samples, and evaluate the classification accuracy, this study adopted a human–computer interaction and field investigation to sample the land use/cover types in different years from Landsat TM, Google Earth historical image, SPOT-5 image, ZY-3 satellite image, and GF-1/2/6 image. Based on geostatistical methods, 5,732 samples were selected in total, which belonged to sandy land (4,806 samples) and non-sandy land (926 samples). The field survey data involved 737 sampling points and 36 field verification points of soil–wind erosion (Figure 2).
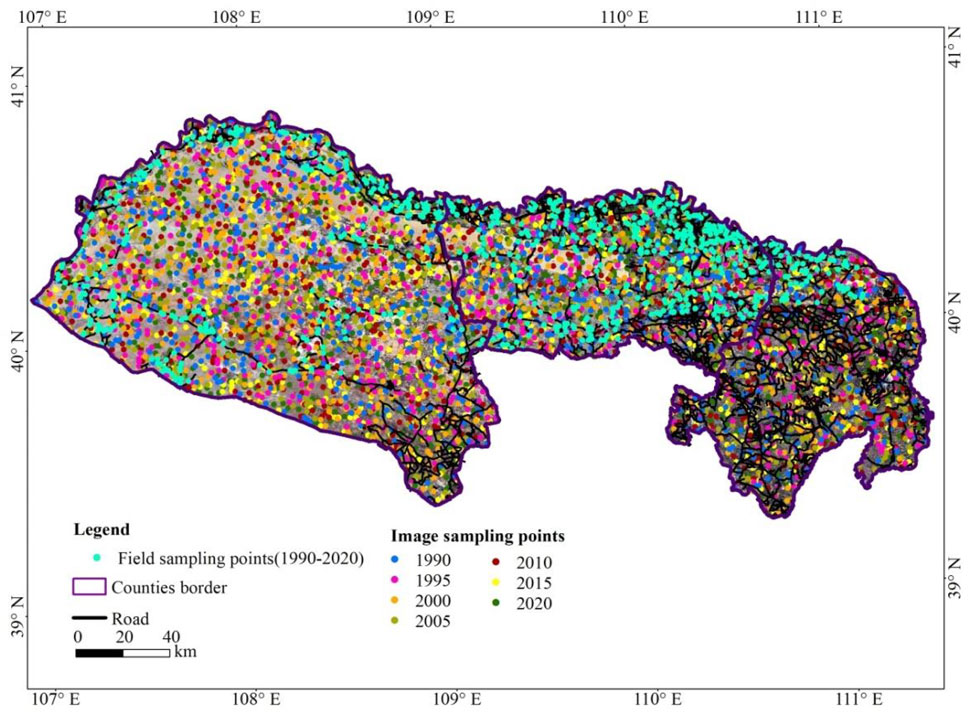
FIGURE 2. Distribution of the sampling points and the field survey points in different years.
2.3 Classification Method and the Wind Erosion Model
2.3.1 Land Use/Cover Classification
The main features of sandy land are high-surface reflectance, low soil moisture, and low vegetation coverage. In order to effectively identify sandy land and other types of land use (water body, cropland, forestland, and grassland, constructive land and other types), spectral features, spatial features, and thematic index features were selected to construct classification methods (Zhan et al., 2021). The spectral features adopted the average reflectance index (Takemura et al., 2002), the spatial features adopted the area, shape, and other indices (Zhan et al., 2021), and the thematic index features adopted the normalized vegetation index (NDVI) (Wang et al., 2013) and normalized water index (NDWI) (Li et al., 2011). This study used the combination of the decision tree and nearest neighbor classifier, together with human–machine interactive interpretation to obtain land use/cover change information (Figure 3): 1) pre-processing of the remote sensing images and basic data, including radiometric correction, geometric correction, atmospheric correction etc., to obtain surface reflectance. 2) Using NDWI and human–computer interactive interpretation (Liu et al., 2009) to extract the water bodies in the Kubuqi Desert from 1990 to 2020. Referring to auxiliary data like urban annotation data and traffic distribution data, constructive land is extracted by human–computer interaction. Select the threshold with NDVI less than 0.2 to determine sandy land and vegetation-free areas (Zhan et al., 2021). 3) Using the data of sampling points, the object-oriented classification of image segmentation and feature extraction (Camara et al., 1996) was used to in each ground feature. 4) Selecting typical land use/cover samples that are widely distributed in the image to build and test the classification tree (Quinlan, 1986). Based on the feature information of the thematic index, the heterogeneity of separated plots was analyzed; then, the vegetation and unclassified information were divided. Masking the unclassified information of the extracted water bodies and constructive land, the remaining unclassified objects were inputted into the nearest neighbor classification process (Kuncheva and Jain, 1999), and finally obtained sand, water body, cropland, forestland and grassland, constructive land, and other types. 5) The human–computer interactive interpretation method was adopted to verify and correct the land use/cover information in each period, and integrate the database of the current land use/cover situation and dynamic change information from 1990 to 2020.
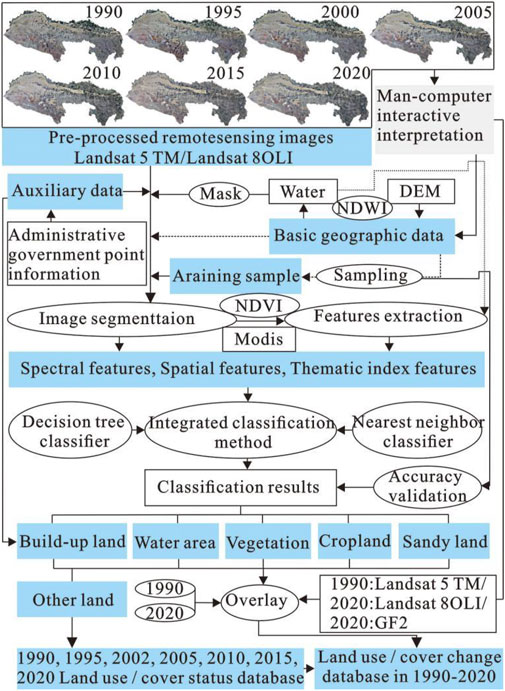
FIGURE 3. Land use/cover change information extraction technology process.
2.3.2 Soil–Wind Erosion Model
The combination of ground investigation and the RWEQ model was used to evaluate the annual soil wind erosion intensity from 1990 to 2020. The model measured soil–wind erosion by considering factors such as climate, soil erodibility, soil crust, surface roughness, and vegetation residue cover. Its basic expression was as follows (Fryrear et al., 1996; Fryrear, 2001):
where Qwind is the soil–wind erosion modulus used to characterize the soil–wind erosion intensity; x is the actual plot length; s is the critical field length; WF is the weather factor calculated using data on wind velocity, precipitation, temperature, and snow cover; EF is the soil erodibility factor; SCF is the soil crust factor, and they depend on the contents of organic matter content, sand, and clay; K′ is the soil roughness; and COG is the combined vegetation factor including growing vegetation canopy, flat cover, and standing residuals. We localized the parameters based on land use/cover data and field survey. The surface roughness on different land covers was obtained by using the ruler measurement method with the corresponding parameters corrected. Meanwhile, we conducted a quadrat survey in different seasons to establish the relationship between field-withered vegetation, standing residual, growing vegetation and NDVI inversion coverage, and correct vegetation factors (Chi et al., 2018).
2.4 Accuracy Evaluation
Accuracy verification is a quantitative analysis of land use/cover data products obtained by computer classification and human–computer interactive interpretation on the basis of a qualitative evaluation. It is a process of evaluating the quality of land use/cover products using sampling data (Figure 2) as well as remote sensing data with high-precision and high-resolution. The method to quantitatively measure the classification quality of land use/cover data adopted the confusion matrix method (Stehman, 2009), which was counting the number of land-use categories corresponding to the location of reference and verification points, and forming a n × n matrix, in which the number of statistics on the diagonal was the number of samples correctly classified after verification. Relevant indicators for evaluating the accuracy of the whole and each category based on the confusion matrix method included overall accuracy (OA), producer accuracy (PA), user accuracy (UA) and kappa coefficient (Congalton and Green, 2009).
3 Results
3.1 Validation of the Classification Results
The confusion matrix of land use/cover classification accuracy based on high-resolution remote sensing images/field sampling data is showed in Table 2. A total of 5,732 sample points were randomly sampled from high-resolution remote sensing images during 1990–2020, including 4,806 in sandy areas and 926 in non-sandy areas. In 2020, there were 737 sampling points in the field survey, including 59 in sandy areas and 678 in non-sandy areas. Through the object-oriented classification method, the spectral features, spatial features, and thematic index features were integrated to extract various types of ground features hierarchically, and the human–machine interactive interpretation was fully sampled for modification. The classification of sandy land and non-sandy land (water body, cropland, forestland and grassland, constructive land, and other types) had achieved good results. The overall accuracy of the seven classification results was over 95%, and the Kappa coefficient was more than 0.80. Therefore, the results could be used for a spatiotemporal pattern analysis as well (Zhan et al., 2021).
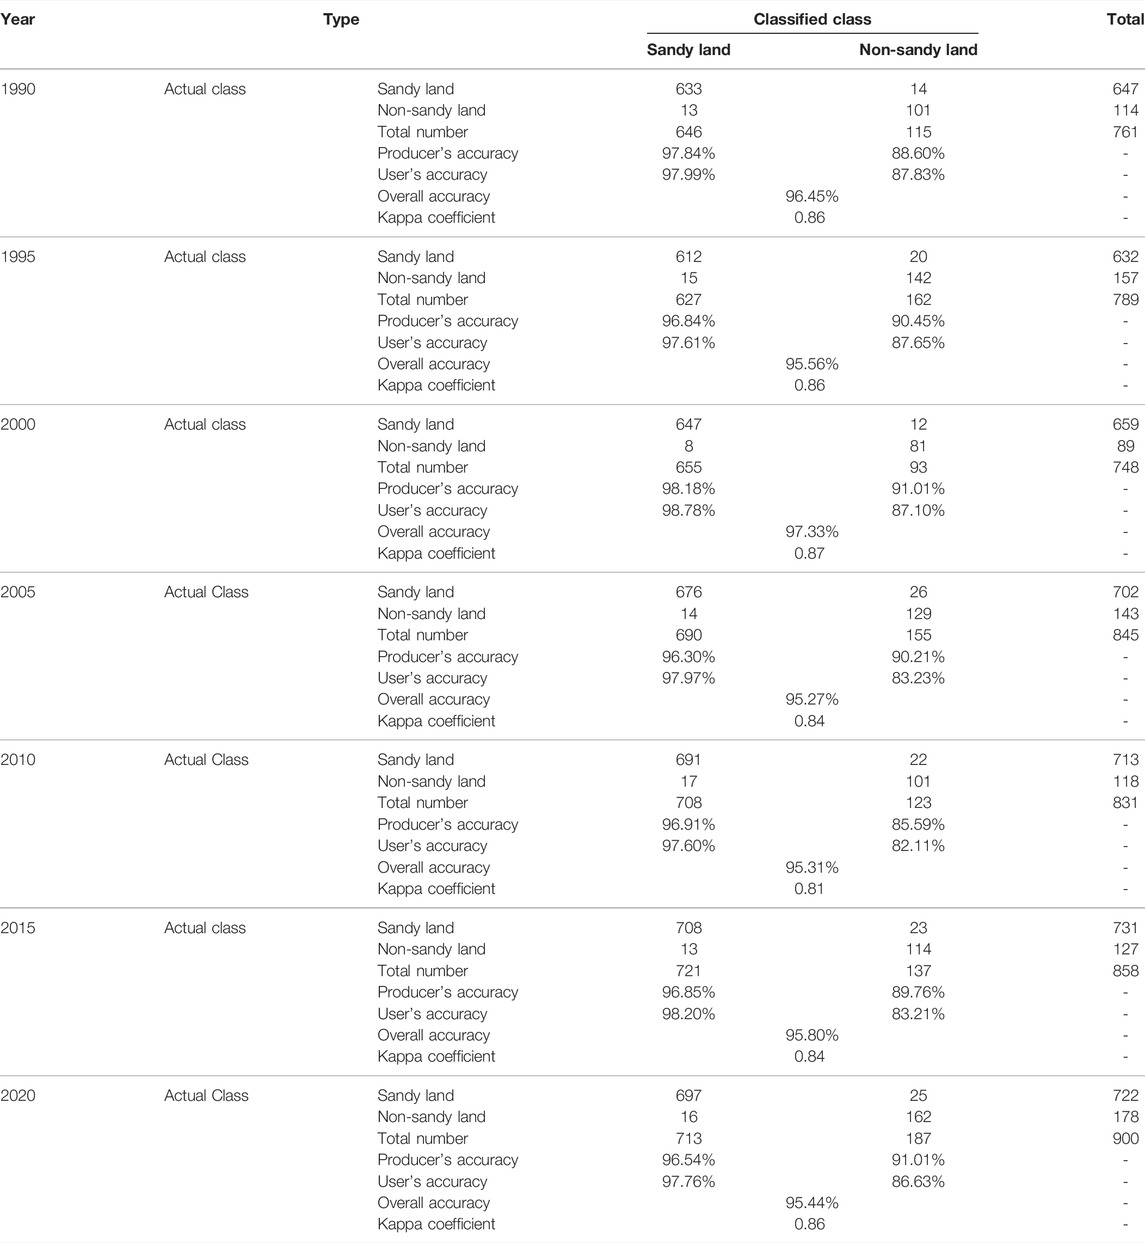
TABLE 2. Validation of the classification results in 1990–2020.
137Cs tracer technology was used to verify the soil–wind erosion modulus (Chi et al., 2019). This study involved the data of 36 sampling points. By comparing the verification points with the model inversion data, the value of R2 reached 0.88 (Figure 4).
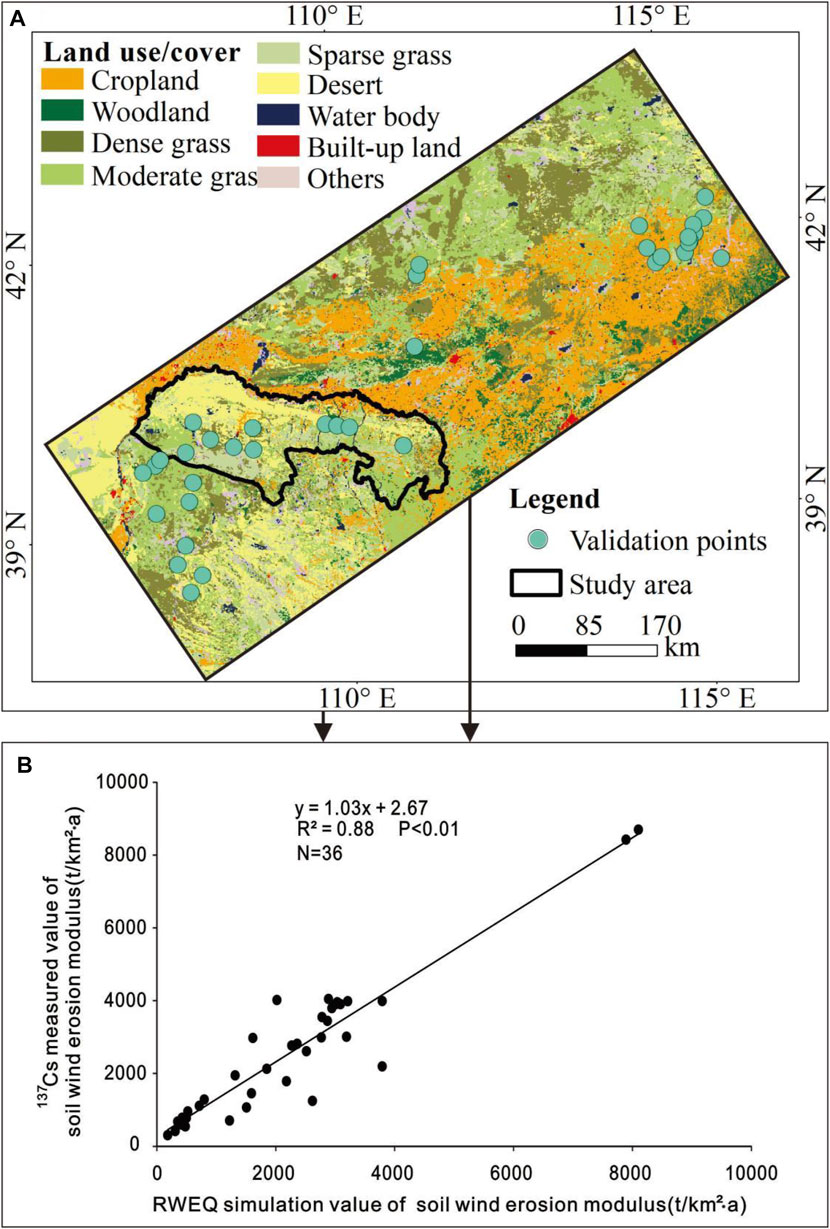
FIGURE 4. Field sampling verification of the soil–wind erosion modulus. (A): Distribution of field sampling verification points, (B): RWEQ simulation value of the soil–wind erosion modulus.
3.2 Spatial Distribution and Evolution of Sandy Land
Figure 5 and Table 3 indicate the regional mapping and area statistics of the Kubuqi Desert from 1990 to 2020, respectively. According to the remote sensing monitoring, the area of the Kubuqi Desert increased from 6,504.74 km2 in 1990–4,150.26 km2 in 2020, accounting for 11.99% of the total study area. The sandy land was distributed as a belt along the Yellow River, which in Hangjin Banner, was widely distributed, followed by Dalat Banner, and Jungar Banner in the East was less distributed. In terms of time, the area of the Kubuqi Desert first increased and then decreased, with the largest sandy area in 2000. In terms of space, the area around the Kubuqi Desert was constantly decreasing, and the expansion of mobile sand was scattered in the hinterland of the desert.
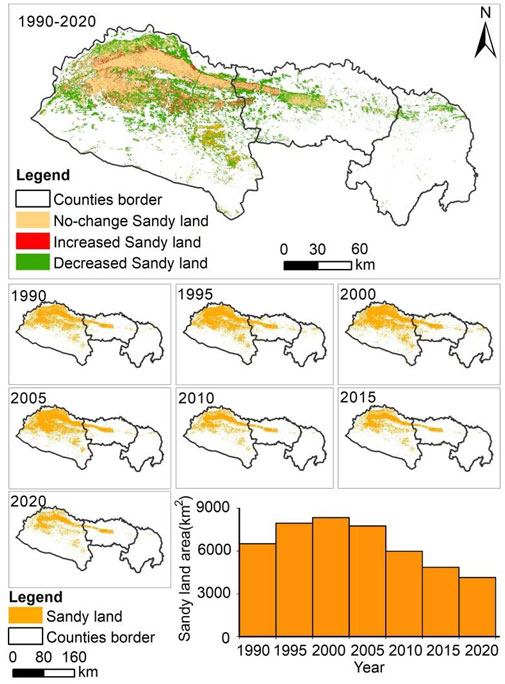
FIGURE 5. Spatio–temporal pattern of the Kubuqi Desert that evolved from 1990 to 2020.
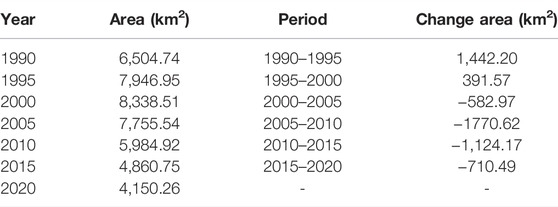
TABLE 3. Areas and changes in sandy land area between 1990 and 2020.
3.3 Spatio–temporal Characteristics of Soil–Wind Erosion
In the past 30 years, the soil–wind erosion modulus in the Kubuqi Desert has shown a downward trend as a whole. Especially since 2000, the ecological environment improvement has improved significantly after the implementation of the desertification control project (p < 0.01) (Figure 6). From 1990 to 2020, the average value of the soil–wind erosion modulus was 4,542 T/(km2·a) (Moderate). In general, the change of soil–wind erosion from 1990 to 2010 fluctuated greatly, and had been relatively stable since 2010. In 2000, the soil–wind erosion reached the peak, and the soil–wind erosion modulus was 12,703 T/(km2·a) (Very severe). The intensity of the soil–wind erosion reached the second peak in 2001 (11,728 T/(km2·a)). Figure 7 reflects the spatial distribution of soil–wind erosion in the Kubuqi Desert during the study period. Overall, the wind erosion intensity of Hangjin Banner located in the eastern hinterland of the Kubuqi Desert was the largest, Dalat Banner in the middle was the second, and Jungar Banner in the west was the lowest. Although the soil–wind erosion intensity in the Kubuqi Desert showed a decreasing trend as a whole, there were regional differences and a large spatial heterogeneity after the implementation of desertification control and ecological engineering construction, contributing to the improvement in vegetation coverage and the significant decrease in the soil–wind erosion modulus.
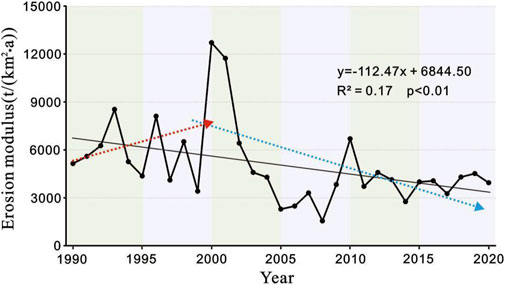
FIGURE 6. Long time-series of the soil–wind erosion modulus from 1990 to 2020.
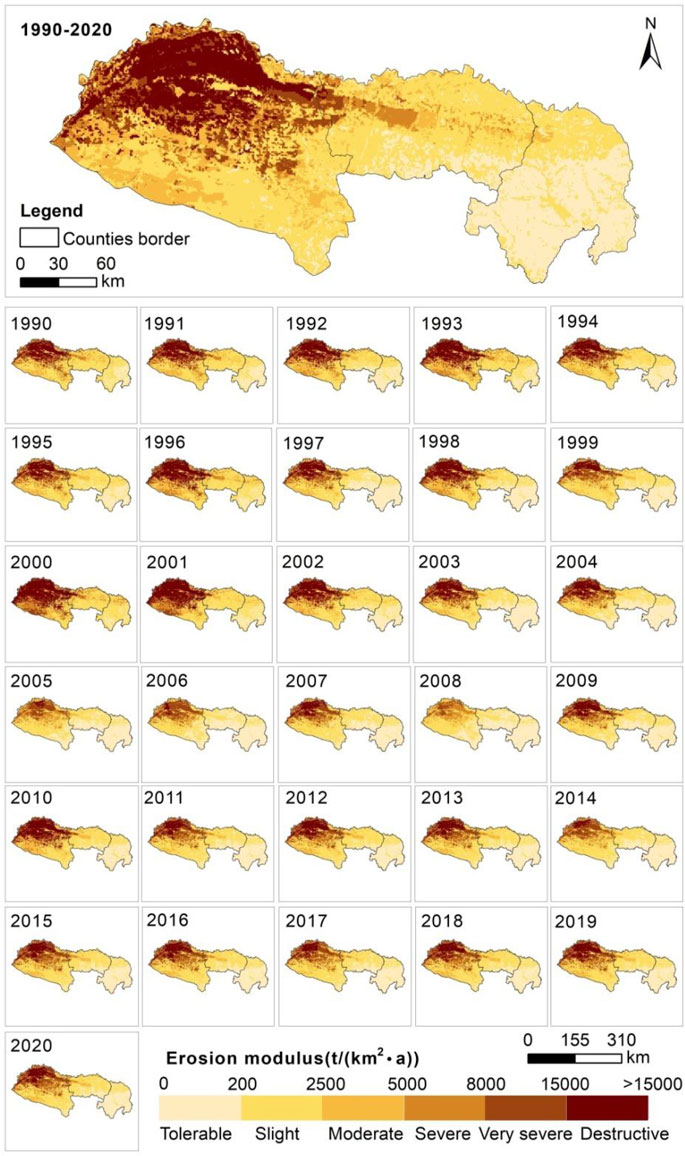
FIGURE 7. Spatial distributions of soil–wind erosion in the Kubuqi Desert region during 1990–2020.
3.4 Influence of Spatio–temporal Evolution of Sandy Land on Soil–Wind Erosion Intensity
Land use/cover change is an important factor for the formation and intensity of soil–wind erosion. In order to study the influence of different land use/cover types on soil–wind erosion intensity and analyze the differences of soil–wind erosion intensity (Zhang et al., 2018), this study counted the soil–wind erosion intensity of different land use/cover types in the Kubuqi Desert from 1990 to 2020 (Table 4). The results showed that the changes of sandy land contributed the most to the reduction of soil–wind erosion intensity (81.14%), the restoration of vegetation played a key role (14.42%), and the transformation of sandy lands into an agricultural oasis led to the reduction of soil–wind erosion (2.79%). The human–computer interactive interpretation (Liu et al., 2019) was used to extract the changes of sandy lands from 1990 to 2020 (Figure 3; Table 4). The area of sandy lands decreased by 2,354.48 km2. Among them, the area converted from sandy lands to vegetation (forestlands and grasslands) was the largest (2099.13 km2), accounting for 89.16% in the reduced area. The area converted from sandy lands to croplands was 148.57 km2, and from sandy lands to constructive lands was 85.64 km2. The conversion from sandy lands to forestlands and grasslands could effectively inhibit soil–wind erosion (contribution for 89.08%), and the increase of vegetation coverage could reduce soil–wind erosion as well. The conversion from sandy lands to croplands slowed down the soil–wind erosion by 0.85 million tons. According to the research on the typical area in the Kubuqi Desert (Table 4; Figure 8), the desertification control project effectively improved the vegetation coverage in the desert area, solidified the soil, and played a positive role in wind prevention and sand fixation.
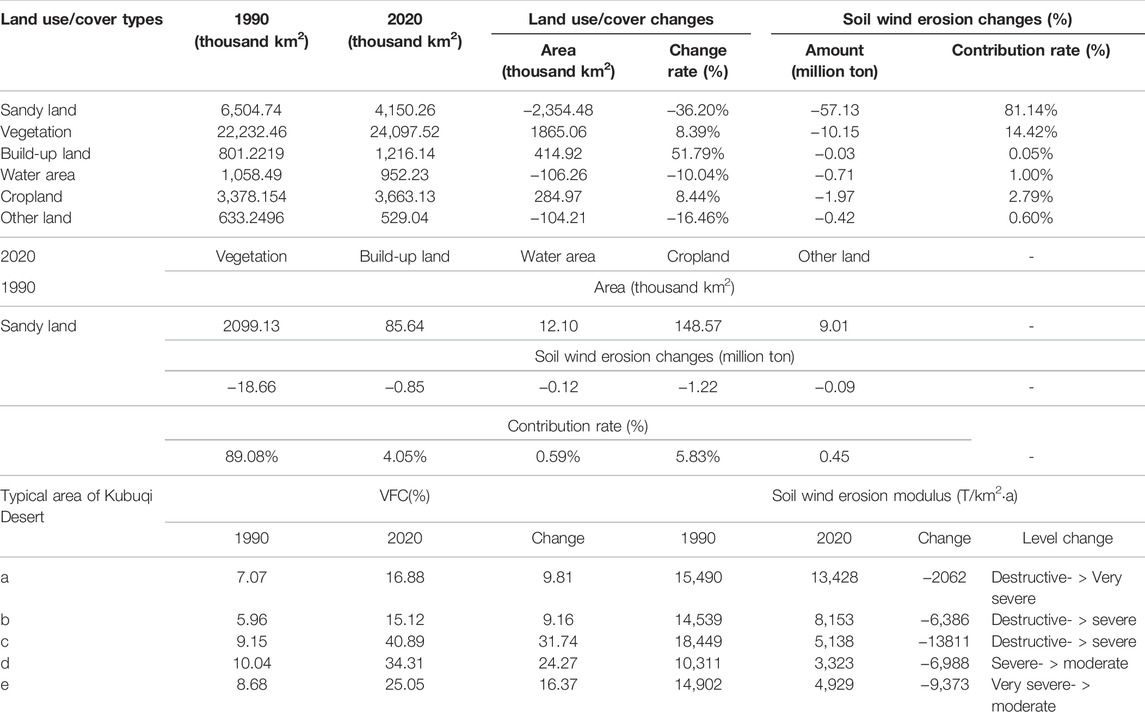
TABLE 4. Land use/cover changes in the Kubuqi Desert from 1990 to 2020.
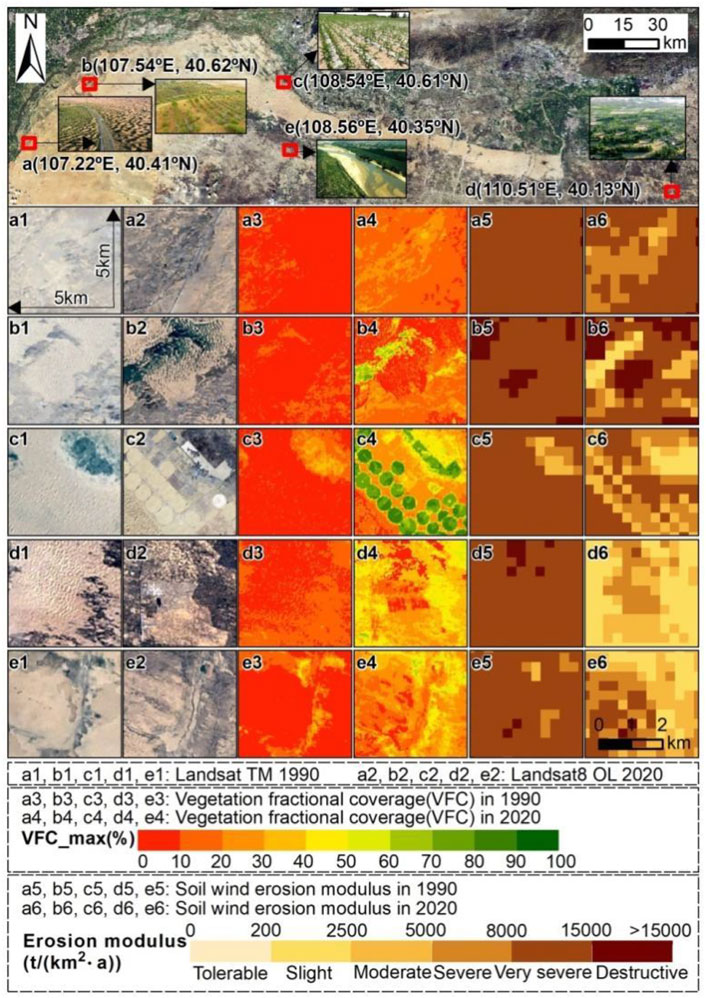
FIGURE 8. Schematic diagram of the vegetation cover and soil–wind erosion intensity in typical areas of sandy land change.
4 Discussion
4.1 Accuracy of Remote Sensing Classification
Desertification restricts regional sustainable development, so the quantitative study on sandy land is particularly important for desertification control and ecological construction and restoration (Liu and Dong, 1999). Based on Landsat satellite data, we sampled the sandy land classification and dynamic change mapping with object-oriented and human–machine interactive interpretation, and analyzed the spatio–temporal evolution of the Kubuqi Desert’s sandy lands from 1990 to 2020. Compared with previous studies (Lei et al., 2021; Lin et al., 2021), the collaboration of object-oriented classification (Zhan et al., 2021) and human–computer interactive interpretation (Zhang et al., 2014; Liu et al., 2009) effectively overcomes the problem of spectral similarity between sparse vegetation areas and sandy areas, and comprehensively extracts land use/cover information by using the spectral, spatial, and thematic features of remote sensing images. On the other hand, MODIS data sources with medium and low resolution are used in the monitoring of vegetation cover changes in desert areas (Piao et al., 2004; Feng et al., 2016; Zolch et al., 2018); however, the problem of regional scale-mixed pixels directly affects the accuracy of sandy land and vegetation cover monitoring. With the development of remote sensing technology, the adoption of medium- and high-resolution satellite data such as Landsat, Sentinel 1/2, GF1/2 series is becoming more and more mature in achieving high-precision and long time-series land use/cover information. Meanwhile, with the development of new information technology such as cloud computing, big data, and artificial intelligence, remote sensing information extraction technology is more efficient and accurate (Liu et al., 2019).
In the current study, sufficient sampling data and field survey data can effectively improve the accuracy in extracting sandy land changes. We have collected a large number of ground surveys and field quadrat data of different seasonal phases, which can effectively correct the heterogeneity of remote sensing spectra and thematic parameters in the classification (Chi et al., 2019). In addition, a lot of manpower is invested to deal with the position error caused by the sawtooth effect of the grating vector transformation, and the classification results are corrected by human–computer interaction. The overall accuracy of the method involved is more than 90%.
4.2 Sustainability of the Ecological Project
Desertification leads to ecological degradation, and land resources show a trend from structural damage to functional disorder. Ecological restoration and reconstruction has become a challenge for human survival and sustainable development (Li et al., 2011; Fu et al., 2017). In recent decades, a series of measures have been carried out in northern China to improve the ecological environment. The ecological engineering construction has played an important role in regional desertification control, vegetation restoration, and soil erosion control (Chi et al., 2019; Wang et al., 2019; Li et al., 2021), and has improved the main ecosystem services (Lv et al., 2012; Fu et al., 2017; Zhao et al., 2020). However, unreasonable ecological construction layout may threaten regional water resources (Feng et al., 2016), food security (Chen et al., 2015), and ecological sustainable development (Zastrow, 2019). Some scholars have found that changes in precipitation are not the driving force of vegetation greening in northern China, but rather, the construction of a national large-scale ecological engineering is the key factor in promoting the greening of desert lands. However, unreasonable vegetation restoration in arid regions may lead to catastrophic consequences (Chen et al., 2019; Wang et al., 2019).
According to the observational data of 8 meteorological stations in the Kubuqi Desert area (Figure 1), we found that the climate showed a warm and humid trend from 1990 to 2020 (Figure 9). Ecological engineering and climate conditions have contributed to the vegetation restoration in the Kubuqi Desert. Nevertheless, large-scale afforestation may lead to a dry layer on local soil and aggravate local water resource stress, especially in semi-arid areas sensitive to climate change (Li et al., 2021). As a result, it is necessary to further reveal the relationship between main ecological services and vegetation restoration on the basis of clarifying vegetation restoration, and to analyze the safety threshold of afforestation to satisfy vegetation growth and sustainable water use under the influence of climate changes and human activities (Wang et al., 2019; Li et al., 2021), especially the research on the non-linear response of an arid ecosystem to climate change and driving mechanism, in order to provide support for ecological restoration and sustainable development of resources and the environment.
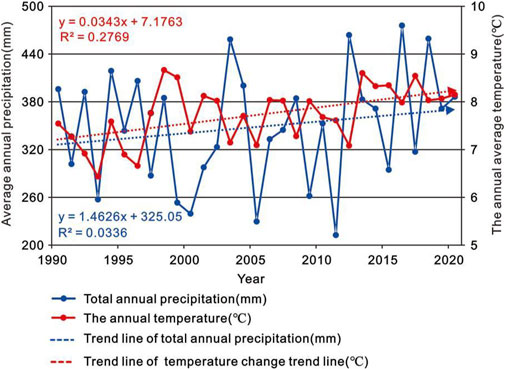
FIGURE 9. Variation trend of the temperature and precipitation in the Kubuqi Desert area from 1990 to 2020.
5 Conclusion
Based on Landsat remote sensing data and the RWEQ model, we obtained the information of land use cover change and soil–wind erosion intensity in the Kubuqi Desert from 1990 to 2020, and further analyzed the evolution of the Kubuqi Desert sand and its impact on soil–wind erosion intensity in the recent 30 years. According to the analysis of the spatio–temporal dynamic pattern of sandy land and soil–wind erosion intensity, the change of the Kubuqi Desert area was consistent with soil–wind erosion intensity, showing a trend of first increasing and then decreasing. Meanwhile, before 2000, the process of soil–wind erosion was more intense than that of ecological restoration. From 1990 to 2020, the area of sandy lands decreased by 2,354.48 km2, and since 2000, a series of desert control and ecological restoration projects have been implemented, and the area of sandy lands have decrease continuously. In addition, the transformation of sandy lands and the ecological restoration and improvement of vegetation coverage can effectively inhibit and slow down the intensity of soil–wind erosion. Among them, the transformation of sandy lands contributes the most (81.14%), and the reduction of forestlands, grasslands, and agricultural oases can effectively reduce soil–wind erosion. Overall, this study provides important information for understanding the desertification control and “Greening” process of sandy lands in this region. These findings will help improve the cognition of decision-makers, support the strategic decision-making of sustainable development of the ecosystem in the Kubuqi Desert, scientifically implement ecological protection and restoration projects, promote the comprehensive treatment projects of mountains, rivers, forests, fields, lakes, grass, and sand, build the virtuous cycle of the ecosystem, and promote the sustainable development of land resource utilization.
Data Availability Statement
The original contributions presented in the study are included in the article/Supplementary Material; further inquiries can be directed to the corresponding authors.
Author Contributions
XD: data curation and writing—original draft preparation. YN: supervision, investigation, and reviewing and editing. WC: supervision, investigation, and data curation, editing, and funding acquisition. JZ: reviewing and editing. YZ: conceptualization and validation. YW: software and methodology. XW: software and methodology. YW: date curation. All authors contributed to the article and approved the submitted version.
Funding
This research was supported by the National Natural Science Foundation of China “Research on the Greening process and its mechanism of regional ecosystem services in the Kubuqi Desert” (42061069), the science and technology innovation project of the department of natural resources of Inner Mongolia Autonomous Region “Research on the sustainable utilization and development of natural resources with the integration of space and space in Inner Mongolia Autonomous Region,” the key technology and application of ecological quality diagnosis and integrated management of “Beautiful Inner Mongolia” (2019GG010), the Research Foundation of Education Bureau of Inner Mongolia, China (NJYT-19-B29) and Inner Mongolia Autonomous Region talent development fund project in 2021.
Conflict of Interest
The authors declare that the research was conducted in the absence of any commercial or financial relationships that could be construed as a potential conflict of interest.
Publisher’s Note
All claims expressed in this article are solely those of the authors and do not necessarily represent those of their affiliated organizations, or those of the publisher, the editors, and the reviewers. Any product that may be evaluated in this article, or claim that may be made by its manufacturer, is not guaranteed or endorsed by the publisher.
References
Camara, G., Souza, R. C. M., Freitas, U. M., and Garrido, J. (1996). SPRING: Integrating Remote Sensing and GIS with Object-Oriented Data Modelling. Comput. Graph. 15, 13–22. doi:10.1016/0097-8493(96)00008-8
Chen, C., Park, T., Wang, X., Piao, S., Xu, B., Chaturvedi, R. K., et al. (2019). China and India Lead in Greening of the World through Land-Use Management. Nat. Sustain. 2, 122–129. doi:10.1038/s41893-019-0220-7
Chen, Y., Wang, K., Lin, Y., Shi, W., Song, Y., and He, X. (2015). Balancing Green and Grain Trade. Nat. Geosci. 8, 739–741. doi:10.1038/ngeo2544
Chi, W. F., Kuang, W. H., Jia, J., and Liu, Z. J. (2018). Study on Dynamic Remote Sensing Monitoring of LUCC and Soil Wind Erosion Intensity in the Beijing-Tianjin Sandstorm Source Control Project Region. Remote Sens. Technol. Appl. 33, 965–974. doi:10.11873/j.issn.1004-0323.2018.5.0965
Chi, W., Zhao, Y., Kuang, W., and He, H. (2019). Impacts of Anthropogenic Land Use/cover Changes on Soil Wind Erosion in China. Sci. Total Environ. 668, 204–215. doi:10.1016/j.scitotenv.2019.03.015
Ci, L. J., and Wu, B. (1997). Classification of Climate Types and Determination of Potential Occurrence Range of Desertification in China. J. Desert Res. 17, 107–112.
Congalton, R. G., and Green, K. (2009). Assessing the Accuracy of Remotely Sensed Data: Principles and Practices. Boca Raton: CRC Press.
Dong, T., Xiao, Y., Zhang, L., Xiao, Y., Zheng, H., and Ouyang, Z. Y. (2019). Analysis of Driving Factors that Influence the Pattern and Quality of the Ecosystem in Ordos. Acta Ecol. Sin. 39, 660–671. doi:10.5846/stxb201804080788
Feng, X., Fu, B., Piao, S., Wang, S., Ciais, P., Zeng, Z., et al. (2016). Revegetation in China's Loess Plateau Is Approaching Sustainable Water Resource Limits. Nat. Clim. Change 6, 1019–1022. doi:10.1038/nclimate3092
Fryrear, D. W., Chen, W., and Lester, C. (2001). Revised Wind Erosion Equation. Ann. Arid. Zone. 40, 265–279.
Fryrear, D. W., Saleh, A., Bilbro, J. D., Zobeck, T. M., and Stout, J. E. (1996). “Field Tested Wind Erosion Model,” in The Proceedings of the International Symposium “Wind Erosion in West Africa: The Problem and its Control”. Editors B. Buerkert, B. E. Alllison, and M. V. Oppen (Hohenheim, Germany: Margraf Verlag Press), 343–355.
Fu, B., Wang, S., Liu, Y., Liu, J., Liang, W., and Miao, C. (2017). Hydrogeomorphic Ecosystem Responses to Natural and Anthropogenic Changes in the Loess Plateau of China. Annu. Rev. Earth Planet. Sci. 45, 223–243. doi:10.1146/annurev-earth-063016-020552
Ge, Q. S., Fang, C. L., and Jiang, D. (2020). Geographical Missions and Coupling Ways between Human and Nature for the Beautiful China Initiative. Acta Geogr. Sin. 75, 1109–1119. doi:10.11821/dlxb202006001
Hamed, K. H., and Ramachandra Rao, A. (1998). A Modified Mann-Kendall Trend Test for Autocorrelated Data. J. Hydrology 204, 182–196. doi:10.1016/S0022-1694(97)00125-X
Jia, K., Wei, X., Gu, X., Yao, Y., Xie, X., and Li, B. (2014). Land Cover Classification Using Landsat 8 Operational Land Imager Data in Beijing, China. Geocarto Int. 29, 941–951. doi:10.1080/10106049.2014.894586
Koutroulis, A. G. (2019). Dryland Changes under Different Levels of Global Warming. Sci. Total Environ. 655, 482–511. doi:10.1016/j.scitotenv.2018.11.215
Kuncheva, L. I., and Jain, L. C. (1999). Nearest Neighbor Classifier: Simultaneous Editing and Feature Selection. Pattern Recognit. Lett. 20, 1149–1156. doi:10.1016/S0167-8655(99)00082-3
Lei, Y. H., Ding, G. D., Li, Z. M., Chi, W. F., Gao, G. L., and Zhao, Y. Y. (2021). Land Use/cover Change and its Ecosystem Service Value Response in the Beijing-Tianjin Sandstorm Source Control Project Area. J. Desert Res. 41, 29–40. doi:10.7522/j.issn.1000-694X.2021.00085
Li, C., Fu, B., Wang, S., Stringer, L. C., Wang, Y., Li, Z., et al. (2021). Drivers and Impacts of Changes in China's Drylands. Nat. Rev. Earth Environ. 2, 858–873. doi:10.1038/s43017-021-00226-z
Li, H., Kondoh, A., and Shen, Y. (2011). Interannual Changes in the Distribution of Paddy Field in Sanjiang Plain, Northeast China by Satellite Remote Sensing. J. Jpn. Soc. Hydrology Water Resour. 24, 328–336. doi:10.3178/jjshwr.24.328
Liang, P., Chen, B., Yang, X., Liu, Q., Li, A., Mackenzie, L., et al. (2022). Revealing the Dust Transport Processes of the 2021 Mega Dust Storm Event in Northern China. Sci. Bull. 67, 21–24. doi:10.1016/j.scib.2021.08.014
Lin, L. Z., Chen, Y. S., Ma, W. Z., Lin, Z., and Yu, Q. (2021). Evolution and Driving Forces of Ecosystem Pattern in Kubuqi Desert of Northern China. J. B. For. Univ. 43, 108–123. doi:10.12171/j.1000-1522.20200242
Lin, L. Z., Li, D., and Lin, Z. (2020). Evaluation of Water Resources Carrying Capacity in Kubuqi Desert Area Based on Entropy Weight and TOPSIS Model. J. Cent. Chin. Norm. Univ. Nat. Sci. Ed. 54, 640–648. doi:10.19603/j.cnki.1000-1190.2020.04.015
Liu, J., and Deng, X. (2010). Progress of the Research Methodologies on the Temporal and Spatial Process of LUCC. Chin. Sci. Bull. 55, 1354–1362. doi:10.1007/s11434-009-0733-y
Liu, J. Y., Zhang, Z. X., and Zhang, S. W. (2020). Innovation and Development of Remote Sensing-Based Land Use Change Studies Based on Shupeng Chen's Academic Thoughts. J. Geo-inf. Sci. 22, 680–687. doi:10.12082/dqxxkx.2020.200052
Liu, X., Pei, F., Wen, Y., Li, X., Wang, S., Wu, C., et al. (2019). Global Urban Expansion Offsets Climate-Driven Increases in Terrestrial Net Primary Productivity. Nat. Commun. 10, 5558. doi:10.1038/s41467-019-13462-1
Liu, Y. H., and Dong, Y. X. (1999). Tentative Study on Desertification and Sustainable Development in China. J. Desert Res. 19, 17–22.
Lü, Y., Fu, B., Feng, X., Zeng, Y., Liu, Y., Chang, R., et al. (2012). A Policy-Driven Large Scale Ecological Restoration: Quantifying Ecosystem Services Changes in the Loess Plateau of China. PLoS One 7, e31782. doi:10.1371/journal.pone.0031782
Ma, Y. J., Wang, Z. M., Wang, J. H., Zuo, X. A., Duan, H. T., Liu, G., et al. (2020). Construction of Evaluation Index System on Beautiful China in Typical Areas. Remote Sens. Technol. Appl. 35, 287–294. doi:10.11873/j.issn.1004-0323.2020.2.0287
Meng, J. J., Yan, Q., and Xiang, Y. Y. (2014). The Optimization of Ecological Security Pattern Based on Land Use and Assessment of Schemes in Ordos, Inner Mongolia, China. J. Desert Res. 34, 590–596. doi:10.7522/j.issn.1000-694X.2013.00352
Ouyang, Z. Y., Xu, W. H., and Xiao, Y. (2016). Ecosystem Patterns, Quality, Services, and Evolution in China. Beijing: Science Press.
Piao, S., Fang, J., Ji, W., Guo, Q., Ke, J., and Tao, S. (2004). Variation in a Satellite-Based Vegetation Index in Relation to Climate in China. J. Veg. Sci. 15, 219. doi:10.1658/1100-9233(2004)015[0219:viasvi]2.0.co;2
Prăvălie, R. (2016). Drylands Extent and Environmental Issues. A Global Approach. Earth-Science Rev. 161, 259–278. doi:10.1016/j.earscirev.2016.08.003
Schimel, D. S. (2010). Drylands in the Earth System. Science 327, 418–419. doi:10.1126/science.1184946
Shen, B., Fang, S., and Li, G. (2014). Vegetation Coverage Changes and Their Response to Meteorological Variables from 2000 to 2009 in Naqu, Tibet, China. Can. J. Remote Sens. 40, 67–74. doi:10.1080/07038992.2014.917580
Takemura, T., Nakajima, T., Dubovik, O., Holben, B. N., and Kinne, S. (2002). Single-Scattering Albedo and Radiative Forcing of Various Aerosol Species with a Global Three-Dimensional Model. J. Clim. 15, 333–352. doi:10.1175/1520-0442(2002)015<0333:ssaarf>2.0.co;2
Uno, I., Wang, Z., Chiba, M., Chun, Y. S., Gong, S. L., Hara, Y., et al. (2006). Dust Model Intercomparison (DMIP) Study over Asia: Overview. J. Geophys. Res. 111, 212–213. doi:10.1029/2005JD006575
Wang, F., Pan, X. B., Gerlein‐Safdi, C., Cao, X., Wang, S., Gu, L., et al. (2019). Vegetation Restoration in Northern China: A Contrasted Picture. Land Degrad. Dev. 4, 15. doi:10.1002/ldr.3314
Wang, L., Huang, J., Du, Y., Hu, Y., and Han, P. (2013). Dynamic Assessment of Soil Erosion Risk Using Landsat TM and HJ Satellite Data in Danjiangkou Reservoir Area, China. Remote Sens. 5, 3826–3848. doi:10.3390/rs5083826
Wang, T. (2003). Desert and Desertification in China. Shijiazhuang: Hebei Science and Technology Press.
Wang, X., Chen, F., Hasi, E., and Li, J. (2008). Desertification in China: An Assessment. Earth-Science Rev. 88, 188–206. doi:10.1016/j.earscirev.2008.02.001
Wang, Z. Y. (2017). China Plan ” for Combating Desertification in the World: Analysis of Kubuqi Model (I). North. Econ. 12, 4–7.
World Economic Forum (2020). The Global Risks Report 2020. Availabe at: https://www3.weforum.org/docs/WEF_Global_Risk_Report_2020.pdf January 15, 2020).
Zastrow, M. (2019). China's Tree-Planting Drive Could Falter in a Warming World. Nature 573, 474–475. doi:10.1038/d41586-019-02789-w
Zhan, Q., Zhao, W., Yang, M., and Xiong, D. (2021). A Long-Term Record (1995-2019) of the Dynamics of Land Desertification in the Middle Reaches of Yarlung Zangbo River Basin Derived from Landsat Data. Geogr. Sustain. 2, 12–21. doi:10.1016/j.geosus.2021.01.002
Zhang, H., Fan, J., Cao, W., Harris, W., Li, Y., Chi, W., et al. (2018). Response of Wind Erosion Dynamics to Climate Change and Human Activity in Inner Mongolia, China during 1990 to 2015. Sci. Total Environ. 639, 1038–1050. doi:10.1016/j.scitotenv.2018.05.082
Zhang, Z., Wang, X., Zhao, X., Liu, B., Yi, L., Zuo, L., et al. (2014). A 2010 Update of National Land Use/Cover Database of China at 1:100000 Scale Using Medium Spatial Resolution Satellite Images. Remote Sens. Environ. 149, 142–154. doi:10.1016/j.rse.2014.04.004
Zhao, M. M., Zhou, L. H., and Wang, S. Y. (2017). Effects of Ecological Policies on Land Use Types and Ecosystem Service Values in Hobq Desert. Res. Soil Water Conserv. 24, 252–258. doi:10.13869/j.cnki.rswc.2017.02.041
Zhao, Y., Chi, W., Kuang, W., Bao, Y., and Ding, G. (2020). Ecological and Environmental Consequences of Ecological Projects in the Beijing-Tianjin Sand Source Region. Ecol. Indic. 112, 106111. doi:10.1016/j.ecolind.2020.106111
Keywords: sandy land change, soil wind erosion, spatio-temporal evolution, remote sensing, Kubuqi Desert
Citation: Dang X, Na Y, Chi W, Zhao J, Zhao Y, Wang Y, Wu X and Wang Y (2022) Spatio-Temporal Evolution of Sandy Land and its Impact on Soil Wind Erosion in the Kubuqi Desert in Recent 30 Years. Front. Environ. Sci. 10:950196. doi: 10.3389/fenvs.2022.950196
Received: 22 May 2022; Accepted: 10 June 2022;
Published: 11 July 2022.
Edited by:
Shengbo Xie, Northwest Institute of Eco-Environment and Resources (CAS), ChinaReviewed by:
Bojie Wang, Inner Mongolia University, ChinaYongfang Wang, Inner Mongolia Normal University, China
Copyright © 2022 Dang, Na, Chi, Zhao, Zhao, Wang, Wu and Wang. This is an open-access article distributed under the terms of the Creative Commons Attribution License (CC BY). The use, distribution or reproduction in other forums is permitted, provided the original author(s) and the copyright owner(s) are credited and that the original publication in this journal is cited, in accordance with accepted academic practice. No use, distribution or reproduction is permitted which does not comply with these terms.
*Correspondence: Ya Na, bmF5YUBpbWF1LmVkdS5jbg==; Wenfeng Chi, Y3dmQGltdWZlLmVkdS5jbg==