 Vishnu Kumar
 Mudit Yadav
 Sailesh N. Behera
- 1Air Quality Laboratory, Department of Civil Engineering, Shiv Nadar University, Greater Noida, Uttar Pradesh, India
- 2Centre for Environmental Sciences and Engineering, Shiv Nadar University, Greater Noida, Uttar Pradesh, India
To examine the trends of particulate matter with aerodynamic diameter ≤2.5 µm (PM2.5) and its elemental constituents during two distinct seasons at a site away from the city center of Delhi and the National Capital Region (Delhi-NCR) of India, this unique study aimed at the development of source-receptor-effect linkages. This research paper presents results of occurrence, long-range transport (LRT), source apportionment, and human health impact assessment of 24 PM2.5-bound trace elements (Al, Ba, Bi, Ca, Cd, Co, Cr, Cu, Fe, Ga, K, Li, Mg, Mn, Na, Ni, Pb, S, Se, Si, Te, Tl, Zn, and Zr). The concentration of PM2.5 during winter (296 ± 45 μg/m3) was significantly higher than in summer (114 ± 48 μg/m3) and exceeded 24 h Indian standard on most of the measurement days. The seasonal concentration ratios (winter/summer) of individual elements varied from 1.7 (Si) to 5.9 (Tl). The backward trajectory of air masses showed that transboundary transport of pollutants occurred in the downwind direction during winter, indicating that this remote site was affected by transported particulates and local activities. The principal component analysis–absolute principal component score (PCA-APCS) model confirmed five significant sources, vehicles (22.3%), soil/road dust (23.1%), coal combustion (20.9%), open burning (13.8%), and other industries (10.2%) responsible for particulate emission. The results from the multiple path particle dosimetry model (MPPD) showed higher deposition of particulates in the human respiratory system occurred during winter (44%) than in summer (40%). The elements with crustal sources of origin had a higher deposition fraction in the head region (0.27 for Si) compared to elements of anthropogenic sources (0.13 for Li). The excess lifetime carcinogenic risk (ELCR) under winter episodic events increased significantly at 128 × 10−6 compared to the summer non-episodic period at 41 × 10−6.
1 Introduction
The national capital of India, Delhi, and its surrounding major cities, including Noida, Greater Noida, Ghaziabad, Gurugram, and Faridabad (known as the National Capital Region: NCR), are facing severe air pollution problems because of the fast growth in urban set-ups, industries, vehicles, and other emission activities (Jain et al., 2020; Kumar et al., 2021). The recurrence of air pollution episodic events during winter in the Delhi-NCR region is increasing with the observation of more hazy days in this fast-growing economic corridor of India (Arunkumar and Dhanakumar, 2021). The less atmospheric visibility days also occur during summer, indicating that summer and winter are two critical seasons from an air pollution point of view (Hama et al., 2020; Sharma et al., 2022a). Deterioration of air quality makes this region one of the worst air quality regions in the world, and much higher levels of pollutants cause several effects on the environment, human health, and climate change (Guttikunda and Goel, 2013; Yadav et al., 2022). Among the criteria of air pollutants, PM2.5 (particulate matter with aerodynamic diameter ≤2.5 µm) is considered a unique pollutant because of its importance for research and regulatory purposes (Wang et al., 2021).
Moreover, many urbanized areas in India are also facing the same problems of PM2.5 pollution these days, which are associated with severe episodic hazy events (Manisalidis et al., 2020; Ravindra et al., 2021). The concentration of PM2.5 in Indian cities with exceedance of 24 h Indian standard by multiple times has been a matter of concern due to the presence of elevated levels of toxic inbuilt constituents for a prolonged period (Behera and Sharma, 2015; Chen et al., 2020). The elemental constituents of PM2.5, are unique due to their chemical toxicity, which causes several health issues through multiple pathways of inhalation, ingestion, and dermal contact exposures in human bodies (Zhang et al., 2018; Ambade and Sethi, 2021). The trace elements are used as tracers in source identification and apportionment through mathematical and computational approaches to find contributions of individual sources to PM2.5.
Notably, the deposition and inhalability rate of fine particles are higher than coarse particles in the deeper part of the respiratory tract of the human body (Manojkumar et al., 2019; Can-Terzi et al., 2021). Studies revealed that short- and long-term exposures to trace elements can induce acute and chronic health impacts (Long et al., 2021). For example, trace elements such as Al, Bi, Cd, Co, Cr, Cu, Fe, Ni, Pb, Se, Zn, and Zr can create severe harmful health effects in the human body through their exposure on a short- and long-term basis. From the literature mentioned earlier, the extent of severity of human health implications depends on multiple factors that include the inherent toxicity of elements, concentrations of elements, total time of exposure, duration per day of exposure, and place of exposure. Elements have the potential in catalyzing the formation of reactive oxygen species (ROS) (Guo et al., 2020). These ROS components lead to oxidative stress that is capable enough to produce and discharge inflammatory mediators by the respiratory tract epithelium (Liu et al., 2022).
In strategizing control policies to implement for reduction of levels of PM2.5 in maintaining air quality standards, various source apportionment models are applied using concentrations of trace elements. These models include positive matrix factorization (PMF), chemical mass balance (CMB), Unmix, multilinear engine (ME), principal component analysis–absolute principal component scores (PCA-APCS), and constrained physical receptor model (COPREM) (Gawhane et al., 2017; Hama et al., 2020; Jain et al., 2021; Ambade et al., 2022). These receptor models work on the basic assumption that mass conservation of individual tracer elements with respect to their total emissions happens during movement from the source to ambient air. Researchers mostly use PMF, CMB, and PCA-APCS approaches for source apportionment through concentrations of trace elements. The models of PCA-APCS and PMF are based on experimental results of concentrations of trace elements, whereas the CMB model is applied when both source profiles and ambient concentrations are available (Jain et al., 2017; Tseng et al., 2021). Because of the unavailability of source profiles of trace elements for a particular study location, PMF and PCA-APCS models are becoming more familiar among researchers in the apportionment of responsible sources (Wu et al., 2019).
Although several studies (Sharma et al., 2016; Jain et al., 2017; Sharma and Mandal, 2017; Bangar et al., 2021; Jain et al., 2021; Kaushik et al., 2021) have reported on the occurrence of trace elements and source apportionment of fine particles in Delhi and other Indian cities, their associated human health implications are not completely understood and are sparse in the literature. Moreover, studies providing insights into the occurrence of chemical constituents of PM2.5 and finding source contributions at a place away from the city center in the Delhi-NCR region are lacking in the literature. To address these research issues, this study is a first of its kind that was conducted in Greater Noida, Delhi-NCR region, during summer and winter months. The specific objectives of this study are enumerated as follows: 1) conducting a comprehensive measurement campaign to collect PM2.5 samples; 2) quantification of 24 trace elements (Al, Ba, Bi, Ca, Cd, Co, Cr, Cu, Fe, Ga, K, Li, Mg, Mn, Na, Ni, Pb, S, Se, Si, Te, Tl, Zn, and Zr) in PM2.5 using advanced instrumentation with energy-dispersive x-ray fluorescence (ED-XRF); 3) conducting an assessment on qualitative source identification and apportionment of responsible sources of PM2.5 using the PCA-APCS model; 4) assessment of deposition of PM2.5 and trace elements in the human respiratory system using multiple path particle dosimetry (MPPD) model; and 5) conducting risk assessment analysis to estimate carcinogenic and non-carcinogenic health effects.
2 Materials and methods
2.1 Description of study domain and sampling site
The ambient PM2.5 measurement campaign was conducted at Greater Noida (Delhi-NCR region) site, located away from the city center. The area close to the measurement site was having less commercial and business activities compared to various locations in the city center. The sampling site was confined on the rooftop of one building of Shiv Nadar University, Delhi-NCR, at Greater Noida. This site was close to the set-up of a sampling laboratory. Figure 1 shows the geographic location of the Delhi-NCR region on the map of India, Greater Noida (ArcGIS 10.8.1), and the sampling site (Google map) and photograph of the sampler used during the measurement campaign. Greater Noida (28.47°N, 77.48°E, and 201 m above mean sea level) is a fast-growing city in the Delhi-NCR region and has an administrative area of about 400 km2 and a population of more than nine lakh.
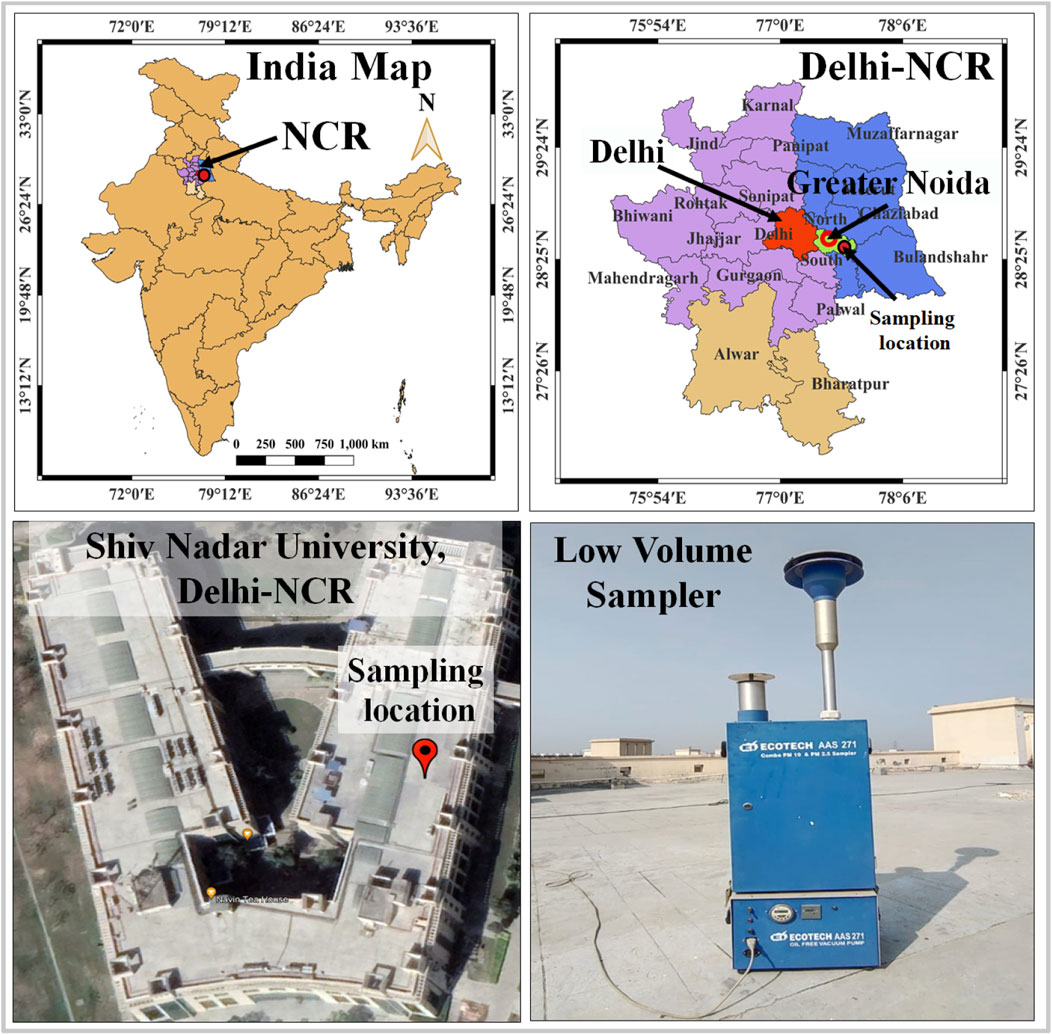
FIGURE 1. Geographic location of Delhi-NCR on the map of India, Greater Noida on the map of India, and Delhi-NCR, location of the sampling site and photograph of the sampler at the sampling site.
This particular city has many responsible sources of particulate pollution that include vehicles of various categories, small-scale industries, large-scale industries, commercial zones having hotels and restaurants, road/soil dust, construction and demolition activities, domestic cooking, open burning of agricultural residues, and street garbage (Gautam et al., 2021). This city is a planned city and is close to Delhi, Noida, and Ghaziabad. The urban establishments, industrial development, and vehicle population are increasing at high rates, causing a proportional rise in particulate pollution (Goel and Guttikunda, 2015). Additionally, LRT of PM from higher emission areas of Delhi and other nearby cities and agricultural residue burning in Punjab and Haryana bring polluted air masses to this city (Mishra et al., 2015). Dust storm events and LRT of dust from the deserts of Rajasthan add to local particulate pollution in the study domain during summer (Sharma et al., 2014). Biomass burning from agricultural residues takes place during summer and winter, and street garbage burning occurs during winter in the study domain and nearby areas (Rajput et al., 2014; Nagar et al., 2019).
Although the sampling site location comes under remote areas, the abovementioned pollution activities and LRT of particulates and foggy conditions during winter cause deterioration in air quality, resulting in the formation of intense haze that reduces atmospheric visibility in this region (Gautam et al., 2021). It is noteworthy that the average meteorological factors and climatic conditions of the study domain and sampling site are similar to Delhi (Goel and Guttikunda, 2015). More information about the study domain and sampling site are provided in the Supplementary Information.
2.2 Particulate sample collection and measurement
To achieve the aforementioned objectives of this study, PM2.5 sampling was conducted from April to June 2019 during summer and from November 2019 to January 2020 during winter. The samples were collected using a low volume sampler (Model: Combo PM10 and PM2.5, AAS-271, Ecotech Instruments, India) at a flow rate of about 16.7 L per minute (LPM), which was designed to separate ambient particles with aerodynamic diameter >2.5 µm through inbuilt inlet fit in the sampler. We used Micro-Orifice Uniform Deposit Impactor (MOUDI) (110R, MSP Corp, United States) to collect filter samples of PM of ten different sizes having aerodynamic diameters ranging from 0.056 to 18 µm. A quartz filter of 47-mm diameter of Whatman QM-A grade was used for the collection of PM during sampling. The results of PM mass and elemental characterization from filter samples generated from the MOUDI impactor were utilized to estimate the mass median aerodynamic diameter (MMAD) and geometric standard deviation (GSD), which were used in MPPD modeling. To remove residual organic matter from quartz filters, these specimens, prior to sampling, were subjected to heating at 600°C in a muffle furnace for a duration of 9 h (Behera and Sharma, 2015). The weighing of blank and sampled filters was performed using a microbalance with a readable least count of 1 µg (Sartorius, MSA6.6S-000-DF Germany). Pre- and post-sampled filter samples were equilibrated in an airtight desiccator (Tarson Secador Cabinet, India) for 24 h containing silica-gel at RH of 35–45% and temperature at 25°C to remove moisture absorbed in filters and to maintain well-conditioned filter samples.
To eliminate biases during filter handling and PM sampling meant for gravimetric analysis, an adequate number of laboratory and field blank filters were kept. Those blank filter samples were used in conducting quality control (QC) assessment during the chemical analysis of PM2.5-bound elements (USEPA, 1998; Yadav et al., 2020). Additional information about sampling methodology are provided in the Supplementary Information. The 24 h PM mass concentration (µg/m3) was determined considering the final weight of particulates (gravimetric mass) collected on filter paper (µg) and the total volume of air passed through a filter (m3) during sampling using Eq. 1, as:
2.3 Analysis of trace elements
The sampled particulate filters were subjected to analysis using an ED-XRF spectrometer (PANalytical Epsilon 5 analyzer) in the determination of trace elements in PM2.5 through its non-destructive mechanism that provided analytical data in quantitative elemental concentration quickly (Hazarika et al., 2015). In this study, 24 trace elements, namely, Al, Ba, Bi, Ca, Cd, Co, Cr, Cu, Fe, Ga, K, Li, Mg, Mn, Na, Ni, Pb, S, Se, Si, Te, Tl, Zn, and Zr were characterized and quantified using ED-XRF. More detailed information about the method of analysis and quality assurance and quality control (QA-QC) is provided in the Supplementary Information.
2.4 Backward trajectory analysis of air masses
The Hybrid Single-Particle Lagrangian Integrated Trajectory (HYSPLIT) model was used (Draxler and Rolph, 2003), and Trajstat software trajectory was utilized in developing profiles of air masses in all possible paths to the sampling site. In the simulation process to find backward trajectories, we used archived data (daily 1°, global) of meteorological files of the Global Data Assimilation System (GDAS) of the National Oceanic and Atmospheric Administration (NOAA). The time of termination at the sampling site in the simulation process was considered as 14:00 h (UTC) with path heights at 500, 1,000 and 1,500 m above ground level (AGL) for a run duration of 120 h (5 days) of back time during the measurement days (Tiwari et al., 2012; Amnuaylojaroen et al., 2020). Additional and detailed information on backward trajectory analysis is provided in the Supplementary Information.
2.5 Source identification of trace elements
To identify the source of origin of elements, either from natural (crustal) origin or non-crustal (anthropogenic) sources, the enrichment factor (EF) of individual elements was calculated using the expression provided in Eq. 2 (Dubey et al., 2012; Kulshrestha et al., 2014; Boreddy et al., 2021).
where Cx,aerosol represents the concentration of element x in PM2.5 (aerosol) sample, CAl,aerosol represents the concentration of Al in PM2.5 (aerosol) sample, Cx,crust represents the concentration of element x in crustal soil, and CAl,crust represents the concentration of Al in crustal soil.
Al was considered the reference element for both aerosol and crustal samples due to its stability and resistance to contamination (Clements et al., 2014). For the concentration of elements in aerosol samples, we used concentration levels of our results during summer and winter, whereas, for the concentration of elements in crustal samples, we used the values from relevant literature (Balasubramanian and Qian, 2004). Additional information about the source identification is provided in the Supplementary Information.
2.6 Source apportionment of PM2.5 concentrations
We used the PCA-APCS approach to apportion source contribution from related sources to PM2.5 concentrations using measured concentrations of 24 elements during summer and winter. In this modeling exercise, the PCA method with orthogonal transformation having Varimax rotation was applied for each day of observation of PM2.5 concentration. Before statistical evaluation at the first stage of PCA, elemental concentrations were characterized and transformed into a standardized dimensionless form. The average value and corresponding standard deviation are used in this normalization process, and the expression is provided as follows:
where i = 1, … , n samples; j = 1, … , m elements. Cij represents the concentration of element j in sample i,
where k = 1, … , p sources, gik represents factor loadings, and hkj represents factor scores. The abovestated equation has been solved using the Eigenvector decomposition method (Song et al., 2006; Mondal and Singh, 2021).
Specific profiles of sources and their contributions are successively predicted quantitatively based on factor loading scores produced by PCA and using the APCS method (Henry and Hidy, 1979; Thurston and Spengler, 1985). As the database of PCA results is normalized, the true zero for each factor score was estimated using the following expression:
In this exercise, APCS are considered directly from the re-scale scores, and, in the end, linear regression is applied to find source contribution, expressed as follows:
where Mi represents measured mass concentrations in sample i, and ζ0 represents mass contribution provided by sources unaccounted for in PCA. APCSki represents the rotated absolute component score of source k in sample i. ζkAPCSki represents mass contribution in sample i provided by source k. The regression between Cij and ζkAPCSki also provides the details of source profiles. The source profiles and respective mass contributions were used to estimate source contributions to individual elements. More information about source apportionment modeling is provided in the Supplementary Information.
2.7 Deposition of PM2.5 and elements in the human respiratory system
To get insights into the health impacts of PM2.5 and its elemental constituents with respect to the deposition efficiency of these species in different parts of the human respiratory system, we used MPPD model version 2.11 (Applied Research Associates Inc., Raleigh, NC). Four primary inputs (airway morphometry, particle properties, exposure conditions, and clearance rate) are required for the model simulation process in the MPPD model to predict health impact parameters (Laiman et al., 2022). The outcome of the modeling exercise is represented in deposition fraction, which is defined as the fraction of inhaled particulate species that can be deposited in the head airways (HA), trachea and bronchial (TB), and pulmonary alveolar (PA) regions of the human respiratory tract (Zwozdziak et al., 2017; Rajput et al., 2019).
In this study, the simulation was conducted using experimental results of PM2.5 mass, size-segregated PM mass, and their elemental compositions to estimate deposition fractions in HA, TB, and PA regions during summer and winter. The primary input parameters, including MMAD and GSD, were estimated using actual experimental results of PM mass and elemental compositions of different sizes obtained from filter samples of MOUDI impactor and applying a log-probit method (O’Shaughnessy and Raabe, 2003; Behera et al., 2015b). Additional detailed descriptions of the model and inputs parameter are provided in the Supplementary Information.
2.8 Cancer and non-cancer human health risk assessments
The experimental results from this measurement campaign were used in human health risk assessment exercises. The following numerical expression from Eqs 6–13 were used to estimate human health risks in terms of ELCR and HQ. The concentrations of elements entering the human respiratory tract were considered for health risk assessment analysis (Volckens and Leith, 2003; Volckens and Leith, 2011).
For the first scenario in conducting human health risks during summer, it was assumed that there could not be the occurrence of any episodic periods in this scenario, and the composite average concentration of each of the elements was found based on the following assumptions: 1) elemental concentration observed during summer would be the same for 120 days in a year, 2) elemental concentration during monsoon would be 0.5 times of summer concentration for 60 days in a year, and 3) remaining period (185 days) of a year would produce elemental concentration same as post-monsoon, which can be 2 times of monsoon concentration.
Under the scenario meant for estimation of health risks during winter episodic period, the assumptions in getting composite average concentration for the whole year of each of the elements were as follows: 1) elemental concentration observed during winter would be the same for 120 days in a year, 2) elemental concentration observed during summer would be the same for 120 days in a year, 3) elemental concentration during monsoon would be 0.5 times of summer concentration for 60 days in a year, and 4) elemental concentration during post-monsoon would be 2 times of monsoon concentration for 65 days in a year.
The following empirical expressions were used in performing associated human health risk assessment:
where E represents deposition fraction of any size of PM, and dp represents aerodynamic diameter of a particle in µm. EC represents exposure concentration in mg/m3, and Ca represents ambient concentration in mg/m3. ET represents exposure time in h/day (assumed as 24 h/day), EF is exposure frequency in (day/year), and ED represents the exposure duration in years (assumed as 70 years). ADAF represents the age-dependent adjustment factor (assumed as 1), and AT represents averaging time, which was assumed as a lifetime in years × 365 days/year × 24 h/day. TD represents total particle deposition into the respiratory tract system in mg/m3. CDI represents chronic daily intake in mg/kg/day, IR represents inhalation rate in m3/day (assumed as 20 m3/day), and BW represents body weight in kg (assumed as 70 kg). RfD represents reference dose of toxic element in mg/kg/d, and RfC represents the reference concentrations in mg/m3, and the values were considered from the relevant database. SF represents inhalation slope factors in kg. day/mg. IUR represents inhalation unit risk in m3/mg, and the values were considered from the relevant database. ELCR represents excess lifetime cancer risk meant for cancer risk prediction, and HQ represents hazard quotient meant for non-cancer risk prediction.
3 Results and discussion
3.1 Overall results and temporal variations of PM2.5 and meteorology
The daily average PM2.5 concentration and meteorological parameters observed during summer and winter, respectively, are provided as follows: PM2.5 as 114 ± 48 and 296 ± 45 μg/m3, temperature as 30 ± 4 and 15 ± 4°C, RH as 60 ± 17 and 72 ± 10%, wind speed as 5.3 ± 0.7 and 2.9 ± 0.6 m/s, and wind direction as 236 ± 31 and 312 ± 30°. All these responsible parameters showed significant variations between observed values during summer and winter (p < 0.05). Figure 2 shows temporal variations of PM2.5 concentration and meteorological parameters observed during summer and winter. The PM2.5 concentration varied from 42 to 213 μg/m3 during summer and 202–418 μg/m3 during winter. All individual 39 data points during summer and 40 data points during winter exceeded 24 h PM2.5 standard of 15 μg/m3 from WHO guidelines. Similarly, these individuals observed values exceeded 85 and 100%, respectively, during summer and winter of 24 h Indian PM2.5 standard of 60 μg/m3 recommended by the Central Pollution Control Board (CPCB), New Delhi. Overall, 24 h measured values of PM2.5 concentration during summer were almost 10 times and 2 times, respectively, higher than WHO standard and Indian standard, and that of winter was 20 times and 5 times, respectively, higher than WHO standard and Indian standard. Such high levels of PM2.5 in this study domain are a matter of concern for human health effects due to its exposure to humans.
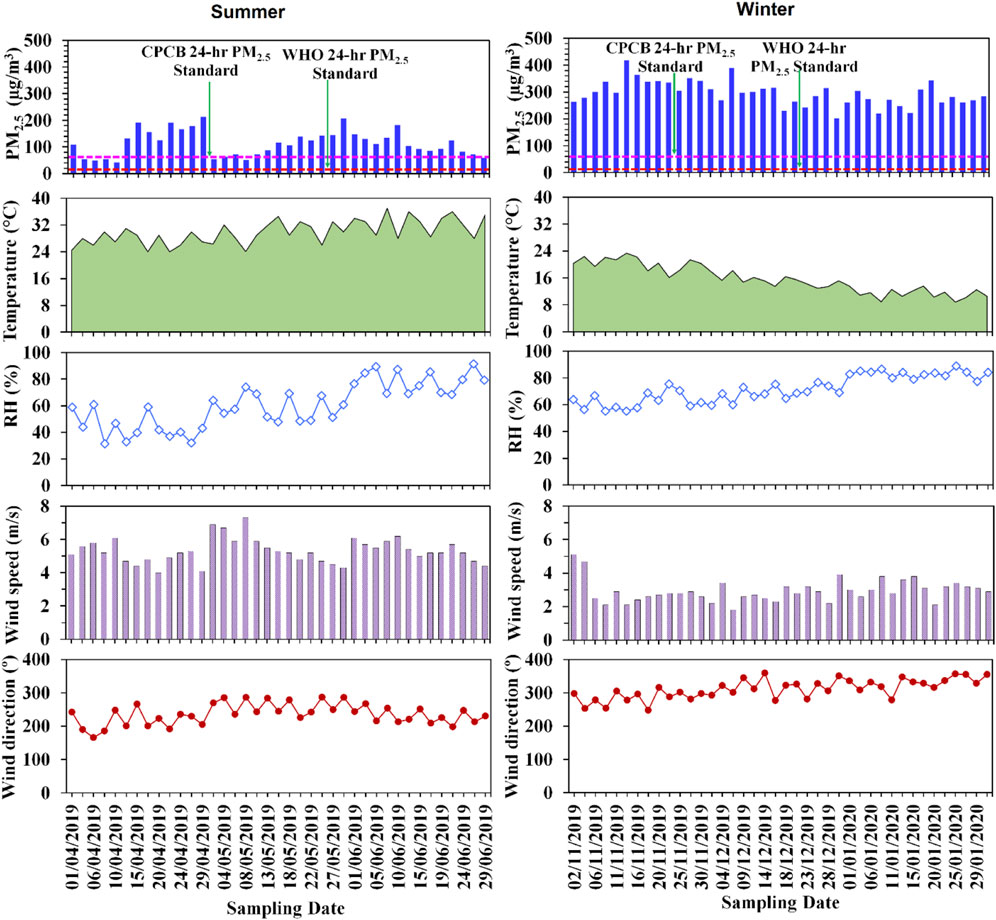
FIGURE 2. Temporal variations of levels of PM2.5 mass concentration and meteorological parameters observed at Greater Noida during summer and winter.
The higher concentration of PM2.5 during winter could be associated with stable atmospheric conditions with lower wind speed, lower boundary layer height (BLH), strong inversion, and less turbulence in the atmosphere (Saxena et al., 2017; Murthy et al., 2020). Such meteorological conditions during winter made the atmosphere more unfavorable for dispersion through vertical and horizontal diffusion of PM2.5 particles in the atmosphere, causing the accumulation of a larger amount of pollutants at the human exposure level (Yadav et al., 2019). In addition to unfavorable meteorological conditions for atmospheric dispersion of PM2.5 particles, anthropogenic activities responsible for particulate pollution such as biomass burning, power requirement, and energy requirement for heating to get rid of cold in sub-urban and remote regions increased substantially during winter (Behera et al., 2015a; Ravindra et al., 2021). As this study domain is confined to the Delhi-NCR region, there could be the transport of air masses carrying PM2.5 mass from higher emission regions of the city center places to the sampling site. Compared to winter, the lower concentration of PM2.5 during summer was attributed to comparatively less anthropogenic activities, higher wind speed in the atmosphere, and higher BLH (Banoo et al., 2020). The sampling site was close to NH91 road, Eastern Peripheral Expressway road, and 2642 MW capacity NTPC thermal power plant, as described in the Section 2. Biomass burning (solid agricultural residues) practice in the surrounding region to the sampling site is very common throughout the year. The aforementioned facts are the reasons for observations of higher concentration of PM2.5 during both the seasons and for causing a greater number of episodic events with hazy days during winter compared to summer.
3.2 Concentration levels of trace elements and identification of sources
Based on the range of concentration of individual elements measured in PM2.5 mass during summer and winter, elements were classified into three categories to have more clarity in the interpretation of the results (Duan et al., 2012; Behera et al., 2015c). The details of the segregation of these three categories are provided as follows: 1) major elements having individual concentration ≥250 ng/m3, 2) sub-major elements with 30 < individual concentration <250 ng/m3, and 3) minor elements having individual concentration <30 ng/m3. The major elements were Al, Ba, Ca, Fe, K, Mg, Mn, Na, S, Si, and Zn. The sub-major elements were Cr, Cu, Li, Ni, Pb, and Se. The minor elements were Bi, Cd, Cu, Co, Ga, Te, Tl, and Zr. Figure 3 presents elemental concentrations of major, sub-major, and minor elements during summer and winter. Among major elements, Si showed maximum concentration in PM2.5 mass during summer, whereas K showed the highest concentration in PM2.5 mass during winter. The specific decreasing order in concentration of major elements in PM2.5 mass followed the sequence Si > K > Al > Ca > S > Mn > Na > Mg > Ba > Zn > Fe during summer and K > S > Mn > Ca > Si > Al > Zn > Na > Fe > Mg > Ba during winter. The change in the sequence of concentration of individual elements in PM2.5 mass during both seasons showed that the importance of a specific source varied more during winter than summer (Bangar et al., 2021). For example, K going to the top in the list during winter indicated that the role of open burning in contribution to PM2.5 mass increased during winter than summer. Change in the order in concentrations of S and Mn in PM2.5 mass with going to the top in the list indicated that the importance of the source of coal burning increased during winter than summer. Additionally, such trends in order of concentration of major elements in PM2.5 mass during winter suggested that the importance of soil/road dust decreased in this period due to an increase in other pollution activities such as coal-burning or combustion and biomass burning (Sharma et al., 2016). Overall, these major elements are representatives of sources of road/soil dust, biomass burning, coal combustion, and vehicles.
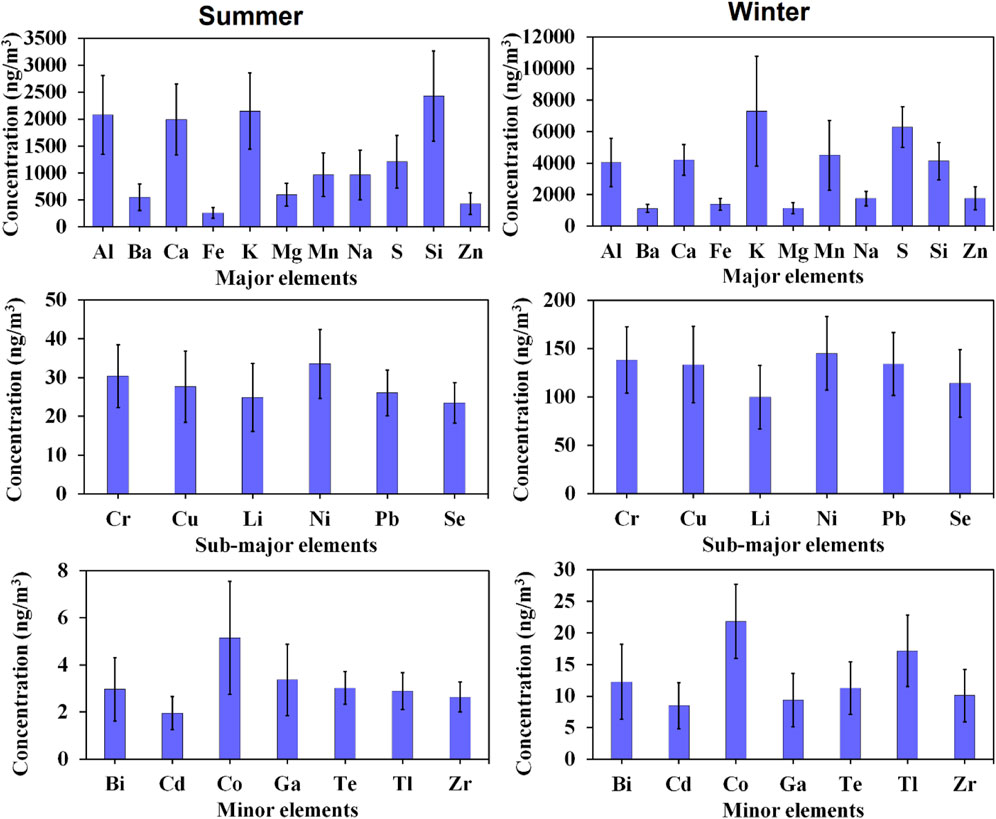
FIGURE 3. Observed levels of individual elements in the break-up of major, sub-major, and minor concentrations during summer and winter.
The sequence in concentration of sub-major elements in PM2.5 mass in decreasing order is provided as Ni > Cr > Cu > Pb > Li > Se during summer and Ni > Cr > Pb > Cu > Se > Li during winter. The change in the order of Pb and Se in going to the higher place in the list indicated that activities of coal-burning or combustion during winter increased compared to that in summer. Overall, these sub-major elements are mostly representatives of anthropogenic sources, including vehicles, coal combustion, and other industrial-derived activities (Clements et al., 2014; Boreddy et al., 2021). The order in concentration of minor elements in PM2.5 mass in decreasing order is provided as Co > Ga > Te > Bi > Tl > Zr > Cd during summer and Co > Tl > Bi > Zr > Te > Ga > Cd during winter. The change in the order of Tl, Bi, and Zr in going to the higher place in the list indicated that activities of coal-burning or combustion and other industrial operations during winter increased compared to that in summer. Hence, it was inferred that minor elements were mostly representatives of anthropogenic sources, including coal combustion and other industrial-derived activities (Gawhane et al., 2017).
Supplementary Figure S1 shows temporal variations of elements during summer and winter. Figure 4 shows results on percentage compositions of individual elements in total elemental concentration (sum of concentrations of 24 elements) during summer and winter. The analytical results showed that the percentage composition of elements from road/soil dust origin decreased during winter compared to summer. For example, Si contributed 17.05 and 10.73%, and Mg contributed 4.19 and 2.99% to total elemental concentrations during summer and winter, respectively. For other remaining elements of anthropogenic origin, the percentage composition in total elemental concentration increased during winter compared to summer. For instance, S contributed 8.51 and 16.32%, and Pb contributed 0.18 and 0.35% to total elemental concentrations during summer and winter, respectively.
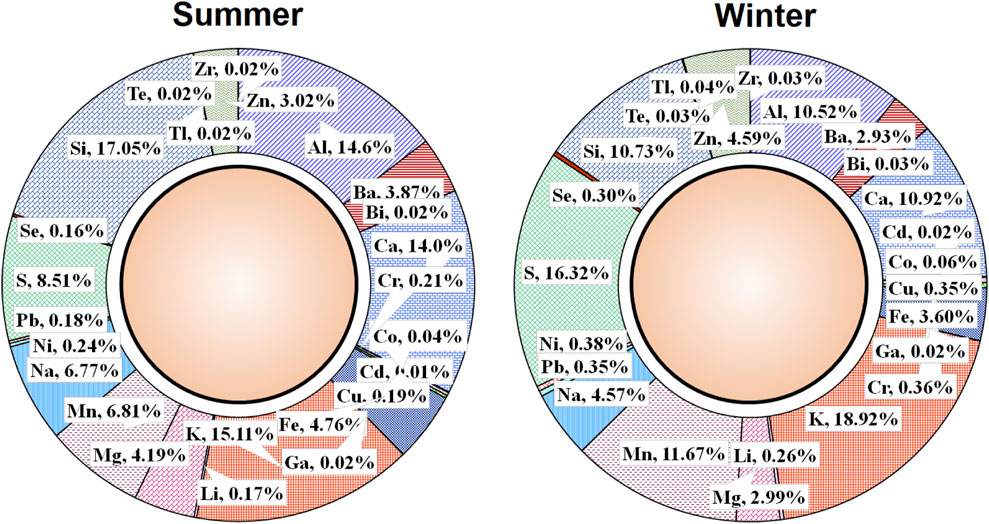
FIGURE 4. Percentage compositions of individual elements in total elemental concentration (sum of all measured elements) during summer and winter.
The results from the statistical t-test (Sigma Plot V.14.0, Systat Software, Inc) revealed that all 24 elements exhibited seasonal variations between summer and winter (p < 0.05). The average concentration ratio (winter/summer) of individual elements varied from 1.7 for Si to 5.9 for Tl. The elements from natural sources (Al, Ba, Ca, Mg, Na, and Si) exhibited a less proportionate increase during winter than in summer compared to the elements emitted from anthropogenic sources. The concentrations of natural source elements in PM2.5 might be attributed to re-suspension of road dust, uplift of mineral dust from soil, dust blown from construction and demolition activities, and agricultural work on the fields influenced by the wind in the atmosphere (Habil et al., 2013; Batbold et al., 2021).
The concentration ratio (winter/summer) of K was found to be 3.4, indicating multiple sources (road/soil dust and biomass burning) of K during winter. Compared to elements emitted from purely road/soil dust, K exhibited a higher proportionate increase during winter. The tracers for coal combustion sources (Cu, Ga, Mn, Pb, S, Se, and Tl) exhibited a proportionately higher increase in concentrations during winter than during summer (Pekney et al., 2006; Duan et al., 2012; Rai et al., 2021). The activities related to coal-burning or combustion might be increased substantially during winter to fulfill the rise in power demand, industrial productivity, and heating purpose by the residents to get rid of cold. The tracers of vehicular emissions (Cd, Mn, Ni, Pb, and Zn) showed a higher increase during winter than during summer, indicating that the on-road travel time of vehicles increased due to the recurrence of more hazy and foggy days causing traffic congestion, resulting in more emission of these elements during winter (Khare and Baruah, 2010; Lin et al., 2020). The tracers representing emissions from other industrial sources (Bi, Co, Cr, Te, and Zr) exhibited a proportionately higher increase in concentrations during winter than in summer.
Supplementary Tables S2 and S3 present a correlation matrix between elements measured during summer and winter, respectively. Some distinct observations are described as follows: 1) elements of the same source of origin exhibited significant correlation with each other, 2) correlation coefficient of K with elements of road/soil dust decreased during winter compared to summer, 3) in addition to a significant correlation coefficient between S and elements emitted from coal-burning or combustion source, S showed significant correlation with K, showing that S can be co-emitted from biomass burning along with K, and 4) elements from sources of anthropogenic sources produced more values of correlation coefficient during winter than summer, indicating a substantial increase in related pollution activities.
Figure 5 shows estimated values of EF of individual elements during summer and winter. These results were used in the identification of sources of origin either from crustal or non-crustal (anthropogenic) means. The break-up of the results of EF of elements was carried out as follows: 1) 1–10 for Ba, Ca, Fe, Mg, Na, and Si, 2) 10–100 for Co, Ga, K, Li, Mn, Pb, and Zr, 3) 100–1,000 for Cr, Cu, Ni, Tl, and Zn, 4) 1,000–10,000 for Bi, Cd, and S, and 5) 10,000–100,000 for Se and Te. The first category with fewer values of EF < 10 indicated that elements of Ba, Ca, Fe, Mg, Na, and Si were of non-enriched sources of crustal origin. Although K seems to be majorly from the crustal origin, EF of K during summer and winter confirmed its multiple sources of origin, including crustal and non-crustal, such as biomass burning (Shon et al., 2012; Betha et al., 2014). Most of the elements other than crustal origins were enriched with anthropogenic sources having EF values of more than 10 during summer and winter.
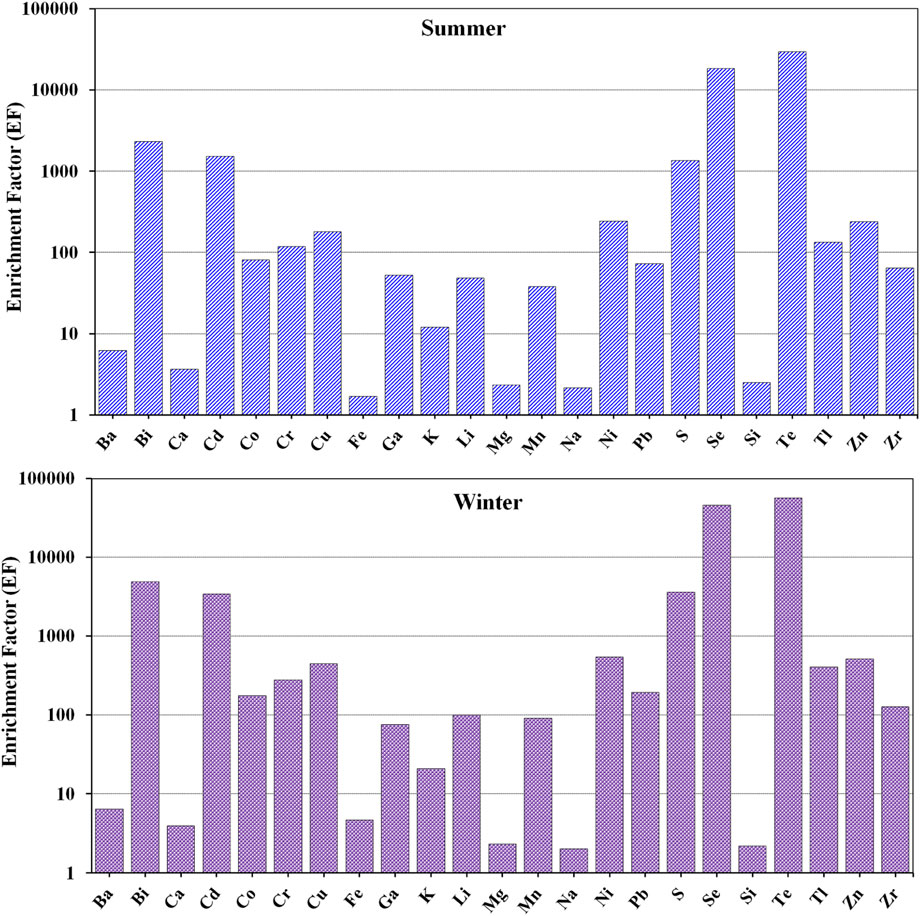
FIGURE 5. Estimated values of enrichment factor (EF) of individual elements during summer and winter.
A significant difference (p < 0.05) in EF was observed during summer and winter for Bi, Cd, Co, Cr, Cu, K, Li, Mn, Ni, Pb, S, Se, Te, Tl, Zn, and Zr. In the case of elements of Ba, Ca, Fe, Ga, Mg, Na, and Si did not show a significant difference with p > 0.05 during summer and winter. Compared to summer, estimated values of EF of elements during winter indicated a probable increase in local anthropogenic sources and occurrence of LRT of elements from higher emission regions and biomass burning fire points to the sampling site could happen.
3.3 Profiles of the backward trajectory of air masses
Figure 6 shows the profiles of biomass fire points and trajectory paths during summer (A–E) and winter (F–J). From the geographical locations of biomass fire points during summer and winter, it was clearly observed that biomass burning in India took place during these two seasons. The biomass burning comprising various agricultural crop residues occurs in Indian regions throughout the year, including summer and winter seasons (Rajput et al., 2014; Sahu et al., 2015; Sharma et al., 2022b). Figure 6 shows that southern, eastern, and central parts of India were subjected to more biomass fire points than northern and western parts of India during summer. These emission activities were concentrated mostly in Punjab, Haryana, and some parts of Uttar Pradesh during winter. The backward trajectory profiles at 500, 1,000, and 1,500 m during summer showed that air masses took free flow from remote distance points to the sampling site. The backward trajectory analysis provides a qualitative assessment of the path of trajectories of air masses coming from the remote regions to the sampling site. Relating the locations of biomass fire points with the direction of flow of air masses to the sampling site, it was inferred that the sampling site was affected by the LRT of air masses during summer and winter. It could be seen that some biomass burning points close to and in the surrounding region of the sampling site might have influenced the characteristics of ambient PM2.5 during summer and winter in addition to the LRT of air masses.
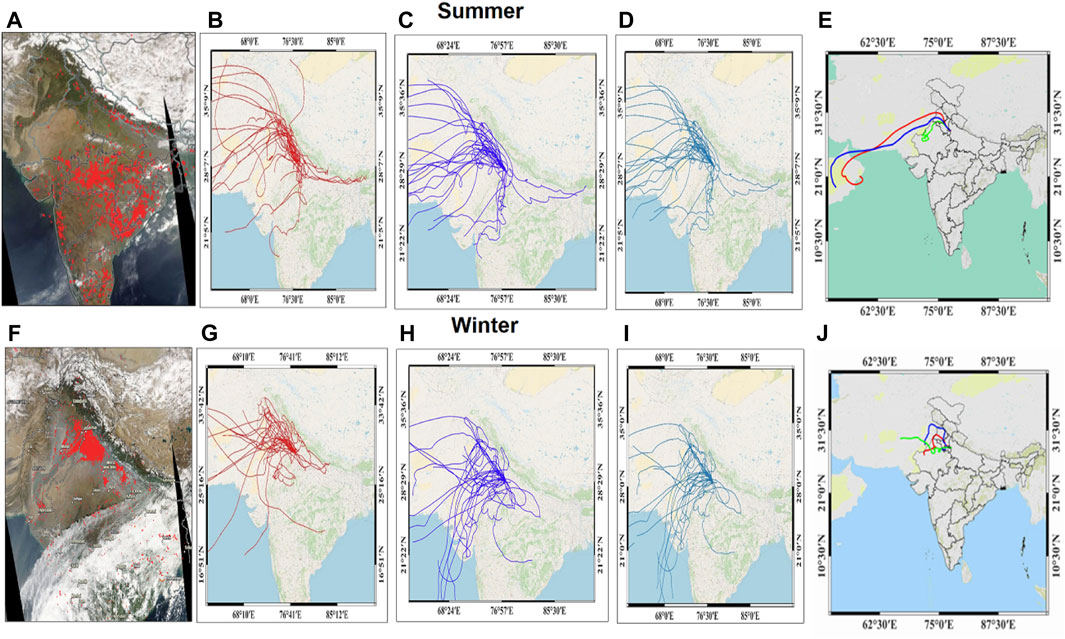
FIGURE 6. Profiles of biomass fire points and trajectory paths during summer (A–E) and winter (F–J). (A) and (F): Geographical locations of fire points related to biomass burning. (B) and (G): Trajectory paths at 500 m height. (C) and (H): Trajectory paths at 1,000 m height. (D) and (I): Trajectory paths at 1,500 m height. (E) and (J): Representative trajectories at heights of 500, 1,000, and 1,500 m.
The LRT scenario of the backward trajectory of air masses during winter was somehow different from summer. The biomass fire points were located close to the sampling site and the study domain during winter. The biomass fire points situated in Punjab and Haryana were located in the upwind directions of the sampling sites. The trajectory paths of air masses at heights of 500, 1,000, and 1,500 m during winter established the fact that the movement of air masses containing PM2.5 pollutants reached the sampling site in an easier way during winter than during summer. Hence, transboundary transport of air masses was greatly supported by the meteorological conditions prevailing in the study domain during summer and winter. Such scenarios of transboundary transport of air masses containing pollutants from remote regions to locations in the Delhi-NCR region have been reported in some previous studies (Sharma and Mandal, 2017; Shivani et al., 2019; Yadav et al., 2020).
3.4 Source apportionment of PM2.5 concentrations
A total of 24 variables (elements) separately for samples of summer and winter were subjected to analysis through PCA coupled with APCS (PCA-APCS) using statistical software IBM SPSS Statistics for Windows version 26.0. All these variables were utilized in the PCA-APCS method to apportion sources of PM2.5 concentrations during summer and winter. This modeling exercise produced five PCA factors (F1–F5) that accounted for a total variance at 78.8 and 87.6% during summer and winter, respectively, associated with the Eigenvalue greater than 1. Supplementary Table S4 presents a summary of results from the receptor modeling exercise with PCA factor loading for elements during summer and winter. Figure 7 shows the results of source apportionment of PM concentrations obtained from PCA-APCS modeling exercise during summer and winter.
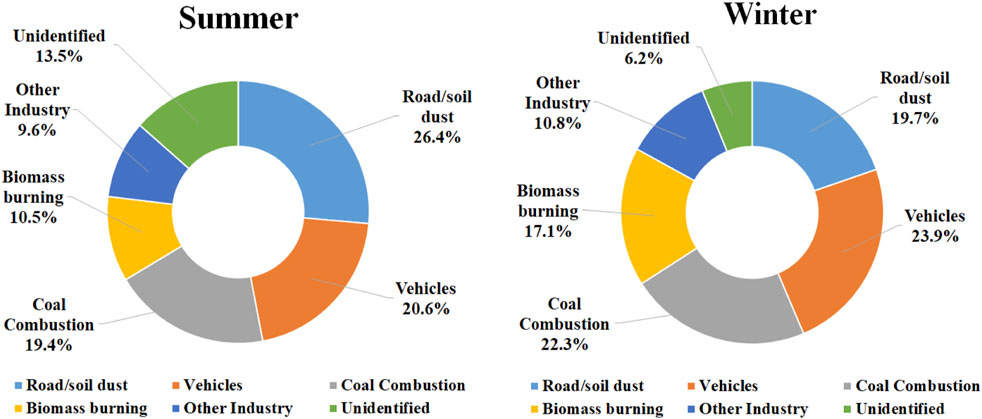
FIGURE 7. Results of source apportionment of PM concentrations during summer and winter.
The first factor (F1) in the modeling exercise exemplifies soil/road dust-related sources with tracer elements of crustal matter, including Al, Ba, Ca, Fe, K, Mg, and Si. This factor described a variance of 28.3 and 21.4%, respectively, during summer and winter. The contribution from this factor to PM2.5 mass concentration was 26.4 and 19.7%, respectively, during summer and winter. Some previous Indian studies have reported a list of elements (Al, Ca, Co, Cr, Cu, K, Mg, Na, Ni, Pb, Si, Ti, and Zn) that are possibly emitted from crustal or soil sources (Shridhar et al., 2010; Sharma and Mandal, 2017; Mondal and Singh, 2021).
The second factor (F2) in the modeling exercise represents the source of vehicles with related tracer elements that included Cd, Mn, Ni, Pb, and Zn in the list. This factor was associated with a variance of 17.4 and 19.6%, respectively, during summer and winter. This factor attributed 20.6 and 23.9% to PM2.5 mass concentration during summer and winter, respectively. Cd and Ni are normally emitted from tire wire and wire from braking systems of vehicles (Adamiec et al., 2016). Unleaded gasoline contains some additives, and Mn is one of them (Kulshrestha et al., 2009). Pb and Zn are used as additives in gasoline fuel and brake pads and can be emitted from tire wire (Pant and Harrison, 2012).
The third factor (F3) was associated with tracers (Cu, Ga, Mn, Pb, S, Se, and Tl) emitted from coal combustion with a variance of 16.6 and 18.3% during summer and winter, respectively. The specific contribution from the same source to PM2.5 mass concentration was found to be 19.4 and 22.3% during summer and winter, respectively. It is noteworthy that two tracer elements (Mn and Pb) were emitted from both the sources of vehicles and coal combustion (Huang et al., 2018). The results of PCA are visible with significant values of loadings for both these sources.
The fourth factor (F4) provided significant factor loadings for tracers of K and S, indicating that the responsible source was biomass burning in terms of agricultural residue and street garbage burning with a variance of 8.2 and 16.2% during summer and winter, respectively. The mass contribution of these sources to ambient PM2.5 concentration was obtained as 10.5 and 17.1% during summer and winter, respectively. The element, K, was found to be emitted from two distinct sources, including soil/road dust and biomass burning, with significant loadings during both seasons. The element, S, was observed to be emitted from two sources of coal combustion and biomass burning with significant loadings during summer and winter. Similar past studies reported on the emission source of these tracer elements (K and S) as biomass burning (Allen and Miguel, 1995; Chou et al., 2008).
The fifth factor (F5) was associated with other industry sources that included all small-scale industrial activities, including metal smelting, manufacturing, and many other related processes. The tracer elements with significant loadings were Bi, Co, Cr, Li, Te, and Zr, having a variance of 8.3 and 12.1% during summer and winter, respectively. The mass contribution of this source category contributed 9.6 and 10.8% during summer and winter, respectively. Several studies reported tracers of this significant source category, which are generally emitted during industrial activities (Reimann et al., 2001; Simonetti et al., 2018). Overall, an increase in the percentage of mass contribution from an unidentified source to PM2.5 concentration during winter compared to summer suggested that pollution activities (other than soil/road dust) increased substantially during winter.
We considered previous studies of source apportionment of PM2.5 in Indian cities for comparison of results with this study. Although the results may not be compared directly due to variations in the modeling approach through different sets of chemical constituents, we tried to provide an overview of the trends of results in these Indian cities. Table 1 presents the summary of the results of source apportionment of PM2.5 in the Delhi-NCR region and other Indian cities. The concentrations of PM2.5 in the Delhi-NCR region were observed to be higher than in other Indian cities such as Hyderabad, Mumbai, Nagpur, Kolkata, and Varanasi. The major sources in all these cities were found to be vehicles, soil/road dust, open burning, including biomass and refuse burning, and coal combustion and industrial emissions. All these studies are having same agreement on the substantial contribution from the source of open burning to PM2.5 concentration.
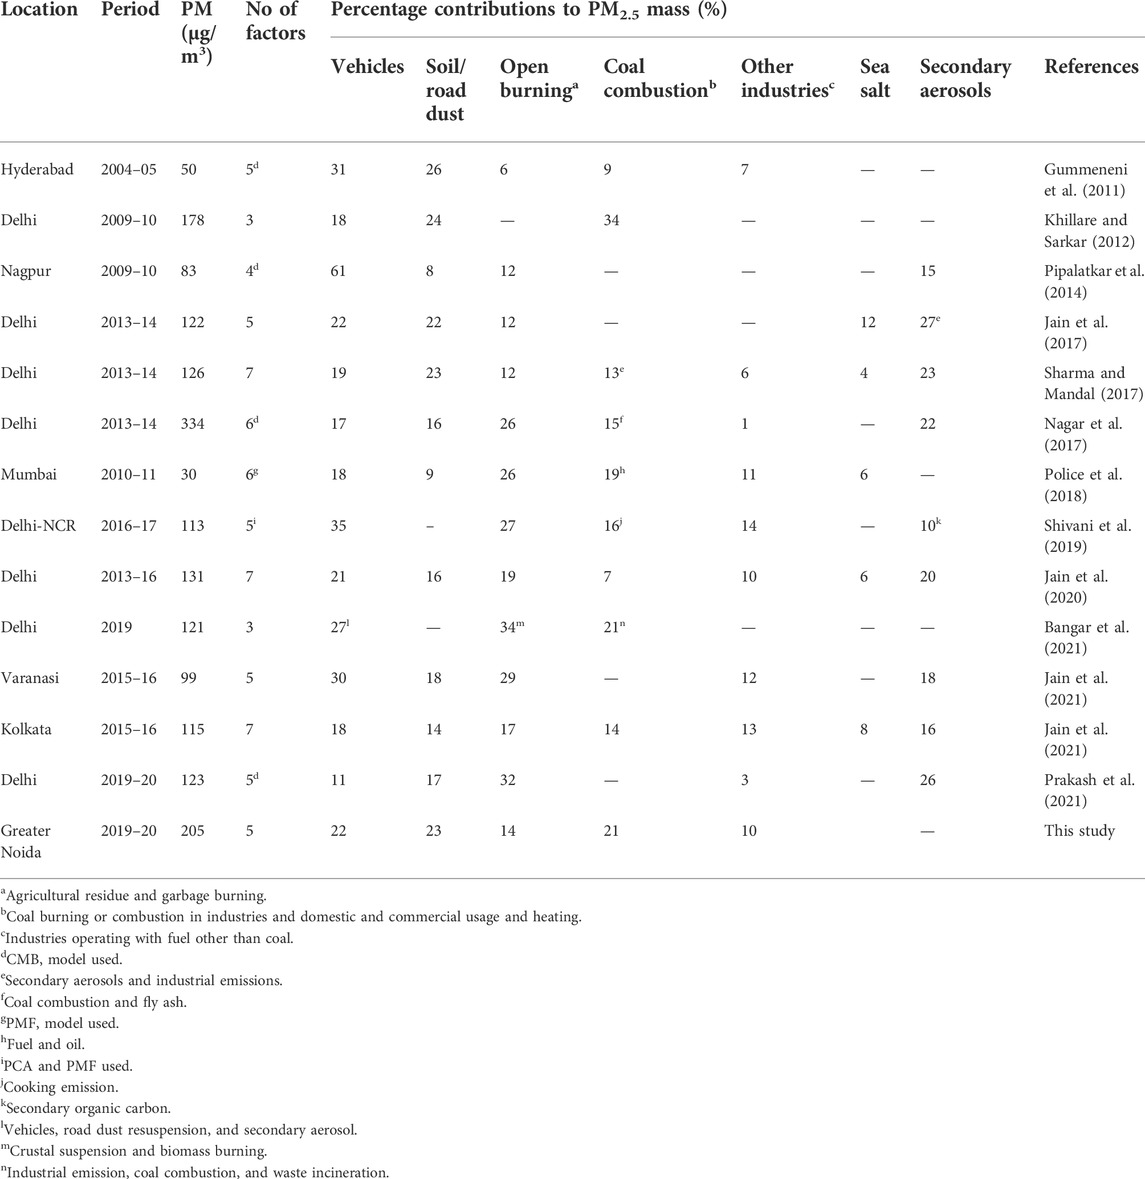
TABLE 1. Summary of the results of source apportionment of PM2.5 in Delhi-NCR and other Indian cities.
3.5 Deposition of PM2.5 and elements in the human respiratory system
Supplementary Figure S3 shows the results of MMAD and GSD of PM mass and elements during summer and winter. The MMAD of PM mass was estimated as 0.81 and 0.92 µm during summer and winter, respectively. The corresponding GSD was found to be 2.65 and 2.87 µm during summer and winter, respectively. The MMAD ranged from 0.52 µm for Li to 1.14 µm for Si during summer and 0.64 µm for Mn to 1.23 µm for Si during winter. This showed that the MMAD of particles increased during the episodic periods (winter) compared to the non-episodic periods (summer). During episodic or hazy events, the meteorological conditions and increased activities of responsible sources could provide a favorable environment for new and secondary particle formation through various processes, including coalescence and accumulation (Behera and Sharma, 2010, 2015). As a result, MMAD increased during the episodic period compared to the non-episodic period.
Supplementary Figure S2 and Figure 8 show the average deposition fractions of PM2.5 mass and elements in three distinct regions (HA, TB, and PA) of the human respiratory tract during summer and winter. The total deposition fraction (sum of three regions) of PM mass was found to be 0.40 and 0.44 during summer and winter, respectively (Supplementary Figure S2). Among three regions of the human respiratory tract, the highest deposition of PM mass occurred in the HA region at 0.21 and 0.19 during summer and winter, respectively. Such a higher deposition fraction in this region could happen due to processes of sedimentation and impaction of particles onto the larynx and airway bifurcations (Lyu et al., 2018; Laiman et al., 2022). The deposition fraction in the HA region reduced during winter compared to summer, while the result in the PA region increased during winter compared to summer. This might be due to the fact of decrease in percentage contribution of road/soil dust sources during winter compared to summer. Additionally, the primary input parameters (MMAD, GSD and density) of particles in model simulation might have a role in such a change in the trends of results during episodic and non-episodic periods (Hu et al., 2012).
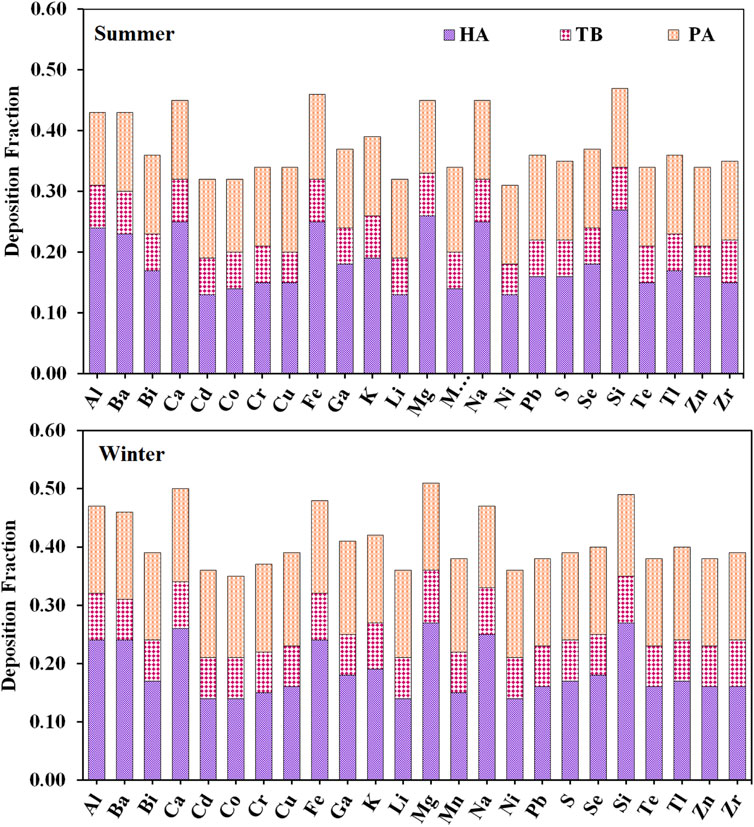
FIGURE 8. Deposition fraction of elements in various regions of the human respiratory tract (HA: head airway, TB: trachea and bronchiolar, PA: pulmonary and alveolar) during summer and winter.
In the case of elements, the total deposition fraction varied from 0.31 for Ni to 0.47 for Si during summer and from 0.35 for Co to 0.51 for Mg during winter. The deposition fraction in HA, TB, and PA regions showed variations among elements during summer and winter. The deposition fraction in the TB region for elements ranged from 0.05 to 0.07 during summer and 0.07 to 0.09 during winter. The deposition fraction in the HA region varied from 0.13 for Li to 0.27 for Si during summer and from 0.14 for Li to 0.27 for Si during winter. The deposition fraction in the PA region ranged from 0.12 to 0.14 during summer and from 0.14 to 0.16 during winter. Overall, the deposition fraction in the HA region for the elements was almost the same during both periods (Liu et al., 2019; Rajput et al., 2019). The deposition fraction in the PA regions for most of the elements increased during winter compared to summer (Zwozdziak et al., 2017).
The elements with the predominance of natural sources showed a higher deposition fraction in the upper respiratory HA region than in the lower respiratory PA region (Long et al., 2021). The deposition fraction in the lower respiratory tract (PA region) of elements with anthropogenic sources was mostly the same as the elements with natural sources. The elements from natural sources are coarser in size compared to elements from the anthropogenic source of origins (Liu et al., 2019). The pattern of deposition of finer elements in the human respiratory tract shows a path in which particles flow sequentially following Brownian diffusion that can lead to their preferential deposition in the PA region (Ham et al., 2011). The trends in the results of deposition fractions of PM mass and elements revealed in this study matched with the ranges of results reported in the literature with higher deposition during polluted events compared to cleaner events (Behera et al., 2015b; Zwozdziak et al., 2017; Long et al., 2021).
3.6 Cancer and non-cancer human health risk assessment
Table 2 presents the estimated values of cancer risks associated with human health (i.e., ELCR) for five individual elements (Cd, Co, Cr, Ni, and Pb) and the cumulative values under two scenarios of summer and winter. For Cd, Ni and Pb, the estimated values of ELCR were less than the USEPA permissible limit of 1 in 106 during summer, whereas the results of ELCR exceeded the permissible limit for Co and Cr. This indicated that ambient concentrations of Co and Cr during summer are a matter of concern. The cumulative ELCR was estimated as 41 ± 15 ×10−6 during summer, indicating that 26 to 56 people in 1 million population have the chance of getting cancer in their lifetime through exposure to these toxic particulate elements. The results of ELCR during the scenario of the winter episodic periods revealed that only Pb was not harmful, with the value of ELCR less than the permissible limit. However, ELCR values of the remaining elements (Cd, Co, Cr and Ni) exceeded the permissible limit, and the cumulative ELCR was 128 ± 27 × 10−6 during the winter episodic periods. In other words, 101 to 155 people in 1 million population would be vulnerable to getting cancer in their lifetime through exposure to such an episodic scenario with a higher concentration of toxic particulate elements. Comparing the results of the ELCR of two scenarios, it was assessed that the occurrence of episodic events would cause a 210% increase in human health risks of getting cancer.
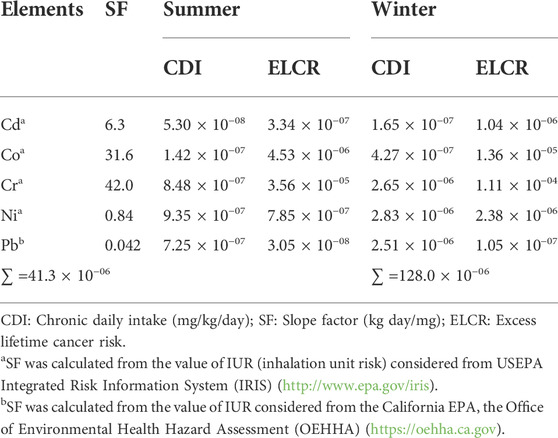
TABLE 2. Estimated cancer human health risks for scenarios during summer and winter.
Table 3 presents the results of estimated non-cancer human health risks (i.e., HQ) for scenarios during summer and winter episodic periods. The results during the summer indicated that risks due to exposure to individual toxic elements were below the USEPA permissible limit of 1.0. However, the cumulative HQ for this scenario exceeded the permissible limit of 1.0, indicating that exposure to ambient concentrations of related particulate elements is a matter of concern, as it can cause relevant non-cancer risks in humans. The estimated value of HQ of Al, Cd, Cr, and Pb was less than the permissible limit, whereas it exceeded 1.0 for Mn. The range of cumulative HQ varied from 0.64 to 1.48 under the scenario of summer, and this value ranged from 3.3 to 4.8 under the winter episodic scenario. Considering the cumulative HQ for both scenarios, it was observed that the risks increased by 283% during the winter episodic periods compared to the summer periods. With a similar methodology adopted in this study, previous studies conducted at various places across the world reported that recurrence of more episodic or hazy periods in a year can cause an increase in the probability of getting cancer and non-cancer risks (Betha et al., 2014; Behera et al., 2015c; Zhang et al., 2018; Wu et al., 2019).
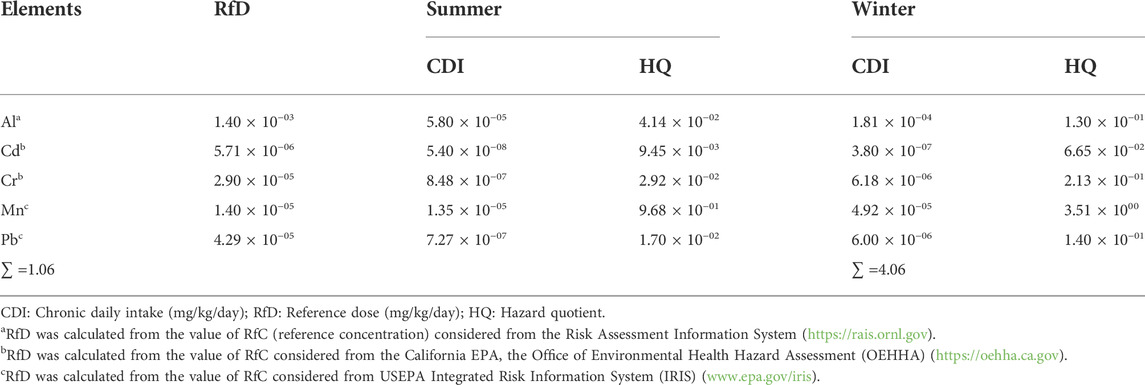
TABLE 3. Estimated non-cancer human health risks for scenarios during summer and winter.
4 Conclusion
Through a detailed measurement campaign meant for the assessment of ambient concentrations of elements, this study quantified 24 trace elements during non-episodic (summer) and episodic (winter) periods for further use in modeling exercises in source apportionment and human health risk assessment. The concentration of PM2.5 during summer and winter exceeded Indian air quality standard on most of the measurement days. All 24 elements exhibited seasonal variations between measured values during summer and winter. The transboundary transport of air masses containing pollutants from remote regions to locations in the Delhi-NCR region during the measurement period was predicted. The results of source apportionment of PM2.5 concentration revealed that road/soil dust contributed maximum percentage (26.4%) followed by vehicles (20.6%) and coal combustion (19.4%) to PM2.5 mass during summer. During winter, vehicles contributed the highest (29.9%), followed by coal combustion (22.3%) and road/soil dust (19.7%) to PM2.5 mass . The contribution of biomass burning to PM2.5 mass increased substantially during winter (17.1%) than summer (10.5%), indicating the LRT of air masses with pollutants from remote biomass fire points to the study domain occurred. The total deposition fraction varied from 0.31 for Ni to 0.47 for Si during summer and from 0.35 for Co to 0.51 for Mg during winter. The deposition fraction in the lower respiratory tract (PA region) for most of the elements increased during winter compared to summer. The estimated values of ELCR revealed that the occurrence of episodic events would cause a 210% increase in human health risks of getting cancer. The HQ values showed that non-cancer risks increased by 283% during the winter episodic period compared to the summer period. This study revealed that higher levels of elements during winter could be due to rising local emissions, critical meteorological conditions, and LRT of air masses.
Data availability statement
The original contributions presented in the study are included in the article/Supplementary Material; further inquiries can be directed to the corresponding author.
Author contributions
VK was involved in methodology development, conducting experiments, modeling work, data generation, data curation, data processing, and writing of the original manuscript. MY was involved in conducting experiments, modeling work, and data processing. SB was involved in research guidance, frame-working scopes, conceptualization, data processing, funding acquisition, project administration, and manuscript correction.
Funding
The Science and Engineering Research Board (SERB) of the Department of Science and Technology (DST), Government of India, funded a research project of grant number ECR/2016/002039/ES. The funding agency supported the fellowship of Junior Research Fellow to the first author VK, who is currently a Ph.D. student at Shiv Nadar University, Delhi-NCR. Shiv Nadar University, Delhi-NCR, provided extra funding for the development of sampling and experimental work, procurement of instruments and consumables, research infrastructure requirement, and scholarship to the graduate student. Shiv Nadar University, Delhi-NCR, supported the article-processing fee of this research article under the scheme of faculty professional development assistance (FPDA).
Acknowledgments
The authors gratefully acknowledge the Advanced Instrumentation Research Facility (AIRF), JNU, New Delhi, for providing ED-XRF facilities for the analysis of particulate trace elements generated from ambient air sampling. The authors thank the Air Resources Laboratory (ARL), National Oceanic and Atmospheric Administration, United States (NOAA), for access and for conducting modeling exercises using Hybrid Single-Particle Lagrangian Integrated Trajectory (HYSPLIT) and Trajstat software trajectory models for backward trajectory analysis (https://www.ready.noaa.gov/HYSPLIT.php) used in this publication. The authors gratefully acknowledge Applied Research Associates Inc., Raleigh, NC, United States, for access to particle dosimetry (MPPD) model version 2.11 (https://www.ara.com/mppd/) in conducting the simulation on the study of human airway assessment in different regions of the respiratory tract.
Conflict of interest
The authors declare that the research was conducted in the absence of any commercial or financial relationships that could be construed as a potential conflict of interest.
Publisher’s note
All claims expressed in this article are solely those of the authors and do not necessarily represent those of their affiliated organizations, or those of the publisher, the editors, and the reviewers. Any product that may be evaluated in this article, or claim that may be made by its manufacturer, is not guaranteed or endorsed by the publisher.
Supplementary Material
The Supplementary Material for this article can be found online at: https://www.frontiersin.org/articles/10.3389/fenvs.2022.949913/full#supplementary-material.
References
Adamiec, E., Jarosz-Krzemińska, E., and Wieszała, R. (2016). Heavy metals from non-exhaust vehicle emissions in urban and motorway road dusts. Environ. Monit. Assess. 188 (6), 369. doi:10.1007/s10661-016-5377-1
Allen, A. G., and Miguel, A. H. (1995). Biomass burning in the Amazon: Characterization of the ionic component of aerosols generated from flaming and smoldering rainforest and savannah. Environ. Sci. Technol. 29 (2), 486–493. doi:10.1021/es00002a026
Ambade, B., Sethi, S. S., and Chintalacheruvu, M. R. (2022). Distribution, risk assessment, and source apportionment of polycyclic aromatic hydrocarbons (PAHs) using positive matrix factorization (PMF) in urban soils of East India. Environ. Geochem. Health, 1–15. doi:10.1007/s10653-022-01223-x
Ambade, B., and Sethi, S. S. (2021). Health risk assessment and characterization of polycyclic aromatic hydrocarbon from the hydrosphere. J. Hazard. Toxic. Radioact. Waste 25 (2), 05020008. doi:10.1061/(ASCE)HZ.2153-5515.0000586
Amnuaylojaroen, T., Inkom, J., Janta, R., and Surapipith, V. (2020). Long range transport of southeast Asian PM2.5 pollution to northern Thailand during high biomass burning episodes. Sustainability 12 (23), 10049. doi:10.3390/su122310049
Arunkumar, M., and Dhanakumar, S. (2021). Influence of meteorology, mobility, air mass transport and biomass burning on PM2.5 of three north Indian cities: Phase-wise analysis of the COVID-19 lockdown. Environ. Monit. Assess. 193 (9), 618. doi:10.1007/s10661-021-09400-8
Balasubramanian, R., and Qian, W. B. (2004). Characterization and source identification of airborne trace metals in Singapore. J. Environ. Monit. 6 (10), 813–818. doi:10.1039/B407523D
Bangar, V., Mishra, A. K., Jangid, M., and Rajput, P. (2021). Elemental characteristics and source-apportionment of PM2.5 during the post-monsoon season in Delhi, India. Front. Sustain. Cities 18. doi:10.3389/frsc.2021.648551
Banoo, R., Sharma, S. K., Gadi, R., Gupta, S., and Mandal, T. K. (2020). Seasonal variation of carbonaceous species of PM10 over urban sites of National Capital Region of India. Aerosol Sci. Eng. 4 (2), 111–123. doi:10.1007/s41810-020-00058-2
Batbold, C., Chonokhuu, S., Buuveijargal, K., and Gankhuyag, K. (2021). Source apportionment and spatial distribution of heavy metals in atmospheric settled dust of Ulaanbaatar, Mongolia. Environ. Sci. Pollut. Res. 28 (33), 45474–45485. doi:10.1007/s11356-021-13861-2
Behera, S. N., Betha, R., Huang, X., and Balasubramanian, R. (2015b). Characterization and estimation of human airway deposition of size-resolved particulate-bound trace elements during a recent haze episode in Southeast Asia. Environ. Sci. Pollut. Res. 22 (6), 4265–4280. doi:10.1007/s11356-014-3645-6
Behera, S. N., Cheng, J., Huang, X., Zhu, Q., Liu, P., and Balasubramanian, R. (2015c). Chemical composition and acidity of size-fractionated inorganic aerosols of 2013-14 winter haze in Shanghai and associated health risk of toxic elements. Atmos. Environ. X. 122, 259–271. doi:10.1016/j.atmosenv.2015.09.053
Behera, S. N., Sharma, M., Mishra, P. K., Nayak, P., Damez-Fontaine, B., and Tahon, R. (2015a). Passive measurement of NO2 and application of GIS to generate spatially-distributed air monitoring network in urban environment. Urban Clim. 14, 396–413. doi:10.1016/j.uclim.2014.12.003
Behera, S. N., and Sharma, M. (2010). Reconstructing primary and secondary components of PM2.5 composition for an urban atmosphere. Aerosol Sci. Technol. 44 (11), 983–992. doi:10.1080/02786826.2010.504245
Behera, S. N., and Sharma, M. (2015). Spatial and seasonal variations of atmospheric particulate carbon fractions and identification of secondary sources at urban sites in North India. Environ. Sci. Pollut. Res. 22 (17), 13464–13476. doi:10.1007/s11356-015-4603-7
Betha, R., Behera, S. N., and Balasubramanian, R. (2014). 2013 southeast asian smoke haze: Fractionation of particulate-bound elements and associated health risk. Environ. Sci. Technol. 48 (8), 4327–4335. doi:10.1021/es405533d
Boreddy, S. K., Hegde, P., and Aswini, A. R. (2021). Geochemical characteristics of trace elements in size-resolved coastal urban aerosols associated with distinct air masses over tropical peninsular India: Size distributions and source apportionment. Sci. Total Environ. 763, 142967. doi:10.1016/j.scitotenv.2020.142967
Can-Terzi, B., Ficici, M., Tecer, L. H., and Sofuoglu, S. C. (2021). Fine and coarse particulate matter, trace element content, and associated health risks considering respiratory deposition for Ergene Basin, Thrace. Sci. Total Environ. 754, 142026. doi:10.1016/j.scitotenv.2020.142026
Chen, Y., Wild, O., Conibear, L., Ran, L., He, J., Wang, L., et al. (2020). Local characteristics of and exposure to fine particulate matter (PM2.5) in four Indian megacities. Atmos. Environ. X 5, 100052. doi:10.1016/j.aeaoa.2019.100052
Chou, C., Formenti, P., Maille, M., Ausset, P., Helas, G., Harrison, M., et al. (2008). Size distribution, shape, and composition of mineral dust aerosols collected during the african monsoon multidisciplinary analysis special observation period 0: Dust and biomass‐burning experiment field campaign in Niger, january 2006. J. Geophys. Res. 113 (D23), D00C10. doi:10.1029/2008JD009897
Clements, N., Eav, J., Xie, M., Hannigan, M. P., Miller, S. L., Navidi, W., et al. (2014). Concentrations and source insights for trace elements in fine and coarse particulate matter. Atmos. Environ. X. 89, 373–381. doi:10.1016/j.atmosenv.2014.01.011
Draxler, R. R., and Rolph, G. D. (2003). HYSPLIT (HYbrid single-particle Lagrangian integrated trajectory) model access via NOAA ARL. College Park, MD: NOAA Air Resources Laboratory. READY Website (http://www.arl.noaa.gov/HYSPLIT.php) .
Duan, J., Tan, J., Wang, S., Hao, J., and Chai, F. (2012). Size distributions and sources of elements in particulate matter at curbside, urban and rural sites in Beijing. J. Environ. Sci. 24 (1), 87–94. doi:10.1016/S1001-0742(11)60731-6
Dubey, B., Pal, A. K., and Singh, G. (2012). Trace metal composition of airborne particulate matter in the coal mining and non–mining areas of Dhanbad Region, Jharkhand, India. Atmos. Pollut. Res. 3 (2), 238–246. doi:10.5094/APR.2012.026
Gautam, A. S., Dilwaliya, N. K., Srivastava, A., Kumar, S., Bauddh, K., Siingh, D., et al. (2021). Temporary reduction in air pollution due to anthropogenic activity switch-off during COVID-19 lockdown in northern parts of India. Environ. Dev. Sustain. 23 (6), 8774–8797. doi:10.1007/s10668-020-00994-6
Gawhane, R. D., Rao, P. S. P., Budhavant, K. B., Waghmare, V., Meshram, D. C., and Safai, P. D. (2017). Seasonal variation of chemical composition and source apportionment of PM2.5 in Pune, India. Environ. Sci. Pollut. Res. 24 (26), 21065–21072. doi:10.1007/s11356-017-9761-3
Goel, R., and Guttikunda, S. K. (2015). Role of urban growth, technology, and judicial interventions on vehicle exhaust emissions in Delhi for 1991–2014 and 2014–2030 periods. Environ. Dev. 14, 6–21. doi:10.1016/j.envdev.2015.03.002
Gummeneni, S. D., Yusup, Y. B., Chavali, M., and Samadi, S. Z. (2011). Source apportionment of particulate matter in the ambient air of Hyderabad city, India. Atmos. Res. 10 (3), 752–764. doi:10.1016/j.atmosres.2011.05.002
Guo, X., Zhang, N., Hu, X., Huang, Y., Ding, Z., Chen, Y., et al. (2020). Characteristics and potential inhalation exposure risks of PM2. 5–bound environmental persistent free radicals in Nanjing, a mega–city in China. Atmos. Environ. X. 224, 117355. doi:10.1016/j.atmosenv.2020.117355
Guttikunda, S. K., and Goel, R. (2013). Health impacts of particulate pollution in a megacity—Delhi, India. Environ. Dev. 6, 8–20. doi:10.1016/j.envdev.2012.12.002
Habil, M., Massey, D. D., and Taneja, A. (2013). Exposure of children studying in schools of India to PM levels and metal contamination: Sources and their identification. Air Qual. Atmos. Health 6 (3), 575–587. doi:10.1007/s11869-013-0201-3
Ham, W. A., Ruehl, C. R., and Kleeman, M. J. (2011). Seasonal variation of airborne particle deposition efficiency in the human respiratory system. Aerosol Sci. Technol. 45 (7), 795–804. doi:10.1080/02786826.2011.564239
Hama, S. M., Kumar, P., Harrison, R. M., Bloss, W. J., Khare, M., Mishra, S., et al. (2020). Four-year assessment of ambient particulate matter and trace gases in the Delhi-NCR region of India. Sustain. Cities Soc. 54, 102003. doi:10.1016/j.scs.2019.102003
Hazarika, N., Jain, V. K., and Srivastava, A. (2015). Source identification and metallic profiles of size-segregated particulate matters at various sites in Delhi. Environ. Monit. Assess. 187 (9), 602–622. doi:10.1007/s10661-015-4809-7
Henry, R. C., and Hidy, G. M. (1979). Multivariate analysis of particulate sulfate and other air quality variables by principal components-Part I: Annual data from Los Angeles and New York. Atmos. Environ. X. 13 (11), 1581–1596. doi:10.1016/0004-6981(79)90068-4
Hu, M., Peng, J., Sun, K., Yue, D., Guo, S., Wiedensohler, A., et al. (2012). Estimation of size-resolved ambient particle density based on the measurement of aerosol number, mass, and chemical size distributions in the winter in Beijing. Environ. Sci. Technol. 46 (18), 9941–9947. doi:10.1021/es204073t
Huang, R. J., Cheng, R., Jing, M., Yang, L., Li, Y., Chen, Q., et al. (2018). Source-specific health risk analysis on particulate trace elements: Coal combustion and traffic emission as major contributors in wintertime beijing. Environ. Sci. Technol. 52 (19), 10967–10974. doi:10.1021/acs.est.8b02091
Jain, S., Sharma, S. K., Vijayan, N., and Mandal, T. K. (2020). Seasonal characteristics of aerosols (PM2.5 and PM10) and their source apportionment using PMF: A four-year study over Delhi, India. Environ. Pollut. 262, 114337. doi:10.1016/j.envpol.2020.114337
Jain, S., Sharma, S. K., Choudhary, N., Masiwal, R., Saxena, M., Sharma, A., et al. (2017). Chemical characteristics and source apportionment of PM2.5 using PCA/APCS, UNMIX, and PMF at an urban site of Delhi, India. Environ. Sci. Pollut. Res. 24 (17), 14637–14656. doi:10.1007/s11356-017-8925-5
Jain, S., Sharma, S. K., Vijayan, N., and Mandal, T. K. (2021). Investigating the seasonal variability in source contribution to PM2.5 and PM10 using different receptor models during 2013–2016 in Delhi, India. Environ. Sci. Pollut. Res. 28 (4), 4660–4675. doi:10.1007/s11356-020-10645-y
Kaushik, A., Kumar, A., Aswini, M. A., Panda, P. P., Shukla, G., and Gupta, N. C. (2021). Seasonal variation in chemical composition of size-segregated aerosols over the Northeastern Arabian Sea. Front. Environ. Sci. 8, 296. doi:10.3389/fenvs.2020.619174
Khare, P., and Baruah, B. P. (2010). Elemental characterization and source identification of PM2.5 using multivariate analysis at the suburban site of North-East India. Atmos. Res. 98 (1), 148–162. doi:10.1016/j.atmosres.2010.07.001
Khillare, P. S., and Sarkar, S. (2012). Airborne inhalable metals in residential areas of Delhi, India: Distribution, source apportionment and health risks. Atmos. Pollut. Res. 3 (1), 46–54. doi:10.5094/APR.2012.004
Kulshrestha, A., Massey, D. D., Masih, J., and Taneja, A. (2014). Source characterization of trace elements in indoor environments at urban, rural and roadside sites in a semi-arid region of India. Aerosol Air Qual. Res. 14 (6), 1738–1751. doi:10.4209/aaqr.2013.05.0147
Kulshrestha, A., Satsangi, P. G., Masih, J., and Taneja, A. (2009). Metal concentration of PM2.5 and PM10 particles and seasonal variations in urban and rural environment of Agra, India. Sci. Total Environ. 407 (24), 6196–6204. doi:10.1016/j.scitotenv.2009.08.050
Kumar, D., Singh, A. K., Kumar, V., Poyoja, R., Ghosh, A., and Singh, B. (2021). COVID-19 driven changes in the air quality; a study of major cities in the Indian state of Uttar Pradesh. Environ. Pollut. 274, 116512. doi:10.1016/j.envpol.2021.116512
Laiman, V., Hsiao, T. C., Wang, Y. H., Young, L. H., Chao, H. R., Lin, T. H., et al. (2022). Contributions of acidic ions in secondary aerosol to PM2.5 bioreactivity in an urban area. Atmos. Environ. X. 275, 119001. doi:10.1016/j.atmosenv.2022.119001
Lin, Y. C., Zhang, Y. L., Song, W., Yang, X., and Fan, M. Y. (2020). Specific sources of health risks caused by size-resolved PM-bound metals in a typical coal-burning city of northern China during the winter haze event. Sci. Total Environ. 734, 138651. doi:10.1016/j.scitotenv.2020.138651
Liu, S., Liu, G., Yang, L., Li, D., and Zheng, M. (2022). Critical influences of metal compounds on the formation and stabilization of environmentally persistent free radicals. Chem. Eng. J. 427, 131666. doi:10.1016/j.cej.2021.131666
Liu, X., Nie, D., Zhang, K., Wang, Z., Li, X., Shi, Z., et al. (2019). Evaluation of particulate matter deposition in the human respiratory tract during winter in Nanjing using size and chemically resolved ambient measurements. Air Qual. Atmos. Health 12 (5), 529–538. doi:10.1007/s11869-019-00663-2
Long, L., He, J., and Yang, X. (2021). Characteristics, emission sources and health risk assessment of trace elements in size-segregated aerosols during haze and non-haze periods at Ningbo, China. Environ. Geochem. Health 43 (8), 2945–2963. doi:10.1007/s10653-020-00757-2
Lyu, Y., Guo, H., Cheng, T., and Li, X. (2018). Particle size distributions of oxidative potential of lung-deposited particles: Assessing contributions from quinones and water-soluble metals. Environ. Sci. Technol. 52 (11), 6592–6600. doi:10.1021/acs.est.7b06686
Manisalidis, I., Stavropoulou, E., Stavropoulos, A., and Bezirtzoglou, E. (2020). Environmental and health impacts of air pollution: A review. Front. Public Health 14. doi:10.3389/fpubh.2020.00014
Manojkumar, N., Srimuruganandam, B., and Nagendra, S. S. (2019). Application of multiple path particle dosimetry model for quantifying age specified deposition of particulate matter in human airway. Ecotoxicol. Environ. Saf. 168, 241–248. doi:10.1016/j.ecoenv.2018.10.091
Mishra, D., Goyal, P., and Upadhyay, A. (2015). Artificial intelligence based approach to forecast PM2.5 during haze episodes: A case study of Delhi, India. Atmos. Environ. X. 102, 239–248. doi:10.1016/j.atmosenv.2014.11.050
Mondal, S., and Singh, G. (2021). PM2.5-bound trace elements in a critically polluted industrial coal belt of India: Seasonal patterns, source identification, and human health risk assessment. Environ. Sci. Pollut. Res. 28 (25), 32634–32647. doi:10.1007/s11356-021-12876-z
Murthy, B. S., Latha, R., Tiwari, A., Rathod, A., Singh, S., and Beig, G. (2020). Impact of mixing layer height on air quality in winter. J. Atmos. Sol. Terr. Phys. 197, 105157. doi:10.1016/j.jastp.2019.105157
Nagar, P. K., Sharma, M., and Das, D. (2019). A new method for trend analyses in PM10 and impact of crop residue burning in Delhi, Kanpur and Jaipur, India. Urban Clim. 27, 193–203. doi:10.1016/j.uclim.2018.12.003
Nagar, P. K, Singh, D., and Sharma, M. (2011). Source apportionment of particulate matter in the ambient air of Hyderabad city, India. Atmos. Res. 10 (3), 752–764. doi:10.1016/j.atmosres.2011.05.002
O’Shaughnessy, P. T., and Raabe, O. G. (2003). A comparison of cascade impactor data reduction methods. Aerosol Sci. Technol. 37 (2), 187–200. doi:10.1080/02786820300956
Pant, P., and Harrison, R. M. (2012). Critical review of receptor modelling for particulate matter: A case study of India. Atmos. Environ. X. 49, 1–12. doi:10.1016/j.atmosenv.2011.11.060
Pekney, N. J., Davidson, C. I., Zhou, L., and Hopke, P. K. (2006). Application of PSCF and CPF to PMF-modeled sources of PM2.5 in pittsburgh. Aerosol Sci. Technol. 40 (10), 952–961. doi:10.1080/02786820500543324
Pipalatkar, P., Khaparde, V. V., Gajghate, D. G., and Bawase, M. A. (2014). Source apportionment of PM2.5 using a CMB model for a centrally located Indian city. Aerosol Air Qual. Res. 14 (3), 1089–1099. doi:10.4209/aaqr.2013.04.0130
Police, S., Sahu, S. K., Tiwari, M., and Pandit, G. G. (2018). Chemical composition and source apportionment of PM2.5 and PM2.5-10 in Trombay (Mumbai, India), a coastal industrial area. Particuology 37, 143–153. doi:10.1016/j.partic.2017.09.006
Prakash, J., Choudhary, S., Raliya, R., Chadha, T. S., Fang, J., and Biswas, P. (2021). Real-time source apportionment of fine particle inorganic and organic constituents at an urban site in Delhi city: An IoT-based approach. Atmos. Pollut. Res. 12 (11), 101206. doi:10.1016/j.apr.2021.101206
Rai, P., Furger, M., Slowik, J. G., Zhong, H., Tong, Y., Wang, L., et al. (2021). Characteristics and sources of hourly elements in PM10 and PM2.5 during wintertime in Beijing. Environ. Pollut. 278, 116865. doi:10.1016/j.envpol.2021.116865
Rajput, P., Izhar, S., and Gupta, T. (2019). Deposition modeling of ambient aerosols in human respiratory system: Health implication of fine particles penetration into pulmonary region. Atmos. Pollut. Res. 10 (1), 334–343. doi:10.1016/j.apr.2018.08.013
Rajput, P., Sarin, M., Sharma, D., and Singh, D. (2014). Characteristics and emission budget of carbonaceous species from post-harvest agricultural-waste burning in source region of the Indo-Gangetic Plain. Tellus B Chem. Phys. Meteorology 66 (1), 21026. doi:10.3402/tellusb.v66.21026
Ravindra, K., Singh, T., Sinha, V., Sinha, B., Paul, S., Attri, S. D., et al. (2021). Appraisal of regional haze event and its relationship with PM2.5 concentration, crop residue burning and meteorology in Chandigarh, India. Chemosphere 273, 128562. doi:10.1016/j.chemosphere.2020.128562
Reimann, C., Koller, F., Kashulina, G., Niskavaara, H., and Englmaier, P. (2001). Influence of extreme pollution on the inorganic chemical composition of some plants. Environ. Pollut. 115 (2), 239–252. doi:10.1016/S0269-7491(01)00106-3
Sahu, L. K., Sheel, V., Pandey, K., Yadav, R., Saxena, P., and Gunthe, S. (2015). Regional biomass burning trends in India: Analysis of satellite fire data. J. Earth Syst. Sci. 124 (7), 1377–1387. doi:10.1007/s12040-015-0616-3
Saxena, M., Sharma, A., Sen, A., Saxena, P., Mandal, T. K., Sharma, S. K., et al. (2017). Water soluble inorganic species of PM10 and PM2.5 at an urban site of Delhi, India: Seasonal variability and sources. Atmos. Res. 184, 112–125. doi:10.1016/j.atmosres.2016.10.005
Sharma, G. K., Tewani, A., and Gargava, P. (2022b). Comprehensive analysis of ambient air quality during second lockdown in national capital territory of Delhi. J. Hazard. Mater. Adv. 6, 100078. doi:10.1016/j.hazadv.2022.100078
Sharma, M., Kaskaoutis, D. G., Singh, R. P., and Singh, S. (2014). Seasonal variability of atmospheric aerosol parameters over Greater Noida using ground sunphotometer observations. Aerosol Air Qual. Res. 14 (3), 608–622. doi:10.4209/aaqr.2013.06.0219
Sharma, P., Peshin, S. K., Soni, V. K., Singh, S., Beig, G., and Ghosh, C. (2022a). Seasonal dynamics of particulate matter pollution and its dispersion in the city of Delhi, India. Meteorol. Atmos. Phys. 134 (2), 28–18. doi:10.1007/s00703-021-00852-8
Sharma, S. K., and Mandal, T. K. (2017). Chemical composition of fine mode particulate matter (PM2.5) in an urban area of Delhi, India and its source apportionment. Urban Clim. 21, 106–122. doi:10.1016/j.uclim.2017.05.009
Sharma, S. K., Mandal, T. K., Jain, S., Sharma, A., and Saxena, M. (2016). Source apportionment of PM2.5 in Delhi, India using PMF model. Bull. Environ. Contam. Toxicol. 97 (2), 286–293. doi:10.1007/s00128-016-1836-1
Shivani, , Gadi, R., Saxena, M., Sharma, S. K., and Mandal, T. K. (2019). Short-term degradation of air quality during major firework events in Delhi, India. Meteorol. Atmos. Phys. 131 (4), 753–764. doi:10.1007/s00703-018-0602-9
Shon, Z. H., Kim, K. H., Song, S. K., Jung, K., Kim, N. J., and Lee, J. B. (2012). Relationship between water-soluble ions in PM2.5 and their precursor gases in Seoul megacity. Atmos. Environ. X. 59, 540–550. doi:10.1016/j.atmosenv.2012.04.033
Shridhar, V., Khillare, P. S., Agarwal, T., and Ray, S. (2010). Metallic species in ambient particulate matter at rural and urban location of Delhi. J. Hazard. Mat. 175 (1-3), 600–607. doi:10.1016/j.jhazmat.2009.10.047
Simonetti, G., Conte, E., Perrino, C., and Canepari, S. (2018). Oxidative potential of size-segregated PM in an urban and an industrial area of Italy. Atmos. Environ. X. 187, 292–300. doi:10.1016/j.atmosenv.2018.05.051
Song, Y., Xie, S., Zhang, Y., Zeng, L., Salmon, L. G., and Zheng, M. (2006). Source apportionment of PM2.5 in Beijing using principal component analysis/absolute principal component scores and UNMIX. Sci. Total Environ. 372 (1), 278–286. doi:10.1016/j.scitotenv.2006.08.041
Thurston, G. D., and Spengler, J. D. (1985). A quantitative assessment of source contributions to inhalable particulate matter pollution in metropolitan Boston. Atmos. Environ. X. 19 (1), 9–25. doi:10.1016/0004-6981(85)90132-5
Tiwari, S., Chate, D. M., Pragya, P., Ali, K., and Bisht, D. S. (2012). Variations in mass of the PM10, PM2.5 and PM1 during the monsoon and the winter at New Delhi. Aerosol Air Qual. Res. 12 (1), 20–29. doi:10.4209/aaqr.2011.06.0075
Tseng, Y. L., Wu, C. H., Yuan, C. S., Bagtasa, G., Yen, P. H., and Cheng, P. H. (2021). Inter-comparison of chemical characteristics and source apportionment of PM2.5 at two harbors in the Philippines and Taiwan. Sci. Total Environ. 793, 148574. doi:10.1016/j.scitotenv.2021.148574
USEPA (1998). United States Environmental Protection Agency. Quality Assurance Guidance Document 2.12. Monitoring PM2.5 in ambient air using designated reference or class I equivalent methods.
Volckens, J., and Leith, D. (2003). Partitioning theory for respiratory deposition of semivolatile aerosols. Ann. Occup. Hyg. 47 (2), 157–164. doi:10.1093/annhyg/meg015
Volckens, J., and Leith, D. (2011). Partitioning theory for respiratory deposition of semivolatile aerosols. Ann. Occup. Hyg. 55 (8), 157–164. doi:10.1093/annhyg/meg015
Wang, Y. S., Chang, L. C., and Chang, F. J. (2021). Explore regional PM2.5 features and compositions causing health effects in Taiwan. Environ. Manage. 67 (1), 176–191. doi:10.1007/s00267-020-01391-5
Wu, Y., Lu, B., Zhu, X., Wang, A., Yang, M., Gu, S., et al. (2019). Seasonal variations, source apportionment, and health risk assessment of heavy metals in PM2.5 in Ningbo, China. Aerosol Air Qual. Res. 19 (9), 2083–2092. doi:10.4209/aaqr.2018.12.0452
Yadav, A., Behera, S. N., Nagar, P. K., and Sharma, M. (2020). Spatio-seasonal concentrations, source apportionment and assessment of associated human health risks of PM2.5-bound polycyclic aromatic hydrocarbons in Delhi, India. Aerosol Air Qual. Res. 20 (12), 2805–2825. doi:10.4209/aaqr.2020.04.0182
Yadav, R., Sahu, L. K., Beig, G., Tripathi, N., Maji, S., and Jaaffrey, S. N. A. (2019). The role of local meteorology on ambient particulate and gaseous species at an urban site of Western India. Urban Clim. 28, 100449. doi:10.1016/j.uclim.2019.01.003
Yadav, S. K., Mishra, R. K., and Gurjar, B. R. (2022). Assessment of the effect of the judicial prohibition on firecracker celebration at the Diwali festival on air quality in Delhi, India. Environ. Sci. Pollut. Res. Int., 1–13. doi:10.1007/s11356-021-17695-w
Zhang, J., Wu, L., Fang, X., Li, F., Yang, Z., Wang, T., et al. (2018). Elemental composition and health risk assessment of PM10 and PM2.5 in the roadside microenvironment in Tianjin, China. Aerosol Air Qual. Res. 18 (7), 1817–1827. doi:10.4209/aaqr.2017.10.0383
Zwozdziak, A., Gini, M. I., Samek, L., Rogula-Kozlowska, W., Sowka, I., and Eleftheriadis, K. (2017). Implications of the aerosol size distribution modal structure of trace and major elements on human exposure, inhaled dose and relevance to the PM2.5 and PM10 metrics in a European pollution hotspot urban area. J. Aerosol Sci. 103, 38–52. doi:10.1016/j.jaerosci.2016.10.004
Keywords: enrichment factor, PCA-APCS model, MPPD model, human respiratory tract, carcinogenic and non-carcinogenic risks, open burning
Citation: Kumar V, Yadav M and Behera SN (2022) Characterization of PM2.5-bound trace elements, source apportionment, and assessment of associated human health risks during summer and winter in Greater Noida, the National Capital Region of India. Front. Environ. Sci. 10:949913. doi: 10.3389/fenvs.2022.949913
Received: 21 May 2022; Accepted: 18 August 2022;
Published: 13 September 2022.
Edited by:
Sudhir Kumar Sharma, National Physical Laboratory (CSIR), IndiaReviewed by:
Papiya Mandal, National Environmental Engineering Research Institute (CSIR), IndiaTanbir Singh, Research Institute for Humanity and Nature, Japan
Balram Ambade, National Institute of Technology, India
Copyright © 2022 Kumar, Yadav and Behera. This is an open-access article distributed under the terms of the Creative Commons Attribution License (CC BY). The use, distribution or reproduction in other forums is permitted, provided the original author(s) and the copyright owner(s) are credited and that the original publication in this journal is cited, in accordance with accepted academic practice. No use, distribution or reproduction is permitted which does not comply with these terms.
*Correspondence: Sailesh N. Behera, c2FpbGVzaC5iZWhlcmFAc251LmVkdS5pbg==