 Hongwei Tian
 Xingjie Ji1,3*
94% of researchers rate our articles as excellent or good
Learn more about the work of our research integrity team to safeguard the quality of each article we publish.
Find out more
ORIGINAL RESEARCH article
Front. Environ. Sci., 22 July 2022
Sec. Atmosphere and Climate
Volume 10 - 2022 | https://doi.org/10.3389/fenvs.2022.949564
This article is part of the Research TopicAir Pollution Remote Sensing and the Subsequent Interactions with Ecology on Regional ScalesView all 31 articles
Based on trend analysis, partial correlation analysis, and Mann–Kendall test, we analyzed the spatiotemporal variations of net primary productivity (NPP) in the Yellow River Basin and their responses to meteorological factors during the period 1981–2020. The results revealed that NPP had high values in the mid-south part but low values in the northwestern part of the Yellow River Basin. The average NPP was 195.3 g C·m−2·a−1 from 1981 to 2020, and the inter-annual fluctuation of NPP showed a significant increasing trend with an increasing rate of 2.35 g C·m−2·a−2 (p < 0.01). The annual mean temperature showed a positive correlation with NPP in 99.6% of the basin, and 91.4% of which passed the 0.01 significant test. NPP and annual precipitation positively correlated in 87.1% of the basin, and 41.7% of which passed the 0.01 significant test. In 75.2% of the basin, NPP was related negatively with annual sunshine hours, and 17.6% of which of which passed the 0.01 significant test.
According to the Intergovernmental Panel on Climate Change’s (IPCC) sixth assessment report, the last 4 decades have been successively warmer than any decade that preceded them since 1850 (IPCC, 2021). The acceleration of climate warming has increased the frequency and intensity of meteorological disasters, severely impacting global food security and the environment (Zhou et al., 2019a; Zhou et al., 2019b; Guo et al., 2022; Zhao et al., 2022). Vegetation, which can be an indicator of global or regional climate change, plays an important role in terrestrial ecosystems (Piao et al., 2006). Climate warming can strongly impact vegetation phenology and may also cause dramatic changes in the distribution of terrestrial vegetation and environmental quality (Kong et al., 2017; Pan et al., 2021a; Pan et al., 2021b), and global warming has positive effects in boreal and arctic biomes but negative effects in the tropics (Piao et al., 2020). Climate change and human activities are considered the main drivers of regional vegetation variation. Studies showed that the temperature and precipitation exhibited high heterogeneity with changes in vegetation (Park et al., 2015; Fang et al., 2018). Net primary productivity (NPP), which refers to the amount of carbon fixed through photosynthesis by green plants per unit of time and area, is not only an important indicator of vegetation growth status and ecosystem health, but also plays a crucial role in the terrestrial carbon cycle (Potter et al., 2012; Chen et al., 2015). It revealed that the climate change influenced NPP by affecting the distribution of radiation, heat, and water in the process of plant growth (Zhu et al., 2007a; Piao et al., 2011). Climate change had the most dominant-negative impact on the accumulated carbon sink in 14.2% of the total vegetated area of the globe (Chen et al., 2019), and soil drying caused by precipitation change contributes to 19% of global GPP change (Chen et al., 2021). The influence of climatic factors on vegetation NPP also showed strong spatiotemporal variations (Zhu et al., 2007b), and NPP of different vegetation types reacted differently to climatic factors (Khalifa et al., 2018).
The NPP estimation models can be divided into four categories based on their different operating mechanisms: climate, ecological process, light energy utilization, and ecological remote sensing coupled models. Ecological process models, which simulate vegetation growth, are well suited for simulating NPP as well as the impact and mechanisms of global climate change on vegetation NPP. As an ecological process model, the Boreal Ecosystem Productivity Simulator (BEPS) model separates the canopy into sunlit leaves and shaded leaves and uses the Farquhar photochemical model to simulate carbon–water processes (Liu et al., 1997; Chen et al., 1999; Liu et al., 2002). The BEPS model has been widely used to estimate the terrestrial ecosystem productivity globally (Amthor et al., 2001; Zhang F. M. et al., 2012; Chen et al., 2019; Zhao et al., 2021a).
As an important ecological barrier, the Yellow River Basin contains several fragile ecological regions and is confronted by environmental problems such as soil erosion and ecological function degradation. In the past decades, several environmental projects (e.g., soil and water conservation, forest and grassland rehabilitation from agriculture, and afforestation) have been carried out by the government of China and have resulted in increases in regional vegetation cover (Sun et al., 1998; Yuan et al., 2013). Fractional vegetation cover in the Yellow River Basin showed a positive increase in the past 2 decades, and increase in temperature, precipitation, and CO2 concentration presented positive contributions to vegetation increase (Sun et al., 2021; Zhang et al., 2021). On the other hand, the MODIS MOD17A3 NPP product showed that NPP in the Yellow River Basin exhibited a slightly increasing trend between 2000 and 2015 (Tian et al., 2019). However, the influence of climate change on NPP across the Yellow River Basin needs a longer time span than that available through the MODIS data, which is of great importance for the studies of global changes and ecosystem changes. Therefore, in this study, NPP estimated from the BEPS from 1981 to 2020 was used to explore the spatiotemporal variation and its response to climate change over a 40-year time span, which will strengthen our understanding of the relationship between carbon cycle and climate change.
The Yellow River Basin is located between 95°53′E to 119°12′E and 32°9′N to 41°50′N, with a total area of 79 thousand km2, covering 9 provinces of China (Zhao et al., 2021b). The Yellow River originates from the Qinghai Province and flows into the Bohai Sea in Shandong Province. The terrain of this basin decreases from west to east (Figure 1). High mountain areas with an average elevation of more than 4,000 m are mainly located in the western part, the Loess Plateau with an elevation of 1,000–2,000 m is located in the middle part, and the North China Plain with elevation lower than 100 m is located in the eastern part. The whole basin is divided into 11 secondary water resource areas (Figure 1). Land cover types in the western and northern parts of the basin are mainly shrub lands and savannas, while the middle and eastern parts are mainly covered by forests, wetlands, and croplands.
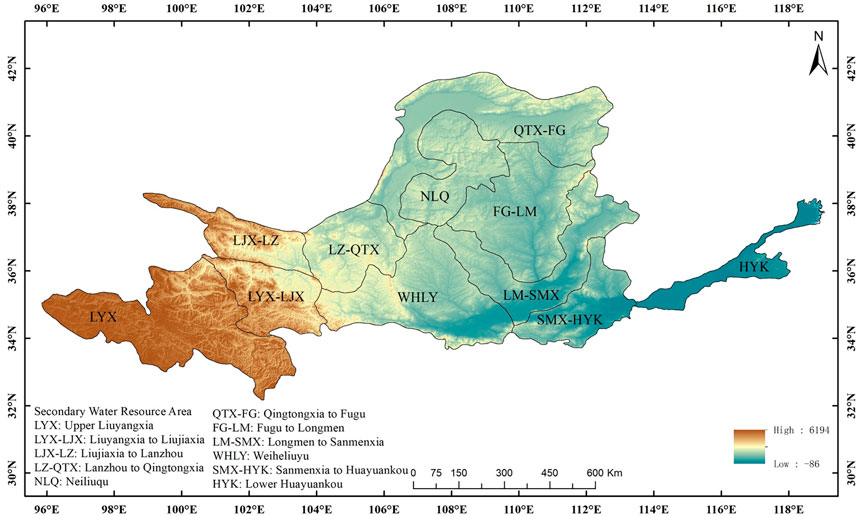
FIGURE 1. Terrain and secondary water resource areas of the Yellow River Basin.
The required BEPS input data include land cover, leaf area index (LAI), available soil water capacity (AWC), and daily meteorological data. Land cover data came from the Institute of Geography and Resources, Chinese Academy of Sciences (http://www.resdc.cn/). Time series of LAI were from GLOBMAP LAI V3, which was generated every 8 days by the team of Liu in the Institute of Geography and Resources, Chinese Academy of Sciences (Liu et al., 2012). Available soil water capacity (AWC) came from the International Geosphere-Biosphere Program, Data and Information System (IGBP-DIS; http://www.daac.ornl.gov). Meteorological data at 318 weather stations were used from the daily meteorological datasets (V3.0) at the National Meteorological Science Data Center of China (http://data.cma.cn). Data including daily precipitation, mean temperature, and sunshine hours were averaged or summed to the annual precipitation (AP), annual mean temperature (AMT), and annual sunshine hours (ASH) year by year, then all data were interpolated into 0.01 ° × 0.01 ° grid data with the Kriging method to drive the BEPS model and analyze their influence on NPP in the Yellow River Basin.
In this study, we used the process-based ecological model BEPS to simulate NPP. The BEPS model was originally built using the biological principles of forest biogeochemical cycles (FOREST-BGC) (Hunt and Running, 1992; Kimball et al., 1997) with some modifications. The model has been refined by incorporating an advanced photosynthesis model, the Farquhar model, to the canopy using a sunlit and shaded leaf stratification approach (Farquhar et al., 1980). The instantaneous model at the leaf level is scaled to the whole canopy at a daily timescale using a temporal and spatial integration scheme (Liu et al., 1997), and the detailed steps of calculation of NPP can be referred to in Chen et al. (1999). The results of BEPS model had been widely verified in East Asia by comparing flux site data with different terrestrial ecosystems from China and AsiaFlux network (Zhang F. et al., 2012; Zhang et al., 2014; Liu et al., 2015; Zhao et al., 2021a). Thus, the BEPS model is considered credible and its NPP results can be used to the Yellow River Basin.
The ordinary least-squares method was used to calculate a linear regression of NPP for the period 1981 to 2020 to study the annual change trend of NPP (Gang et al., 2014; Yan et al., 2019).
where slope is the inter-annual rate of NPP change; n is 40 for years from 1981 to 2020; i is 1 for year 1981, 2 for year 1982, and so on; and NPPi is the value of annual NPP at year i.
Light, heat, and water, represented as sunshine hours, mean temperature, and precipitation, respectively, are dominant factors affecting the vegetation growth. A statistical partial correlation analysis was used to study the effects of a single climatic factor on NPP and exclude the interference from others. When two other climatic factors are used as dependent variables, the partial correlation coefficients of NPP and individual climatic factors can be calculated by Eq. 5 (Beer et al., 2010; Wu et al., 2015; Wen et al., 2018):
where Rxy, z is the partial correlation coefficient between x and y when excluding the impact of variable z; x and y are the dependent variables, and z is the control variable. Rxy, Rxz, and Ryz are the simple correlation coefficients between x, y, and z. Rxy was taken as an example to calculate the correlation coefficients between NPP and climatic factor (Eq. 3):
where xi and yi are the annual NPP and climatic factor, respectively; x and y are the average NPP and mean climatic factor from 1981 to 2020. Finally, a bilateral t-test was implemented to assess the significance of the partial correlation coefficients.
The Mann–Kendall test was used in the trend analysis of the climatic factors, including the annual mean temperature (AMT), annual sunshine hours (ASH), and annual precipitation (AP) during the period 1981–2000. The Mann–Kendall statistic Z-value for a time series x1, x2, x3, … xn was calculated as:
In this study, n refers to the number of time series, sign is a sign function, and xi and xj are elements of the time series. When the absolute value of Z is greater than 1.96 and 2.58, the trend analysis is at the significance level of 0.05 and 0.01.
Based on the trend analysis and Mann–Kendall test, the change slope was classified into six classes (Liu et al., 2019): 1) extremely significant decrease, slope < 0, p ≤ 0.01; 2) significant decrease, slope < 0, 0.01 < p ≤ 0.05; 3) nonsignificant decrease, slope < 0, p > 0.05; 4) non-significant increase, slope > 0, p > 0.05; 5) significant increase, slope > 0, 0.01 < p ≤ 0.05; and 6) extremely significant increase, slope > 0, p ≤ 0.01.
The spatial distribution of AMT, AP, and ASH from 1981 to 2020 are shown in Figure 2. The distribution of AMT, AP, and ASH show similar patterns in the Yellow River Basin, with similar values along with the belts extending from the northeast to the southwest. Regions with high AMT and AP are distributed in the southeast, while the high ASH is distributed in the northwestern part of the research region. The western part of the Yellow River Basin with the lowest AMT lies in the Tibetan Plateau with an elevation higher than 3,000 m. The eastern part of the Yellow River Basin had the highest AP in the Shandong Peninsula, which belongs to the coastal area.
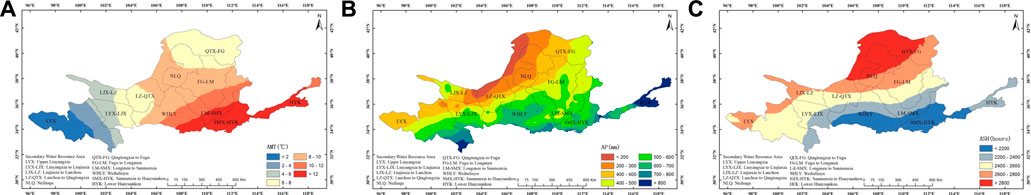
FIGURE 2. Spatial distribution of average AMT (A), AP (B), and ASH (C) in the last 4 decades.
Inter-annual variations of AMT, AP, and ASH are shown in Figure 3. AMT shows a strong increasing trend in the past 40 years, with the lowest value in 1983 (8.3°C) and the highest value in 2006 (10.6°C). AMT shows a stable, increasing trend between 1981 and 1997, while there is no trend after 1997. AP shows a slight increasing trend in the past 4 decades, with the highest value in 2002 (651.4 mm) and the lowest value in 1996 (338.0 mm); the fluctuation after 2003 seems not as drastic as before 2003. ASH shows a decreasing trend in the past 4 decades, with the highest value in 1996 (2,624.2 h) and the lowest value in 2019 (2,239.7 h); there were only 2 years with higher ASH than the average after 2005.
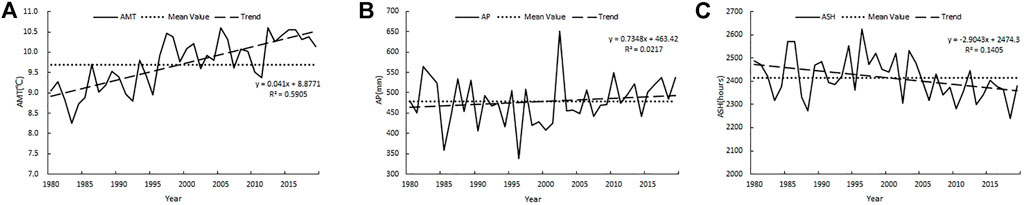
FIGURE 3. Inter-annual variation of the AMT (A), AP (B), and ASH (C) in the Yellow River Basin.
The average value, change slope, and Z-value of the Mann–Kendall test of AMT, AP, and ASH in the past 40 years are shown in Table 1. The AMT of the study area from 1981 to 2020 was 9.7°C, with a change slope of 0.0410°C·a−1 in the extremely significant level. The secondary water resource areas with the top three lowest AMT were LYX (2.2°C), LJX-LZ (5.5°C), and LYX-LJX (5.8°C), but they show the top three highest warming trends, with change rates of 0.0506°C·a−1, 0.0453°C·a−1, and 0.0446°C·a−1, respectively. AMT in all 11 secondary water resource areas shows a significant warming trend. The average AP of the study area is 478.5 mm, with a change slope of 0.7348 mm·a−1 at the nonsignificant level. A total of ten secondary water resources show an increasing trend; only SMX-HYK shows a decreasing trend, but the change slope in all of the 11 secondary water resource areas were at the nonsignificant level. Average ASH in the study area was 2,414.7 h, with a decreasing rate of −2.9043 h·a−1 in the nonsignificant level. ASH in all of the 11 secondary water resource areas showed a decreasing trend; three of them were extremely significant and three were significant. HYK and SMX-HYK were areas with the top two decreasing rates, both at the extremely significant level.

TABLE 1. Statistical values of climatic factors in secondary water resource areas.
The spatial distribution of 40 years’ and each decade average NPP are shown in Figures 4, 5. As a whole, NPP in the Yellow River Basin shows the highest value in the mid-south area, and decreases in the other parts, while the northwest region shows the lowest values. The average NPP in the entire research region is 195.3 g C·m−2·a−1, with 82% of the pixels with values less than 300 g C·m−2·a−1, and less than 10% of the pixels with values higher than 400 g C·m−2·a−1. The spatial distribution of 10-year average NPP in the last 4 decades is shown in Figure 6 and listed in Table 2. As a whole, the distribution of NPP decreased from the southeast to the northwest.

FIGURE 4. Spatial distribution of net primary productivity (NPP) during 1981 and 2020.
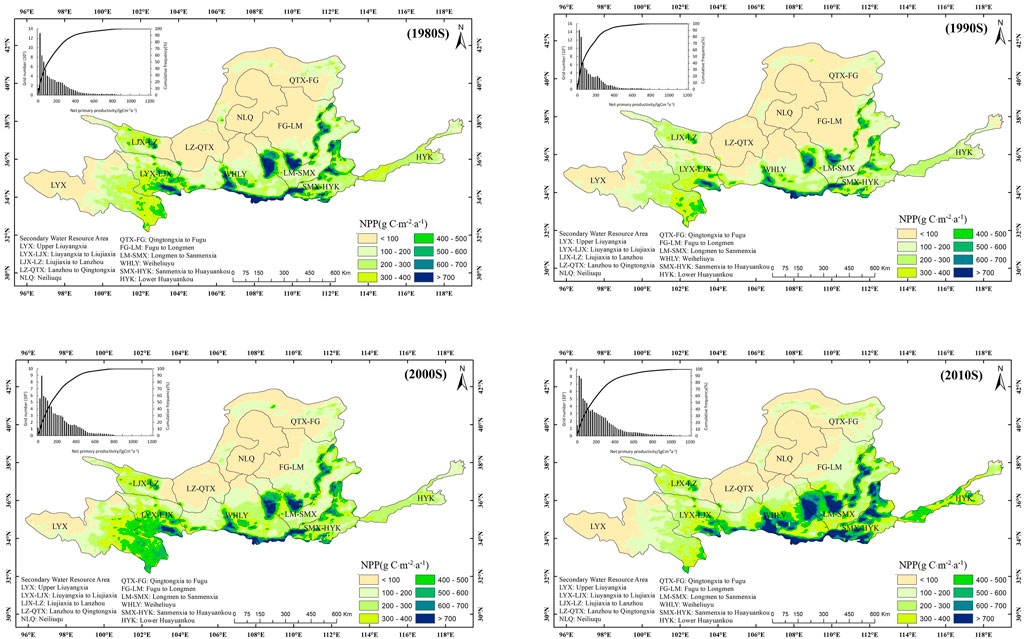
FIGURE 5. Spatial distribution of 10-year average NPP from 1981 to 2020.
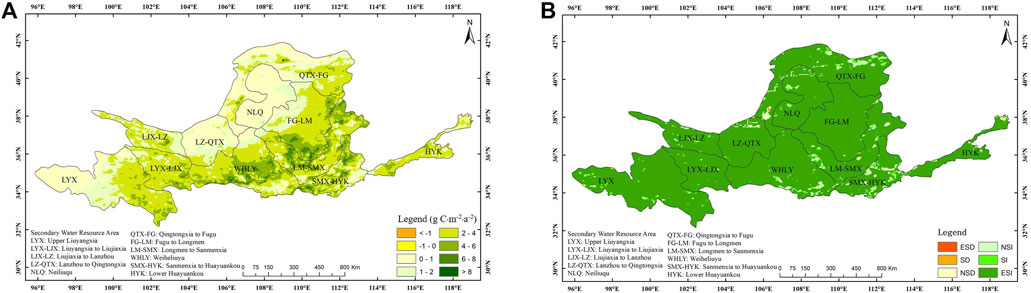
FIGURE 6. Spatial distribution of the NPP change slope (A) in the last 40 years and its significance level (B) (ESD, extremely significant decrease; SD, significant decrease; NSD, nonsignificant decrease; NSI, nonsignificant increase; SI, significant increase; and ESI, extremely significant increase).
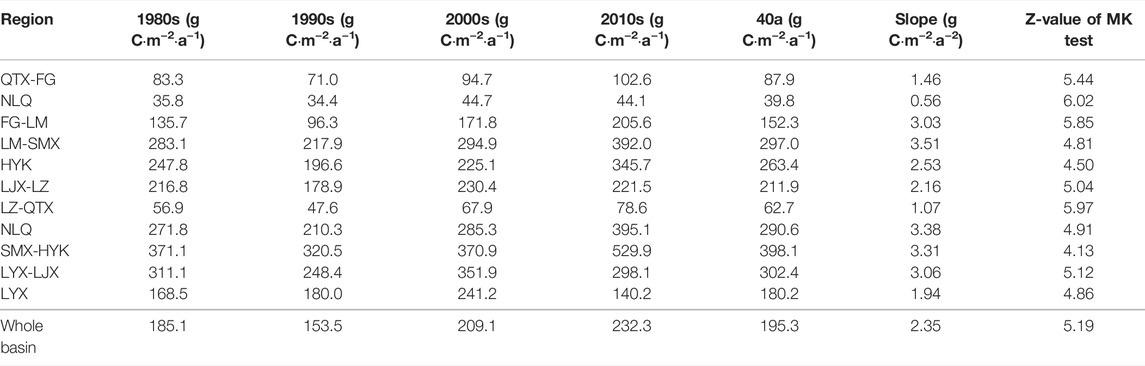
TABLE 2. Statistical values of NPP in secondary water resource areas.
The inter-annual variation of NPP in the Yellow River Basin from 1981 to 2020 is shown in Figure 7. A slightly increasing trend was observed, ranging from 134.5 g C·m−2·a−1 in 1981 to 257.5 g C·m−2·a−1 in 2018, with an increasing rate of 2.35 g C·m−2·a−2 across the whole basin, at the extremely significant level with an MK test Z-value of 5.19. There were two short time decreases, from 194.9 g C·m−2·a−1 in 1998 to 153.9 g C·m−2·a−1 in 2000, and from 257.5 g C·m−2·a−1 in 2018 to 232.3 g C·m−2·a−1 in 2020.
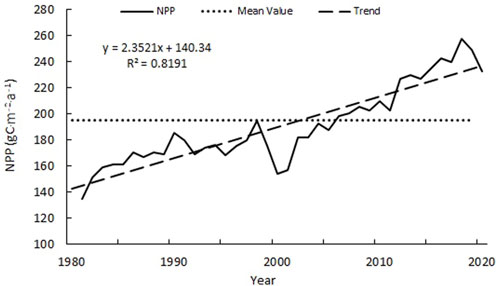
FIGURE 7. Inter-annual variation of the NPP in the Yellow River Basin from 1981 to 2020.
The trend analysis and the Mann–Kendall test show that all the secondary water resource areas had increasing trends at extremely significant levels (Table 2). The LM-SMX had the highest increasing rate. The change slopes in 5 of 11 secondary water resource areas were higher than 3.0 g C·m−2·a−2. The NLQ had the lowest increasing slope but the highest MK test z-value.
The spatial distribution of the vegetation NPP variation trend in the Yellow River Basin and its significance test are shown in Figure 6. During the last 40 years, about 99.6% of the study area showed increasing trends, including 94.3% at the extremely significant level and 2.5% percent at the significant level. Some areas showed increasing rates of more than 6 g C·m−2·a−2, mainly distributed in WHLY, LM-SMX, SMX-HYK, and the southern part of FG-LM. There were only small decreasing regions sporadically distributed. Regarding the secondary water resource areas, FG-LM, LYX-LJX, LYX, LZ-QTX, NLQ, and LJX-LZ showed at least 95% area increase at the extremely significant level. SMX-HYK showed 83.0% of the area increased at the extremely significant level.
The spatial distribution of the partial coefficients between NPP and climatic factors at a different significance level are presented in Figure 8. The regions where AMT exhibited a positive correlation with NPP occupy 99.6% of the entire research region, and the region that correlated at the extremely significant level occupies 83.1%, while the significant level occupies 8.3%. The areas of negative correlation only occupy 0.4% of the whole basin and are mainly distributed in NLQ, WHLY, and HYK.
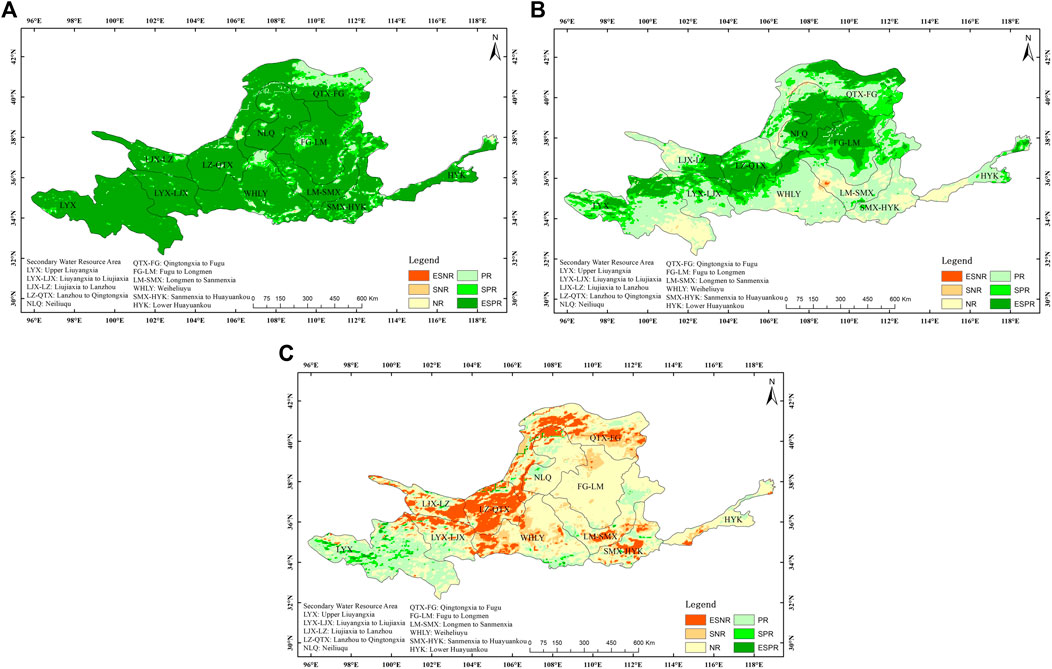
FIGURE 8. Correlation between NPP and AMT (A), AP (B), and ASH (C).
The spatial distribution of the partial coefficients between NPP and AP shows that positive relation areas account for 87.1% of the whole study area, of which 25.4% at the extremely significant level and 16.3% at the significant level. Negative correlation areas account for 12.9%, only 0.3% at the significant level. Negative correlations are mainly distributed in the southeast LYX, northwest of LJX-LZ, and part of the areas in WHLY, LM-SMX, SMX-HYK and HYK.
The spatial distribution of partial coefficients between NPP and ASH shows that NPP is positively correlated in 24.8% of the study area. Only 0.8% at the extremely significant level and 2.0% at the significant level. The negative correlation occupies 75.2% of the study area, 2.7% at the extremely significant level, and 14.9% at the significant level.
Previous studies have shown that the normalized difference vegetation index (NDVI) and vegetation cover have increased in the Yellow River Basin in the past decades. Vegetation cover in the forest showed a decreasing trend, while alpine shrubs, meadow, typical steppe, desert steppe, and forest (meadow) steppe vegetation all showed a marked increasing trend (Nie et al., 2012). During 1982 and 2013, areas that showed a trend toward improvement accounted for 59.49% of the Yellow River Basin area, while the area that showed no change accounted for about 33.96% (Niu et al., 2021). The average NDVI in the Yellow River Basin showed large fluctuations from 2000 to 2004, but showed a rapid upward trend since 2005, while 62.9% of the total area showed increasing trend during 2000 and 2010 (Yuan et al., 2013). From 1982 to 2019, the NDVI of the Yellow River Basin showed a significant increasing trend with a change trend of 0.0024 a−1 (Liu et al., 2021). The fractional vegetation cover of the Yellow River Basin also showed a strong rising tendency during 2000–2019, with a growth rate of 0.6,030 a−1 (Zhang et al., 2021), and the vegetation cover in the middle part of the Yellow River Basin improved significantly.
Previous studies have shown that climate constraints on the vegetation growth relaxed with increasing temperature and solar radiation, allowing an upward trend in NPP in the past decades. The global NPP in grasslands experienced a significant increase from 1982 to 2008, with an increasing annual rate of 0.03 Pg C·a−1 (Liu et al., 2019). NPP has shown an upward trend at the century scale, with an average trend coefficient reaching 0.88 between 1901 and 2005 in China (Gao et al., 2020). The GPP in the Yangtze River Basin showed an increasing trend but not a significant trend, with a linear change rate of 2.39 g C·m−2·a−1 from 2000 to 2015 (Ye et al., 2021). The grassland NPP in Inner Mongolia has experienced an increment of 0.89 g C·m−2·a−1 from 2001 to 2018 (Guo et al., 2021). The MODIS NPP product (MOD17A3) showed that from 2000 to 2015, the average annual NPP was 228.2 g C·m−2·a−1 with a slightly volatile increase (Tian et al., 2019). The NPP retrieved by the random forest algorithm showed an increasing trend of 2.37 g C·m−2·a−1 (p = 0.09) in the Hexi Corridor of China between 2002 and 2018 (Li et al., 2021). The NPP showed an increasing rate of 2.35 g C·m−2·a−2 across the Yellow River Basin, which is slightly lower than in the Yangtze River Basin and Hexi Corridor, but the MK test in this research conformed to the change at an extremely significant level.
Climate change influences vegetation ecosystems mostly through changes in temperature, precipitation, and solar radiation, by altering soil moisture, soil microbes, and additionally affecting the photosynthesis and plant respiration, which are further regulated by vegetation growth and ecosystem productivity (Horion et al., 2013; He et al., 2015; Ma et al., 2019). Temperature is the primary climatic factor that controls the inter-annual variation in NPP over most ecosystems, while precipitation may play a different role in different ecosystems (Liang et al., 2015). According to this research, temperature, precipitation, and sunshine hours positively correlate with NPP over 99.6, 87.1, and 24.8% of the research region, respectively. Areas where precipitation shows a positive correlation and sunshine hours show a negative correlation with NPP are mainly located in the western and northern parts of the Yellow River Basin, with an arid climate and covered by vast shrubland, grassland, and desert areas. In arid areas, plant growth is mainly restricted by soil moisture, and lower soil moisture reduces the photosynthetic rate and thus reduces the accumulation of photosynthetic products. In contrast, the correlation between precipitation and NPP rarely reaches a significant level in the eastern and southern parts of the Yellow River Basin, where precipitation is above 600 mm·a−1.
This study analyzed the annual response of NPP to climatic factors during the period 1981–2020. The annual values of temperature, precipitation, and sunshine hours included the occurrence of meteorological disasters. According to the previous research, drought dominates the inter-annual variability in the global terrestrial NPP by controlling semi-arid ecosystems. Soil moisture variability drive 90 percent of inter-annual variability in the global land carbon uptake (Vincent et al., 2021). Drought may have reduced global NPP by 0.55 Pg C from 2000 to 2009. A drying trend decreased NPP in the southern hemisphere (Zhao and Running, 2010), which can explain 29% of the inter-annual variation in the global NPP in semi-arid ecosystems (Huang et al., 2016). Extremely severe meteorological disasters have become more frequent due to climate change. Our study will include the impact of severe flood and drought on the terrestrial ecosystem in future research.
This article analyzed the NPP simulated by the BEPS model and corresponding meteorological data to help understand the spatiotemporal variation of vegetation NPP and its response to climate change. The NPP in the Yellow River Basin showed high values in the mid-south part, while the lowest values were recorded in the northwestern part. The average NPP in the 40 years was 195.3 g C·m−2·a−1 with an extremely significant increasing trend and with an increasing rate of 2.35 g C·m−2·a−2. All of the 11 secondary water resource areas showed increasing trends at an extremely significant level. The spatial distribution of AMT, AP, and ASH showed similar patterns in the Yellow River Basin, with similar values along belts extending from the northeast to the southwest. AMT showed a change slope of 0.0410°C·a−1 in the extremely significant level. AP showed a change slope of 0.7348 mm·a−1, while ASH showed a decreasing rate of −2.9043 h·a−1, both in the nonsignificant level. NPP is mainly positively related with AMT and AP, and negatively related with ASH. The regions where NPP exhibited a positive correlation with AMT, AP, and ASH occupy 99.6, 87.1, and 24.8% of the entire research region, respectively.
The raw data supporting the conclusions of this article will be made available by the authors, without undue reservation.
HT analyzed the spatiotemporal distribution of NPP and meteorological factors and their relationship. XJ calculated yearly values of meteorological factors, and FZ calculated NPP.
This work was supported by the foundation of Key Laboratory of Agro-meteorological Safeguard and Applied Technique China Meteorological Administration (KZ202005).
The authors declare that the research was conducted in the absence of any commercial or financial relationships that could be construed as a potential conflict of interest.
All claims expressed in this article are solely those of the authors and do not necessarily represent those of their affiliated organizations, or those of the publisher, the editors, and the reviewers. Any product that may be evaluated in this article, or claim that may be made by its manufacturer, is not guaranteed or endorsed by the publisher.
Amthor, J. S., Chen, J. M., Clein, J. S., Frolking, S., Goulden, M. L., Carvalhais, N., et al. (2001). Boreal Forest CO2 Exchange and Evapotransporation Predicted by Nine Ecosystems Process Models: Intermodel Comparisons and Relationships to Field Measurements. J. Geophys. Res. Atmos. 106 (D24), 33623–33648. doi:10.1029/2000JD900850
Beer, C., Reichstein, M., Tomelleri, E., Ciais, P., Jung, M., Carvalhais, N., et al. (2010). Terrestrial Gross Carbon Dioxide Uptake: Global Distribution and Covariation with Climate. Science 329, 834–838. doi:10.1126/science.1184984
Chen, H., Bai, X., Li, Y., Li, Q., Wu, L., Chen, F., et al. (2021). Soil Drying Weakens the Positive Effect of Climate Factors on Global Gross Primary Production. Ecol. Indic. 129, 107953. doi:10.1016/j.ecolind.2021.107953
Chen, J. M., Ju, W., Ciais, P., Viovy, N., Liu, R., Liu, Y., et al. (2019). Vegetation Structural Change since 1981 Significantly Enhanced the Terrestrial Carbon Sink. Nat. Commun. 10, 4259. doi:10.1038/s41467-019-12257-8
Chen, J. M., Liu, J., Cihlar, J., and Goulden, M. L. (1999). Daily Canopy Photosynthesis Model through Temporal and Spatial Scaling for Remote Sensing Applications. Ecol. Model. 124, 99–119. doi:10.1016/s0304-3800(99)00156-8
Chen, L., Li, H., Zhang, P., Zhao, X., Zhou, L., Liu, T., et al. (2015). Climate and Native Grassland Vegetation as Drivers of the Community Structures of Shrub-Encroached Grasslands in Inner Mongolia, China. Landsc. Ecol. 30 (9), 1627–1641. doi:10.1007/s10980-014-0044-9
Fang, J., Yu, G., Liu, L., Hu, S., and Chapin, F. S. (2018). Climate Change, Human Impacts, and Carbon Sequestration in China. Proc. Natl. Acad. Sci. U. S. A. 115 (15), 4015–4020. doi:10.1073/pnas.1700304115
Farquhar, G. D., von Caemmerer, S., and Berry, J. A. (1980). A Biochemical Model of Photosynthetic CO2 Assimilation in Leaves of C3 Species. Planta 149, 78–90. doi:10.1007/bf00386231
Gang, C., Zhou, W., Chen, Y., Wang, Z., Sun, Z., Li, J., et al. (2014). Quantitative Assessment of the Contributions of Climate Change and Human Activities on Global Grassland Degradation. Environ. Earth Sci. 72, 4273–4282. doi:10.1007/s12665-014-3322-6
Gao, D., Dan, L., Fan, G., Tian, H., Peng, J., Yang, X., et al. (2020). Spatiotemporal Variations of Carbon Flux and Nitrogen Deposition Flux Linked with Climate Change at the Centennial Scale in China. Sci. China Earth Sci. 63, 731–748. doi:10.1007/s11430-018-9548-3
Guo, D., Song, X., Hu, R., Cai, S., Zhu, X., and Hao, Y. (2021). Grassland Type-dependent Spatiotemporal Characteristics of Productivity in Inner Mongolia and its Response to Climate Factors. Sci. Total Environ. 775, 145644. doi:10.1016/j.scitotenv.2021.145644
Guo, Y., Xia, H., Pan, L., Zhao, X., and Li, R. (2022). Mapping the Northern Limit of Double Cropping Using a Phenology-Based Algorithm and Google Earth Engine. Remote Sens. 14 (4), 1004.
He, Y., Wang, F., MuZhao, X. Y., Yan, H., and Zhao, G. (2015). An Assessment of Human versus Climatic Impacts on Jing River Basin, Loess Plateau, China. Adv. Meteorology 2015, 1–13. doi:10.1155/2015/478739
Horion, S., Cornet, Y., Erpicum, M., and Tychon, B. (2013). Studying Interactions between Climate Variability and Vegetation Dynamic; Using a Phenology Based Approach. Remote Sens. 14, 20–32. doi:10.3390/rs14041004
Huang, L., He, B., Chen, A., Wang, H., Liu, J., Lű, A., et al. (2016). Corrigendum: Drought Dominates the Interannual Variability in Global Terrestrial Net Primary Production by Controlling Semi-arid Ecosystems. Sci. Rep. 6, 35126. doi:10.1038/srep35126
Hunt, E. R., and Running, S. W. (1992). Simulated Dry Matter Yields for Aspen and Spruce Stands in the North American Boreal Forest. Can. J. Remote Sens. 18, 126–133. doi:10.1080/07038992.1992.10855315
Khalifa, M., Elagib, N. A., Ribbe, L., and Schneider, K. (2018). Spatio-temporal Variations in Climate, Primary Productivity and Efficiency of Water and Carbon Use of the Land Cover Types in Sudan and Ethiopia. Sci. Total Environ. 624, 790–806. doi:10.1016/j.scitotenv.2017.12.090
Kimball, J. S., Thornton, P. E., White, M. A., and Running, S. W. (1997). Simulating Forest Productivity and Surface-Atmosphere Carbon Exchange in the BOREAS Study Region. Tree Physiol. 17, 589–599. doi:10.1093/treephys/17.8-9.589
Kong, D., Zhang, Q., Huang, W., and Gu, X. (2017). Vegetation Phenology Change in Tibetan Plateau from 1982 to 2013 and its Related Meteorological Factors. Acta Geogr. Sin. 72 (1), 39–52. (Chinese).
Li, C., Zhu, T., Zhou, M., Yin, H., Wang, Y., Sun, H., et al. (2021). Temporal and Spatial Change of Net Primary Productivity of Vegetation and its Determinants in Hexi Corridor. Acta Ecol. Sin. 41 (5), 1931–1943. (Chinese). doi:10.5846/stxb202001130105
Liang, W., Yang, Y., Fan, D., Guan, H., Zhang, T., Long, D., et al. (2015). Analysis of Spatial and Temporal Patterns of Net Primary Production and Their Climate Controls in China from 1982 to 2010. Agric. For. Meteorology 204, 22–36. doi:10.1016/j.agrformet.2015.01.015
Liu, H., Liu, F., and Zheng, L. (2021). Effects of Climate Change and Human Activities on Vegetation Cover Change in the Yellow River Basin. J. Soil Water Conservation 35 (4), 143–151. (Chinese).
Liu, J., Chen, J., Cihlar, J., and Park, W. M. (1997). A Process-Based Boreal Ecosystem Productivity Simulator Using Remote Sensing Inputs. Remote Sens. Environ. 62, 158–175. doi:10.1016/s0034-4257(97)00089-8
Liu, J., Chen, J. M., Cihlar, J., and Chen, W. (2002). Net Primary Productivity Mapped for Canada at 1-km Resolution. Glob. Ecol. 11, 115–129. doi:10.1046/j.1466-822x.2002.00278.x
Liu, Y., Liu, R., and Chen, J. (2012). Retrospective Retrieval of Long-Term Consistent Global Leaf Area Index (1981-2011) from Combined AVHRR and MODIS Data. J. Geophys. Res. 117 (G4). doi:10.1029/2012jg002084
Liu, Y., Xiao, J., Ju, W., Zhou, Y., Wang, S., and Wu, X. (2015). Water use Efficiency of China’s Terrestrial Ecosystems and Responses to Drought. Sci. Rep. 5. doi:10.1038/srep13799
Liu, Y., Yang, Y., Wang, Q., Khalifa, M., Zhang, Z., Tong, L., et al. (2019). Assessing the Dynamics of Grassland Net Primary Productivity in Response to Climate Change at the Global Scale. Chin. Geogr. Sci. 29 (5), 725–740. doi:10.1007/s11769-019-1063-x
Ma, L., Xia, H., and Meng, Q. (2019). Spatiotemporal Variability of Asymmetric Daytime and Night-Time Warming and its Effects on Vegetation in the Yellow River Basin from 1982 to 2015. Sensors 19, 1832. doi:10.3390/s19081832
IPCC (2021). “Summary for Policymakers,” in Climate Change 2021: The Physical Science Basis. Contribution of Working Group I to the Sixth Assessment Report of the Intergovernmental Panel on Climate Change. Editors V. Masson-Delmotte, P. Zhai, A. Pirani, S. L. Connors, C. Péan, S. Bergeret al. (Cambridge University Press). In Press.
Nie, Q., Xu, J., Li, Z., and Hong, Y. (2012). Spatial-temporal Variation of Vegetation Cover in Yellow River Basin of China during 1998-2008. Sci. Cold Arid Regions 4 (3), 0211–0221. doi:10.3724/SP.J.1226.2012.00211
Niu, W., Xia, H., Wang, R., Pan, L., Meng, Q., Qin, Y., et al. (2021). Research on Large-Scale Urban Shrinkage and Expansion in the Yellow River Affected Area Using Night Light Data. ISPRS Int. J. Geo-Information. 10 (1), 5. doi:10.3390/ijgi10010005
Pan, L., Xia, H., Yang, J., Niu, W., Wang, R., Song, H., et al. (2021a). Mapping Cropping Intensity in Huaihe Basin Using Phenology Algorithm, All Sentinel-2 and Landsat Images in Google Earth Engine. Int. J. Appl. Earth Observation Geoinformation 102, 102376. doi:10.1016/j.jag.2021.102376
Pan, L., Xia, H., Zhao, X., Guo, Y., and Qin, Y. (2021b). Mapping Winter Crops Using a Phenology Algorithm, Time-Series Sentinel-2 and Landsat-7/8 Images, and Google Earth Engine. Remote Sens. 13 (13), 2510. doi:10.3390/rs13132510
Park, H., Jeong, S.-J., Ho, C.-H., Kim, J., Brown, M. E., and Schaepman, M. E. (2015). Nonlinear Response of Vegetation Green-Up to Local Temperature Variations in Temperate and Boreal Forests in the Northern Hemisphere. Remote Sens. Environ. 165 (165), 100–108. doi:10.1016/j.rse.2015.04.030
Piao, S., Ciais, P., Lomas, M., Beerd, C., Liu, H., Fang, J., et al. (2011). Contribution of Climate Change and Rising CO2 to Terrestrial Carbon Balance in East Asia: a Multi-Model Analysis. Glob. Planet. Change 75 (3/4), 133–142. doi:10.1016/j.gloplacha.2010.10.014
Piao, S., Fang, J., Zhou, L., Ciais, P., and Zhu, B. (2006). Variations in Satellite-Derived Phenology in China's Temperate Vegetation. Glob. Change Biol. 12 (4), 672–685. doi:10.1111/j.1365-2486.2006.01123.x
Piao, S., Wang, X., Park, T., Chen, C., Lian, X., He, Y., et al. (2020). Characteristics, Drivers and Feedbacks of Global Greening. Nat. Rev. Earth Environ. 1, 14–27. doi:10.1038/s43017-019-0001-x
Potter, C., Klooster, S., and Genovese, V. (2012). Net Primary Production of Terrestrial Ecosystems from 2000 to 2009. Clim. Change 115 (2), 365–378. doi:10.1007/s10584-012-0460-2
Sun, G., Liu, X., Wang, X., and Li, S. (2021). Changes in Vegetation Cover and its Influencing Factors across the Yellow River Basin during 2001-2020. J. Desert Res. 41 (4), 205–212. (Chinese).
Sun, H., Wang, C., Niu, Z., Bukhosor, , and Li, B. (1998). Analysis of Vegetation Cover Change and the Relationship between NDVI and Environmental Factors by Using NOAA Time Series Data. Jounal Remote Sens. 2 (3), 204–210. (Chinese).
Tian, Z., Zhang, D., He, X., Guo, H., and Wei, H. (2019). Spatiotemporal Variations in Vegetation Net Primary Productivity and Their Driving Factors in Yellow River Basin from 2000 to 2015. Res. Soil Water Conservation 26 (2), 255–262. (Chinese).
Wen, Y., Liu, X., Pei, F., Li, X., and Du, G. (2018). Non-uniform Time-Lag Effects of Terrestrial Vegetation Responses to Asymmetric Warming. Agric. For. Meteorology 252, 130–143. doi:10.1016/j.agrformet.2018.01.016
Wu, D., Zhao, X., Liang, S., Zhou, T., Huang, K., Tang, B., et al. (2015). Time-lag Effects of Global Vegetation Responses to Climate Change. Glob. Change Biol. 21, 3520–3531. doi:10.1111/gcb.12945
Yan, Y., Liu, X., Wen, Y., and Ou, J. (2019). Quantitative Analysis of the Contributions of Climatic and Human Factors to Grassland Productivity in Northern China. Ecol. Indic. 103, 542–553. doi:10.1016/j.ecolind.2019.04.020
Ye, X., Yang, X., Liu, F., Wu, J., and Liu, J. (2021). Spatio-temporal Variations of Land Vegetation Gross Primary Production in the Yangtze River Basin and Correlation with Meteorological Factors. Acta Ecol. Sin. 41 (17), 3–11. (Chinese).
Yuan, L., Jiang, W., Shen, W., Liu, Y., Wang, W., Tao, L., et al. (2013). The Spatio-Temporal Variations of Vegetation Cover in the Yellow River Basin from 2000 to 2010. Acta Ecol. Sin. 339 (24), 7798–7806. (Chinese). doi:10.5846/stxb201305281212
Zhang, F., Ju, W., Shen, S., Wang, S., Yu, G., and Han, S. (2012). Variations of Terrestrial Net Primary Productivity in East Asia. Terr. Atmos. Ocean. Sci. 23 (4), 425–437. doi:10.3319/tao.2012.03.28.01(a)
Zhang, F., Ju, W., Shen, S., Wang, S., Yu, G., and Han, S. (2014). How Recent Climate Change Influences Water Use Efficiency in East Asia. Theor. Appl. Climatol. 116, 359–370. doi:10.1007/s00704-013-0949-2
Zhang, F. M., Ju, W. M., Chen, J. M., Wang, S. Q., Yu, G. R., and Han, S. J. (2012). Characteristics of Terrestrial Ecosystem Primary Productivity in East Asia Based on Remote Sensing and Process-Based Model. Ying Yong Sheng Tai Xue Bao 23 (2), 307–318. (Chinese).
Zhang, Z., Liu, H., Zuo, Q., Yu, J., and Li, Y. (2021). Spatiotemporal Change of Fractional Vegetation Cover in the Yellow River Basin during 2000-2019. Resour. Sci. 43 (4), 849–858. (Chinese). doi:10.18402/resci.2021.04.18
Zhao, M., and Running., S. W. (2010). Drought-Induced Reduction in Global Terrestrial Net Primary Production from 2000 through 2009. Science 329, 940–943. doi:10.1126/science.1192666
Zhao, X., Xia, H., Liu, B., and Jiao, W. (2022). Spatiotemporal Comparison of Drought in Shaanxi-Gansu-Ningxia from 2003 to 2020 Using Various Drought Indices in Google Earth Engine. Remote Sens. 14 (7), 1570. doi:10.3390/rs14071570
Zhao, X., Xia, H., Pan, L., Song, H., Niu, W., Wang, R., et al. (2021a). Drought Monitoring over Yellow River Basin from 2003-2019 Using Reconstructed MODIS Land Surface Temperature in Google Earth Engine. Remote Sens. 13 (18), 3748. doi:10.3390/rs13183748
Zhao, X., Zhang, F., Su, R., Gao, C., and Xing, K. (2021b). Response of Carbon and Water Fluxes to Dryness/wetness in China. Terr. Atmos. Ocean. Sci. 32, 53–67. doi:10.3319/tao.2020.08.25.01
Zhou, S., Zhang, Y., Park Williams, A., and Gentine, P. (2019b). Projected Increases in Intensity, Frequency, and Terrestrial Carbon Costs of Compound Drought and Aridity Events. Sci. Adv. 5 (1), eaau5740. doi:10.1126/sciadv.aau5740
Zhou, S., Williams, A. P., Berg, A. M., Cook, B. I., Zhang, Y., Hagemann, S., et al. (2019a). Land-atmosphere Feedbacks Exacerbate Concurrent Soil Drought and Atmospheric Aridity. Proc. Natl. Acad. Sci. U.S.A. 116 (38), 18848–18853. doi:10.1073/pnas.1904955116
Zhu, W., Pan, Y., Yang, X., and Song, G. (2007a). Comprehensive Analysis of the Impact of Climatic Changes on Chinese Terrestrial Net Primary Productivity. Chin. Sci. Bull. 52 (21), 3250–3260. (Chinese). doi:10.1007/s11434-007-0521-5
Keywords: net primary productivity, climate change, Yellow River Basin, meteorological factors, spatiotemporal analysis
Citation: Tian H, Ji X and Zhang F (2022) Spatiotemporal Variations of Vegetation Net Primary Productivity and Its Response to Meteorological Factors Across the Yellow River Basin During the Period 1981–2020. Front. Environ. Sci. 10:949564. doi: 10.3389/fenvs.2022.949564
Received: 21 May 2022; Accepted: 06 June 2022;
Published: 22 July 2022.
Edited by:
Xinyao Xie, Institute of Mountain Hazards and Environment (CAS), ChinaCopyright © 2022 Tian, Ji and Zhang. This is an open-access article distributed under the terms of the Creative Commons Attribution License (CC BY). The use, distribution or reproduction in other forums is permitted, provided the original author(s) and the copyright owner(s) are credited and that the original publication in this journal is cited, in accordance with accepted academic practice. No use, distribution or reproduction is permitted which does not comply with these terms.
*Correspondence: Xingjie Ji, aml4aW5namllMjAwNEAgYWxpeXVuLmNvbQ==; Fangmin Zhang, Zm1pbi56aGFuZ0BudWlzdC5lZHUuY24=
Disclaimer: All claims expressed in this article are solely those of the authors and do not necessarily represent those of their affiliated organizations, or those of the publisher, the editors and the reviewers. Any product that may be evaluated in this article or claim that may be made by its manufacturer is not guaranteed or endorsed by the publisher.
Research integrity at Frontiers
Learn more about the work of our research integrity team to safeguard the quality of each article we publish.