 Dongli Hou1
 Xiang Zhang1*Jiangwei Zhao1Jie Qiang1Jianguo Wang1Peng Wang1Qingxian An1
 Yang Wang2,3Liwei Wang1Shihui Yuan1Feng Zhang1*
- 1Hebei Province Ecology Environmental Monitoring Center, Shijiazhuang, China
- 2School of Geographical Sciences, Hebei Normal University, Shijiazhuang, China
- 3State Key Joint Laboratory of Environmental Simulation and Pollution Control, Beijing, China
Black carbon (BC), also termed elemental carbon (EC), is a strong light-absorbing substance. It can disturb the radiation balance between the earth and atmosphere resulting in changing regional and global climate conditions. This study conducted a thorough analysis of EC in Hebei during different seasons and provided comprehensive EC emission data in the Beijing–Tianjin–Hebei (BTH) region for future policy making connected with air pollution mitigation and control. The results showed that the concentration of EC during the sampling period varied from 0.01 to 18.4 μg/m3 with a mean value of 2.6 ± 2.8 μg/m3. The EC source apportionment exercise identified four regular emission sources for all seasons, including traffic-related emissions, coal combustion, biomass burning, and mineral dust. Annually, traffic-related emissions were the primary EC contributor with an annual average contribution of 38%, followed by biomass burning (30%) and coal combustion (25%). In addition, the EC mass concentration at Shijiazhuang was also influenced by diverse pollutants from upwind regions. This study shows that traffic emissions are a major contributor to EC mass concentration in Shangjiazhuang and highlights that regional joint control of air pollution is important to local air quality.
1 Introduction
Black carbon (BC), also termed elemental carbon (EC), is a strong light-absorbing substance, and based on the thermal detection method, it also embraces elemental carbon (EC) (Bond et al., 2013). BC can disturb the radiation balance between the earth and atmosphere resulting in changes to regional and global climate conditions (IPCC, 2021). BC can go through an aging process in the atmosphere, by mixing with other substances and through chemical reactions. It alters optical properties such as the light-absorbing ability (Bond et al., 2013). At different heights in the atmosphere, BC exerts different climatic effects. BC heats the atmosphere, while by contrast, it cools the earth’s surface. This could also impact the planetary boundary height and could, therefore, worsen regional pollution levels (Wang et al., 2018). Furthermore, BC also could exert adverse impacts on human health (Geng et al., 2013; Ji et al., 2019a).
The sources of BC can be classified into natural and anthropogenic sources. Natural sources include natural phenomena such as volcanic eruptions and forest fires, but compared with anthropogenic sources, natural sources have little effect on the long-term changes in the concentration of black carbon aerosols due to their low occurrence since the industrial revolution. Fossil fuels such as coal and petroleum are the major fossil fuel sources. Biomass burning in rural regions also plays an important role in the global BC inventory (Bond et al., 2013).
Two methods are widely used for identifying the emission sources of BC. One is an offline method, namely, collecting samples in the field and using laboratory analysis such as the 14C method, to identify the sources (Li et al., 2016). The 14C method can provide a good level of accuracy in the results, but limitations, such as high cost and a minimum sample loading required for analysis, hinder its promotion. Another method uses mathematical models such as the Aethalometer (AE) model and a receptor model to apportion BC into its various sources based on its optical features and chemical composition (Rajesh and Ramachandran, 2017; Wang et al., 2020; Liu et al., 2021). Compared with the 14C method, mathematical models are not restricted by sample loadings because online data are also applicable. However, regarding the Aethalometer model, the resultant accuracy heavily depends on the optical parameters used in the model (Zotter et al., 2017). Most studies’ optical parameters (Healy et al., 2017; Zhu et al., 2017; Helin et al., 2018) such as the absorption Ångström exponent (AAE) are based on the literature. However, optical parameters are highly variable depending on combustion conditions and the characteristics of the sources (Tian et al., 2019). Thus, there may be uncertainty in using the AE model if the specific parameters are unknown.
A quarter of BC emissions in the world was reported from China (Streets et al., 2001). Previous studies have shown that BC emissions in the BTH region were high (Zhang et al., 2009). Ji et al. (2019a) noted that even though a number of policies on pollution control were active in the BTH region, EC mass concentrations remained high in 2017. A recent study showed that the maximum daily PM2.5 in BTH can reach 150 μg/m3 (Zhang et al., 2022), which exceeds the threshold of PM2.5 high pollution level. BC contribution to PM2.5 pollution was not negligible (Ji et al., 2017; Ji et al., 2019b). A further analysis of EC and organic carbon (OC) showed that they were highly correlated, indicating they were from the same source (Zhang et al., 2022).
Mao et al. (2020) used a combined method to calculate different source contributions to BC in the atmosphere from 2013 to 2017. The results showed that most pollution happened during winter and the most severe cases were found in the heating season due to residential heating, followed by vehicle emissions. However, due to the clean energy policies introduced and replacing coal combustion with clean energy, both OC and EC have declined since 2017. One study reported that compared with 2017, the mass concentration of EC in the BTH region during 2019 declined from 4.7 μg/m3 to 3 μg/m3, mainly due to banning coal combustion (Ji et al., 2022). Regarding regional emission loads in BTH, Liu et al. (2018) found that Hebei was the most important emission source for BC, which contributed 55% and 49% of the EC mass concentration in Beijing and Tianjin cities, respectively. Xiao et al. (2021) conducted a BC source apportionment in Beijing, which revealed that coal combustion, liquid fuel combustion, and biomass burning were the top three BC sources. Combustion of coal and liquid fuel contributed about 82%, with coal combustion making a higher contribution during winter and spring, while liquid fuel had a higher contribution during summer and autumn.
Although much research has been conducted in BTH, few studies have focused on annual source apportionment in Hebei which has been found to be a major source of pollution in other cities like Beijing and Tianjing as noted above. Thus, this study aims to present a thorough analysis of BC in Hebei during different seasons and provide comprehensive BC emission data in the BTH region for future policy-making on air pollution mitigation and control.
2 Materials and Methods
2.1 Sampling Site and Data Collection
Hebei Province has 11 cities in total but the urbanization level is not high compared with other mega cities in BHT, reaching 60% in 2020, and the rural area infrastructure is not well-developed. According to the China Energy Statistics Yearbook of 2018, energy consumption in Hebei was about 67% of the total energy consumption of the BTH region, indicating a significant level of pollution in the province. Shijiazhuang City is the provincial capital city of Hebei which has 18 districts and counties. The sampling site was at Hebei University of Economics and Business (114°30′7″, 38°8′23″, Figure 1). River passes by the sampling site (∼1.5 km away) at the Northeast. Major highways surround the sampling site and the city center is located south of the city. A total of 2951 data points were collected with an hourly resolution during 2020, in January, April, July, and October. The online data include EC, OC, K+, Mg2+, Ca2+, Cl−, and the elements (Si, K, Ca, Ti, Mn, Fe, As, Se, Br, Ba, Pb, and Zn).
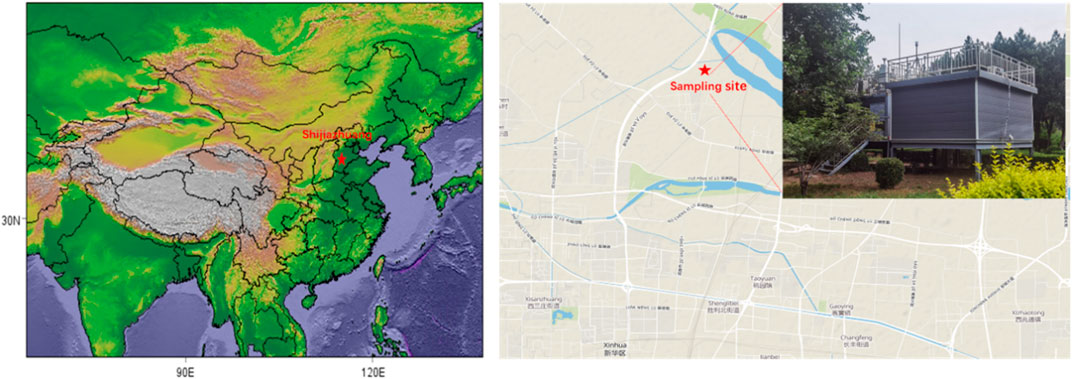
FIGURE 1. The sampling site of this study.
2.2 Online Measurement
2.2.1 Online OCEC Analyzing
OC and EC were analyzed by using a discontinuous thermal-optical transmittance (TOT) based OC/EC analyzer (RT-4, Sunset Laboratory Inc., Tigard, Oregon, United States). The samples were placed on quartz filters and heated step by step in a non-oxidizing environment of helium (He), where OC is volatilized. In the process, a portion of OC is carbonized into pyrolyzed carbon (OP). The EC is oxidized and decomposes into gaseous oxides under an oxygen mixture (He/O2) environment where the temperature will be increased gradually. Quantitative inspection was carried out using the ion flame method (FID) and the non-infrared dispersion method (NDIR). During this process, a laser beam was irradiated on the quartz film, so that the intensity of the transmitted light of the laser gradually weakens when OC is carbonized. The transmitted light of the laser will gradually increase when PC and EC decompose in the He/O2 environment. When the intensity of the transmitted light returns to the initial value, this moment is defined as the OC/EC split point, which means that the amount of carbon detected before this moment is defined as the initial OC and the amount of carbon detected thereafter corresponds to the starting EC. The detection ranges of OC and EC are between 5 and 400 µg/cm2 and 1 and 15 μg/cm2. The minimum detection limit is 0.2 μg/cm2. The maintenance and calibration were strictly performed according to a Standard Operating Procedure issued by China National Environmental Monitoring Center (http://www.cnemc.cn/jcgf/dqhj/202112/t20211223_965048.shtml, in Chinese).
2.2.2 Online Ion Analyzing
An ion chromatography analyzer (URG9000D, ThermoFisher Scientific (China), Shanghai, China) was used to measure the ions levels in PM2.5 at a sampling flow of 16.67 L/min. The URG gas sampling device utilizes a wet parallel plate diffusion dissolver and adopts a gas-selective permeability membrane technology. Gaseous pollutants in the air can pass through the membrane into the absorption liquid channel and react with hydrogen peroxide. The kinetic principle of the process is a redox reaction, which ensures the complete absorption of gaseous pollutants. Wet parallel plate diffusion dissolvers can effectively absorb gaseous pollutants in the atmosphere. Absorption efficiency was tested using a permeation tube to generate 1 ppmv of SO2, and 5 mM H2O2 was used as the absorption solution in the dissolver. The maintenance and calibration were strictly performed according to a Standard Operating Procedure issued by China National Environmental Monitoring Center (http://www.cnemc.cn/jcgf/dqhj/202112/t20211223_965048.shtml, in Chinese).
2.2.3 Online Elemental Analyzing
The elements were measured by using an online analyzer for atmospheric heavy metals (XHAM-2000A, Hebei Sailhero Environmental Protection High-tech Co., Ltd., Shijiazhuang, Hebei, China), which was used to measure the element levels in PM2.5 at a sampling flow of 16.67 L/min. The monitor collects samples through reel-to-reel (RTR) filter paper strips and performs non-destructive analysis of particles deposited on the filter paper strips by X-ray fluorescence spectroscopy (XRF). The ambient air is sampled by the particle size cutter and drawn onto the filter paper belt. The collected samples are automatically transported to the detection position and the selected metal elements are analyzed using XRF technology. The next sample is taken when the previous sample is being analyzed. Sampling and analysis are performed synchronously and continuously, except during filter tape transport (approximately 20 s). During the study period, daily automatic quality checks are carried out on a regular basis. The maintenance and calibration were strictly performed according to a Standard Operating Procedure issued by China National Environmental Monitoring Center (http://www.cnemc.cn/jcgf/dqhj/202112/t20211223_965048.shtml, in Chinese).
2.2.4 Source Apportionment
EC source apportionment in this study was conducted by using the positive matrix factorization (PMF) model. PMF was developed by Paatero and Tapper (1994). This method has non-negative constraints and optimizes the error estimation of the input data. The input data matrix is divided into a factor profile matrix (F) and factor contribution (G) matrix through the following equation:
where
PMF solves F and G by finding the global minimum Q value with the following equation:
where
2.2.5 Trajectory Cluster Analysis
Trajectories over 72 h and 50 m above the ground over 4 months were calculated using the Hybrid Single-Particle Lagrangian Integrated Trajectory model (HYSPLIT). The HYSPLIT model is a widely used air-mass trajectory model (Draxler and Hess, 1998). To understand the regional transport impacts on the study site, cluster analysis was applied to the 72 h air mass trajectories. The cluster method used an angle-based distance calculation method, the calculation equations being as follows (Wang et al., 2018):
where
2.2.6 Potential Source Contribution
To estimate the potential contribution from regional transport, the potential source contribution function (PSCF) was applied to detect the possible contribution regions to EC in Shijiazhuang. High PSCF values indicate that high EC emissions were transported to the study site. The PSCF value of every grid was calculated using the following equation:
where mij denotes endpoints associated with EC concentration which is higher than the criterion set in the model and nij is the total endpoints of the grid cell. The 75th percentiles of EC from different sources were set as the threshold value of pollution.
To reduce uncertainties caused by a low nij value, arbitrary weighting factors (wij) were used during the calculation of PSCF. The values and criteria were taken from the work of Polissar et al. (2001):
3 Results and Discussion
3.1 Observed Concentrations of EC
Figure 2 illustrates the concentrations of EC and OC as well as the ratio of OC/EC in four different months, January, April, July, and October. The concentration of EC during the sampling period varied from 0.01 to 18.4 μg/m3 with a mean value of 2.6 ± 2.8 μg/m3 (Table 1). It was much lower than the average annual EC concentration in Shijiazhuang, from December 2016 to November 2017 (5.4 ± 6.5 μg/m3, Ji et al., 2019a). It could be due to a positive effect of air pollution control actions launched in the BTJ region. The concentration is close to the EC concentration measured in Beijing (3.4 ± 2.3 μg/m3) from September 2017 to August 2018. Similar to EC, OC in Shijiazhuang was significantly lower compared with the value reported from December 2016 to November 2017. The concentration of OC during the sampling period varied from 0.04 to 50.7 μg/m3 with a mean concentration of 9.5 ± 9.4 μg/m3, which was about 58% lower than the OC measured in December 2016—November 2017 (22.8 ± 30.6 μg/m3, Ji et al., 2019a) and also was lower than that established in the 4-month average. The ratio of OC/EC was 4.7 ± 2.4 from 2016 to 2017. The reduced ratio of OC/EC (4.2 ± 3.0) indicates that from 2017 to 2020, OC in Shijiazhuang has decreased slightly faster than EC. This could be caused by the changed contribution ratios of different emission sources.
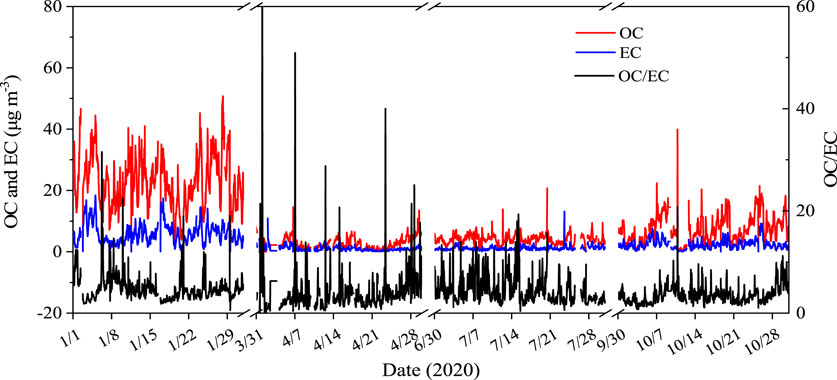
FIGURE 2. Time series over 4 months for EC, OC, and the OC/EC ratio.
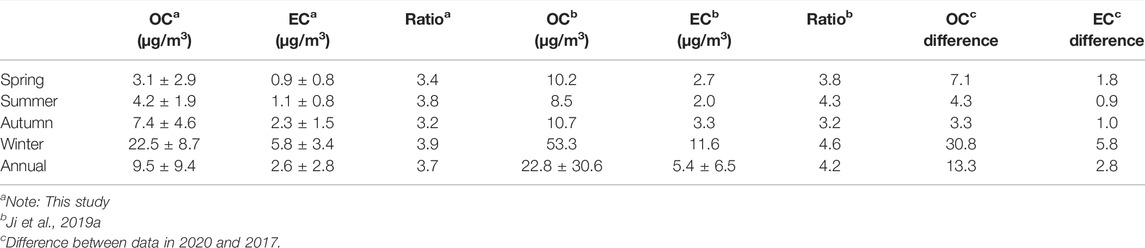
TABLE 1. Concentrations of OC, EC, and the ratio of OC/EC.
Focusing on the variation among different seasons, the concentrations of OC and EC were 22.5 ± 8.7 μg/m3 and 5.8 ± 3.4 μg/m3 in January; 3.1 ± 2.9 μg/m3 and 0.9 ± 0.8 μg/m3 in April; 4.2 ± 1.9 μg/m3 and 1.1 ± 0.8 μg/m3 in July; and 7.4 ± 4.6 μg/m3 and 2.3 ± 1.5 μg/m3 in October. The data showed that OC and EC in January were much higher compared with those measured in other seasons. The mass concentration of OC and EC displayed a similar variation pattern over the 4-month period, in the order January > October > July > April, representing higher concentrations in winter and autumn, while lower concentrations occurred in spring and summer. This is consistent with the pattern reported in a previous study (Ji et al., 2019a). Even though the concentrations in winter in 2020 were still the highest of all seasons, the concentration of both OC and EC has been declining significantly, by 52% and 49%, respectively (Table 1), compared with winter in 2016–2017. Immediately after the concentration decrease in winter, the decrease in OC and EC in spring was the second largest among the four seasons with a reduction of 7.1 μg/m3 and 1.8 μg/m3, respectively. This was followed by decreases in summer and autumn, the concentrations of OC and EC declining by varying degrees, suggesting that the Three-Year Action Plan to Fight Air Pollution since 2018 has worked well in terms of improving air quality.
The diurnal variations over the four seasons demonstrate different patterns. As shown in Figure 3A, during winter, the diurnal variation in OC presented high values in the morning and night and low values in the afternoon. EC showed a similar diurnal pattern to OC during winter and a good correlation between OC and EC (R2 = 0.54, p < 0.1) during winter. This indicates that the majority of OC and EC emissions were likely from the same sources during the winter. However, although the patterns were similar, the hourly mass concentration changes in OC and EC were not in proportion, therefore the ratio of OC/EC varied greatly on a daily basis. The ratio was high in the afternoon and much lower at night. This phenomenon was possibly influenced by meteorological conditions, and less secondary OC was generated at night due to the weak solar radiation and temperature.
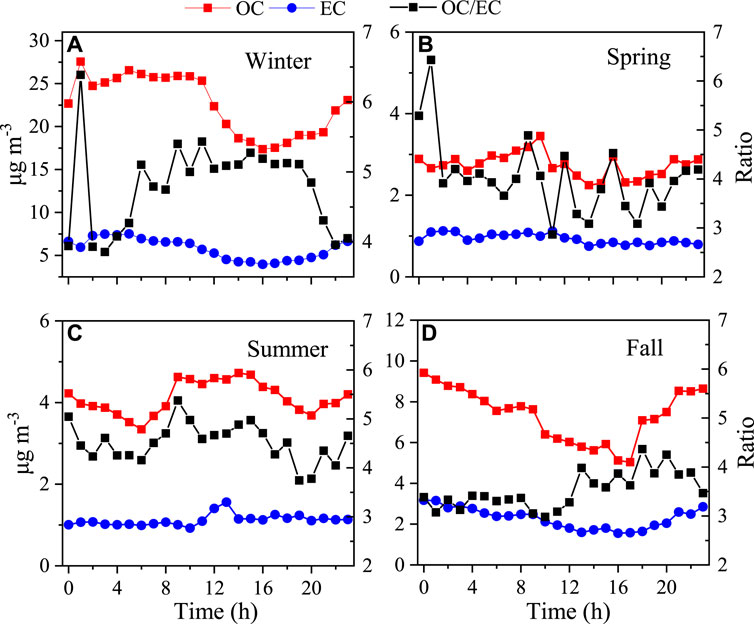
FIGURE 3. Diurnal variations in OC, EC, and the OC/EC ratios in the four seasons of the year.
Unlike the variation patterns in winter, a clear OC rise was found in spring from 7 to 10 am (Figure 3B) which could be caused by traffic emissions. Another rise was found from 18:00 h to 23:00 h which was likely caused by the evening traffic peak and nocturnal planetary boundary layer height (PBLH). With residential heating demand declining in spring, the mass concentration of EC was low at night which is opposite to that in the winter season. The fluctuation of the OC/EC ratio was more frequent than in winter, particularly during daytime, which could be caused by a combination of more varied meteorological conditions and more diverse emission sources. In addition, OC and EC were found weakly correlated (R2 = 0.25, p < 0.1) in spring.
In summer, as presented in Figure 3C, OC decreased from midnight to 6:00 h then rose dramatically to 9:00 h and remained stable to 15:00 h. From 16:00 h to 20:00 h, OC decreased again and then rose to 23:00 h. By contrast, the diurnal variation in EC only fluctuated slightly except from 10:00 h to 14:00 h. This indicates that large quantities of OC and EC emissions may not be from the same source, which can also be confirmed by the weak correlation between OC and EC (R2 = 0.14, p < 0.1).
Similar to winter, the correlation between OC and EC was relatively higher (R2 = 0.57, p < 0.1) in the autumn season, indicating that the majority of OC and EC were from the same source. The diurnal variations in OC and EC were almost identical (Figure 3D), showing a continuous decrease from midnight to 17:00 h with a small peak at 9:00 h, which was likely formed by the morning traffic peak. From 18:00 h to 23:00 h, the concentration of OC and EC kept rising. This could be caused by the pollution accumulation due to the poor dispersion conditions at night and the evening traffic peak around 19:00 h.
3.2 Source Apportionment of EC in Different Seasons
Five sources of EC were identified by PMF during wintertime shown in Figure 4. The first factor was characterized by high loadings of Ca2+ (86%), Si (48%), and Ti (43%), widely recognized as associated with mineral dust (Tao et al., 2017; Liu et al., 2021). This factor barely contributed to EC during winter. The second factor showed relatively high loadings of K+ (32%) and Br (51%). K+ is a widely recognized marker of biomass burning (Zhao et al., 2021) and a considerable amount of Br is found in biomass burning due to the CH3Br generated in the combustion process (Manö and Andreae, 1994; Artaxo et al., 1998). Thus, this factor was considered to be biomass burning which contributed 19% of EC during winter. The third factor presented a large amount of Mn (81%), Fe (49%), and Zn (43%). Mn is often used as a smoke suppression agent and an additive in vehicles to protect the engine (Lewis et al., 2003). Zn and Fe are widely found in braking and lubricating oil (Alander et al., 2005; Thorpe and Harrison, 2008). In addition, as shown, this factor contributed a noticeable amount of EC (36%), which is consistent with previous studies (Cao et al., 2013). In addition, the diel variation in EC from this factor showed two peaks in morning and evening in traffic busy hours (Supplementary Figure S1). Thus, this factor was identified as traffic-related emissions. The fourth factor showed high loadings of K+ (53%), Mg2+(72%), Ti (50%), and Ba (64%). K+, Mg, and Ba are abundant in fireworks (Li et al., 2013; Yadav et al., 2019). Furthermore, EC contributed by this factor was only found to be significant from 24 January 2020 to 29 January 2020, which happened to be the Chinese New Year. Thus, this factor was likely to be the result of firework displays. The last factor was characterized by high loadings of As (43%) and Pb (30%). According to previous studies, high loadings of As and Pb are found in coal combustion (Tan et al., 2017; Liu et al., 2021). Thus, this factor was recognized as resulting from coal combustion which contributed 35% of EC.
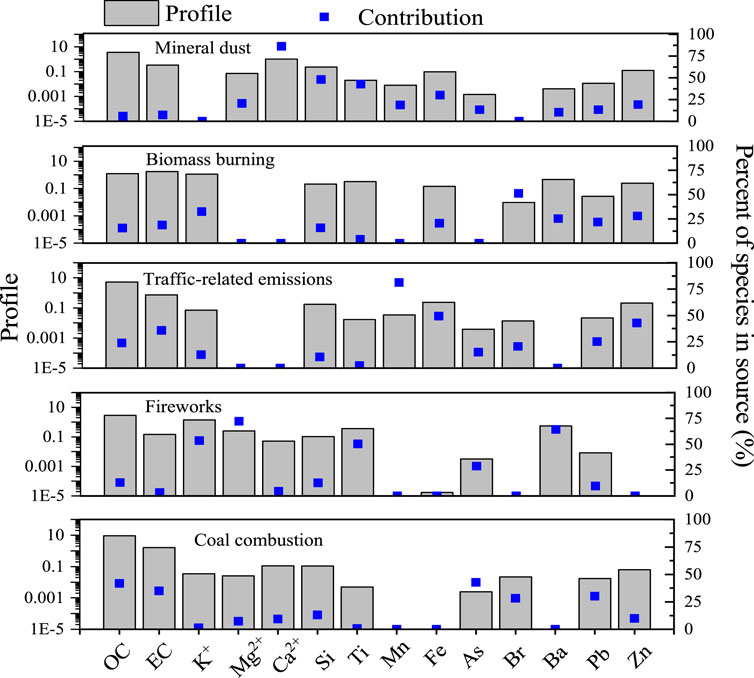
FIGURE 4. Source apportionment of EC in winter.
Different from the January results, four factors were identified in spring (Figure 5). The first one is associated with high loadings of Si (49%), Ca (66%), Ti (55%), and Fe (58%). Thus, this factor stemmed from mineral dust. The second factor showed high loadings of Cl− (64%), Br (87%), and K (43%). Previous research has reported that Cl− is also considered a marker of biomass burning (Urban et al., 2012; Zhao et al., 2021). At the same time, levels of OC and EC were also high in this factor with contributions of 38% and 48%, respectively. Thus, this factor was identified as stemming from biomass burning. The third factor is characterized by high loadings of Mn (48%), Zn (90%), and Pb (59%). As explained before, Mn and Zn are commonly found in traffic-related emissions. Although China phased out Pb-containing petroleum, research still finds an alarming amount of Pb associated with vehicular emissions (Xu et al., 2016), and the diel variation showed two peaks in morning and evening in traffic busy hours (Supplementary Figure S1). Therefore, this factor is deemed to be caused by traffic-related emissions, the factor contributing 16% of total EC. The last factor contained relatively higher amount of As (41%), Ti (39%), and EC (35%). As mentioned above, As is widely considered as a marker of coal combustion. Previous studies (e.g., Ji et al., 2019a) showed that coal combustion contributed a considerable amount of EC in Shijiazhuang City. In addition to the abundant amount of Ti found in mineral dust, in urban areas, Ti is also found in manufacturing industries. This factor is likely to be coal combustion for industrial activities, the factor contributing 35% of EC.
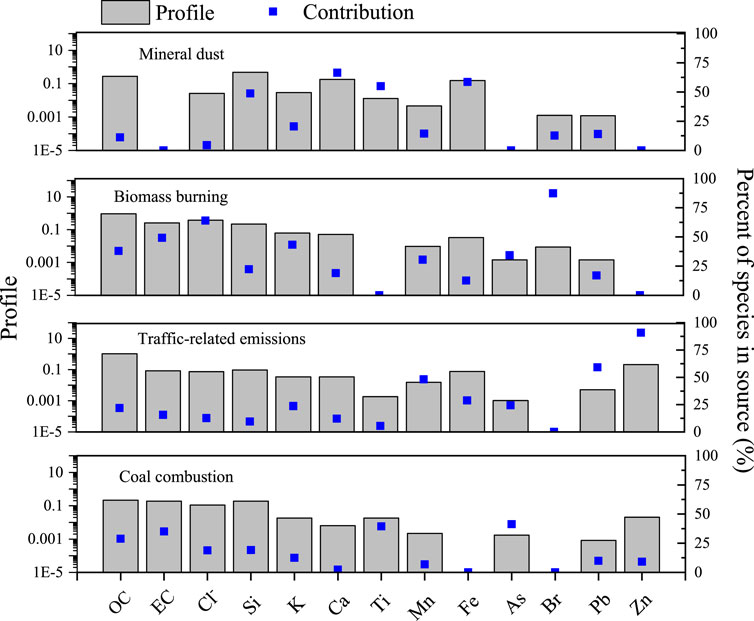
FIGURE 5. Source apportionment of EC in spring.
Source apportionment for EC during summer also showed four major contributors (Figure 6). The first source showed high loadings of Cl− (62%), K+ (67%), and Br (59%). Meanwhile, this factor contains moderate loadings of OC (39%) and EC (41%), which are commonly found in the emissions from biomass burning (Cao et al., 2013). Thus, this factor was identified as biomass burning. The second factor demonstrated a considerable amount of As (66%) and Se (45%). According to Tan et al. (2017), high loadings of Se are also found in coal combustion. As a result, this factor was identified as coal combustion, contributing 10% of EC. The third factor is characterized by a high loading of Mn (78%) and Zn (54%) with a moderate loading of Fe (38%). Furthermore, moderate amounts of OC and EC were found in this factor and the loading of EC was higher than that for OC, which fits the feature of vehicle emissions (Cao et al., 2013), so does the EC diel variation in this factor (Supplementary Figure S2). Thus, this factor was recognized as traffic-related emissions with 35% contributed as EC. The last factor showed high loadings of Ca2+ (71%), Si (46%), and Ti (50%), thus, this factor was interpreted as mineral dust. Some 14% of EC was found in this factor which could be due to the resuspension of the deposited EC from other perturbations such as vehicle driving and wind.

FIGURE 6. Source apportionment of EC in summer.
Similar to the source apportionment results in summer, source apportionment of EC during autumn showed four major contributing factors (Figure 7). The first factor profile showed high loadings of Mg2+ (80%), Ca2+ (93%), and Si (67%), which indicate mineral dust for this factor. This factor only contributed 6% of EC. The second factor presented a high amount of As (44%), Se (59%), and Pb (59%). As mentioned earlier, these are widely used markers of coal combustion. Thus, this factor is coal combustion, which contributed 19% of EC. The third factor is characterized by high loadings of OC (71%), EC (65%), Mn (48%), Fe (39%), and Zn (56%). These are typical elements reflecting vehicular emissions which can be verified by the EC diel variation (Supplementary Figure S2). The last factor contained high loadings of Cl− (64%) and K+ (71%) and a moderate amount of Br (41%), and is recognized as biomass burning with a 10% contribution to EC.
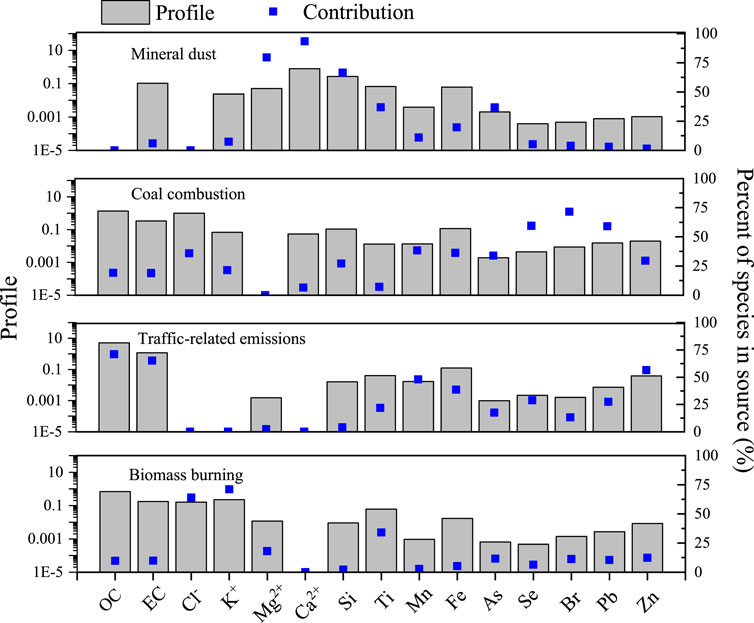
FIGURE 7. Source apportionment of EC in autumn.
The contributions of the regular four sources varied in different seasons possibly due to the change in meteorological conditions and the variation in emission intensity, although there was a variation in the contribution of different sources in different seasons, traffic-related emissions were the primary EC contributor with an annual averaged contribution of 38% followed by biomass burning (30%) and coal combustion (25%). The contribution of the same source varied greatly in different seasons. As listed in Table 2, a significant amount of EC was contributed by traffic-related emissions in autumn (65%), but much less in spring (16%). Biomass burning contributed a considerable amount of EC in spring (48%) and summer (41%), but a relatively small amount in autumn (10%) and winter (19%). This indicates open fires (Supplementary Figure S2) might be the primary emission source for biomass burning instead of residential combustion. By contrast, coal combustion was a major contributor of EC in spring (35%) and winter (35%), which suggests coal combustion could be the primary energy source for residential heating. The contribution from mineral dust varied less dramatically compared with other identified sources, and comparatively speaking, it contributed more in summer. Fireworks were only found to contribute to EC in winter during the Chinese New Year.
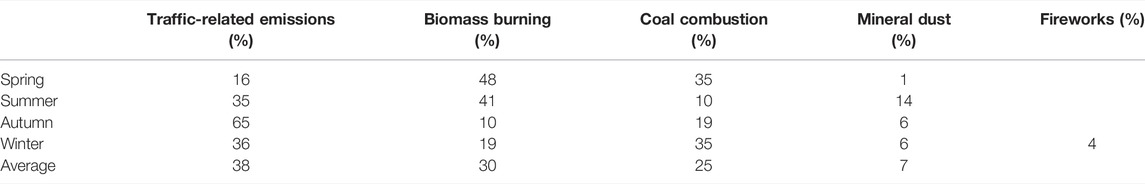
TABLE 2. Source contributions to EC in different seasons.
3.3 Trajectory Cluster Analysis
Air flow on the one hand can disperse pollutants but on the other, can carry pollutants from upwind regions. Thus, to establish the influence of air masses from different directions in different seasons, 72 h back trajectories of air masses were calculated during the study period on an hourly basis. A cluster analysis was then conducted based on those calculated trajectories. The results showed (Figure 8) that air masses were mainly from four clusters but the trajectory contribution ratios varied across the four seasons. As shown in Figure 8A, during winter, Cluster No. 3 contains 33% of the total trajectories from a northerly direction. The origin of the air mass 72 h earlier was near the boundary of inner Mongolia. Cluster No. 2 contains 27% of the total trajectories. The origin of Cluster No. 2 was in Shanxi Province and Cluster No. 4 (25%) originated in Hebei Province, passing through Tianjin city. Cluster No. 1 (15%) was also from Hebei Province but the cluster trajectory showed that it was from a northerly direction and close to that province.
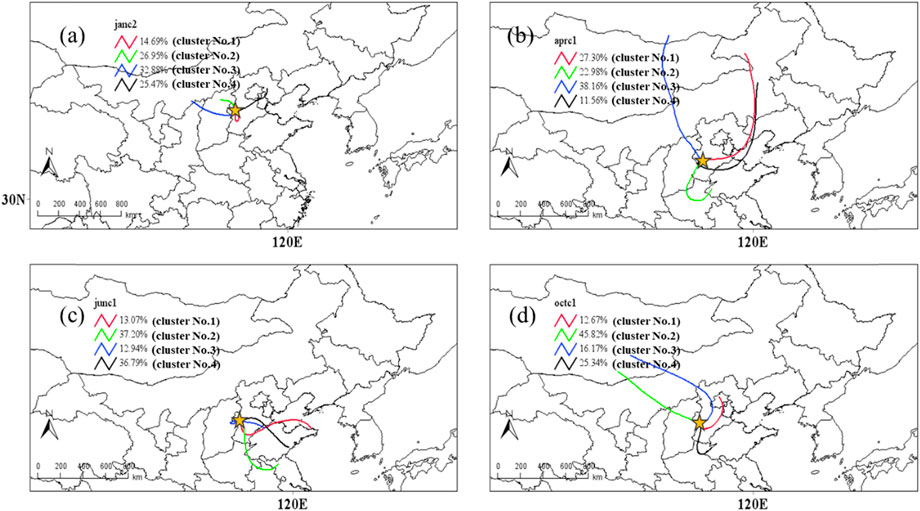
FIGURE 8. The cluster analysis of the trajectories in (A) winter, (B) spring, (C) summer, and (D) autumn.
In contrast with winter, most of the trajectories in spring were from a northerly direction. As shown in Figure8B, 77% of total trajectories were from the north, and 38% of total trajectories originated from outside of China (Cluster No. 3). Of the total trajectories, 39% originated from inner Mongolia (Cluster No. 1 and No. 4). The remaining 23% of trajectories were from Shandong Province (Cluster No.2), passing through Henan Province. During summer, the air mass trajectories were mainly from an easterly direction. As presented in Figure 8C, three of four clusters originated in Shandong Province, clearly an important source region. The origin of Cluster No. 1 was very close to the Huanghai Sea coastline. This cluster contains 13% of the total trajectories. Cluster No. 4 has 37% of the total trajectories and Cluster No. 3 has 13%. The remaining cluster (Cluster No. 2) was from Jiangsu Province containing 37% of the total trajectories. Similar to winter, in autumn, the major trajectories were from a northwest direction, originating outside China (Figure 8D). Mongolia accounted for 72% of the total trajectories (Cluster No. 2 and No. 3). Some 25% of the total trajectories originate from Shandong Province (Cluster No. 4) and 13% of total trajectories originated from Beijing City (Cluster No. 1).
3.4 Potential Source Region Identification
EC mass concentration is not only influenced by local emissions but also by regional transport. Given the different air mass directions in different seasons, the variations in EC concentration throughout the seasons can be partially ascribed to regional transport. Thus, potential contribution sources were analyzed based on the PSCF results shown in Figure 9.
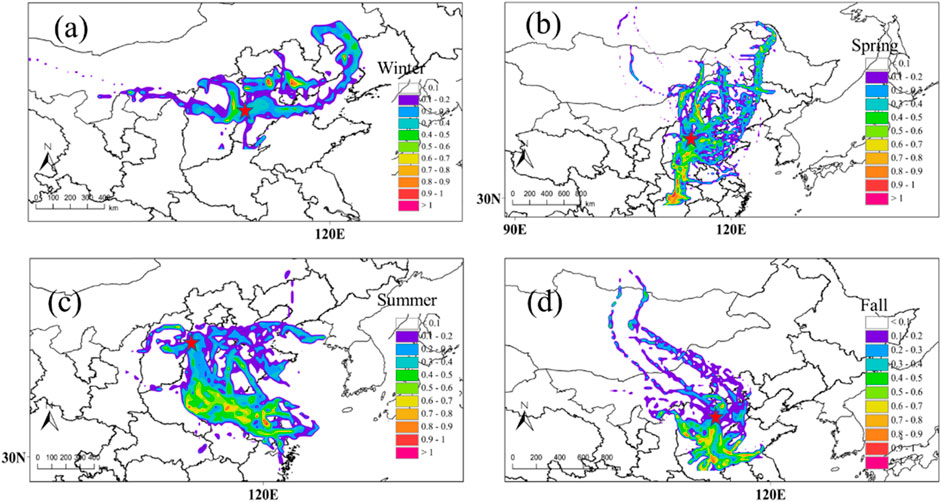
FIGURE 9. Potential source regions for EC in Shijiazhuang in (A) winter, (B) spring, (C) summer, and (D) autumn. The color bar represents PSCF probability. The color circles denote the sampling site.
As shown in Figure 9A, in winter, the highest potential sources were mainly in the northeast, particular in Beijing and its western region. Although there were policies launched to mitigate air pollution in the BTJ region, as indicated by PSCF, the surrounding regions of Beijing were still potential EC sources. In addition, near the sampling site, Shanxi province also has moderate potential to contribute EC in Shijiazhuang. This could be due to the high consumption and production of coal in Shanxi province, particularly in winter due to the demand for residential heating (Zhang et al., 2014). Much further away, Liaoning and Inner Mongolia could also be potential source areas in winter since coal-fired power plants in north China are mainly located in Inner Mongolia, Shanxi, and Shaanxi provinces (Ji et al., 2019a). In comparison with the surrounding regions, the contribution of EC from Shijiazhuang, itself, showed a moderate potential in winter.
Different from the distribution of the potential EC sources identified in winter, the strongest potential contribution of EC to the sampling site changed to the southern regions, mainly from Hubei, Hunan, and Guizhou provinces in spring (Figure 9B). In the north, Shanxi province and Inner Mongolia could also contribute EC to Shijiazhuang when the air mass flow is from a northerly direction. Zhang et al. (2014) conducted an energy survey in Guizhou households and found about 60% of the rural households in Guizhou burned crops on the farmland for fertilizing the land. Coal and firewood were the primary energy sources for residential use in Guizhou. In addition, burning on non-cultivated land was found to be high during spring in north, northeast, and southeast Hubei (Shen et al., 2021). Thus, the high potential contribution to Shijiazhuang from the north in spring could be caused by rural residential energy consumption and open fires (Supplementary Figure S2). This, to a degree, could also explain the high biomass burning levels and coal combustion contributions found in source apportionment in spring, compared with those in other seasons.
In summer, the potential contribution sources changed to Henan, Anhui, and Jiangsu provinces (Figure 9C). This is likely associated with the southeast prevailing wind in summer and is consistent with the increased nitrate concentration in Beijing in August found in East China (Ying et al., 2014). Based on Yao et al. (2021), this could be attributed to Henan, since it is one of the largest energy-consuming provinces in China, where coal combustion and biomass burning are the major sources of pollution. Additionally, according to the emission inventory for Jiangsu (Zhou et al., 2017), on-road and non-road transportation contributed notable amounts of EC. Similar to the PSCF revealed in summer, Henan and Aihui were identified as the most likely source of the high contribution to EC concentrations in Shijiazhuang during autumn (Figure 9D).
4 Conclusion
The concentration of EC during the sampling period varied from 0.01 to 18.4 μg/m3 with a mean value of 2.6 ± 2.8 μg/m3. The concentration of OC during the sampling period varied from 0.04 to 50.7 μg/m3 with a mean concentration of 9.5 ± 9.4 μg/m3. Both EC and OC were found to be higher in winter and autumn while lower concentrations occurred in spring and summer. The diurnal variations in OC/EC in different seasons indicate the varied contributions from different sources in the four seasons. Winter and autumn presented high mass concentrations of EC and OC during the night, likely due to residential heating and nocturnal PBLH. The EC source apportionment identified four regular emission sources for all seasons: traffic-related emissions, coal combustion, biomass burning, and mineral dust. However, due to the celebration of Chinese New Year Festival, one more emission source was found in winter, which was fireworks. The contributions of the regular four sources varied in different seasons possibly due to changes in meteorological conditions and variations in emission intensity. Annually, traffic-related emissions were the primary EC contributor with an annual average contribution of 38% followed by biomass burning (30%) and coal combustion (25%). The primary source of EC differed according to the season. A significant amount of EC was contributed by vehicle emissions in the autumn (65%) while a considerable amount of EC originated from biomass burning in spring (49%) and summer (41%). Coal combustion was a major contributor of EC in the spring (35%) and winter (35%). In addition to local emission changes, the trajectory cluster analysis and PSCF results indicated that the EC mass concentration in Shijiazhuang was also influenced by a variety of pollutants from upwind regions. In winter, the north China region showed high PSCF values likely due to the coal-fired power plants located there. In spring, high values of PSCF were found in the southwest region near to Shijiazhuang because of extensive firewood burning and open fires (Supplementary Figure S2) in the rural regions. In summer and autumn, high PSCF values were found in the south and southeast area of Shijiazhuang, where transportation contributed notable amounts of EC. This study shows that in general, traffic-related emissions are a major contributor to EC mass concentration in Shangjiazhuang, with emissions in the surrounding cites likely worsen EC pollution in the receptor site. It thus highlights how important regional joint control of air pollution is to local air quality.
Data Availability Statement
The original contributions presented in the study are included in the article/Supplementary Material; further inquiries can be directed to the corresponding authors.
Author Contributions
Data curation: DH, XZ, JZ, JW, and FZ; formal analysis: PW and QA; funding acquisition: YW; investigation: JQ and Liwei Liu; methodology: XZ, YW, SY, and FZ; software: JQ; and writing—original draft: DH and JZ.
Funding
This project was supported by the special fund of the State Key Joint Laboratory of Environmental Simulation and Pollution Control (Grant No. 22K03ESPCP).
Conflict of Interest
The authors declare that the research was conducted in the absence of any commercial or financial relationships that could be construed as a potential conflict of interest.
Publisher’s Note
All claims expressed in this article are solely those of the authors and do not necessarily represent those of their affiliated organizations, or those of the publisher, the editors, and the reviewers. Any product that may be evaluated in this article, or claim that may be made by its manufacturer, is not guaranteed or endorsed by the publisher.
References
Alander, T., Antikainen, E., Raunemaa, T., Elonen, E., Rautiola, A., and Torkkell, K. (2005). Particle Emissions from a Small Two-Stroke Engine: Effects of Fuel, Lubricating Oil, and Exhaust Aftertreatment on Particle Characteristics. Aerosol Sci. Technol. 39 (2), 151–161. doi:10.1080/027868290910224
Artaxo, P., Fernandas, E. T., Martins, J. V., Yamasoe, M. A., Hobbs, P. V., Maenhaut, W., et al. (1998). Large-scale Aerosol Source Apportionment in Amazonia. J. Geophys. Res. 103, 31837–31847. doi:10.1029/98jd02346
Bond, T. C., Doherty, S. J., Fahey, D. W., Forster, P. M., Berntsen, T., DeAngelo, B. J., et al. (2013). Bounding the Role of Black Carbon in the Climate System: A Scientific Assessment. J. Geophys. Res. Atmos. 118, 5380–5552. doi:10.1002/jgrd.50171
Cao, J.-J., Zhu, C.-S., Tie, X.-X., Geng, F.-H., Xu, H.-M., Ho, S. S. H., et al. (2013). Characteristics and Sources of Carbonaceous Aerosols from Shanghai, China. Atmos. Chem. Phys. 13, 803–817. doi:10.5194/acp-13-803-2013
Draxler, R., and Hess, G. (1998). An Overview of the HYSPLIT_4 Modelling System for Trajectories. Aust. Meteorol. Mag. 47, 295–308.
Geng, F., Hua, J., Mu, Z., Peng, L., Xu, X., Chen, R., et al. (2013). Differentiating the Associations of Black Carbon and Fine Particle with Daily Mortality in a Chinese City. Environ. Res. 120, 27–32. doi:10.1016/j.envres.2012.08.007
Healy, R. M., Sofowote, U., Su, Y., Debosz, J., Noble, M., Jeong, C.-H., et al. (2017). Ambient Measurements and Source Apportionment of Fossil Fuel and Biomass Burning Black Carbon in Ontario. Atmos. Environ. 161, 34–47. doi:10.1016/j.atmosenv.2017.04.034
Helin, A., Niemi, J. V., Virkkula, A., Pirjola, L., Teinilä, K., Backman, J., et al. (2018). Characteristics and Source Apportionment of Black Carbon in the Helsinki Metropolitan Area, Finland. Atmos. Environ. 190, 87–98. doi:10.1016/j.atmosenv.2018.07.022
IPCC (2021). Climate Change 2021: The Physical Science Basis. Contribution of Working Group I to the Sixth Assessment Report of the Intergovernmental Panel on Climate Change. Report.
Ji, D., Gao, M., MaenhautHe, W., He, J., Wu, C., Cheng, L., et al. (2019a). The Carbonaceous Aerosol Levels Still Remain a Challenge in the Beijing-Tianjin-Hebei Region of China: Insights from Continuous High Temporal Resolution Measurements in Multiple Cities. Environ. Int. 126, 171–183. doi:10.1016/j.envint.2019.02.034
Ji, D., Gao, W., Maenhaut, W., He, J., Wang, Z., Li, J., et al. (2019b). Impact of Air Pollution Control Measures and Regional Transport on Carbonaceous Aerosols in Fine Particulate Matter in Urban Beijing, China: Insights Gained from Long-Term Measurement. Atmos. Chem. Phys. 19, 8569–8590. doi:10.5194/acp-19-8569-2019
Ji, D., Li, J., Shen, G., He, J., Gao, W., Tao, J., et al. (2022). Environmental Effects of China's Coal Ban Policy: Results from In Situ Observations and Model Analysis in a Typical Rural Area of the Beijing-Tianjin-Hebei Region, China. Atmos. Res. 268, 106015. doi:10.1016/j.atmosres.2022.106015
Ji, D., Li, L., Pang, B., Xue, P., Wang, L., Wu, Y., et al. (2017). Characterization of Black Carbon in an Urban-Rural Fringe Area of Beijing. Environ. Pollut. 223, 524–534. doi:10.1016/j.envpol.2017.01.055
Lewis, C. W., Norris, G. A., Conner, T. L., and Henry, R. C. (2003). Source Apportionment of Phoenix PM2.5Aerosol with the Unmix Receptor Model. J. Air & Waste Manag. Assoc. 53 (3), 325–338. doi:10.1080/10473289.2003.10466155
Li, C., Bosch, C., Kang, S., AnderssonChenZhang, A. P. Q., ChenChen, P. B., Zhang, Q., et al. (2016). Sources of Black Carbon to the Himalayan-Tibetan Plateau Glaciers. Nat. Commun. 7, 12574. doi:10.1038/ncomms12574
Li, W., Shi, Z., Yan, C., Yang, L., Dong, C., and Wang, W. (2013). Individual Metal-Bearing Particles in a Regional Haze Caused by Firecracker and Firework Emissions. Sci. Total Environ. 443, 464–469. doi:10.1016/j.scitotenv.2012.10.109
Liu, H., Wang, Q., Ye, J., Su, X., Zhang, T., Zhang, Y., et al. (2021). Changes in Source‐Specific Black Carbon Aerosol and the Induced Radiative Effects Due to the COVID‐19 Lockdown. Geophys Res. Lett. 48, e2021GL092987. doi:10.1029/2021GL092987
Liu, X. Y., He, K. B., Zhang, Q., Lu, Z. F., Wang, S. W., Zhang, Y. X., et al. (2018). Analysis of the Origins of Black Carbon and Carbon Monoxide Transported to Beijing, Tianjin, and Hebei in China. Sci. Total Environ. 653, 1364–1376. doi:10.1016/j.scitotenv.2018.09.274
Manö, S., and Andreae, M. O. (1994). Emission of Methyl Bromide from Biomass Burning. Science 263, 1255–1257. doi:10.1126/science.263.5151.1255
Mao, Y. H., Zhao, X., Liao, H., Zhao, D., Tian, P., Henze, D. K., et al. (2020). Sources of Black Carbon during Severe Haze Events in the Beijing-Tianjin-Hebei Region Using the Adjoint Method. Sci. Total Environ. 740, 140149. doi:10.1016/j.scitotenv.2020.140149
Paatero, P., and Tapper, U. (1994). Positive Matrix Factorization: A Non-negative Factor Model with Optimal Utilization of Error Estimates of Data Values. Environmetrics 5 (2), 111–126. doi:10.1002/env.3170050203
Polissar, A. V., Hopke, P. K., and Harris, J. M. (2001). Source Regions for Atmospheric Aerosol Measured at Barrow, Alaska. Environ. Sci. Technol. 35, 4214–4226. doi:10.1021/es0107529
Rajesh, T. A., and Ramachandran, S. (2017). Characteristics and Source Apportionment of Black Carbon Aerosols over an Urban Site. Environ. Sci. Pollut. Res. 24 (9), 8411–8424. doi:10.1007/s11356-017-8453-3
Shen, Y., Jiang, C., Chan, K. L., Hu, C., and Yao, L. (2021). Estimation of Field-Level NOx Emissions from Crop Residue Burning Using Remote Sensing Data: A Case Study in Hubei, China. Remote Sens. 13, 404. doi:10.3390/rs13030404
Streets, D. G., Gupta, S., Waldhoff, S. T., Wang, M. Q., Bond, T. C., and Yiyun, B. (2001). Black Carbon Emissions in China. Atmos. Environ. 35, 4281–4296. doi:10.1016/S1352-2310(01)00179-0
Tan, J., ZhangZhou, L. X., ZhouLi, X. Y., Duan, J., Li, Y., Hu, J., et al. (2017). Chemical Characteristics and Source Apportionment of PM 2.5 in Lanzhou, China. Sci. Total Environ. 601-602, 1743–1752. doi:10.1016/j.scitotenv.2017.06.050
Tao, J., Zhang, L., Cao, J., Zhong, L., Chen, D., Yang, Y., et al. (2017). Source Apportionment of PM2.5 at Urban and Suburban Areas of the Pearl River Delta Region, South China - with Emphasis on Ship Emissions. Sci. Total Environ. 574, 1559–1570. doi:10.1016/j.scitotenv.2016.08.175
Thorpe, A., and Harrison, R. M. (2008). Sources and Properties of Non-exhaust Particulate Matter from Road Traffic: A Review. Sci. Total Environ. 400 (1-3), 270–282. doi:10.1016/j.scitotenv.2008.06.007
Tian, J., Wang, Q., Ni, H., Wang, M., Zhou, Y., Han, Y., et al. (2019). Emission Characteristics of Primary Brown Carbon Absorption from Biomass and Coal Burning: Development of an Optical Emission Inventory for China. J. Geophys. Res.-Atmos. 124, 1879–1893. doi:10.1016/10.1029/2018jd029352
Urban, R. C., Lima-Souza, M., Caetano-Silva, L., Queiroz, M. E. C., Nogueira, R. F. P., Allen, A. G., et al. (2012). Use of Levoglucosan, Potassium, and Water-Soluble Organic Carbon to Characterize the Origins of Biomass-Burning Aerosols. Atmos. Environ. 61, 562–569. doi:10.1016/j.atmosenv.2012.07.082
Wang, Q., Cao, J., Han, Y., Tian, J., Zhu, C., Zhang, Y., et al. (2018). Sources and Physicochemical Characteristics of Black Carbon Aerosol from the Southeastern Tibetan Plateau: Internal Mixing Enhances Light Absorption. Atmos. Chem. Phys. 18, 4639–4656. doi:10.5194/acp-18-4639-2018
Wang, Q., Liu, H., Wang, P., Dai, W., Zhang, T., Zhao, Y., et al. (2020). Optical Source Apportionment and Radiative Effect of Light-Absorbing Carbonaceous Aerosols in a Tropical Marine Monsoon Climate Zone: the Importance of Ship Emissions. Atmos. Chem. Phys. 20, 15537–15549. doi:10.5194/acp-20-15537-2020
Wang, Y. Q., Zhang, X. Y., and Draxler, R. R. (2009). TrajStat: GIS-Based Software that Uses Various Trajectory Statistical Analysis Methods to Identify Potential Sources from Long-Term Air Pollution Measurement Data. Environ. Model. Softw. 24, 938–939. doi:10.1016/j.envsoft.2009.01.004
Xiao, H.-W., Huang, L.-L., Xiao, H.-Y., Wu, J.-F., and Wu, J. (2021). Evaluation of Black Carbon Source Apportionment Based on One Year's Daily Observations in Beijing. Sci. Total Environ. 773, 145668. doi:10.1016/j.scitotenv.2021.145668
Xu, H., Cao, J., Chow, J. C., Huang, R.-J., Shen, Z., Chen, L. W. A., et al. (2016). Inter-annual Variability of Wintertime PM 2.5 Chemical Composition in Xi'an, China: Evidences of Changing Source Emissions. Sci. Total Environ. 545-546, 546–555. doi:10.1016/j.scitotenv.2015.12.070
Yadav, S. K., Kumar, M., Sharma, Y., Shukla, P., Singh, R. S., and Banerjee, T. (2019). Temporal Evolution of Submicron Particles during Extreme Fireworks. Environ. Monit. Assess. 191, 191–576. doi:10.1007/s10661-019-7735-2
Yao, R., Li, Z., Zhang, Y., Wang, J., Zhang, S., and Xu, H. (2021). Spatiotemporal Evolution of PM2.5 Concentrations and Source Apportionment in Henan Province, China. Pol. J. Environ. Stud. 30 (5), 4815–4826. doi:10.15244/pjoes/132639
Ying, Q., Wu, L., and Zhang, H. (2014). Local and Inter-regional Contributions to PM2.5 Nitrate and Sulfate in China. Atmos. Environ. 94, 582–592. doi:10.1016/j.atmosenv.2014.05.078
Zhang, Q., Streets, D. G., Carmichael, G. R., He, K. B., Huo, H., Kannari, A., et al. (2009). Asian Emissions in 2006 for the NASA INTEX-B Mission. Atmos. Chem. Phys. 9, 5131–5153. doi:10.5194/acp-9-5131-2009
Zhang, R., Wei, T., Glomsrød, S., and Shi, Q. (2014). Bioenergy Consumption in Rural China: Evidence from a Survey in Three Provinces. Energy Policy 75, 136–145. doi:10.1016/j.enpol.2014.08.036
Zhang, X., Zhang, Z., Xiao, Z., Tang, G., Li, H., Gao, R., et al. (2022). Heavy Haze Pollution during the COVID-19 Lockdown in the Beijing-Tianjin-Hebei Region, China. J. Environ. Sci. 114, 170–178. doi:10.1016/j.jes.2021.08.030
Zhao, S., Tian, H., Luo, L., Liu, H., Wu, B., Liu, S., et al. (2021). Temporal Variation Characteristics and Source Apportionment of Metal Elements in PM2.5 in Urban Beijing during 2018-2019. Environ. Pollut. 268, 115856. doi:10.1016/j.envpol.2020.115856
Zhou, Y., Zhao, Y., Mao, P., Zhang, Q., Zhang, J., Qiu, L., et al. (2017). Development of a High-Resolution Emission Inventory and its Evaluation and Application through Air Quality Modeling for Jiangsu Province, China. Atmos. Chem. Phys. 17, 211–233. doi:10.5194/acp-17-211-2017
Zhu, C.-S., Cao, J.-J., Hu, T.-F., Shen, Z.-X., Tie, X.-X., Huang, H., et al. (2017). Spectral Dependence of Aerosol Light Absorption at an Urban and a Remote Site over the Tibetan Plateau. Sci. Total Environ. 590-591, 14–21. doi:10.1016/j.scitotenv.2017.03.057
Zotter, P., Herich, H., Gysel, M., El-Haddad, I., Zhang, Y., Močnik, G., et al. (2017). Evaluation of the Absorption Ångström Exponents for Traffic and Wood Burning in the Aethalometer-Based Source Apportionment Using Radiocarbon Measurements of Ambient Aerosol. Atmos. Chem. Phys. 17, 4229–4249. doi:10.5194/acp-17-4229-2017
Keywords: elemental carbon, source apportionment, Hebei, different seasons, online measurement
Citation: Hou D, Zhang X, Zhao J, Qiang J, Wang J, Wang P, An Q, Wang Y, Wang L, Yuan S and Zhang F (2022) Source Apportionment of Elemental Carbon in Different Seasons in Hebei, China. Front. Environ. Sci. 10:949504. doi: 10.3389/fenvs.2022.949504
Received: 21 May 2022; Accepted: 23 June 2022;
Published: 31 August 2022.
Edited by:
Qiyuan Wang, Institute of Earth Environment (CAS), ChinaReviewed by:
Zhuzi Zhao, Jiangsu University of Technology, ChinaGuangxuan Yan, Henan Normal University, China
Copyright © 2022 Hou, Zhang, Zhao, Qiang, Wang, Wang, An, Wang, Wang, Yuan and Zhang. This is an open-access article distributed under the terms of the Creative Commons Attribution License (CC BY). The use, distribution or reproduction in other forums is permitted, provided the original author(s) and the copyright owner(s) are credited and that the original publication in this journal is cited, in accordance with accepted academic practice. No use, distribution or reproduction is permitted which does not comply with these terms.
*Correspondence: Xiang Zhang, MTQ0MzU3ODAwMkBxcS5jb20=; Feng Zhang, aGJzemRxc0AxMjYuY29t