 Vyacheslav Polyakov
 Andrei Kartoziia
 Timur Nizamutdinov
 Wenjuan Wang
 Evgeny Abakumov
95% of researchers rate our articles as excellent or good
Learn more about the work of our research integrity team to safeguard the quality of each article we publish.
Find out more
ORIGINAL RESEARCH article
Front. Environ. Sci. , 08 September 2022
Sec. Environmental Informatics and Remote Sensing
Volume 10 - 2022 | https://doi.org/10.3389/fenvs.2022.948367
This article is part of the Research Topic Permafrost Environment Changes in a Warming Climate View all 12 articles
Soil-geomorphological mapping is a reliable tool for analyzing the patterns of soil distribution in various parts of Earth’s surface. Cryogenic and watershed areas are the most dynamic landscapes with relatively rapid transformation under the influence of climate change and river activity. The soil-geomorphological map obtained by unmanned aerial vehicle (UAV) imaging, classical soil sections, geomorphological observation, and determination of the main chemical parameters of soils are presented. Mapping of the spatial distribution was performed using QGIS 3.22, SAGA GIS 7.9.1, and ArcGIS 10.6 software. The investigation of soil cover was performed according to WRB soil classification. From the obtained data, four types of soils were identified due to their position in the relief and chemical parameters. The dominant soil type is Folic Cryosol (Siltic) (41.1%) which is formed on the periglacial landscape of wet polygons on Samoylov Island. The application of high-resolution UAV imaging to construct soil-geomorphological maps is the most relevant method for analyzing soils formed in cryogenic, watershed, and mountainous landscapes. Based on SOC distribution, it was found that the highest SOC content corresponds to Holocene terrace (Cryosol and Histosol soil types), in areas that are not subject to the flooding process. According to the analysis of the chemical composition of soils, it was found that the main elements accumulating in the soil are SiO2, Al2O3, CaO, and K2O, which have a river origin. The soil-geomorphological maps can be used to analyze the reserves and contents of organic and inorganic components with high accuracy.
Soil organic carbon (SOC) is the organic remains in the soil after the partial decomposition of any material produced by microorganisms and plant remnants (Jones et al., 2010). The SOM supports the key functions of the soil, as it is crucial for stabilizing the structure of the soil, retaining and releasing nutrients for plants, and ensuring the penetration of water and its storage in the soil (Schepaschenko et al., 2013). Soils represent the largest surface reservoir of organic carbon (Schuur et al., 2015). Due to the local geology, climatic conditions, and land use and management (among other environmental factors), soils retain a different amount of SOC (Lefèvre et al., 2017). It is estimated that the largest amount of SOC is stored in the northern permafrost region with over 1024 Pg (1 Pg = 1 × 10¹³ kg) of organic carbon in the soil in a layer of up to 3 m, as well as 34 Pg of nitrogen (Zubrzycki et al., 2013; Zubrzycki et al., 2014), mainly in Histosol. The permafrost-affected zone occupies an area of more than 8.6 million km2, which is about 27% of soil cover above 50°N (Jones et al., 2010). They accumulate in themselves a huge amount of organic carbon, so they are considered one of the most important elements of the cryosphere (Zubrzycki et al., 2014). There, carbon is accumulated in soils in huge quantities due to low temperatures, leading to low biological activity and slow decomposition of SOM. The presence of permafrost and long-term freezing of soils has a strong influence on the processes of ion exchange, the water-physical regime, the solubility of nutrients and their availability for plants, and bioproductivity in general (Polyakov and Abakumov, 2020).
The Arctic is the most poorly investigated zone in the world. In Russia, the Murmansk region (Evdokimova and Mozgova, 2001; Dvornikov et al., 2021), the Yamal Nenets Autonomous Okrug (Ji et al., 2019; Nizamutdinov et al., 2021), some areas of Yakutia (Desyatkin et al., 2021; Polyakov et al., 2021) are well studied. The Canadian and American Arctic have local studies of natural permafrost systems (Bölter and Wetzel, 2006; Ping et al., 2008; Tarnocai and Bockheim, 2011). The Svalbard archipelago is well studied (Iavid et al., 2018; Hanaka et al., 2019), but the Russian northern islands are practically uninvestigated (Bogorodskii et al., 2018). Arctic zone research is aimed at studying anthropogenically transformed landscapes (cities and industrial zones) (Dymov et al., 2013). This is due to certain difficulties in logistical operations in the North, as well as severe weather conditions. However, based on the distribution of organic matter, the largest reserves are concentrated in the northern regions of the world (Zubrzycki et al., 2014). The northern regions, in addition to the presence of high reserves of organic matter, are characterized by complex topography and a network of large rivers and channels, which makes it difficult to carry out fieldwork in these regions. A large hydrographic network leads to the development of erosion processes, and degradation of permafrost and soil cover (Ardelean et al., 2020). Soil mapping based on landscape elements and the geological structure of Quaternary rocks, which began back in 1940–1960, showed that this is a powerful mechanism for studying soil cover and soil formation features (Nauman et al., 2022).
The founders of soil mapping were Dokuchaev in 1899 and Jenny in 1941 (Florinsky, 2016). Dokuchaev presented the method of soil mapping based on the soil organic content of the European part of Russia at a scale of 1: 4.2 million. In the 1990s, several researchers (Moore et al., 1993; Gessler et al., 1995) proposed to use in the mapping of soils the combination of soil attributes and soil-forming factors, or environmental factors. With the development of computers and statistical methods processing, it was possible to predict soil parameters with an autocorrelation error. The method is based on the assumption that from a relatively small, but statistically representative sample of measurements of a soil characteristic, it is possible to restore the behavior of characters within a certain territory (field, island, catchment) (McBratney et al., 2003; Scull et al., 2003). The objects of forecasting are the morphological, physical, chemical, and biological properties of soils. The presence of a statistical relationship between soil and morphometric characteristics can be explained by the fact that the quantitative characteristics of the relief affect the course and direction of many natural processes (Moore et al., 1991; Florinsky, 1998). A high correlation of a particular soil characteristic with the curvature of the earth’s surface may indicate that this soil characteristic depends on the degree of convergence of surface and subsoil flows of moisture and substances dissolved or suspended in it.
On a global scale, there is growing interest in assessing and mapping the SOC pool and its potential for altering carbon sequestration at lower spatial resolutions and large geographic scales (Lamichhane et al., 2019). In addition, the United Nations Convention to Combat Desertification (UNCCD), which is an indicator of the goal of the Sustainable Development Agency 15.3.1, recognized the SOC reserve map as an indicator for assessing the area of degraded land in the context of achieving neutral land degradation (IUCN, 2015). Soil mapping has long been widely used all over the world, and with the development of GIS technologies, the development of digital mapping has leaped forward (Castaldi et al., 2019; Lupachev et al., 2020; Padilha et al., 2020). However, such maps describe and predict SOM stocks rather well on large areas of land, while local heterogeneities are left without due attention (Scull et al., 2003; Lamichhane et al., 2019).
The identification of soil areas based on geomorphological units is a powerful mechanism for refining existing soil and geomorphological maps (Nauman et al., 2022). For the Arctic, this research method is especially relevant, because the difficult accessibility of many regions hinders research activities (Ardelean et al., 2020). For example, in the Lena River Delta, only the central part has been well studied, while the northern part remains practically inaccessible to researchers (Knoblauch et al., 2013; Zubrzycki et al., 2014). The use of unmanned aerial vehicles for surveying the terrain, the allocation of geomorphological units together with soil studies in a landscape setting similar in structure will make it possible to create soil-geomorphological maps of high accuracy. Meanwhile, the determination of the main chemical parameters of soils will make it possible to predict the stocks of various chemicals. Here, we have proposed a soil-geomorphological map, which is based on geomorphological characteristics using UAV orthophoto maps and a digital elevation model. A further comparison of landscape units and soil observation with analyzing soil chemical parameters will make it possible with a high degree of probability to determine soil cover in the most dynamic areas of the land (Lupachev et al., 2020). This research method is most relevant in mountainous, watersheds, as well as landscapes exposed to the influence of permafrost and active erosion processes. Thus, this work aims to provide a soil-geomorphological map of Samoylov Island, the Lena River Delta.
The Lena River Delta is the largest northern delta in the world, which is located in the Arctic zone and has an area of about 30.00 km2 (Kravtsova and Mit’kinykh, 2011). Due to such a huge area and location, it has a significant impact on the water regime of the Arctic Ocean, since a large amount of freshwater flows from the delta into the least salty ocean on our planet (Figure 1). The delta was formed as a result of river activity: sediment removal, erosion, and abrasion under the influence of sea level fluctuations and the movement of the earth’s crust (Bolshiyanov et al., 2013).
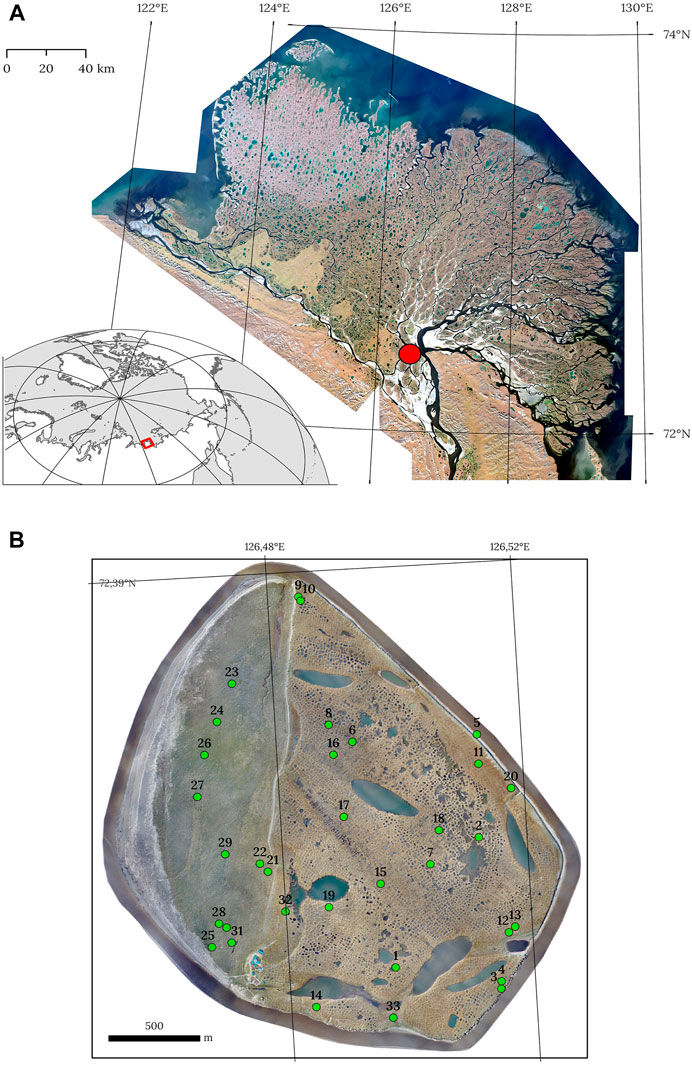
FIGURE 1. Study area. (A) Location of Samoylov Island (red square) in a mosaic of satellite Sentinel-2 images of the Lena Delta; (B) orthophoto map mosaic of Samoylov Island with observation points.
The Lena River Delta is located in a zone with an Arctic continental climate. The average annual air temperature is −13°С, the average January temperature drops to −32°С, and the average July temperature is 6.5°С. Annual precipitation is 190 mm. The Lena River Delta is covered with various types of tundra vegetation. The main components are lichens, mosses, grasses (cereals and sedges), and some types of shrubs (Kutzbach et al., 2004; Schneider et al., 2009; Boike et al., 2013; Boike et al., 2019).
The key area of work is Samoylov Island (N 72.370 E 126.467), which is located in the area of the first terrace and is periodically flooded by river waters. The island covers an area of about 5 km2. The western part is formed by recent alluvial processes. The eastern part is represented by small thermokarst lakes, ponds, and polygonal tundra. The parent rocks on the island are Holocene alluvial sands.
Soil sampling took place as part of the Lena Delta expedition 2018–2021. The soils were selected based on their position in the landscape, the water content in the area, and the change in vegetation cover. The selection and description of soils were carried out according to the international soil classification WRB (2015). On Samoylov Island, according to the previously proposed geomorphological map and the identification of the main geomorphological units, soil samples were taken (Kartoziia, 2019). To clarify the boundaries of soil areas, soil pits were made for which the analysis of chemical indicators was not carried out; therefore, they were not included in Figure 1. Thus, it was possible to cover a significant area of the island and refine the geomorphological map. To analyze the main physicochemical parameters, 33 soil samples were collected from different landscape positions. More than 60 soil test pits were made to clarify the boundaries of the soil ranges. Upper soil horizons A 5 (10)-30 (35) cm were used to analyze physicochemical parameters. The upper organogenic horizon O was not used in the analysis of physicochemical parameters. The color analysis was carried out according to the international classification Soil color chart (Munsell, 2010), and morphological parameters were determined according to the international classification Guidelines for soil description (WRB, 2015). The redox potential was taken into account by the color features of soil horizons and the presence of liquid suprapermafrost moisture. The studied soils are presented in Figure 2.
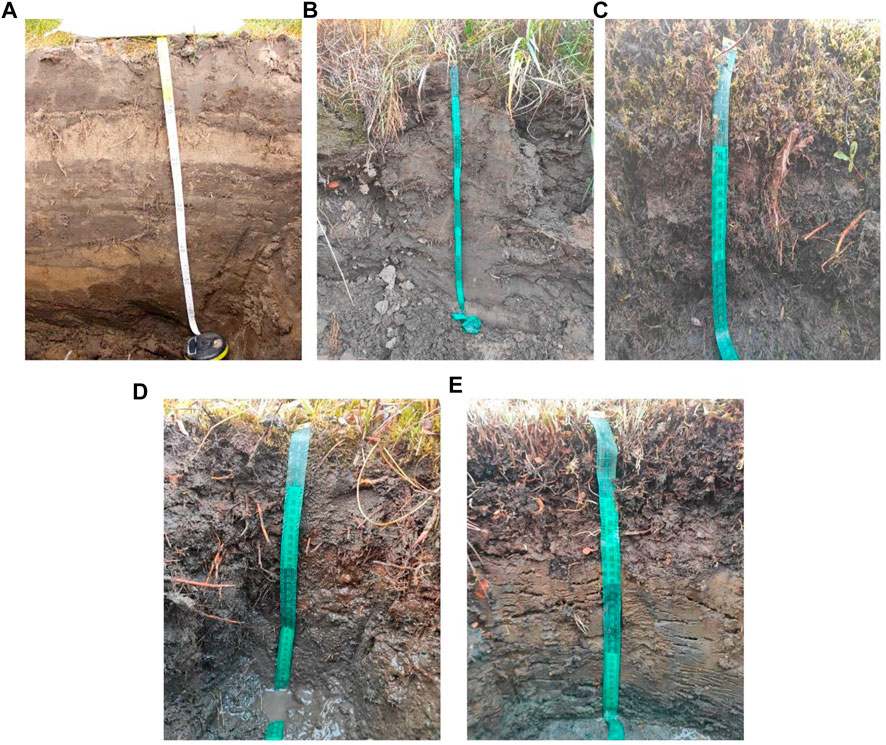
FIGURE 2. Soil distribution in the Samoylov isl. (A) Subaquatic Fluvisol (Arenic); (B) Folic Podzol (Oxyaquic); (C) Epicryic Histosol; (D) Reductaquic Cryosol (Siltic); (E) Folic Cryosol (Siltic).
The chemical soil parameters were analyzed on fine earth of soil after being passed through a 2 mm sieve. The chemical analyses were performed using classical methods: C and N contents were determined using an element analyzer (EA3028-HT EuroVector, Pravia PV, Italy) and pH in water and in salt suspension (soil-dissolvent ratios 1:2.5 in case of mineral horizons and 1:25 in case of organomineral horizons) suspensions using a pH meter (pH-150 M Teplopribor, Moscow, Russia). To determine the chemical composition of the studied soils, we used the X-ray fluorescence analysis on Energy Dispersive X-ray Fluorescence Spectrometer (EDX-800P, Shimadzu, Japan). The particle-size distribution of soils was determined by the Kachinsky method, a Russian analog of the analysis proposed by Bowman and Hutka (2002). Mapping of the spatial distribution was performed using QGIS 3.22 and SAGA GIS 7.9.1 software. Statistical processing was conducted using Statistica 10.0 software, with a principal component analysis (PCA) module.
We have analyzed remote sensing (RS) data from a UAV for the recognition of landforms with presumed and determined different soil characteristics. Orthophoto maps, digital elevation models (DEM), and morphometry schemes served as a basis for our analysis. UAV-based imaging was described in detail in (Kartoziia, 2019). It was conducted at the end of July 2016 using Supercam S 250 UAV manufactured by “Unmanned Systems”. This UAV was equipped with a geodetic-class GPS receiver and a Sony Alpha 6000 24.7 MP APS-C digital camera. All 3743 images were captured at an altitude of about 150 m above ground level and covered 4.4 km2 of Samoylov Island. As a result of using specialized software for photogrammetry: Agisoft PhotoScan (Professional Edition, Version 1.2.5) from Geoscan Ltd. and Photomod package (version 5.0) from JSC Racurs, we received 29 georeferenced orthophoto map tiles with a 0.05 m/px resolution and a DEM presented using a height matrix. Obtained DEM has a horizontal resolution of 0.5 m/px and vertical accuracy of 0.2 m.
We analyzed RS data in the GIS software package ArcGIS 10.6 from ESRI CIS Limited and in QGIS 3.22. We have used ArcGIS and QGIS tools for the creation of several land morphometry schemes. Then we recognized landforms and manually mapped soil map units. In some cases, we know that revealed landforms have different soil characteristics. In other cases, we presume differences in soil parameters of landforms due to their obvious distinction in topography, vegetation cover, and other visible features.
To be more precise, we have taken into account the following features during manual mapping: land microtopography from DEM and morphometry schemes, surface photo tones from orthophoto maps, as well as obtained soil characteristics of different island terrains. We characterized all mapped soil map units further in results and discussion. The use of maps based on the UAV method makes it possible to identify spatial inhomogeneities of the relief, such maps are most convenient to use in areas subject to active external influences (river action, active cryogenic, and erosion processes). Since we have obtained the soil map manually, we can presume, that map error corresponds to a horizontal resolution of morphometry schemes, which is 0.5 m. However, it should be noticed, that some borders between soil map units were visible in orthophoto maps. In these cases, mapping accuracy achieved 0.05 m. Thus, UAV data resolution provides a high level of mapping accuracy.
On Samoylov isl., a lot of work was carried out related to the study of the soil cover (Kutzbach et al., 2004; Zubrzycki et al., 2013; Antcibor et al., 2014; Zubrzycki et al., 2014; Polyakov et al., 2019; Polyakov and Abakumov, 2020). Most of the work is represented by the study of soil organic matter (Zubrzycki et al., 2013), greenhouse gas emissions (Kutzbach et al., 2004), as well as the vegetation cover of Samoylov isl (Boike et al., 2013; Boike et al., 2019). Several studies were also carried out to study the geomorphological features of the structure of the island (Schwamborn et al., 2002; Bolshiyanov et al., 2013; Kartoziia, 2019). Based on the data collected by Pfeiffer et al. (2000) and Pfeiffer et al. (2002) compare Sanders et al. (2010) and presented by Zubrzycki et al. (2013), the first soil map of the island was created and obtained in which 8 soil types were considered according to US taxonomy. In addition, based on data obtained by Boike et al. (2013) the land cover classes on the Samoylov Island map were obtained with six land cover classes. According to geological and geomorphological studies, Samoylov isl. was found to consist of various geological bodies formed by organomineral mass (a stratified mass of organic remains and sand). The northwestern part of the island is flooded every year by high water and is composed of sands and silts from the surface, representing high and low floodplain terraces, gradually decreasing to the Olenekskaya channel. The clear border between the two parts of the island runs northeastward. The surface of the terrace to the east border of the island is a polygonal tundra with thermokarst lakes, which in the southern part of the island are annually flooded with flood waters and at this time constitute a strait. Based on UAV data obtained by Kartoziia (2019), a detailed digital geomorphological model of Samoylov isl. was obtained, on which eight types of land units with eight subtypes were identified. Thus, based on previously obtained data by other researchers and our own, we have provided a soil-geomorphological map of Samoylov isl. based on UAV imaging. The Soil Map is presented in Figure 3. The Soil Legend is presented in Table 1.
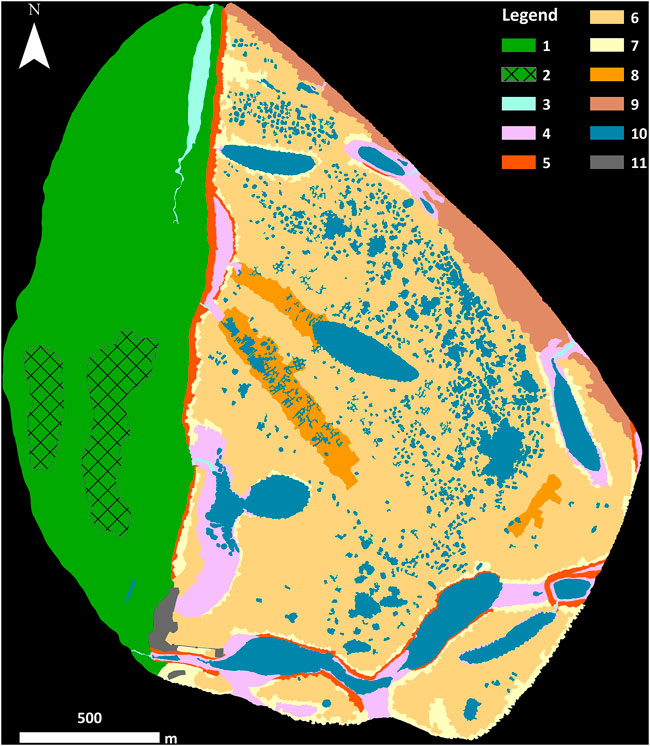
FIGURE 3. Soil-geomorphological map of the Samoylov isl., Lena River Delta. Scale Mapping units are explained in Table 1.
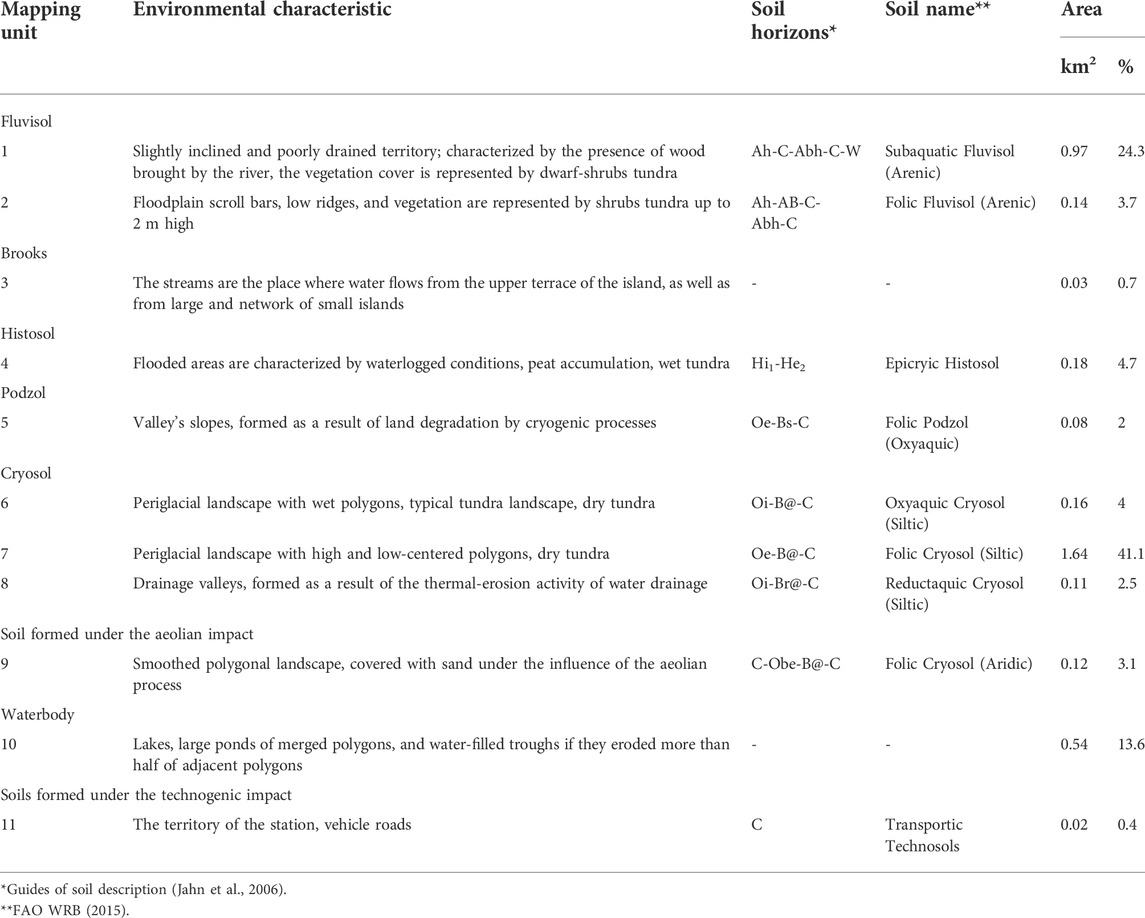
TABLE 1. Legend for the soil-geomorphological map of the Samoylov isl., Lena River Delta.
Floodplain (ID 1 in the Figure 3) is one of the largest surfaces of the island that occupies its western half. It is easily recognizable due to its slightly inclined topography and distinctive vegetation. Floodwater overlaps it every spring season. The transitions between floodplain plants and sandy beach, and the first terrace’s slope and flat surface are the visible borders of the mapped unit. Furthermore, we revealed two floodplain scroll bars, which are expressed in topography as low ridges (ID 2 in the Figure 3). Moreover, more sandy ground is typical for scroll bars.
Fluvisols are formed on the annually deposited material (during the flooding process). The formation of Fluvisol takes place in areas that are subject to the flooding process and, accordingly, by the fresh river mineral material. The soils are characterized by a stratified mass, which consists of organomineral (Ah) and mineral (C) horizons (Jahn et al., 2006). The thickness of the soil profile, depending on its position in the relief, ranges from 60 cm (in depressions) and up to 100 cm (at low ridges) to the border with the permafrost. No traces of gleying processes were noted, which are associated with sandy materials and lateral movement of moisture along the permafrost boundary towards the river. The vegetation cover here is represented by willow shrubs, various flowering plants, as well as in waterlogged areas—cotton grass and sedge. The vegetation cover is not continuous. The absence of a continuous vegetation cover, in particular of moss-lichen communities, creates conditions for active heat exchange between the soil and the atmosphere. Light particle-size distribution with a predominance of sand fraction (about 80%) prevents the accumulation of gravitational and sorbed moisture, which is associated with the active cryogenic processes. In this regard, the activity of cryogenic processes in Fluvisols is poorly developed, which is reflected in the transformation of the relief.
The main difference between Subaquatic Fluvisol (Arenic) and Folic Fluvisol (Arenic) is the presence of moisture in the Subaquatic Fluvisol (Arenic) soil profile at a depth of up to 100 cm, as well as the more developed Ah-AB horizons in the Folic Fluvisol (Arenic) profile. Folic Fluvisol (Arenic) soil stays less time in flood conditions because formed at low ridges.
The third mapped unit is brooks which are also easily recognizable due to their topography and water presence in orthophoto maps (ID 3 in the Figure 3). It needs to be marked that brooks locate both island halves.
Flooded terrains are annually covered by floodwater (ID 4 in the Figure 3). They subside due to annual flood erosional activity. Generally, these surfaces are flat, and are located below 6 m a.s.l. Thus, their mapping is simple in the DEM. Only flat bottoms concern this unit in the case of distinctive valleys.
These soils are formed under conditions of excessive moisture since they are located in depressions. Under conditions of a high level of hydromorphism and a relatively high level of occurrence of permafrost in soils, the level of microbiological activity decreases, which leads to the accumulation of poorly decomposed plant residues. This is the reason for the formation of Epicryic Histosol.
Valley’s slopes belong to another unit on the map (ID 5 in the Figure 3). Moreover, we mapped the first terrace’s slope. Generally, slope surfaces have more than 10° angle and specific solifluction micro-landforms.
A characteristic feature of these soils is the presence of the Bs horizon, which has an ocher color due to ferruginous films on the surface of mineral grains. The thickness of such soils reaches up to 40–60 cm. The Bs horizon can form a significant part of the soil profile. Here, the accumulation of iron and aluminum oxides is noted. The particle-size distribution of the soils is represented by a sandy fraction (about 70%). The vegetation cover is represented by mosses and lichens.
Ice wedge polygons occupy most territory of the first terrace surface. We have divided them into two different units. The first one consists of the usual periglacial landscape wet polygons (ID six in the Figure 3). The second one differs by water absence in the polygon center. In fact, a major of them concern with high-centered polygons (Kartoziia, 2019). We also attributed walled and low-centered polygons to this unit if all polygon parts are inclined (ID 7 in the Figure 3). Due to inclination, they are drained and have the same vegetation cover along with the polygon profile.
The development of cryogenic soils occurs in areas not subject to the active influence of the river. These soils contain a Bat horizon. The upper horizon is represented by a moss cover with weak signs of decomposition of organic remains and is underlain by permafrost. The depth of permafrost is up to 40 cm in well-drained areas, in depressions of the relief, the depth of the active layer can be up to 20 cm. The characteristic features of cryogenic soils are the development of cryoturbation processes in the form of vortex patterns, as well as the presence of frost cracks. The main difference between Oxyaquic Cryosol (Siltic) and Folic Cryosol (Siltic) is the saturation of Oxyaquic Cryosol (Siltic) with oxygenated waters (by the liquid precipitation). The development of anaerobic conditions is not observed in these soils. Folic Cryosol (Siltic) forming on high and low-centered polygons have a developed Oe horizon, which indicates the transformation of plant residues and a relatively high microbiological activity of these soils, the thickness of the active layer in these soils is much higher [on average, 20 cm more than in Oxyaquic Cryosol (Siltic)]. Isolation of dry and wet polygons is possible using the UAV method (Figure 4).
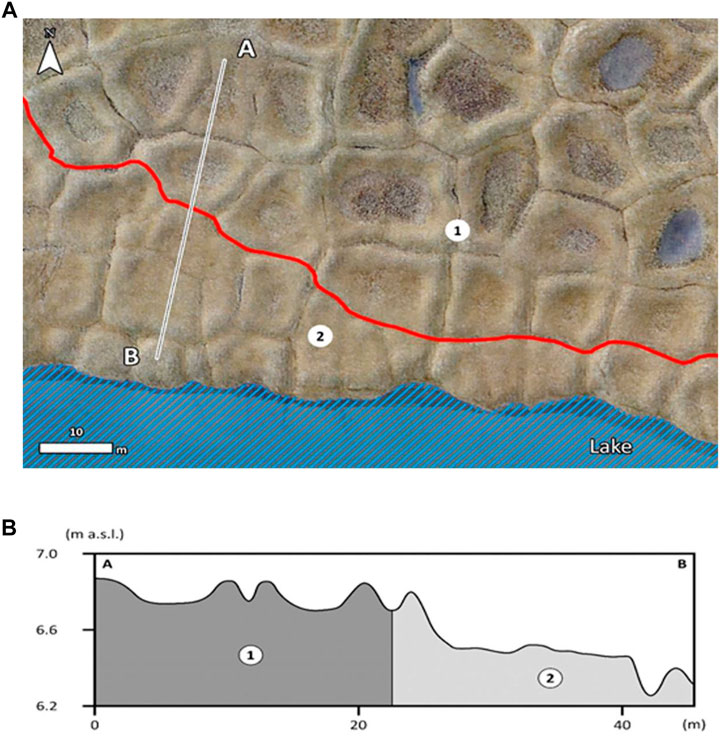
Figure 4. Wet (1) and dried (2) polygons on an orthophoto map that is mixed with a grey shaded relief (GSR) map (A). The red line is a border between mapped polygon types. The topography profile (B) was obtained by using ArcGIS and shows small hollows' presence in wet polygons’ centers. In addition, it shows the surface general inclination in the case of dried polygons terrain. This inclination conditions water absence.
The increase in the active layer in Folic Cryosol (Siltic) may also be due to the erosion of the permafrost as a result of the movement of suprapermafrost moisture into the nearest water bodies. For example, into lakes, brooks, as well as into ponds above ice wedges, and into ponds in ice wedge polygons’ centers. The outflow of suprapermafrost moisture occurs in the nearest water bodies. Due to the movement of relatively warm suprapermafrost water (especially above ice wedges), permafrost degradation near water bodies occurs. These processes of soil erosion and thermokarst are described in the literature, in particular in (Liljedahl et al., 2016). Since the resolution of DEM enables revealing even the smallest topography amplitudes, we have identified these processes’ results in landscapes.
Moreover, we have identified drainage valleys in the polygonal landscape (ID 8 in the Figure 3). These surfaces are generally recognizable on the aspect scheme, which was derived from DEM averaging with a moving window of 30 m. Elongated square ice wedge polygons with water in troughs locate in valleys with a 20–40 cm depth. Polygons’ long axes are perpendicular to revealed valleys’ thalwegs. We can presume that surface subsidence processes occurred here owning to the thermal-erosion activity of water drainage in the inner part of the island. Waterlogged Reductaquic Cryosol (Siltic) is formed under these conditions. A characteristic feature of these soils is reducing conditions due to continued contact with water.
According to the UAV analysis, it is possible to identify these soil types with high reliability (Figure 5).
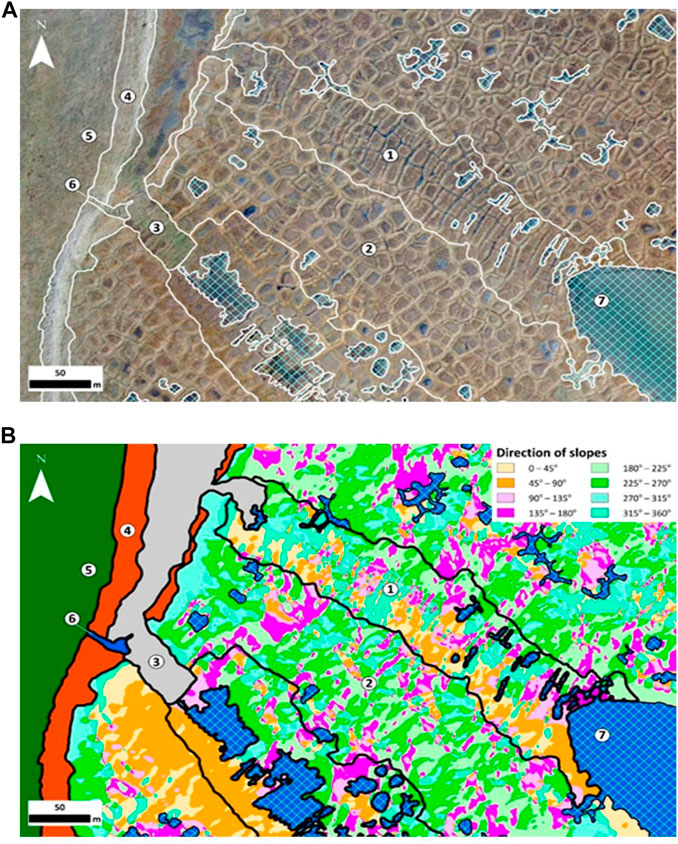
FIGURE 5. Elongated terrains of drainage valleys in the Samoylov Island central part on an orthophoto map that is mixed with a GSR map (A) and on an aspect map (B). Legend: 1—drainage valleys; 2—both types of polygons; 3—flooded terrains; 4—slopes; 5—floodplain; 6—brooks. Colors 1 and 2 on (B) signify the slopes’ direction.
The next type of soil was distinguished due to the development of active aeolian processes in the eastern part of the island. There is a flat surface with incipient polygons on the eastern edge of the island (ID 9 in Figure 3). The smoothed polygonal landscape is the main distinguishing feature of this unit. We found the overlapping of the first terrace geological body by a bed of river sand here. Sands transport towards the island’s center due to the aeolian process. They smooth polygons and make superficial ground sandier. As a result of changes in the water level in the river, in the eastern part of the island, the sand spit periodically drains, which is further destroyed by the wind, the place of accumulation of this sand is the soils of Samoylov isl. Therefore, we have identified a separate subtype of Folic Cryosol (Aridic).
Based on Kartoziia (2019), we mapped lakes, large ponds of merged polygons, and water-filled troughs if they eroded more than half of adjacent polygons (ID 10 in Figure 3). Ponds that are located in a center of single polygons were not mapped.
The last mapped unit is a territory of Samoylov research station (ID 11 in Figure 3). Most of the soil has been radically transformed. There are also wooden decks around the station, serving as a road.
The data obtained show that in studied soils, the leading elements that accumulate in soils are SiO2, Fe2O3, and Al2O3 (Supplementary Table SA1). In connection with the development of cryogenic and gley processes in soils, migration of iron and aluminum oxides occurs. In summer, organomineral compounds migrate down the soil profile, forming humus streaks. The processes of humification of organic matter and the activity of cryogenic processes result in a redistribution of organic matter in soils. We have previously considered the processes of migration and accumulation of soil organic matter in the soils of the Lena River Delta (Zubrzycki et al., 2013; Polyakov and Abakumov, 2021a). Depending on the position in the relief and the activity of cryogenic processes, three types of accumulation can be distinguished. In the first type, which is associated with flooded areas, stratified soils are formed, in which accumulation of soil organic matter occurs in layers, with organomineral horizons overlapping with fresh mineral material. Therefore, in such soils, one can observe several peaks of organic carbon throughout the soil profile. The second and third types are associated with areas that are not subjected to flooding. In the second type, there is the accumulation of organic material in the upper soil horizon (5–20 cm) and decreases with depth. In the third type, there is an accumulation of organic material in the upper soil horizon as well as at the boundary with frozen rocks. The relatively high content of iron and aluminum oxides is the result of the formation of various micas (muscovite, biotite), hydromicas (illite, vermiculite, and glauconite), aluminosilicates (feldspars) (Polyakov and Abakumov, 2021b). In the studied soils, the predominant mineral is quartz, which is largely due to the riverine origin of the delta complex of the Lena River. The low variability of the content of chemical elements among the studied soils indicates a weak influence of exogenous processes on the accumulation of chemical elements in the studied soils (the influence of the sea/river). The spatial distribution of the dominant chemical elements (SiO2 and Fe2O3) on Samoylov isl. is shown in Figure 6.
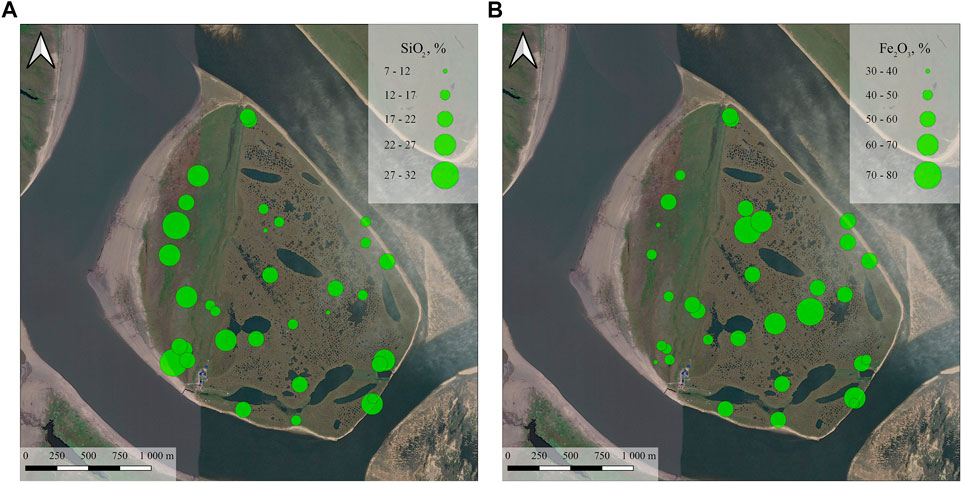
FIGURE 6. Spatial distribution of chemical compounds in study soils. (A) SiO2; (B) Fe2O3.
From the data obtained, we can note that the accumulation of SiO2 is associated with the influence of the river since the highest concentrations of this mineral are found in the flooded areas of Samoylov isl. At the same time, the accumulation of Fe2O3 occurs predominantly in non-flooded soils, but in areas with excessive moisture.
During the statistical processes of the data on the content of chemical compounds in the soil and their relationship with the particle-size distribution, it was noted that most of the studied compounds are associated with the accumulation of the sand fraction (Figure 7).
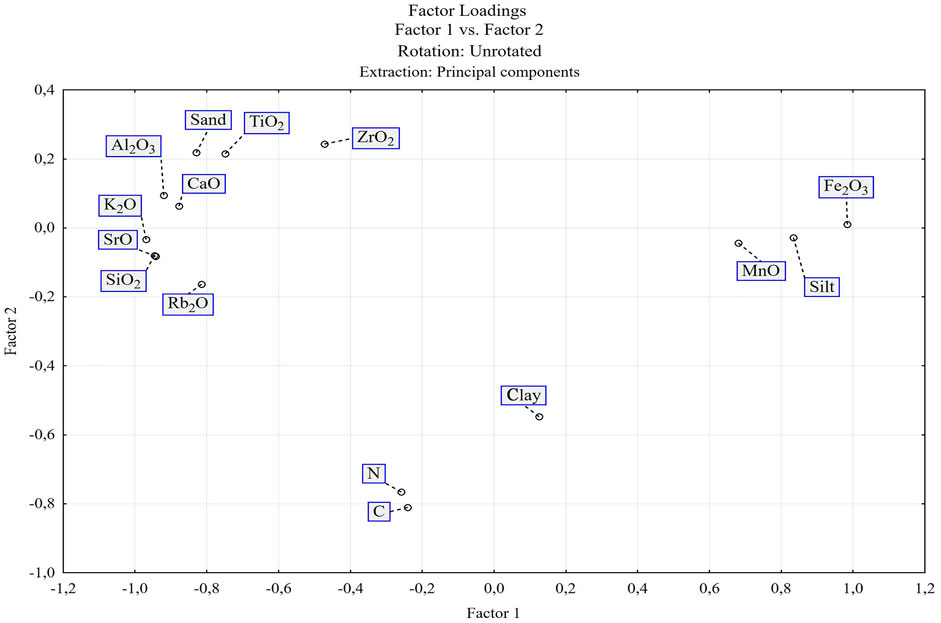
FIGURE 7. PCA analysis for the main chemical compounds and particle-size distribution in soils.
Thus, we can conclude that most of the chemical elements are introduced into the delta along with the river waters. Furthermore, under the conditions of weathering of soil primary and secondary minerals, the accumulation of iron and manganese oxides occurs in the soils, while the accumulation of organic carbon and nitrogen, according to statistical analysis, is associated with the silt fraction. The correlation matrix is shown in Figure 8.
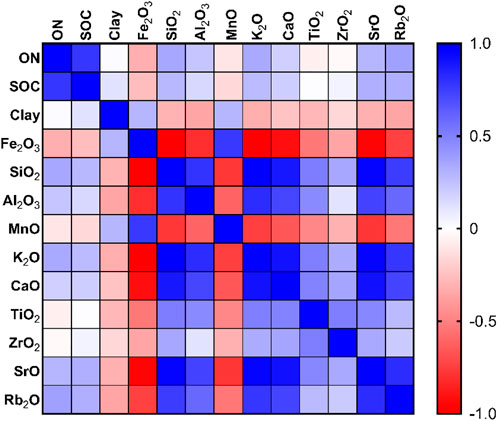
FIGURE 8. Correlation matrix (Spearman r) of main chemical compounds.
The Spearmen r correlation indicates the relationship between the processes of the ON and SOC accumulation (r = 0.77, p < 0.05). Also significant (p < 0.05) correlation coefficients were obtained between the major oxides (Fe2O3 and Al2O3 r = −0.81) and silicon oxide (SiO2: Fe2O3 r = −0.99; SiO2: Al2O3 r = 0.78). The above oxides are often connected, as their parallel removal or accumulation is determined by the processes of chemical and physical weathering.
An analysis of the spatial distribution of SOC and organic nitrogen (ON) on Samoylov isl. was carried out (Figure 9).
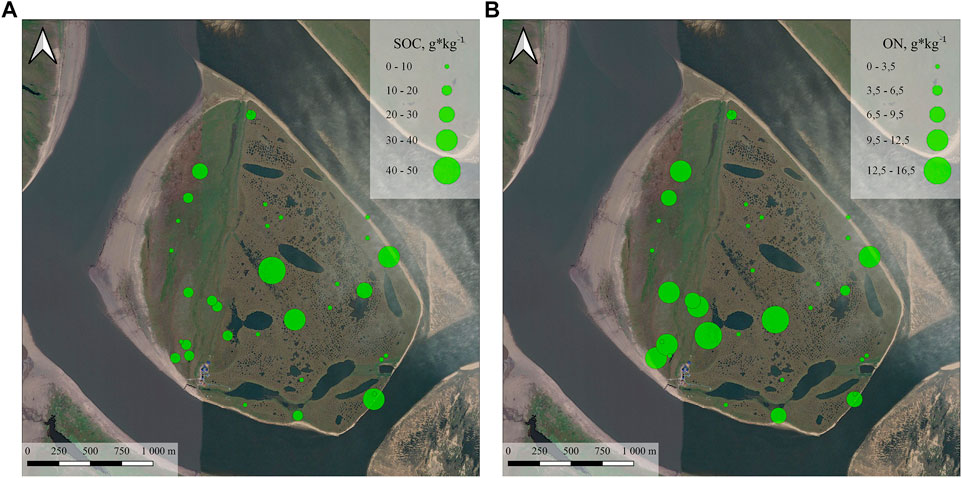
FIGURE 9. Spatial distribution of SOC (A) and ON (B) in soils of the Lena River Delta.
From the obtained Figure 9, we can conclude that the highest SOC content is observed on the Holocene terrace, in areas that are not subject to the flooding process. The sites with the highest SOC content are confined to the formation of Cryosol and Histosol, where SOC accumulates at low temperatures and close occurrence of permafrost. In Fluvisol, a smaller amount of SOC accumulates on the flooded area of the island, which may be associated with the stratification of soil horizons and overlapping of the upper humus horizons with river mineral material.
The ON content is more related to the flooded areas of the island, this may be due to the more varied vegetation cover in the flooded areas and the formation of cereal and flowering plant communities. At the same time, in areas that are not subject to seasonal flood processes, the nitrogen content is not so high.
Traditional soil mapping methods are an integral part of modern territory analysis (Florinsky, 2016). These methods are widely used around the world, and most of the existing soil maps have been made by analysis of soil sections and creating a network of soil pits. Based on such data, a soil map of Zubrzycki et al. (2013) was previously obtained. The map we obtained is generally consistent with the previous data, while our data are based on both soil analyzes and the geomorphological structure of the island. Modern methods of soil mapping are aimed at the remote analysis of the territory (Lamichhane et al., 2019). These methods are used to generate the maps needed to calculate soil organic carbon stocks (Lefèvre et al., 2017; Lamichhane et al., 2019). Our proposed UAV-based mapping method is a reliable and accurate tool for the analysis of heterogeneous landscapes because is able to take into account a large number of heterogeneities in the relief, while maps based on satellite images cannot estimate such heterogeneities. Therefore, the use of the UAV method is a promising and necessary tool for analyzing landscapes undergoing active changes (cryogenic, watershed, mountainous landscapes).
Nowadays, the UAV method has been used in the calculation of organic carbon sinks in agriculture (Guo et al., 2020). Regression models are widely used to build digital soil maps of the distribution of organic carbon in various regions of the world were created (Zeng et al., 2016). However, the formation of regression models requires a large database to generate a model with a low error rate. In regions where long-term monitoring studies are carried out, such data are available, in the Arctic regions such data are minimal or absent at all. Due to the complexity of the landscape and the degradation of permafrost, erosional and thermokarst processes (Ardelean et al., 2020) is quite difficult to obtain such data. A similar conclusion was found by Alpine soil researchers who combined remote sensing and traditional soil survey methods (Baruck et al., 2016). However, they came to the problem that the study of the Alps, which are located in different states of Europe, is complicated by the correlation of soil nomenclatures, which have significant differences in different countries. Therefore, a unified soil cover classification, e.g. WRB, should be used. The study of the Canadian Arctic and SOM stocks uses long-term satellite data, DEM, soil depth, and temperature data, and achieves 83% accuracy in the investigation of soil cover (Sothe et al., 2022). A lot of other examples of successful using UAV data in geosciences are described in the literature, particularly in (Lewis et al., 2022). Therefore, the method proposed by us, based on a DEM, in combination with traditional methods of investigation of the soil cover, makes it possible to obtain reliable data on the formation of the soil cover depending on the landscape situation. For hard-to-reach regions, such as the Arctic, and mountainous areas, the use of soil-geomorphological maps based on UAV surveys can be an effective mechanism for monitoring and studying the soil cover. Thus, when identifying reference landforms and soils that form on them together with an assessment of the chemical parameters of soils, we can extrapolate the data obtained to areas inaccessible to traditional soil studies. This study is the first step for the formation of reference landforms and their corresponding soils, thus the development of this area of mapping will enable creation of soil-geomorphological maps of high accuracy. The obtained data, together with the conducted studies of the physicochemical parameters of soils, can be used as reference values for specific natural zones and used to calculate the reserves of various organic and inorganic substances.
The soil cover of Samoylov isl. is characterized by high diversity. We have identified 8 soil types. Their formation is due to the different positions in the landscape and the conditions of a territory flooding. Most of the territory is represented by the periglacial landscape with high and low-centered polygons and the forming Folic Cryosol (Siltic) (41.1%), as well as slightly inclined and poorly drained territory, on which the Subaquatic Fluvisol (Arenic) is formed (24.3%). As a result of using classical methods of soil investigations and GIS analysis of UAV data, we have obtained a digital soil-geomorphological map of Samoylov isl. We have identified three subtypes of Cryosols (Oxyaquic Cryosol, Folic Cryosol, and Reductaquic Cryosol) based on the soil-geomorphological model. The formation of different Cryosol types here is associated with geomorphological conditions and the hydromorphism degree. We have identified the Folic Podzol (Oxyaquic) type forming valley’s slopes, which occupies about 2% of the island’s territory, as well as the Cryic Histosol type (4.7%), which is characterized by the accumulation of peat in the humid landscape depressions of the island. Based on the physic-chemical analysis of soils, it was revealed that most of the chemical compounds (SiO2, Al2O3, CaO, K2O, and others) enter the soil as a result of the activity of the river. In areas outside the annual flooding, Fe2O3 and MnO accumulate, and the accumulation of organic components (SOC and ON) is associated with the silt fraction. We suppose that the use of high-resolution soil-geomorphological maps based on GIS analysis of UAV data is a reliable tool for the examination of heterogeneous areas of the earth’s surface. This method of analysis will make it possible to reliably determine soil types in conditions of the high variability of the watershed and cryogenic landscapes. Moreover, that method together with the analysis of organic and inorganic components is able to determine soil’s content in the most dynamic areas of the landscape. The quantity of soil sampling sites should be chosen to depend on landscapes and presumed soil types variety which is located in the study area, and also according to classical soil mapping methods. Directly, the determination of soil types should be based on chemical analysis. However, accurate mapping of their distribution and especially their borders are goals for GIS analysis of UAV data. Specific instructions for the soil-geomorphological mapping method could be developed after additional investigations.
The original contributions presented in the study are included in the article/Supplementary Material; further inquiries can be directed to the corresponding author.
VP and AK: conceptualization, methodology, supervision, and funding acquisition; VP and AK: data curation, writing—original draft, and formal analysis; TN: data curation and visualization; EA: review and editing and supervision; and WW: review and editing.
This work was supported by the Ministry of Science and Higher Education of the Russian Federation in accordance with agreement No. 075-15-2022-322 date 22.04.2022 on providing a grant in the form of subsidies from the Federal budget of Russian Federation. The grant was provided for state support for the creation and development of a World-class Scientific Center “Agrotechnologies for the Future,” and this work was carried out on the state assignment of VS Sobolev Institute of Geology and Mineralogy, Siberian Branch of the Russian Academy of Sciences.
The authors thank the Chemical Analysis and Materials Research Center of St. Petersburg State University for assistance in the analysis of chemicals in the studied soils.
The authors declare that the research was conducted in the absence of any commercial or financial relationships that could be construed as a potential conflict of interest.
All claims expressed in this article are solely those of the authors and do not necessarily represent those of their affiliated organizations, or those of the publisher, the editors, and the reviewers. Any product that may be evaluated in this article, or claim that may be made by its manufacturer, is not guaranteed or endorsed by the publisher.
The Supplementary Material for this article can be found online at: https://www.frontiersin.org/articles/10.3389/fenvs.2022.948367/full#supplementary-material
UAV, unmanned aerial vehicle; SOM, soil organic matter; SOC, soil organic carbon; ON, organic nitrogen; UNCCD, united nations convention to combat desertification; GIS, geographic information system; PCA, principal component analysis; DEM, digital elevation model.
Antcibor, I., Eschenbach, A., Zubrzycki, S., Kutzbach, L., Bolshiyanov, D., and Pfeiffer, E. M. (2014). Trace metal distribution in pristine permafrost-affected soils of the Lena River delta and its hinterland, northern Siberia, Russia. Biogeosciences 11 (1), 1–15. doi:10.5194/bg-11-1-2014
Ardelean, F., Onaca, A., Chețan, M.-A., Dornik, A., Georgievski, G., Hagemann, S., et al. (2020). Assessment of spatio-temporal landscape changes from VHR images in three different permafrost areas in the western Russian arctic. Remote Sens. 12 (23), 3999. doi:10.3390/rs12233999
Baruck, J., Nestroy, O., Sartori, G., Baize, D., Traidl, R., Vrščaj, B., et al. (2016). Soil classification and mapping in the Alps: The current state and future challenges. Geoderma 264, 312–331. doi:10.1016/j.geoderma.2015.08.005
Bogorodskii, P. V., Makshtas, A. P., Kustov, V. Y., and Movchan, V. V. (2018). The dynamics of seasonal thawing of permafrost in the region of research station “ice base “cape baranov” (bolshevik island, severnaya zemlya archipelago). Probl. Arktiki. I. Antarkt. 64 (1), 16–30. doi:10.30758/0555-2648-2018-64-1-16-30
Boike, J., Kattenstroth, B., Abramova, K., Bornemann, N., Chetverova, A., Fedorova, I., et al. (2013). Baseline characteristics of climate, permafrost and land cover from a new permafrost observatory in the Lena River Delta, Siberia (1998–2011). Biogeosciences 10 (3), 2105–2128. doi:10.5194/bg-10-2105-2013
Boike, J., Nitzbon, J., Anders, K., Grigoriev, M., Bolshiyanov, D., Langer, M., et al. (2019). A 16-year record (2002–2017) of permafrost, active-layer, and meteorological conditions at the Samoylov island arctic permafrost research site, Lena River delta, northern siberia: An opportunity to validate remote-sensing data and land surface, snow, and permafrost models. Earth Syst. Sci. Data 11 (1), 261–299. doi:10.5194/essd-11-261-2019
Bolshiyanov, D. Y., Makarov, A. S., Schneider, V., and Stoof, G. (2013). Origin and development of the delta Lena River. St. Petersburg: AARI.
Bölter, M., and Wetzel, H. (2006). Properties, formation, classification and ecology of arctic soils: Results from the tundra northwest expedition 1999 (nunavut and northwest territories, Canada). Polarforschung 73, 89–101. doi:10.2312/polarforschung.73.2-3.89
Bowman, G., and Hutka, J. (2002). “Particle size analysis,” in Soil physical measurment and interpritation for land evaluation. Editors N. McKezie, K. Coughlan, and H. Cresswell (Victoria: CSIRO Publishing), 224–239.
Castaldi, F., Hueni, A., Chabrillat, S., Ward, K., Buttafuoco, G., Bomans, B., et al. (2019). Evaluating the capability of the Sentinel 2 data for soil organic carbon prediction in croplands. ISPRS J. Photogrammetry Remote Sens. 147, 267–282. doi:10.1016/j.isprsjprs.2018.11.026
Desyatkin, R., Filippov, N., Desyatkin, A., Konyushkov, D., and Goryachkin, S. (2021). Degradation of arable soils in central Yakutia: Negative consequences of global warming for yedoma landscapes. Front. Earth Sci. (Lausanne). 9, 683730. doi:10.3389/feart.2021.683730
Dvornikov, Y. A., Vasenev, V. I., Romzaykina, O. N., Grigorieva, V. E., Litvinov, Y. A., Gorbov, S. N., et al. (2021). Projecting the urbanization effect on soil organic carbon stocks in polar and steppe areas of European Russia by remote sensing. Geoderma 399, 115039. doi:10.1016/j.geoderma.2021.115039
Dymov, A. A., Kaverin, D. A., and Gabov, D. N. (2013). Properties of soils and soil-like bodies in the Vorkuta area. Eurasian Soil Sc. 46 (2), 217–224. doi:10.1134/S1064229313020038
Evdokimova, G., and Mozgova, N. P. (2001). Comparative characterization of microbial biomass in Al-Fe-humus podzols of the kola peninsula. Eurasian Soil Sci. 34, 1305–1312.
Florinsky, I. (1998). Combined analysis of digital terrain models and remotely sensed data in landscape investigations. Prog. Phys. Geogr. Earth Environ. 22, 33–60. doi:10.1177/030913339802200102
Florinsky, I. V. (2016). Digital terrain analysis in soil science and geology. London, England: Elsevier.
Gessler, P. E., Moore, I. D., McKenzie, N. J., and Ryan, P. J. (1995). Soil-landscape modelling and spatial prediction of soil attributes. Int. J. Geogr. Inf. Syst. 9 (4), 421–432. doi:10.1080/02693799508902047
Guo, L., Fu, P., Shi, T., Chen, Y., Zhang, H., Meng, R., et al. (2020). Mapping field-scale soil organic carbon with unmanned aircraft system-acquired time series multispectral images. Soil Tillage Res. 196, 104477. doi:10.1016/j.still.2019.104477
Hanaka, A., Plak, A., Zagórski, P., Ozimek, E., Rysiak, A., Majewska, M., et al. (2019). Relationships between the properties of Spitsbergen soil, number and biodiversity of rhizosphere microorganisms, and heavy metal concentration in selected plant species. Plant Soil 436 (1), 49–69. doi:10.1007/s11104-018-3871-7
Iavid, E., Kondakova, V., Polyakov, V., and Abakumov, E. (2018). Diversity and main properties of soils of the Gronfjord area (Svalbard archipelago). Czech Polar Rep. 8, 43–59. doi:10.5817/CPR2018-1-4
Jahn, R., Blume, H. P., Spaargaren, O., and Schad, P. (2006). Guidelines for soil description. Rome, Italy: Food and agriculture organization of the united nations.
Ji, X., Abakumov, E., and Polyakov, V. (2019). Assessments of pollution status and human health risk of heavy metals in permafrost-affected soils and lichens: A case-study in yamal peninsula, Russia arctic. Hum. Ecol. Risk Assess. Int. J. 25 (8), 2142–2159. doi:10.1080/10807039.2018.1490887
Jones, A., Stolbovoy, V., Tarnocai, C., Broll, G., Spaargaren, O., and Montanarella, L. (2010). Soil atlas of the northern circumpolar region, European commission. Luxembourg: Publications Office of the European Union, 144.
Kartoziia, A. (2019). Assessment of the ice wedge polygon current state by means of UAV imagery analysis (Samoylov island, the Lena delta). Remote Sens. 11 (13), 1627. doi:10.3390/rs11131627
Knoblauch, C., Beer, C., Sosnin, A., Wagner, D., and Pfeiffer, E. M. (2013). Predicting long-term carbon mineralization and trace gas production from thawing permafrost of Northeast Siberia. Glob. Chang. Biol. 19 (4), 1160–1172. doi:10.1111/gcb.12116
Kravtsova, V. I., and Mit’kinykh, N. S. (2011). Mouths of world rivers in the atlas of space images. Water Resour. 38 (1), 1–17. doi:10.1134/S0097807811010064
Kutzbach, L., Wagner, D., and Pfeiffer, E.-M. (2004). Effect of microrelief and vegetation on methane emission from wet polygonal tundra, Lena Delta, Northern Siberia. Biogeochemistry 69 (3), 341–362. doi:10.1023/B:BIOG.0000031053.81520.db
Lamichhane, S., Kumar, L., and Wilson, B. (2019). Digital soil mapping algorithms and covariates for soil organic carbon mapping and their implications: A review. Geoderma 352, 395–413. doi:10.1016/j.geoderma.2019.05.031
Lefèvre, C., Rekik, F., Alcantara, V., and Wiese, L. (2017). Soil organic carbon - the hidden potential. Rome, Italy: FAO.
Lewis, Q., Konsoer, K., and Leitner, M. (2022). “How sUAS has pushed forward on-demand low altitude remote sensing in Geography,” in sUAS applications in Geography. Editors K. Konsoer, M. Leitner, and Q. Lewis (Cham: Springer International Publishing), 1–12.
Liljedahl, A. K., Boike, J., Daanen, R. P., Fedorov, A. N., Frost, G. V., Grosse, G., et al. (2016). Pan-Arctic ice-wedge degradation in warming permafrost and its influence on tundra hydrology. Nat. Geosci. 9 (4), 312–318. doi:10.1038/ngeo2674
Lupachev, A. V., Abakumov, E. V., Goryachkin, S. V., and Veremeeva, A. A. (2020). Soil cover of the fildes peninsula (king george island, west Antarctica). CATENA 193, 104613. doi:10.1016/j.catena.2020.104613
McBratney, A. B., Mendonça Santos, M. L., and Minasny, B. (2003). On digital soil mapping. Geoderma 117 (1), 3–52. doi:10.1016/S0016-7061(03)00223-4
Moore, I. D., Gessler, P., Nielsen, G. A. E., and Peterson, G. (1993). Soil attribute prediction using terrain analysis. Soil Sci. Soc. Am. J. 57, 443–452. doi:10.2136/sssaj1993.03615995005700020058x
Moore, I. D., Grayson, R. B., and Ladson, A. R. (1991). Digital terrain modelling: A review of hydrological, geomorphological, and biological applications. Hydrol. Process. 5 (1), 3–30. doi:10.1002/hyp.3360050103
Munsell, C. (2010). Munsell soil color charts : With genuine Munsell color chips. 2009 year revised. Grand Rapids, MI: Munsell Color.
Nauman, T., Burch, S., Humphries, J., Knight, A., and Duniway, M. (2022). A quantitative soil-geomorphic framework for developing and mapping ecological site groups</sup>. Rangel. Ecol. Manag. 81 (1), 9–33. doi:10.1016/j.rama.2021.11.003
Nizamutdinov, T., Morgun, E., Pechkin, A., Kostecki, J., Greinert, A., and Abakumov, E. (2021). Differentiation of trace metal contamination level between different urban functional zones in permafrost affected soils (the example of several cities in the yamal region, Russian arctic). Miner. (Basel). 11 (7), 668. doi:10.3390/min11070668
Padilha, M. C. D. C., Vicente, L. E., Demattê, J. A. M., dos Santos Wendriner Loebmann, D. G., Vicente, A. K., Salazar, D. F. U., et al. (2020). Using Landsat and soil clay content to map soil organic carbon of oxisols and Ultisols near São Paulo, Brazil. Geoderma Reg. 21, e00253. doi:10.1016/j.geodrs.2020.e00253
Pfeiffer, E.-M., Wagner, D., Kobabe, S., Kutzbach, L., Kurchatova, A., Stoof, G., et al. (2002). Modern processes in permafrost affected soils. Rep. Polar Mar. Res. 426, 21–41.
Pfeiffer, E. M., Wagner, D., Becker, H., Vlasenko, A., Kutzbach, L., Boike, J., et al. (2000). Modern processes in permafrost affected soils. Geoscience 22, 54.
Ping, C.-L., Michaelson, G. J., Jorgenson, M. T., Kimble, J. M., Epstein, H., Romanovsky, V. E., et al. (2008). High stocks of soil organic carbon in the North American Arctic region. Nat. Geosci. 1 (9), 615–619. doi:10.1038/ngeo284
Polyakov, V., and Abakumov, E. (2021a). Assessments of organic carbon stabilization using the spectroscopic characteristics of humic acids separated from soils of the Lena River delta. Separations 8 (6), 87. doi:10.3390/separations8060087
Polyakov, V., and Abakumov, E. (2021b). Micromorphological characteristic of different-aged Cryosols from the east part of Lena River delta, siberia, Russia. Geosci. (Basel). 11 (3), 118. doi:10.3390/geosciences11030118
Polyakov, V., and Abakumov, E. (2020). Stabilization of organic material from soils and soil-like bodies in the Lena River Delta (13C-NMR spectroscopy analysis). Span. J. Soil Sci. 10 (2), 170–190. doi:10.3232/SJSS.2020.V10.N2.05
Polyakov, V. I., Chegodaeva, N. A., and Abakumov, E. V. (2019). Molecular and elemental composition of humic acids isolated from selected soils of the Russian Arctic. Tomsk. State. Univ. J. Biol. 47, 6–21. doi:10.17223/19988591/47/1
Polyakov, V., Nizamutdinov, T., Abakumov, E., and Morgun, E. (2021). Soil diversity and key functional characteristics of yakutsk city: Largest urbanized cryogenic world’s Ecosystem. Energies (Basel). 14 (13), 3819. doi:10.3390/en14133819
Sanders, T., Fiencke, C., and Pfeiffer, E. M. (2010). Small-scale variability of dissolved inorganic nitrogen (DIN), C/N ratios and ammonia oxidizing capacities in various permafrost affected soils of Samoylov Island, Lena River Delta, Northeast Siberia. Polarforschung 80, 23–35. doi:10.2312/polarforschung.80.1.23
Schepaschenko, D. G., Mukhortova, L. V., Shvidenko, A. Z., and Vedrova, E. F. (2013). The pool of organic carbon in the soils of Russia. Eurasian Soil Sc. 46 (2), 107–116. doi:10.1134/S1064229313020129
Schneider, J., Grosse, G., and Wagner, D. (2009). Land cover classification of tundra environments in the Arctic Lena Delta based on Landsat 7 ETM+ data and its application for upscaling of methane emissions. Remote Sens. Environ. 113 (2), 380–391. doi:10.1016/j.rse.2008.10.013
Schuur, E. A. G., McGuire, A. D., Schädel, C., Grosse, G., Harden, J. W., Hayes, D. J., et al. (2015). Climate change and the permafrost carbon feedback. Nature 520 (7546), 171–179. doi:10.1038/nature14338
Schwamborn, G., Rachold, V., and Grigoriev, M. N. (2002). Late quaternary sedimentation history of the Lena delta. Quat. Int. 89 (1), 119–134. doi:10.1016/S1040-6182(01)00084-2
Scull, P., Franklin, J., Chadwick, O., and McArthur, D. (2003). Predictive soil mapping: A review. Prog. Phys. Geogr. Earth Environ. 27, 171–197. doi:10.1191/0309133303pp366ra
Sothe, C., Gonsamo, A., Arabian, J., and Snider, J. (2022). Large scale mapping of soil organic carbon concentration with 3D machine learning and satellite observations. Geoderma 405, 115402. doi:10.1016/j.geoderma.2021.115402
Tarnocai, C., and Bockheim, J. (2011). Cryosolic soils of Canada: Genesis, distribution, and classification. Can. J. Soil Sci. 91 (5), 749–762. doi:10.4141/cjss10020
Wrb, F. (2015). IUSS working group WRB world reference base for soil resources 2014, update 2015. Report.
Zeng, C., Yang, L., Zhu, A. X., Rossiter, D. G., Liu, J., Liu, J., et al. (2016). Mapping soil organic matter concentration at different scales using a mixed geographically weighted regression method. Geoderma 281, 69–82. doi:10.1016/j.geoderma.2016.06.033
Zubrzycki, S., Kutzbach, L., and Pfeiffer, E. M. (2014). Permafrost-affected soils and their carbon pools with a focus on the Russian Arctic. Solid earth. 5 (2), 595–609. doi:10.5194/se-5-595-2014
Keywords: Lena River Delta, Samoylov Island, remote sensing, UAV, soil-geomorphological map
Citation: Polyakov V, Kartoziia A, Nizamutdinov T, Wang W and Abakumov E (2022) Soil-geomorphological mapping of Samoylov Island based on UAV imaging. Front. Environ. Sci. 10:948367. doi: 10.3389/fenvs.2022.948367
Received: 19 May 2022; Accepted: 18 August 2022;
Published: 08 September 2022.
Edited by:
Wenxin Zhang, Faculty of Science, Lund University, SwedenReviewed by:
Xiaowen Ji, University of Saskatchewan, CanadaCopyright © 2022 Polyakov, Kartoziia, Nizamutdinov, Wang and Abakumov. This is an open-access article distributed under the terms of the Creative Commons Attribution License (CC BY). The use, distribution or reproduction in other forums is permitted, provided the original author(s) and the copyright owner(s) are credited and that the original publication in this journal is cited, in accordance with accepted academic practice. No use, distribution or reproduction is permitted which does not comply with these terms.
*Correspondence: Vyacheslav Polyakov, c2xhdm9uNjk4NUBnbWFpbC5jb20=
Disclaimer: All claims expressed in this article are solely those of the authors and do not necessarily represent those of their affiliated organizations, or those of the publisher, the editors and the reviewers. Any product that may be evaluated in this article or claim that may be made by its manufacturer is not guaranteed or endorsed by the publisher.
Research integrity at Frontiers
Learn more about the work of our research integrity team to safeguard the quality of each article we publish.