 Jing Sun
- 1Hubei Key Laboratory for Heavy Rain Monitoring and Warning Research, Institute of Heavy Rain, China Meteorological Administration, Wuhan, China
- 2State Key Laboratory of Severe Weather, Chinese Academy of Meteorological Sciences, Beijing, China
This study examined the effects of relative humidity (RH) on the diurnal variation of raindrop size distribution (RSD) over valley topography (Zigui region) of China from 2019 to 2020 based on a two-dimensional video disdrometer (2DVD), auto-weather station (AWS) and ERA5. The RSD structure of daytime shows a triple peaks when the RH is lower than 60% and it shows a single peak in other RH conditions, for the RSD of nighttime, the RSD structure shows a single peak when the RH is greater than 60%, and the RSD shape shows a bimodal structure with RH ≤ 60%. Significant day-night difference was found in RSDs between short-duration precipitation Amount (SPA) and long-duration precipitation Amount (LPA) under the different RH conditions. The daytime RSDs of SPA showed broader distributions than the nighttime RSDs, whereas the nighttime RSDs of LPA exhibited the opposite to that of SPA. Higher ground RH modified the RSD shape through raindrop sorting, collision-coalescence and breakup resulting with the formation of large size raindrops. Under the effect of same RH, the melting and collision-coalescence of large raindrops in the daytime of SPA are obviously stronger than those of LPA. This difference may be related to the near-surface wind filed and the intensity of convection.
1 Introduction
Rain microphysical structure is basic to cloud physics of rain formation, and the raindrop size distribution (RSD) is an important microphysical characteristic of precipitation. The importance of RSD mainly is reflected in the three aspects: estimation or retrieval of DSD parameters and rainfall rates (Bringi et al., 2003; Chen et al., 2017; Adirosi et al., 2014), attenuation correction at C-and X-bands (Gorgucci et al., 2001; Thurai et al., 2017), and evaluating propagation effects in rain (Ryzhkov et al., 2005). Moreover, the information of range, coverage, resolution, precision and continuity with precipitation is obtained, which gives a great opportunity to improve microphysical scheme, climate models and rainfall prediction (Abel and Boutle, 2012; Thurai et al., 2017).
Previous studies have reported the changes of RSD in different climatic region and rain types from diurnal to seasonal scales by using the disdrometer data (Bringi et al., 2003; Rao, 2005; Thurai et al., 2010; Kumar and Reddy, 2013; Dolan et al., 2018; Seela et al., 2018; Suh et al., 2021). For example, Kozu et al. (2005) studied the diurnal and seasonal variations of RSD in the Asian monsoon region (Gadanki, Singapore and Kototabang), and the diurnal convective cycles and seasonal variations of precipitation have significant influences on the characteristic of RSD. Suh et al. (2016) found that the frequency of Dm is higher at nighttime than during the daytime when Dm > 0.65 mm. For Nw, which tends to be inversely related to Dm, its frequency is higher at nighttime than during the daytime when log10(Nw) > 3.9 m−3 mm−1. Chen et al. (2017) revealed that little difference was found in stratiform DSDs between day and night, and daytime convective DSDs had a higher mass-weighted mean diameters (Dm) and lower generalized intercepts (NW) than the nighttime DSDs.
The middle and lower reaches of the Yangtze River basin is one of the regions where heavy rainfall is frequent. Especially, when the East Asian summer monsoon breaks out and advances northward to this region, the extremely frequent convective activities often cause strong precipitation and bring serious flood disasters (Ding and Chan, 2005; Yu and Li, 2012; Yu et al., 2021). Previous studies have revealed the fact that there is diurnal variation in precipitation in the middle and lower reaches of the Yangtze River, and pointed out that the convective burst from afternoon to night caused by the difference in surface radiative heating is the main period for the formation of heavy rainfall (Held and Soden, 2006; Tang et al., 2022). Zhou et al. (2008) revealed that the two peaks of the diurnal variation of precipitation in the middle and lower reaches of the Yangtze River occurred in the afternoon and early morning, respectively. Yu et al. (2007a) and Yu et al. (2007b) found that the afternoon precipitation peaks are often caused by convective activities with a short time (<3 h), while the night-to-morning precipitation peaks are related to convective activities with a long time in the central and eastern china (>6 h). These research results have enriched the understanding of the diurnal variation of precipitation in the Yangtze River Basin and its formation mechanism. However, what are the characteristics of the RSD corresponding to the diurnal variation of precipitation, and what are the microphysical processes that cause the diurnal variation of the RSD are still unclear.
Due to the formation of diurnal variation of precipitation is often related to various diurnal variation in the atmosphere, some studies revealed that relative humidity also has obvious diurnal variation (Zhang et al., 2008) and linked with convective initiation (Sobel and Bretherton, 2000), and the variation of relative humidity have an impact on the coalescence of small drops (Ochs Ⅲ et al., 1995). Therefore, the relative humidity may be a key factor to affect convective cloud dynamics and microphysical processes, and the relative humidity also changes the RSD structure. Coupled with the effect of valley topography, the valley effect causes a pronounced difference between the daytime and nighttime RSD characteristics (Suh et al., 2016; Chen et al., 2017; Zagrodnik et al., 2018).
In addition to the observational analysis, the diurnal variation of RSD with different relative humidity, the day-night RSD difference between short-duration precipitation amount (SPA) and long-duration precipitation amount (LPA) and the day-night RSD difference between the convective and stratiform rainfall in SPA and LPA were studied. A brief description of observation data and rain integral parameters are provided in Section 2. Observational analysis is given in Section 3. The conclusions are summarized in the last section along with a discussion on future research.
2 Data Source and Methodology
2.1 Data Source
The data sets used in this study were collected at Zigui national weather station (ZG: 30.83°N, 110.96°E, and elevation is 295.5 m) from September 2019 to August 2020. The topography of ZG belongs to the mountainous landform of the Three Gorges of the Yangtze River in China, and the region strongly influenced by the southwest vortex. The southwest vortex generated in the southeast of Qinghai-Tibet Plateau and it is a low-value vortex system with cyclonic circulation in the lower troposphere. Its development and eastward movement can bring heavy rainfall to the adjacent areas of the plateau (Jiang et al., 2015; Wang et al., 2020; You et al., 2021). The geographic location of the ZG site is shown in Figure 1A.
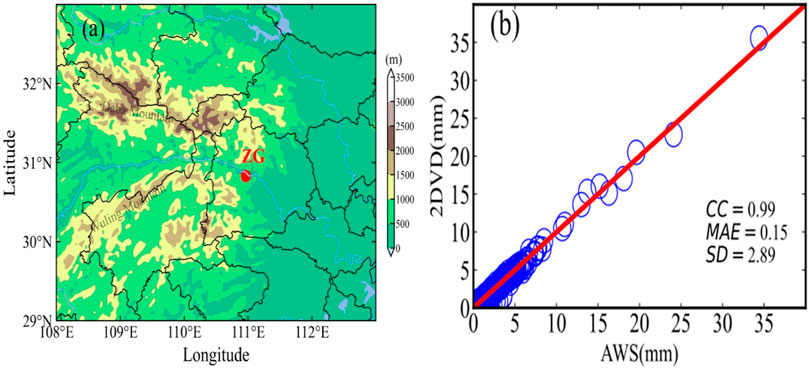
FIGURE 1. Location of the observation site at Zigui site (A) and the comparison of hourly precipitation between 2DVD and AWS (B).
The 2DVD used was the current third-generation version manufactured by Joanneum Research at the Institute for Applied Systems Technology in Graz, Austria (2DVD, sn116) (Schönhuber et al., 1994). The core element of 2DVD has two orthogonally placed line scan cameras and illumination sources, and produces a horizontal measuring area of 10 cm × 10 cm. The horizontal imaging resolution of the unit is approximately 0.2 mm. The temporal resolution for the 2DVD data is 1 min in this study. The reanalysis wind field and relative humidity at 850 hpa from the ERA5 reanalysis data (0.25° × 0.25°, hourly) from 2019 to 2020 are used to elucidate the climatological background and the diurnal variation of relative humidity (RH) and ground temperature (T).
It has been frequently noticed that during heavy rain, there are a number of particle velocity outliers measured by the 2DVD due to raindrops that are wrongly matched by two cameras of 2DVD, and the mismatch will lead to incorrect estimates of drops shape and velocity (Yuter et al., 2006). Based on a recommended falling speeds deviating more than ±40% from the falling speed versus diameter relationship (Atlas and Ulbrich, 2000), the total number of raindrops is less than 10 or those that correspond to rain rates that are less than 0.1 mm h−1 are also eliminated from dataset for each 1 min data (Tokay et al., 2013). The scatter plots of rainfall show a higher correlation coefficients between 2DVD and AWS measurements (Figure 1B). This clearly indicates that the rain integral parameters derived from 2DVD can be used to understand the RSD characteristics in ZG site. Additionally, due to the wind tower and 2DVD are on the same horizontal plane, we believe that the observation period is affected by the same horizontal winds. Lin et al. (2021) indicated the optical disdrometer may underestimate the rain rate in strong-wind environments during tropical cyclones, so we choose the DSD data corresponding to horizontal wind speed less than 14 m s−1.
2.2 Methodology
The integral rainfall parameters are derived by the RSD moments, including the mass-weighted mean diameter (Dm: mm), normalized intercept parameter (Nw: mm−1m−3), rain rate (R: mm h−1), liquid water content (LWC: g m−3), radar reflectivity (Z: dBZ). The normalized intercept parameter Nw represents N(D) when raindrops diameter approaches to its minimum value. The slope parameter (Λ) designates the truncation of RSD tail with drop diameter. The shape (μ) parameter represents the breadth of the RSD shape.
The well-known gamma function is used to obtain the distribution of RSD(Ulbrich, 1983), and the gamma size distribution is given as follows:
where N(D) is the RSD(m−3mm−1), D is the raindrop diameter (mm), N0 is the intercept parameter (mm−1−μm−3), μ (dimensionless) and Λ (mm−1) are the shape and slope parameters, respectively.
where Mn is the nth-order moment of the RSD for the gamma RSD model.
where
Parameters Dm and NW are reprehensive parameters for a RSD and the distribution of Dm and NW can directly express the nature of precipitation and the microphysical characteristics of precipitation.
Where
Based on the quality-controlled datasets, the definition of persistent rainfall as followed: the precipitation intensity has been greater than 0.1 mm h−1 and the duration is greater than 1 h at the beginning of precipitation. Therefore, 59 persistent rainfall events(between 9 September in 2019 and 26 August in 2020 are used to analyze the diurnal variation of precipitation and RSD.
The hourly precipitation data from September 2019 to August 2020 are analyzed and the number of total precipitation and total precipitation hours are calculated for each hour in every day. For a certain hour of the day, the total number of hours is 304 h. Based on the statistical results, the hourly climate averaged precipitation frequency (PF), and precipitation intensity (PI) for each hour of the day are further calculated as follows:
Since different property of precipitation corresponds to different durations, and has an important effect on the diurnal variation of precipitation(Yu et al., 2007a; Chen et al., 2010; Han et al., 2017), and Moreover, the dominant microphysical processes corresponding to precipitation with different durations are also different. In order to investigate the differences of RSD between different precipitation, we will focus the discussion on the RSD differences between SPA (Short-duration Precipitation Amount, duration of precipitation is less than 3 h, and referenced from Yu et al. (2007b) and LPA (Long-duration Precipitation Amount, duration of precipitation is longer than 6 h) based on the different HR, and the differences of convective and stratiform rainfall between SPA and LPA. Mean and standard deviation values of Dm, log10Nw, LWC, Z, µ and Λ in daytime and nighttime are given in Table1.
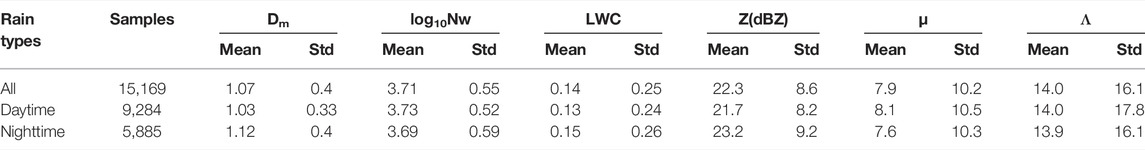
TABLE 1. Mean (standard deviation) of several integral RSD parameters for rainfall.
3 Results
3.1 Synoptic Environment and Precipitation Daily Variation
Figure 2 shows the seasonal mean of the ERA5 reanalysis wind field and relative humidity at 850 hPa from the year 2019–2020. As can be seen, the warm and moist air is transported from the Indian Ocean and South China Sea to the continent by the dominant southwesterly winds, and the mean relative humidity is around 70%–80% in ZG region. In the context of terrain obstruction (Figure 1), the southwest warm and humid airflow formed a vortex around the mountain range nearby ZG region, and the average relative humidity of this vortex was maintained above 80%. If there is a low-pressure trough or vortex moving eastward on the Tibetan Plateau, the heavy rainfall or extreme precipitation will easily occur at ZG region under the combined effect of topography and thermal conditions in the mountains (Wang et al., 2020).
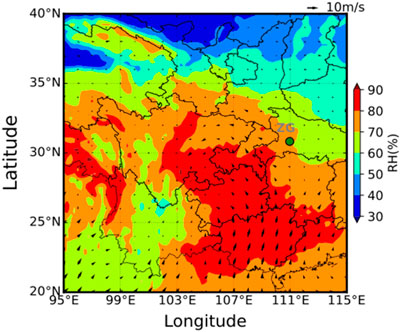
FIGURE 2. Mean wind field and relative humidity (%) at 850 hPa based on the ERA5 data. The scale of the wind vector (10 m s−1) is marked by wind arrows at the top of panels, while relative humidity is revealed by the color bar.
Based on the synoptic environments described above, the hourly precipitation frequency (PF) and precipitation intensity (PI) were calculated by using the hour precipitation data of auto weather station (AWS), it can be found that the occurrence and development of precipitation had obvious the characteristic of daily variation in Figure 3. The peak of PF occurs mainly at 0900 BJT during the daytime (DT), and the secondary peak occurs at 2300 BJT during the night-time (NT) (Figures 3A,B). The PI peaks occur at 1800 BJT and 2200 BJT, and this is consistent with the results of Yu et al. (2007b). From the diurnal variation of hourly precipitation, it can be inferred that the precipitation can be triggered in the early morning over valley terrain. The surface temperature increases during the DT by the influences of solar shortwave radiation, atmospheric instability and convective weather activity are also increased, which results in the increasing of short time heavy precipitation (Yu et al., 2007a). Although the PF_NT and PI_NT peaks are slightly smaller than that of DT precipitation, the PI value of NT is significantly greater than that of DT, suggesting that the NT precipitation is mainly caused by persistent precipitation, and this is closely related to large-scale circulation and stratiform precipitation (Chen et al., 2010). Because of the weakening of the atmospheric thermal effect at NT and the weakening of the thermal convective precipitation, which leads to the gradually weaken of the precipitation system, so that the PF has a valley value at 0700 in the early morning (Figure 3A). In addition, the ground temperature reduced by 5°C at the time of PF minimum, and the RH decreased from 93% at the beginning of precipitation to about 86% in Figures 3C,D. Precipitation was found to enhance with decreasing temperature and humidity under high temperature and high humidity conditions, which Utsumi et al. (2011) suggested was mainly caused by the long duration of precipitation.
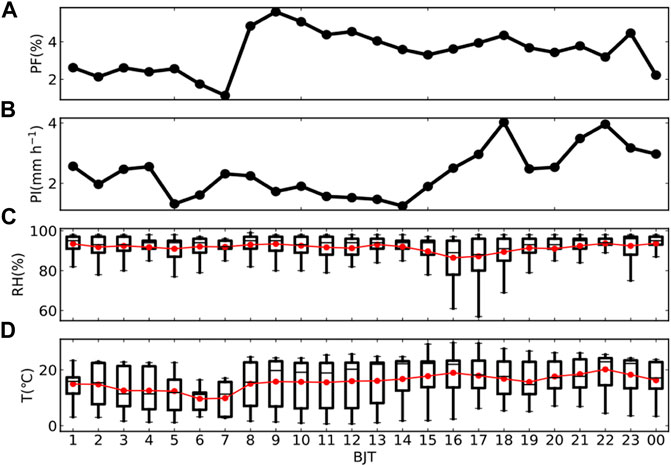
FIGURE 3. Diurnal variations of PF(Precipitation Frequency, unit:%) (A), PI (Precipitation Intensity, unit: mm h−1) (B), RH (Relative Humidity, unit:%) and the red line is mean value of RH (C), and T (Temperature, unit:°C) and the red line is mean value of T (D) averaged over the ZG region.
3.2 Diurnal Variations of RSDs With Respect to Different Relative Humidity
Past studies have suggested that the variation of precipitation with temperature is mainly related to water vapor conditions (Fan et al., 2007; Qian et al., 2010), and the above studies have also shown that the diurnal variation of precipitation is related to the RH. Considering that RSD is the main microphysical parameter to characterize precipitation, it is necessary to analyze the diurnal variations of RSD and the difference of diurnal variation of RSD under different RH conditions.
The 2DVD-based RSD characteristics for the DT and NT are shown in Figure 4. In the this plot, the DT precipitation has been dominated by mean raindrops diameter with 0.6–1.4 mm, corresponding to center of log10Nw is between 3.2 and 4.25 mm−1m−3, while the raindrops size of NT precipitation have been dominated by 0.8–1.7 mm, corresponding to a center of log10Nw between 3.2 and 4.2 mm−1m−3. In addition, the Dm-Nw distributions of DT and NT are compared with the maritime and continental clusters (green and red colored rectangular boxes in Figures 4C,D) of Bringi et al. (2003). From Figures 4C,D, it is apparent that the Dm-Nw parameter of DT and NT precipitation are close to those of “maritime-like” systems. This characteristic is similar with the result of Chen et al. (2017).
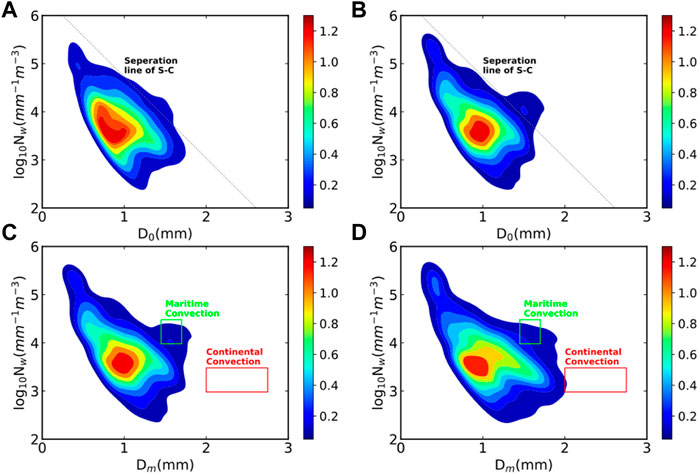
FIGURE 4. Probability density distribution of D0-log10Nw for DT (A) and NT (B) with stratiform and convective separation line(inclined black dashed line) of Bingi et al. (2003). Distribution of Dm and log10Nw over period of DT (C) and NT (D). Green and red rectangular boxes represent continental-like and maritime-like convection, respectively.
Figure 5 illustrates the distributions of Dm, log10Nw, µ, liquid water content (LWC) and RH. There were large variations of Dm with time. The Dm values varied from 0.37 to 3.93 mm, and the minimum and maximum Dm values occurred at 05:00 and 0400 BJT, respectively (Figure 5A). The Dm larger than 1.0 mm dominated from 00:00 to 09:00 BJT (before PF1_peak), and then the mean Dm decreasing remarkably between 09:00 to 14:00 BJT. The maximum Dm at 14:00 BJT is significantly smaller than the other times, but the RH is close to 95% at this time. Moreover, the RH gradually decreases before PI1_peak, and the maximum Dm shows an increasing trend at the moment. The Nw distribution showed inversely to Dm; however, no inverse relationship was identified between Dm and Nw after the PI1_peak (Figure 5B).
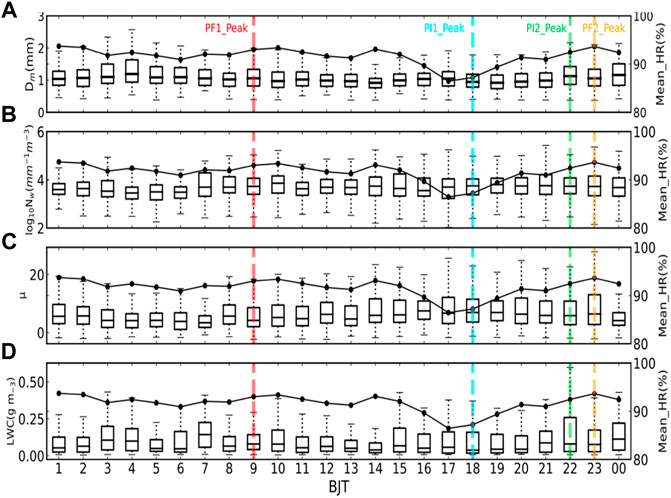
FIGURE 5. Time series of (A) Dm, (B) log10Nw,(C) µ, and (D) LWC with mean humidity for the total period. Solid lines are the mean relative humidity for each time. Red dashed line is the PF peak, orange dashed line is the second peak of PF, blue dashed line is the PI peak, and green dashed line is the second peak of PF.
For the distribution of µ and LWC, there was an increasing trend from 17:00 to 23:00 BJT followed by a remarkably decreasing trend from 00:00 to 08:00 BJT (Figure 5C). Note that the time of the sharp decline for RH between 14:00 and 17:00 BJT is simultaneous with the mean of µ value increasing. Then, the LWC shows a valley at 14:00 BJT, corresponding to RH being close to saturation state. Moreover, the LWC trend shows a gradually increases when RH decreases sharply (Figure 5D). In order to compare the RSDs differences between different RH conditions the RH is classified as relative dry (RH<60%), semi-moist (60%∼70%), moist (80%∼90%) and very moist(>90%). The mean values of Dm, log10Nw, LWC, Z, µ, Λ and R corresponding to different RH conditions are given in Table 1, respectively. We can see that relative large Dm and small log10Nw are displayed during the relative dry (RH<60%), and the mean of μ decreases with the increase of RH. It is inferred from the lower RH condition will benefit to the formation of large raindrops. Moreover, the mean of log10Nw (μ) increases (decreases) with the increase of RH (Table 1).
For the distribution of µ and LWC, there is an increasing trend from 8:00 to 23:00 BLT, followed by a significant decreasing trend from 00:00 to 8:00 BST (Figure 5C). Note that the sharp decrease in RH between 14:00 and 17:00 BLT is consistent with the increase in the mean value of µ. Then, the LWC shows a trough at 14:00 BJT corresponding to the RH is close to saturation. Moreover, the trend of LWC shows a gradual increase when RH decreases sharply (Figure 5D). This indicates that the sharp decrease in RH facilitates the evaporation process in clouds, which increases the liquid water content in the atmosphere and accelerates the formation of large raindrops. To compare the differences in RSDs under different RH conditions, the RH is classified as relatively dry (RH<60%), semi-wet (60%–70%), wet (80%–90%), and very wet (>90%). The mean values of Dm, log10Nw, LWC, Z, μ, Λ and R for different RH conditions are given in Table 2, respectively. We can see that Dm is relatively large and log10Nw is small at the relatively dry condition (RH<60%), while the mean value of μ decreases with increasing RH. It can be inferred that lower RH conditions will benefit to the formation of large raindrops. In addition, the mean value of log10Nw (μ) increases (decreases) with increasing RH (Table 2).
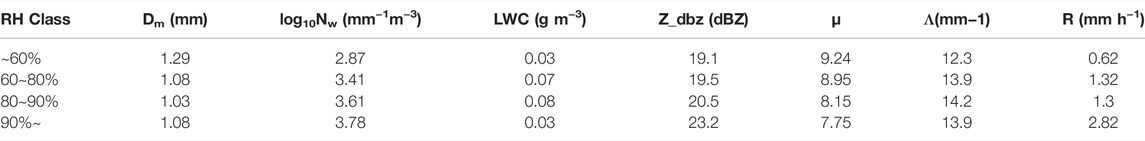
TABLE 2. Mean values of Dm, log10Nw, LWC, Z_dbz, µ, Λ and R for different relative humidity.
3.3 RSD Differences of SPA and LPA
Since different property of precipitation corresponds to different durations, and has an important effect on the diurnal variation of precipitation(Yu et al., 2007a; Chen et al., 2010; Han et al., 2017). Using the definitions in Section 2.2, the RSDs differences of precipitation during the SPA (Short-duration precipitation Amount) and LPA(Long-duration precipitation Amount) are analyzed.
Figure 6A shows a peak of SPA and LPA at 09:00 BJT (black line) and 12:00 BJT (blue line), and the PF value of LPA is always lager than that of SPA. The peak of PI for SPA coincide with the LPA at 19:00 BJT, the time series of LPA_PI displays considerably larger values than that of SPA between 18:00 and 09:00 BJT, but the PI of SPA is significantly greater than that of LPA between 12:00 and 16:00 BJT (Figure 6B). Compared with the RH and ground temperature of SPA and LPA, the RH is mainly distributed between 80% and 90% for SPA, and the minimum of mean RH is about 75% at 16:00 BJT(Figure 6C). For LPA, it is obvious that the average RH of LPA basically to sustain around 93% near saturation, and only the average RH decreases to below 90% when the precipitation reaches the peak (Figure 6D). The positive △T occurs mainly from 07:00 to 17:00 BJT in LPA, and the △T are below 0°C from 18:00 to 22:00 BJT, which is exactly to coincide with the two peaks of PI in the NT of LPA (Figures 6E,F). This temperature gradient formed by the difference between DT warming and NT cooling is easy to excite topographic thermal circulation for valley topography, which often facilitates the triggering and development of convective systems by superimposing topographic effects.
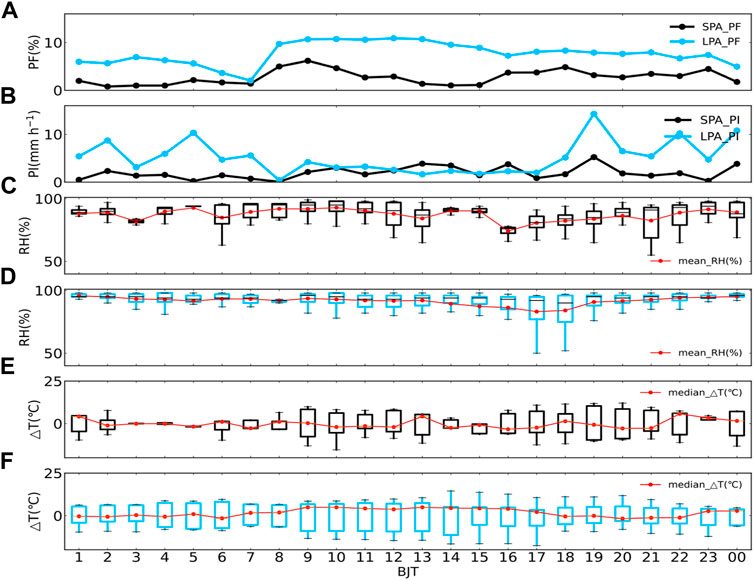
FIGURE 6. Diurnal variations of PF(Precipitation Frequency, unit:%), PI(Precipitation Intensity, unit: mm h−1), RH(Relative Humidity, unit:%) and △T(Temperature deviation, unit:°C) for SPA and LPA. The blue line and boxplot represent the LPA, the black line and boxplot represent the SPA, and the red lines are mean value of RH and T, respectively.
According to previous studies(e.g., Porcù et al., 2014; Wen et al., 2016; Krishna et al., 2016; Ma et al., 2019), the time evolution of RSDs show a regular behavior with respect to rain intensity, and the RSD is a key feature for describing liquid precipitation. Figure 7 shows the diurnal variations of RSD in the different RH conditions between SPA and LPA. For the RSDs of SPA, the RSDs of DT show a structure of single, double and triple peaks at different RH conditions, and the RSDs shape of SPA_DT is generally concave upward, especially, a significant increase in the number concentration of raindrops with a diameter of 3–4 mm is observed (Figure 7A). Compared to RSDs of SPA_DT, the RSDs of SPA-NT have nearly exponential distribution with less tendency toward concavity, and raindrop concentration of NT is higher than that of DT when the RH is above 90%. However, the width of RSDs shape in SPA-NT is significantly smaller than that of SPA_DT, and this characteristic is similar with the diurnal variation of RSDs in Tibetan Plateau (Chen et al., 2017). The day-night difference in the RSDs of SPA and LPA most likely indicate that the microphysical processes that dominate SPA and LPA are significantly different. For the SPA, the collision-coalescence is more effective at day than night, due to the coalescence produces a decrease of small drops and an increase of large drops (Rosenfeld & Ulbrich, 2003).
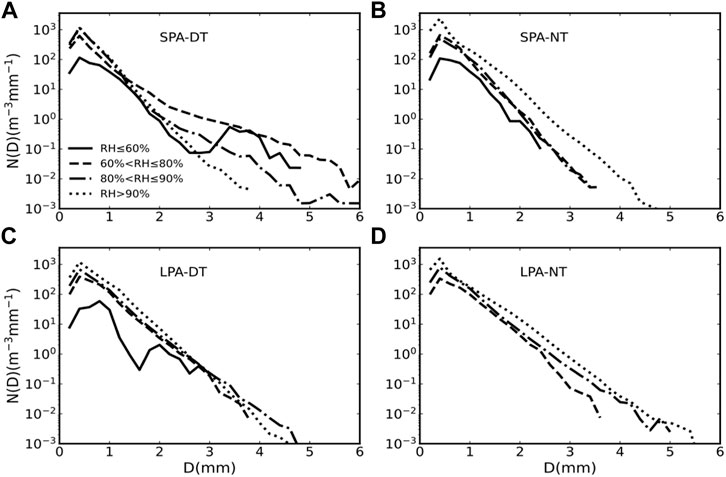
FIGURE 7. Mean raindrop concentration in the DT and NT of SPA (A,B) and LPA (C,D) under different RH condition.
In Figures 7C,D, the RSD shapes of the 2.4–3 mm and 1.6 mm diameters are concave-shaped and inverted-triangular in the SPA_DT and LPA_DT in the case of low relative humidity, respectively. This characteristic shows that both the RSDs of SPA_DT and LPA_DT have an evaporation spectrum when the ambient humidity is relatively dry, the main feature is that the number concentration of small drops decreases rapidly with the increase of diameter, the slope of the curve is large, and the curve of larger drops concentration is small and the curve is relatively flat. The RSD shape is similar to the simulated result of Hu and Sivastava. (1995) with obvious evaporation process, which illustrates the melting and collision-coalescence of large raindrops in SPA_DT are obviously stronger than those of LPA_DT. Compared with the night difference in the RSDs of SPA, the RSDs of LPA_NT shows a broader distribution than that of DT, which is opposite to the day-night RSD difference of SPA. The RSDs shape of LPA is generally concave downward, which is similar to the results of other studies (Porcù et al., 2014; Huang et al., 2021).
3.4 RSDs Between Convective and Stratiform Rainfall in SPA and LPA
To find out the RSDs differences in convective and stratiform regimes of SPA and LPA, the probability distribution functions (PDFs) of the integral parameters log10R, Dm, log10LWC, log10Nw, Z, and µ) for SPA are calculated and are given in Figure 8. The precipitation is classified into stratiform and convective type by adopting the Bringi et al. (2003). That is, if the standard deviation of rain rate over five consecutive DSD samples is > 1.5 mm h−1 and rain rate is > 5 mm h−1, then it is classified as convective. Otherwise, it is assumed to be stratiform if the standard deviation of rain rate is ≤1.5 mm h−1.
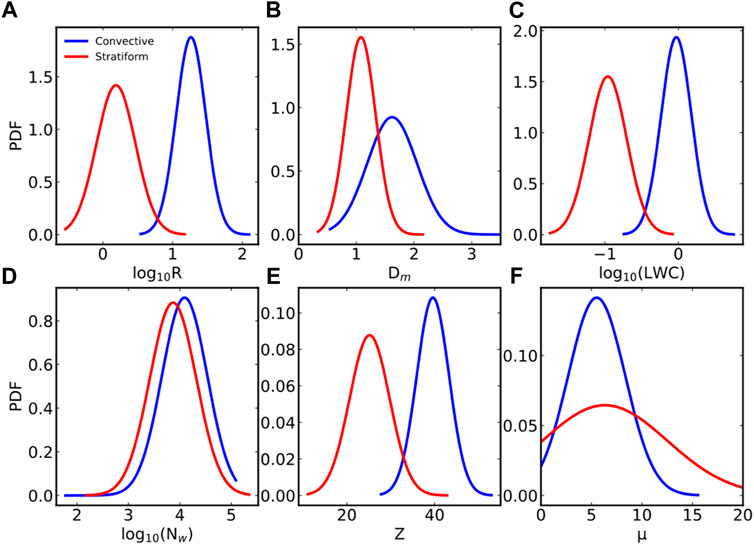
FIGURE 8. The probability distribution functions (PDFs) of (A) rain rate, log10R(mm h−1), (B) mass-weighted mean diameter, Dm(mm), (C) liquid water content, log10LWC(g m−3), (D) normalized intercept parameter, log10Nw (m−3mm−1), (E) radar reflective, Z,(F) shape parameter, µ for convective and stratiform rainfall in SPA.
The PDF distribution of rain rate shows that the peak frequency is higher for convective distribution than for the stratifrom distribution in SPA when log10R > 0.8 dB (Figure 8A). The Dm distribution curve in convective is distinctly different from stratiform, and the Dm distribution shows peak PDF values around 1.4–1.8 mm in convective rainfall and around 0.7–1.2 mm in stratiform rainfall(Figure 8B). The PDF of liquid water content (log10LWC) shows a similar distribution curves with log10R and a comparatively more frequency in convective compared to stratiform for log10LWC > −0.6 dB(Figure 8C). The probability distribution of normalized intercept parameter (log10Nw) shows a higher percentage at lower log10Nw values in stratiform and a higher percentage at higher log10Nw values in convective rainfall(Figure 9D). The radar reflectivity (Z) distribution shows peak PDF values at 40 dBZ is higher in convective rainfall than that of stratiform rainfall (23dBZ, Figure 8E). The distribution of µ is higher in stratiform than convective rainfall for µ>10(Figure 8F), which suggests a narrower RSDs shape in stratifrom than convective rainfall.
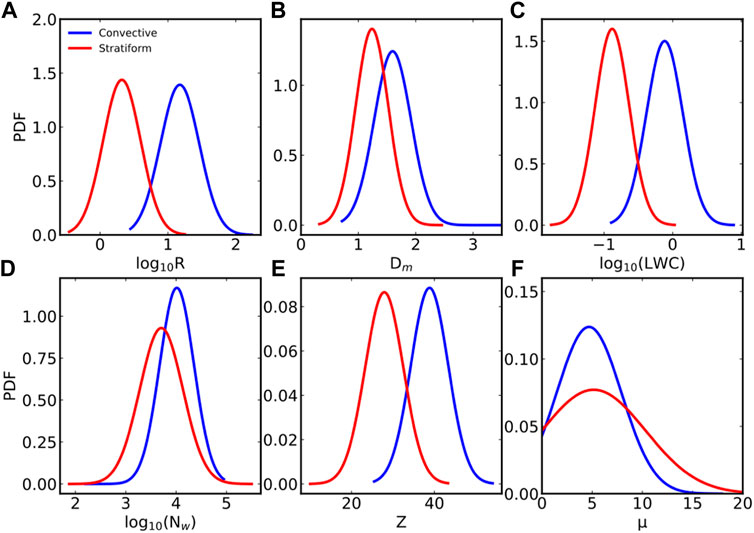
FIGURE 9. The probability distribution functions (PDFs) of (A) rain rate, log10R(mm h−1), (B) mass-weighted mean diameter, Dm(mm), (C) liquid water content, log10LWC(g m−3), (D) normalized intercept parameter, log10Nw (m−3mm−1)), (E) radar reflective, Z, (F) shape parameter, µ for convective and stratiform rainfall in LPA. The blue and red lines represent the PDF of convective and stratiform precipitation, respectively.
Comparing with the probability distribution functions (PDFs) of the integral parameters in SPA, overall, there are some differences between probability distributions of RSDs in SPA and LPA (Figure 9). The PDF peaks of rain rate and LWC in stratiform rainfall for LPA are higher than that of convective rainfall, and these characteristics are exactly the opposite of SPA. The distribution of rain rate, Dm, and the shape parameter highlights the dominance of light, small-moderated drop rainfall with narrow size spectra in the stratiform than the convective rainfall. To further confirm the contribution of different size raindrops to the formation of SPA and LPA, the frequency distributions of different raindrop sizes in convective and stratiform regimes for SPA and LPA are given in Figure 10. For ease of description, the raindrops sizes are divided into very small (the diameter is smaller than 0.7 mm), small size (0.7–1.4 mm), medium size (1.4–2.44 mm) and large size (greater than 2.4 mm) (Hopper et al., 2019; Huang et al., 2021). We found that the stratiform precipitation in DT and NT for SPA is dominated by 0.7–1.44 mm, the convective precipitation of DT for this type was dominated by large sized raindrops, and NT convection is dominated by 1.4–2.44 mm. For LPA, the raindrops diameter distribution is relatively uniform, with small size raindrops accounting for 78.5% and 62% of DT and NT in stratiform precipitation, respectively, while convection rainfall is dominated by medium size raindrops (the frequencies of DT and NT are 67% and 86%, respectively).
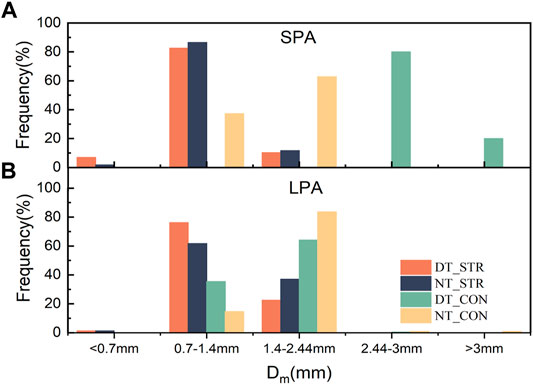
FIGURE 10. The Dm frequency of convective and stratifrom during DT and NT for SPA (A) and LPA (B).
4 Discussion and Conclusion
The diurnal variations of RSD characteristics in different precipitation system and different duration of precipitation by the influences of relative humidity have been investigated based on the RSD spectra from 2DVD deployed at ZG. Along with the 2DVD, hourly rainfall, temperature (T) and relative humidity(RH) values from the in situ AWS, as well as ERA-Interim data are used to illustrate the effect of relative humidity on the diurnal variations and its connections to the microphysical mechanism.
The synoptic background of the ZG region are different from those of the plain and plateau of China(Volker et al., 2008; Zhou et al., 2008), the southwest warm and humid airflow formed a vortex around the mountain range nearby ZG region, and the average relative humidity of this vortex was maintained above 80%. In the context of the climatic condition, the frequency and intensity of precipitation show a bimodal structure, namely, a peak of precipitation frequency mainly appeared at 09:00 BJT and 23:00 BJT, and the peak of precipitation intensity mainly appeared at 18:00 BJT and 22:00 BJT.
The diurnal variation of precipitation has a relation with the RSD characteristics, we found that the Dm-Nw distributions of daytime (DT) and nighttime (NT) is close to the “maritime-like” cluster. Overall, the relative large Dm and small log10Nw are displayed during the relative dry (RH<60%). Based on the classification of the SPA (Short-duration precipitation Amount) and LPA(Long-duration precipitation Amount), the RSDs shape of SPA_DT and LPA_DT show a triple peaks when the RH is less than 60%, and the RSDs structure in other RH conditions are single peak. A remarkable difference in the RSDs of DT between SPA and LPA is that the RSDs shape of SPA_DT is generally concave upward, and the RSDs shape of LPA_DT is generally concave downward. It indicates that the RSDs of LPA is mainly controlled by the collision-coalescence and breakup in warm clouds. In the case of lower RH condition, the melting and collision-coalescence of large raindrops in SPA_DT are obviously stronger than those of LPA_DT. Compared with the night difference in the RSDs of SPA, the RSDs of LPA_NT shows a broader distribution than that of DT, which is opposite to the day-night RSD difference of SPA.
In addition, statistical analysis is performed for the contribution of different scale particles to different types of precipitation in SPA and LPA. The results show that the stratiform precipitation in SPA is dominated by the raindrop diameter of 0.7–1.44 mm, the convective precipitation of DT for this type is dominated by large sized raindrops, and NT convection is dominated by medium size raindrops (1.4–2.44 mm). For the stratiform of LPA, the raindrops with small size raindrops accounting for 78.5% and 62% in the DT and NT, respectively. But for convection rainfall is dominated by medium size raindrops (the frequencies of DT and NT are 67% and 86%, respectively).
This study has provided some new insights into the diurnal variation of RSDs and the associated the ground meteorological condition for the different types and durations, which was utilized to address the diurnal variations of precipitation and RSDs, the RSDs differences of SPA and LPA and the effect of relative humidity on RSDs in different precipitation. Effects of other factors on the diurnal variation of RSD, for example, horizontal and vertical winds, and its impact on the diurnal variation of RSDs will been quantitatively studied in the future study. Of course, it is necessary to extract more information about the evolution of RSD from other observations, including polarimetric radars, micro rain radar, and microwave radiometers. The understanding would greatly benefit from additional information, such as the hydrometer types, hydrometer spatial distributions, raindrops fall velocity, the evolution of RSD with height and liquid water mass. For the follow-up studies, the above information and wind tower data will be analyzed to improve the conclusions.
Data Availability Statement
The datasets presented in this study can be found in online repositories. The names of the repository/repositories and accession number(s) can be found below: https://cds.climate.copernicus.eu/.
Author Contributions
JS: Conceptualization, methodology, writing-original draft, visualization. RW: Validation, supervision, funding acquisition. YZ: Conceptualization, writing- review and Editing.
Funding
This research was funded by the National key R&D Program of China (Grant No. 2018YFC1507201), and the National Natural Science Foundation of China (Grant No. 41875170) and The Open Grants of the State Key Laboratory of Severe Weather (Grant No.2021LASW-A03).
Conflict of Interest
The authors declare that the research was conducted in the absence of any commercial or financial relationships that could be construed as a potential conflict of interest.
Publisher’s Note
All claims expressed in this article are solely those of the authors and do not necessarily represent those of their affiliated organizations, or those of the publisher, the editors and the reviewers. Any product that may be evaluated in this article, or claim that may be made by its manufacturer, is not guaranteed or endorsed by the publisher.
References
Abel, S. J., and Boutle, I. A. (2012). An Improved Representation of the Raindrop Size Distribution for Single-Moment Microphysics Schemes. Q.J.R. Meteorol. Soc. 138, 2151–2162. doi:10.1002/qj.1949
Adirosi, E., Gorgucci, E., Baldini, L., and Tokay, A. (2014). Evaluation of Gamma Raindrop Size Distribution Assumption through Comparison of Rain Rates of Measured and Radar-Equivalent Gamma DSD. J. Appl. Meteor. Climatol. 53, 1618–1635. doi:10.1175/JAMC-D-13-0150.1
Atlas, D., and Ulbrich, C. W. (2000). An Observationally Based Conceptual Model of Warm Oceanic Convective Rain in the Tropics. J. Appl. Meteor. 39, 2165–2181. doi:10.1175/1520-0450(2001)040<2165:AOBCMO>2.0.CO;2
Bringi, V. N., Chandrasekar, V., Hubbert, J., Gorgucci, E., Randeu, W. L., and Schoenhuber, M. (2003). Raindrop Size Distribution in Different Climatic Regimes from Disdrometer and Dual-Polarized Radar Analysis. J. Atmos. Sci. 60 (2), 3542–4365. doi:10.1175/1520-0469(2003)0602.0.CO10.1175/1520-0469(2003)060<0354:rsdidc>2.0.co;2
Chen, B., Hu, Z., Liu, L., and Zhang, G. (2017). Raindrop Size Distribution Measurements at 4,500 M on the Tibetan Plateau during TIPEX-III. J. Geophys. Res. Atmos. 122, 092–111. doi:10.1002/2017JD027233
Chen, H., Yu, R., Li, J., Yuan, W., and Zhou, T. (2010). Why Nocturnal Long-Duration Rainfall Presents an Eastward-Delayed Diurnal Phase of Rainfall Down the Yangtze River Valley. J. Clim. 23 (4), 905–917. doi:10.1175/2009JCLI3187.1
Dolan, B., Fuchs, B., Rutledge, S. A., Barnes, E. A., and Thompson, E. J. (2018). Primary Modes of Global Drop Size Distributions. J. Atmos. Sci. 75, 1453–1476. doi:10.1175/JAS-D-17-0242.1
Fan, J., Zhang, R., Li, G., and Tao, W.-K. (2007). Effects of Aerosols and Relative Humidity on Cumulus Clouds. J. Geophys. Res. 112 (D14), D14204. doi:10.1029/2006JD008136
Gorgucci, E., Scarchilli, G., Chandrasekar, V., and Bringi, V. N. (2001). Rainfall Estimation from Polarimetric Radar Measurements: Composite Algorithms Immune to Variability in Raindrop Shape-Size Relation. J. Atmos. Ocean. Technol. 18, 1773–1786. doi:10.1175/1520-0426(2001)018%3C1773:REFPRM%3E2.0.CO;210.1175/1520-0426(2001)018<1773:refprm>2.0.co;2
Han, H., Wu, H. M., and Huang, A. N. (2017). Temporal and Spatial Distributions of the Diurnal Cycle of Summer Precipitation over North China. Chin. J. Atmos. Sci. (in Chinese) 41 (2), 263–274. doi:10.3878/j.issn.1006-9895.1610.15312
Held, I. M., and Soden, B. J. (2006). Robust Responses of the Hydrological Cycle to Global Warming. J. Climate 19, 5686–5699. doi:10.1175/JCLI3990.1
Hopper, L. J., Schumacher, C., Humes, K., and Funk, A. (2019). Drop-Size Distribution Variations Associated with Different Storm Types in Southeast Texas. Atmosphere 11, 8. doi:10.3390/atmos11010008
Hu, Z., and Srivastava, R. C. (1995). Evolution of Raindrop Size Distribution by Coalescence, Breakup, and Evaporation: Theory and Observations. J. Atmos. Sci. 52 (10), 1761–1783. doi:10.1175/1520-0469(1995)052<1761:eorsdb>2.0.co;2
Huang, C., Chen, S., Zhang, A., and Pang, Y. (2021). Statistical Characteristics of Raindrop Size Distribution in Monsoon Season over South China Sea. Remote Sensing 13, 2878. doi:10.3390/rs13152878
Jiang, L., Li, G., and Wang, X. (2015). Comparative Study Based on TRMM Data of the Heavy Rainfall Caused by the Tibetan Plateau Vortex and the Southwest Vortex. Chinese. J. Atmos. Sci. 39 (2), 249–259. doi:10.3878/j.issn.1006-9895.1407.13260
Kozu, T., Shimomai, T., Akramin, Z., MarzukiShibagaki, Y., Shibagaki, Y., and Hashiguchi, H. (2005). Intraseasonal Variation of Raindrop Size Distribution at Koto Tabang, West Sumatra, Indonesia. Geophys. Res. Lett. 32, a–n. doi:10.1029/2004GL022340
Krishna, U. V. M., Reddy, K. K., Seela, B. K., Shirooka, R., Lin, P.-L., and Pan, C.-J. (2016). Raindrop Size Distribution of Easterly and Westerly Monsoon Precipitation Observed over Palau Islands in the Western Pacific Ocean. Atmospheric Research 174-175, 41–51. doi:10.1016/j.atmosres.2016.01.013
Kumar, S., and Reddy, K. (2013). Rain Drop Size Distribution Characteristics Of Cyclonic And North East Monsoon Thunderstorm Precipitating Clouds Observed Over Kadapa (14°4°N, 78°82′E), Tropical Semi-Arid Region of India. MAUSAM 64 (1), 35–48. doi:10.54302/mausam.v64i1.653
Ma, Y., Ni, G., Chandra, C. V., Tian, F., and Chen, H. (2019). Statistical Characteristics of Raindrop Size Distribution during Rainy Seasons in the Beijing Urban Area and Implications for Radar Rainfall Estimation. Hydrol. Earth Syst. Sci. 23 (10), 4153–4170. doi:10.1155/2021/666778610.5194/hess-23-4153-2019
Ochs, H. T., Beard, K. V., Laird, N. F., Holdridge, D. J., and Schaufelberger, D. E. (1995). Effects of Relative Humidity on the Coalescence of Small Precipitation Drops in Free Fall. J. Atmos. Sci. 52 (21), 3673–3680. doi:10.1175/1520-0469(1995)052%3C3673:EORHOT%3E2.0.CO;210.1175/1520-0469(1995)052<3673:eorhot>2.0.co;2
Porcù, F., D'Adderio, L. P., Prodi, F., and Caracciolo, C. (2014). Rain Drop Size Distribution over the Tibetan Plateau. Atmospheric Research 150, 21–30. doi:10.1016/j.atmosres.2014.07.005
Qian, J.-H., Robertson, A. W., and Moron, V. (2010). Interactions Among ENSO, the Monsoon, and Diurnal Cycle in Rainfall Variability over Java, Indonesia. J.Atmos.Sci. 67 (11), 3509–3524. doi:10.1175/2010JAS3348.1
Rao, G. H. (2005). Orographic Precipitation. Annu. Rev. Earth Planet. Sci. 33, 645–671. doi:10.1146/annurev.earth.33.092203.122541
Rosenfeld, D., and Ulbrich, C. W. (2003). Cloud Microphysical Properties, Processes, and Rainfall Estimation Opportunities. Meteorological Monographs 30 (52), 237. doi:10.1175/0065-9401(2003)030<0237:cmppar>2.0.co;2
Ryzhkov, A. V., Giangrande, S. E., Melnikov, V. M., and Schuur, T. J. (2005). Calibration Issues of Dual-Polarization Radar Measurements. J Atmos Ocean Technol 22, 1138–1155. doi:10.1175/JTECH1772.1
Schönhuber, M., Urban, H., Baptista, J. P., Randeu, W., and Riedler, W.(1994). Measurements of Precipitation Characteristics by a New Distrometer Preprints, Proceedings of Atmospheric Physics and Dynamics in the Analysis and Prognosis of Precipitation Fields, La Sapienza, Rome, Italy. Universita degli studi di Roma. 15–18.
Seela, B. K., Janapati, J., Lin, P.-L., Wang, P. K., and Lee, M.-T. (2018). Raindrop Size Distribution Characteristics of Summer and Winter Season Rainfall over North Taiwan. J. Geophys. Res. Atmos. 123, 602–611. doi:10.1029/2018JD028307
Sobel, A. H., and Bretherton, C. S. (2000). Modeling Tropical Precipitation in a Single Column. J. Climate 13, 43782–44392. doi:10.1175/1520-0442(2000)0132.0.CO10.1175/1520-0442(2000)013<4378:mtpias>2.0.co;2
Suh, S.-H., Kim, H.-J., Lee, D.-I., and Kim, T.-H. (2021). Geographical Characteristics of Raindrop Size Distribution in the Southern Parts of South Korea. J. Climate. Appl. Meteor. 60, 157–169. doi:10.1175/JAMC-D-20-0102.1
Suh, S.-H., You, C.-H., and Lee, D.-I. (2016). Climatological Characteristics of Raindrop Size Distributions in Busan, Republic of Korea. Hydrol. Earth Syst. Sci. 20, 193–207. doi:10.5194/hess-20-193-2016
Tang, Y. L., Xu, G. R., and Wan, R. (2022). Temporal and Spatial Distribution Characteristics of Short-Duration Heavy Rainfall in the Yangtze River Basin during the Main Flood Season of 2020. Transactions of Atmospheric Sciences 45 (2), 212–224. doi:10.13878/j.cnki.dqkxxb.20211124002
Thurai, M., Bringi, V. N., and May, P. T. (2010). CPOL Radar-Derived Drop Size Distribution Statistics of Stratiform and Convective Rain for Two Regimes in Darwin, Australia. J. Atmos. Ocean. Technol. 27 (5), 932–942. doi:10.1175/JAMC-D-20-0102.110.1175/2010jtecha1349.1
Thurai, M., Gatlin, P., Bringi, V. N., Petersen, W., Kennedy, P., Notaroš, B., et al. (2017). Toward Completing the Raindrop Size Spectrum: Case Studies Involving 2D-Video Disdrometer, Droplet Spectrometer, and Polarimetric Radar Measurements. J.Appl.Meteorol.Climatic. 56, 877–896. doi:10.1175/JAMC-D-16-0304.1
Tokay, A., Petersen, W. A., Gatlin, P., and Wingo, M. (2013). Comparison of Raindrop Size Distribution Measurements by Collocated Disdrometers. J. Atmos. Ocean. Technol. 30 (8), 1672–1690. doi:10.1175/JTECH-D-12-00163.1
Utsumi, N., Seto, S., Kanae, S., Maeda, E. E., and Oki, T. (2011). Does Higher Surface Temperature Intensify Extreme Precipitation? Geophys. Res. Lett. 38 (16), 239–255. doi:10.1029/2011GL048426
Volker, W., Andreas, B., Bauer, H. S., Kottmeier, C., Corsmier, U., Blyth, A. M., et al. (2008). The Convective and Orographically Induced Precipitation Study: A Research and Development Project of the World Weather Program for Improving Quantitative Precipitation Forecasting in Low-Mountain Regions. Bull.Amer.Meteor.Soc 89, 1477–1486. doi:10.1175/2008BAMS2367.1
Wang, X., Li, C., Yang, H., Wang, J., Fu, S., Wang, M., et al. (2020). Research Progress on East- Moving Cloud Clusters from the Qinghai-Tibet Plateau. Torrential Rain and Disasters 39 (5), 433–441. (in Chinese). doi:10.3969/j.issn.1004-9045.2020.05.001
Wen, L., Zhao, K., Zhang, G., Xue, M., Zhou, B., Liu, S., et al. (2016). Statistical Characteristics of Raindrop Size Distributions Observed in East China during the Asian Summer Monsoon Season Using 2-D Video Disdrometer and Micro Rain Radar Data. J. Geophys. Res. Atmos. 121, 2265–2282. doi:10.1002/2015JD024160
Xiaobing, Y., Chenliang, L., Tongzhao, H., and Zhonghui, J. (2021). Information Diffusion Theory-Based Approach for the Risk Assessment of Meteorological Disasters in the Yangtze River Basin. Nat Hazards 107 (3), 2337–2362. doi:10.1007/s11069-020-04418-6
Yihui, D., and Chan, J. C. L. (2005). The East Asian Summer Monsoon: An Overview. Meteorol. Atmos. Phys. 89 (1–4), 117–142. doi:10.1007/s00703-005-0125-z
You, Y., Ting, M., and Camargo, S. J. (2021). Heavy Rain-Producing Terrestrial Low-Pressure Systems Over East Asian Summer Monsoon Region: Evolution, Energetics, and Trend. J.Climate. 34, 1–40. doi:10.1175/JCLI-D-20-0667.1
Yu, R., and Li, J. (2012). Hourly Rainfall Changes in Response to Surface Air Temperature over Eastern Contiguous China. J. Climate. 25 (19), 6851–6861. doi:10.1175/JCLI-D-11-00656.1
Yu, R., Xu, Y., Zhou, T., and Li, J. (2007b). Relation between Rainfall Duration and Diurnal Variation in the Warm Season Precipitation over Central Eastern China. Geophys. Res. Lett. 34 (13), 1–4. doi:10.1029/2007GL030315
Yu, R., Zhou, T., Xiong, A., Zhu, Y., and Li, J. (2007a). Diurnal Variations of Summer Precipitation over Contiguous China. Geophys. Res. Lett. 34 (1), 223–234. doi:10.1029/2006GL028129
Yuter, S. E., Kingsmill, D. E., Nance, L. B., and Löffler-Mang, M. (2006). Observations of Precipitation Size and Fall Speed Characteristics within Coexisting Rain and Wet Snow. J. Appl. Meteor. Climatol. 45, 1450–1464. doi:10.1175/JAM2406.1
Zagrodnik, J. P., McMurdie, L. A., and Houze, R. A. (2018). Stratiform Precipitation Processes in Cyclones Passing over a Coastal Mountain Range. J. Atmos. Sci. 75, 983–1004. doi:10.1175/JAS-D-17-0168.1
Zhang, Y., Klein, S. A., Liu, C., Tian, B., Marchand, R. T., Haynes, J. M., et al. (2008). On the Diurnal Cycle of Deep Convection, High-Level Cloud, and Upper Troposphere Water Vapor in the Multiscale Modeling Framework. J. Geophys. Res. 113 (1-19), D16105. doi:10.1029/2008jd009905
Keywords: raindrop size distribution (RSD), precipitation, relative humidity, Southwest of China, diurnal variation
Citation: Sun J, Wan R and Zhou Y (2022) Effects of Relative Humidity on the Diurnal Variation of Raindrop Size Distribution in Southwest China. Front. Environ. Sci. 10:948318. doi: 10.3389/fenvs.2022.948318
Received: 19 May 2022; Accepted: 06 June 2022;
Published: 27 June 2022.
Edited by:
Honglei Wang, Nanjing University of Information Science and Technology, ChinaCopyright © 2022 Sun, Wan and Zhou. This is an open-access article distributed under the terms of the Creative Commons Attribution License (CC BY). The use, distribution or reproduction in other forums is permitted, provided the original author(s) and the copyright owner(s) are credited and that the original publication in this journal is cited, in accordance with accepted academic practice. No use, distribution or reproduction is permitted which does not comply with these terms.
*Correspondence: Rong Wan, d2Fucm9uZ0B3aGloci5jb20uY24=