 Yachao Xiong
 Changli Zhang1*
95% of researchers rate our articles as excellent or good
Learn more about the work of our research integrity team to safeguard the quality of each article we publish.
Find out more
ORIGINAL RESEARCH article
Front. Environ. Sci. , 29 June 2022
Sec. Interdisciplinary Climate Studies
Volume 10 - 2022 | https://doi.org/10.3389/fenvs.2022.945171
Fire is one of the disasters that frequently threaten public safety and social development, especially in developing countries such as China. The occurrence and spread of fire have distinctive characteristics. The analysis of fire causes and the summary of the unique patterns of fire with socioeconomic development and time can provide guidance and services for fire prevention. Therefore, based on the official data of China from 1999 to 2019, the current situation of fires in China is described in terms of four indicators, including the number of fires, the number of deaths, the number of injuries, and direct losses. In addition, the current situation, temporal volatility, and causes of the more severe fires in China were analyzed. The entropy weight-TOPSIS model was used to assess the fire patterns in China in the last two decades. The spatial correlation of fires in each province of China was analyzed by the Moran’s I index and LISA index. The results show that the overall fire situation in China has improved in the last two decades. Still, the spatial aggregation of fires is becoming more and more apparent, and human factors are the leading cause of fires in China. The study can provide a theoretical and decision-making basis for fire situation prognosis, fire prevention, and effective spatial allocation of fire prevention resources in China and other countries.
Fire is a common occurrence on the planet that has an impact on almost all ecosystems.(Pausas and Keeley, 2009; Krawchuk and Moritz, 2011). From its ancient use as a weapon to protect men from wild animals to improving soil fertilizing and food preparation, fire has played an important part in human history. It can also cause severe disasters that result in fatalities and injuries, as well as significant property losses and environmental damage (Pyne, 2016). Chemically, fire is an oxidation reaction that releases energy. Modern science has advanced to the point that we can comprehend the chemistry of fire and apply it to many contexts for the benefit of humans. At the same time, our understanding of fire has led us to better understand the causes of fire, the conditions under which fire might occur, and how to investigate any fire-related incident (Rahim, 2015). The frequency of fires has been observed over time, and this data is useful for fire prevention, infrastructure development, and law enforcement (Costa et al., 2011).
Fire statistics, as the basis of a fire situation analysis and research, is a science of collecting, analyzing, and researching fire-related data and information, including the time, location, property damage, casualties, and causes of fires, to reflect and reveal the widespread phenomenon of fires and fire characteristics and their laws in a certain period and region (Borys, 2017). The Center for Fire Statistics (CFS) of the International Association of Fire and Rescue Services (CFIT) is the primary organization responsible for collecting fire data from different countries worldwide. The latest World Fire Statistics Report publishes fire data from 34 countries and 32 cities for 2019, including the number of fires, their incidence, and deaths and injuries. These data are derived from responses to CFS requests and official reports published by countries based on different statistical rules. For example, the National Fire Protection Association (NFPA) estimates fire statistics for the United States based on a sample of public fire departments across the country (Evarts and Stein, 2020). Whereas in the United Kingdom, it is organized through a combination of community, local government departments, and the Fire and Rescue Service Department (FRSD), which is responsible for collecting data on all fires it participates in and transmitting the data to the Central Emergency Response Team(Anderson et al., 1983). The Chinese Ministry of Public Security is responsible for processing all fire statistics. The grassroots firefighting units report these fire statistics and then collect and aggregate them by the Fire Bureau of the Ministry of Public Security to generate national fire data (Lizhong et al., 2005). In 2018, fire data in China were organized by the Fire and Rescue Bureau of the Ministry of Emergency Management. Due to differences in statistical processes and methods, fire statistics in China have not been aligned with the rest of the world, and China is not included in the fire statistics published by the CFS.
China’s rapid economic development in the last two decades has been accompanied by significant changes in the fire situation in China (Guo and Fu, 2007). Previous studies analyzed the fire situation in China in 1998 using cross-section analysis (Lizhong et al., 2002). Fire frequency and fire characteristics during the phase time have also been described (Wang et al., 2018; Xin and Huang, 2014). In terms of research content, the existing studies focus on various characterizations of fires and lack an overall assessment of the current status of fires. Fires occur on a specific spatial and temporal scale, which means that fires have strong spatial and temporal characteristics. Studies on the spatial correlation of fires in China are relatively weak. The available studies have selected a short period in the study span. In addition, a significant change in China’s fire management system occurred in 2018, when the former Public Security Fire Force was officially transferred to the Ministry of Emergency Management (B. Wang and Wu, 2019). This institutional change is likely to affect the overall fire situation in China fundamentally, and the fire situation in China after this institutional change should also be the focus of the study. In summary, this paper analyzes the characteristics, comprehensive evaluation, spatial and temporal features, and causes of fires in China based on official statistics from 1999-to 2019, intending to provide a theoretical and decision-making basis for fire prevention and effective spatial allocation of fire prevention resources.
The data used in this paper are from the China Fire Statistics Yearbook published by the Fire Department of the Ministry of Public Security (Fire Department of Ministry of Public Security, 2001-2003; Fire Department of the Ministry of Public Security, 1999-2000), Fire Yearbook (Fire Department of Ministry of Public Security, 2004-2012; Fire Department of Ministry of Public Security, 2013-2017) and China Fire and Rescue Yearbook published by the Fire and Rescue Department of Ministry of Emergency Management (Fire and Rescue Department of Ministry of Emergency Management, 2018-2019). It is worth pointing out that China’s fire data is based on provinces as the statistical unit and does not include Hong Kong, Macau, and Taiwan. The data count all fires that caused injuries and property damage except for forest, grassland, underground mine, railroad, transportation, and port and shipping fires. The direct loss caused by the fire in the information is the sum of the direct property damage caused by fire, the cost of fire scene disposal, and the cost spent on personal injury and death. The statistical regions of the data are marked in Figure 1. In addition, we introduced the seven geographic divisions of China in Figure 1 to facilitate the spatial analysis below.
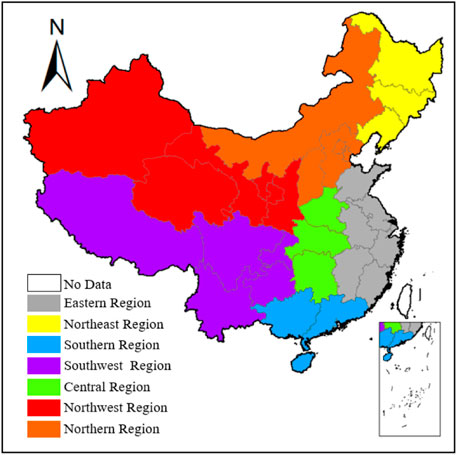
FIGURE 1. Regions covered by fire statistics.
The accident data could be beneficial for improving experience, developing lessons, and examining accident trends (Jacobsson et al., 2011; Moura et al., 2016). Statistical analysis of the accidents has proven to be a useful method (Moura et al., 2016; Lima et al., 2021). After collating the official data provided by the Ministry of Public Security and the Ministry of Emergency Management, we extracted the basic information on fire accidents in the last two decades by classification. We used statistical methods to characterize the number of fire accidents, deaths, injuries, direct losses, the profile of more severe fires, temporal volatility, and the causes of fires. In addition, the technique for order preference by similarity to an ideal solution (TOPSIS) model and spatial analysis are used to analyze the fire situation in China based on four fundamental indicators: number of fires, number of deaths, number of injuries, and direct losses.
At present, China’s fire statistics, the most important indicators to measure the severity of a region, a period of fire, or the four hands of fire, namely, the number of fires, fire deaths, fire injuries, direct property damage, it is a more comprehensive and systematic response to the degree of fire severity. In the statistical analysis of fires, we often compare the four indicators of fires in different years. Nevertheless, the direction of change of the indicators and the inconsistency of the degree of change leads to the difficulty in judging the severity of fires in that year in general. At the same time, the evaluation of direct property damage is a static one and does not consider the effect of inflation. In contrast, The technique for order preference by similarity to an ideal solution method (TOPSIS) can avoid the subjectivity of data, does not require an objective function, and can well portray the combined impact strength of multiple impact indicators (Tzeng and Huang, 2011). Hwang proposed the methodology for order preference by similarity to an ideal solution method (TOPSIS) in 1981, and it is a very efficient multi-objective decision analysis method (Hwang and Yoon, 1981). This method is based on ranking a finite number of evaluation objects according to their proximity to an idealized target. The specific procedure is as follows: first, the positive ideal solution and negative ideal solution of the evaluation objects are constructed, namely, the best and worst solution for each index; second, the schemes are ranked by calculating the relative progress of each solution to the ideal solution, which means the degree close to the positive ideal solution and negative ideal solution, to select the best solution. This method has been widely used in land use planning, project selection and decision-making, sustainable development evaluation, and other fields due to its scientific nature, accuracy, and high operability (Tseng et al. 2018). The specific steps to measure the combined form of fire using this method are as follows:
1) The normalized matrix is being calculated. The units and attributes of the evaluation indexes are different. To make horizontal comparisons of each index easier, this study employs the range standardization method to determine the normative decision matrix.
where
2) Calculate the weights by entropy weighting method.
In information theory, a system’s degree of order and disorder is measured by information and entropy, respectively. If the information entropy of an index is smaller, the more information it provides, the greater its role in the comprehensive evaluation, the greater its weight, and the more critical the corresponding index attributes are. The specific calculation steps are as follows:
where
Then calculate the weights of the indexes according to the Formula 3.
where
3) Make a weight normalization matrix.
where
4) Calculate the positive and negative ideal solutions.
5) Calculate the scale of distance. Determine the distance between each plan and the positive and negative ideal solutions.
where
6) Calculate the closeness of the evaluation object.
where
The first law of geography states that distance determines the strength of association, namely spatial autocorrelation (Tobler, 1970). This paper uses Moran’s I index and LISA index to analyze the spatial correlation of fires in Chinese provinces. The Moran’s I statistic is a widely used spatial autocorrelation statistic that can reflect the similarity of attribute values of spatially adjacent or close units with the following formula (Griffith, 1993).
where
The LISA index, also named Local Moran’s I index, can reflect the difference and significance between a region and its neighboring regions by the following formula (Anselin, 1995).
when
Over the last 20 years, China has experienced substantial changes in terms of economic and social conditions. Numerous important legislation and regulations were enacted, affecting China’s fire statistics. Statistical approaches are undergoing two crucial differences. The first was a change in fire level requirements in 2007, and the second was a change in statistical methodologies for fire losses in 2014.
A typical measure of the severity of a fire accident is the fire level. The State Council of PRC released Regulations on the Reporting and Investigation of Production Safety Accidents in June 2007, making changes to the fire level standard, divided into two phases in China for the previous two decades. Before 2007, there were three different degrees of fire classification: conflagration, major fire, and ordinary fire (Table 1). However, it was divided into four categories after 2007, as shown in Table 2: serious fire, conflagration, major fire, and ordinary fire. It is worth mentioning that the number of disaster-affected households is indicated in Table 1 under ‘Damaged residential settlements.’ If one of these criteria is met, the level is reached. The fire level of ‘particularly significant fire’ was developed in this fire statistical reform to assess larger fires at this stage. The standard of each fire level was adjusted to raise fire casualties and fire losses, indicating the Chinese government’s high priority for fire casualties.

TABLE 1. Standards for fire level before 2007.
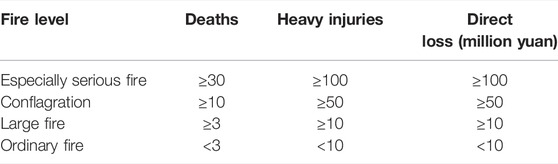
TABLE 2. Standards for fire level after 2007.
The Ministry of Public Security developed a new industry standard Statistic Method for Fire Loss Assessment in 2014, which replaced the earlier Statistic Method for The Fire Direct Property Loss. The statistical content and methods of direct loss, personal injury, and death and relevant chapters such as ‘statistical classification’ and ‘statistical requirements’ were introduced in the updated regulation. The detailed classification and statistical requirements for fire loss were introduced specified. The new standard has enhanced the statistical methodologies used to calculate fire losses, broadened the scope of data, and made it easier to adapt to China’s current economic development and industrial standardization.
In China’s fire statistics, the most important indicators to measure the severity of fires in a region or period are the number of fires, the number of fire deaths, the number of fire injuries, and the four indicators of direct property damage, which provide a more comprehensive and systematic response to the severity of fires. Table 3 depicts China’s annual fire status over the last two decades.
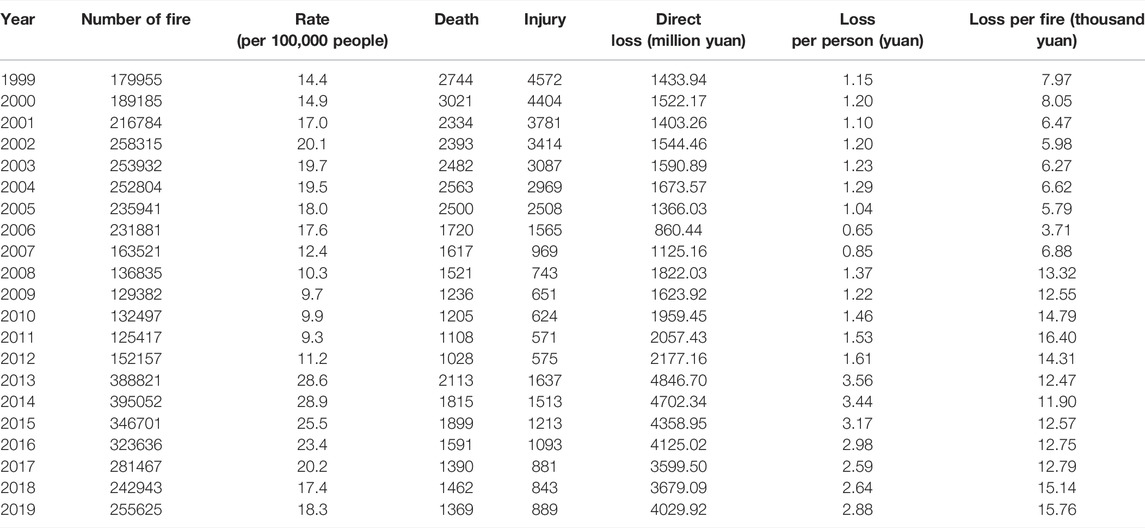
TABLE 3. China’s fire situation from 2000 to 2019.
Figure 2 depicts the number and frequency of fire accidents in China during the last two decades. Overall, the number and frequency of fires in China in the past two decades showed the “M”-shaped change trend. In the past two decades, the first peak in the number and incidence of fire accidents in China appeared in 2002, and the severe fire situation aroused the attention of China. The State Council of the PRC issued the Guidance on the Development of Fire Protection during the 10th Five-Year Plan in 2001. The document pointed out that by the end of 2002, cities above the prefecture-level should complete the formulation of fire protection plans; by the end of 2004, towns and county-level towns with faster economic development should complete the formulation of fire protection plans; by the end of 2003, the public fire protection facilities in cities and towns in the eastern region should reach the national standard; by the end of 2005, the central and western regions should strive to achieve the national average (State Council of the PRC, 2001). Benefits from improving fire protection infrastructure and fire protection planning, the number and incidence of fires in China have maintained a downward trend for nine consecutive years since 2003. The number of fires in China saw a rapid increase in 2013, mainly due to the release of new statistical standards for fire incidents by the Ministry of Public Security in 2014, which expanded the scope of statistics on direct economic loss by fire. Before 2013, direct economic losses from fire in China were only counted as direct property damage (Ministry of Public Security of the PRC, 1998). However, the new statistical standards for fires have expanded the scope of direct property loss by the fire while also adding two new statistical indicators for fire scene operation and disposal costs and costs incurred for personal injury or death (Ministry of Public Security of the PRC, 2014). Direct economic loss by fire is an essential basis for determining the level of fire in China, and the changes in the new statistical standards have expanded the scope of fire identification, which is the main reason for the steep increase in the number of fires in 2013.
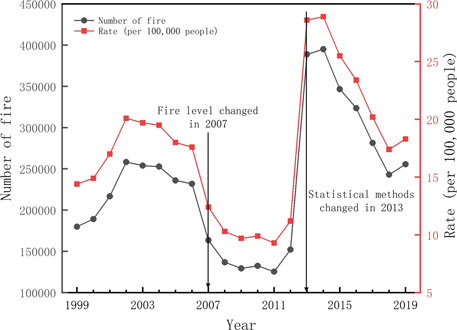
FIGURE 2. The number and frequency of fires.
Figure 3 shows the number of deaths and injuries in fire accidents over 20 years. In general, the number of fatalities and injuries has shown a fluctuating decrease trend in the last two decades. Before the 20th century, the number of injuries in fires in the same year was much higher than the number of fatalities, which shows that the high number of injuries was caused by the lack of firefighting knowledge and skills of the public and a large number of disorderly behaviors in response to fires (Xiong et al., 2022). Different groups popularize firefighting knowledge and abilities. Due to the improvement of public fire safety literacy, the difference between the number of injuries and deaths in fires has decreased since 2002 and has been negative in the past 7 years. It is worth noting that the losses caused by fires were effectively controlled around 2007. There are three main reasons for this: firstly, China completed a 5-year nationwide unique construction of fire fighting work at the end of 2005, and the level of fire fighting infrastructure and management was substantially improved; secondly, The 17th Congress of the Communist Party of China was held in 2007, and much work was done nationwide to prevent and curb major and mega-fires, especially vicious fire accidents with mass deaths and injuries; thirdly, China hosted the 29th Olympic Games in 2008, and much energy was invested in fire control throughout the country. The peak in injuries and deaths from fires occurred in 2013, mainly due to the 2012 revision of the Regulations on Fire Accident Investigation by the Ministry of Public Security of the PRC. The regulations standardize the procedures for investigation and statistics after a fire and state that those responsible for local fire fighting will be punished by criminal law for misreporting or concealing fires (Ministry of Public Security of the PRC, 2012). The implementation of this policy was the main reason for the surge in fire deaths and injuries in 2013.
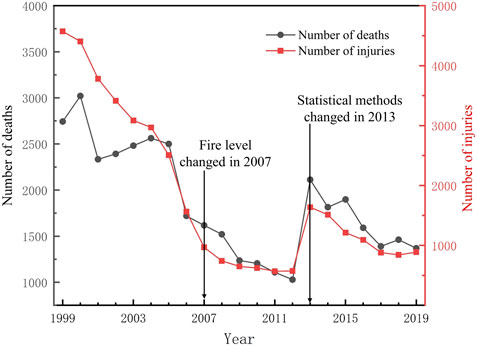
FIGURE 3. The number of deaths and injuries.
Figure 4 shows the fire losses in China for the last 20 years, including total annual fire losses, per person losses, and single fire losses. Since 1999, direct fire losses have shown a fluctuating upward trend and reached a peak of 4846.7 million yuan in 2013. after 2013, fire departments increased their efforts to control fire accidents, and direct fire losses have decreased for four consecutive years. After 2013, the fire department increased the control of fire accidents, and the natural fire loss decreased for four straight years. It is worth noting that the fluctuation trend of per person loss is the same as the direct fire loss, and the per person loss of fire has been controlled below 3.6 yuan in the past 20 years. The average loss per fire in the last two decades has fluctuated significantly due to the direct loss and the number of fires, with a peak of 16,400 yuan in 2011.
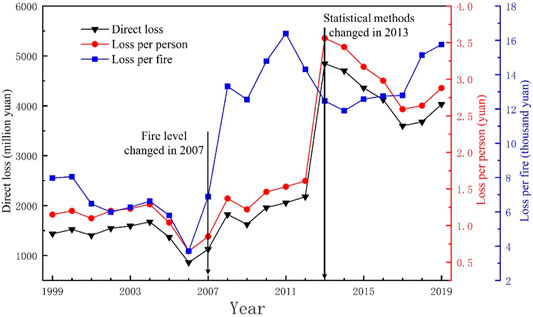
FIGURE 4. Fire loss and fire loss rate.
In addition to the four fundamental indicators of the total number of fires, number of deaths, number of injuries, and economic losses, the statistics of more severe fires are also important indicators of the overall fire situation. The statistics of the different levels of fire details in China in the last two decades are divided into two stages, influenced by the change in statistical standards. Table 4 shows the details of fires of different severity levels between 1999 and 2006. The number of large fires and conflagrations leads to a decreasing trend during these 8 years, while the other three indicators show a fluctuating trend. As shown in Table 5, the statistical indicators of significant fire and conflagration from 2007 to 2019 showed slight fluctuations, while the particularly serious fire did not occur for four consecutive years.
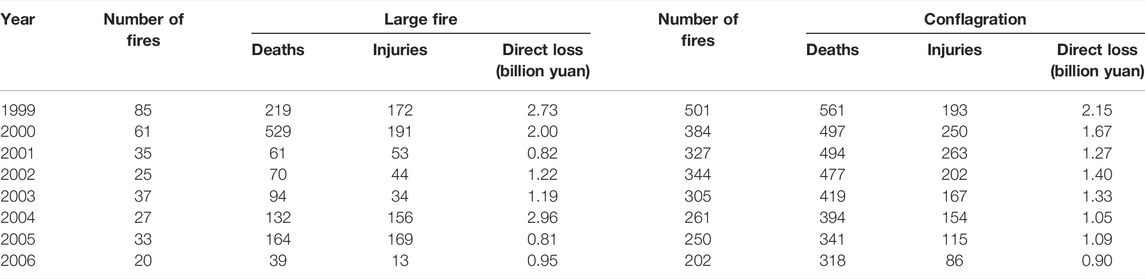
TABLE 4. Details of the different levels of serious fires from 1999 to 2006.
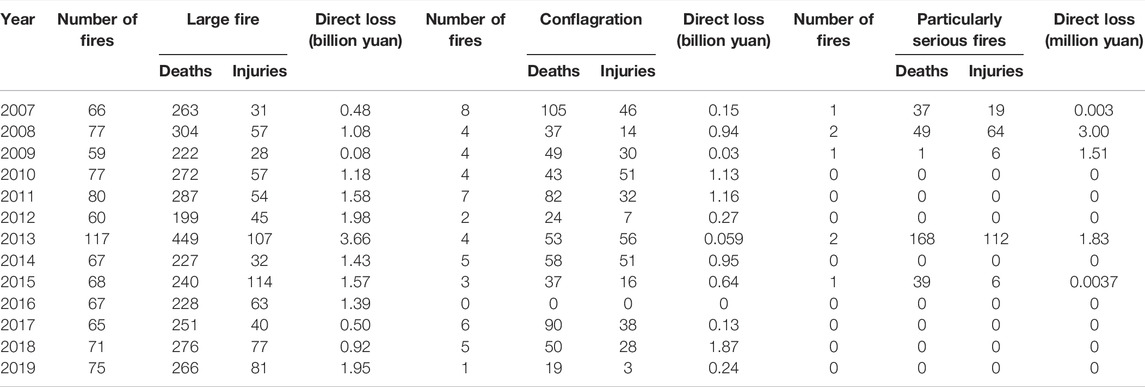
TABLE 5. Details of the different levels of serious fires from 2007 to 2019.
To explore the distribution pattern of fires during different day periods, we have counted the number of accidents, deaths, injuries, and direct losses of fires from 1999 to 2019. As shown in Figure 5, the high incidence of fires was mainly concentrated between 10:00 am and 10:00 pm. The trend of direct damage caused by fires in 24 h is approximately the same as the number of fires, and its peak occurs at 0–2 am. And fires occurring from 0 to 4 am cause more casualties. In general, the number of fire accidents is closely related to the intensive production and living of people, which is why fires frequently occur at 10–22 am. While the number of fires decreases significantly from 22:00 to 4:00 am, the economic losses and casualties caused by them reach a peak, indicating that fires occurring during this time tend to get out of control and thus produce more severe fires. Many deaths and injuries are people being at rest during this time and are slow to act. Once a fire occurs, their ability to respond immediately and evacuate is limited, and the fire is more likely to get out of control and cause casualties and economic losses.
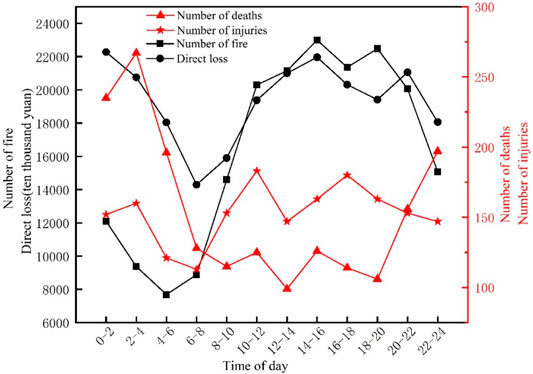
FIGURE 5. Four indicators of fire at different times of the day.
To explore the trends of the four fundamental fire indicators over the 12 months of each year, we conducted a statistical analysis of the mean values of fire data for different months between 1999 and 2019. As shown in Figure 6, the high incidence of fires is mainly in winter, and the dry winter climate in China provides favorable conditions for the spread of fires. In addition, the peak of human casualties and economic losses due to fires occurred in February. The reason for this is that this period is the peak of Chinese holidays (New Year’s Day, Chinese New Year, and Lantern Festival), and the surge in electrical usage is more likely to induce fires. The overall fire situation in summer is the best. This is because with the high temperature and long daylight hours, the demand for fire and fire time is reduced, so the frequency of fires is lower, and the overall situation of fire is better.
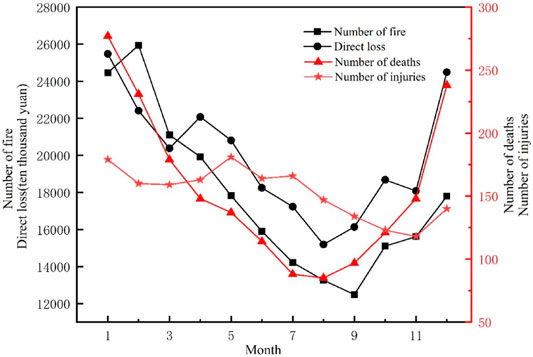
FIGURE 6. Monthly fire situation.
Fire statistics in China classify the causes of fires into nine categories: arson, electrical, safety violations, smoking, careless daily use of fire, playing with fire, spontaneous combustion, other causes, and unspecified causes. Figure 7 shows the number of fires caused by different reasons between 1999 and 2019, with the most significant number of fires caused by electrical, accounting for 30% of fire incidents. This is inextricably linked to the surge in electricity consumption in China in the last two decades. According to data published by the National Energy Statistics Bureau, China’s electricity consumption in 2019 was 7.6 times higher than in 1999 (Energy Statistics Bureau of PRC, 2019). As China’s economic development and urban expansion continue to accelerate, various energy-consuming devices continue to penetrate people’s lives and production, and electricity has become the primary mode of energy consumption for these devices, which is why the high number of fires caused by electricity. The number of fires caused by careless living fires is in second place. It is worth noting that fires from other causes ranked third, highlighting the complexity of the causes of fires in China. The remaining six causes of fires are relatively few and have fluctuated steadily over the past two decades.
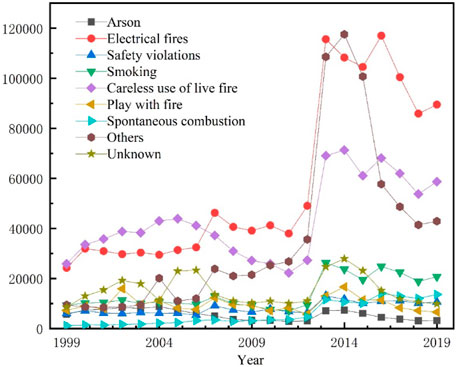
FIGURE 7. The causes of the fires.
Based on the entropy weight-TOPSIS model, we evaluated the comprehensive fire situation in China from 1999 to 2019. As shown in Table 6, the overall development trend of fires from 1999 to 2019 was positive. 2001 was the first year of implementing the Guidance on the Development of Fire Protection during the 10th Five-Year Plan. The fire situation showed a significant improvement and maintained an overall positive trend in the following years. 2009 was the best year for fires in China in more than 20 years 2009 was the best year for the overall fire situation in China in more than 20 years. The reason for this is that China hosted the 24th Olympic Games in 2008 and invested a lot of effort in fire safety infrastructure construction and fire safety management. Authorities at all levels took strict measures to prevent mega-accidents and ensure social security stability. As a result, the overall fire situation in China continued to be positive during that period. It was not until 2013 that the fire situation became steeply severe, with 2013 being the most severe year in the last 20 years or so due to the expansion of fire statistics and improving again significantly in the following years. If one excludes the fluctuations in the fire situation due to statistical, through statistical data feedback from many departments and the broader social environment in recent years, China’s developmental process over the previous two decades would have been a process of lowering emergencies, improving fire situations, and constructing a more stable social security environment.
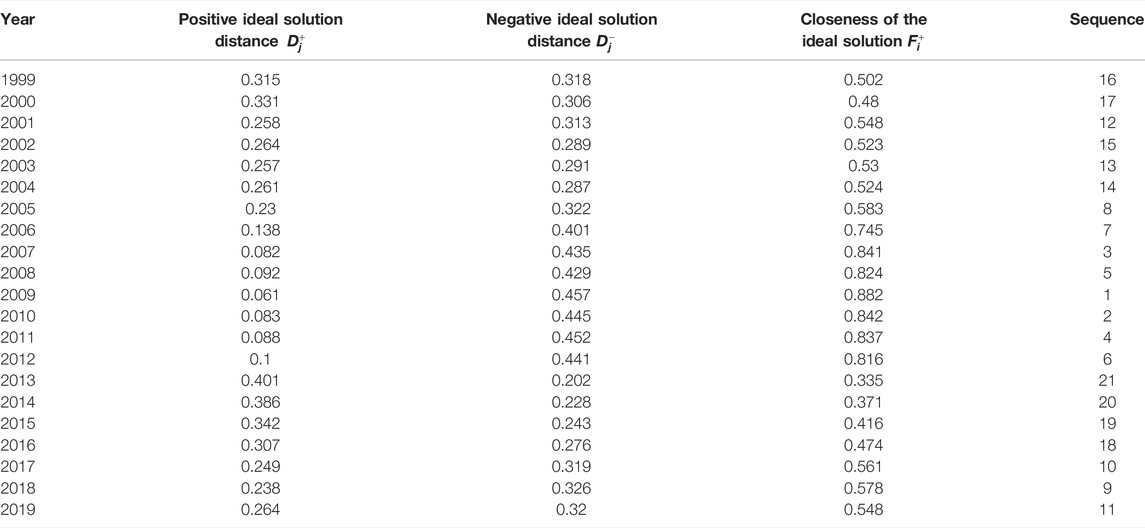
TABLE 6. Fire situation evaluation results in China from 1999 to 2019.
China is a vast country, spanning a wide range of latitudes, with significant differences in distance from the sea, coupled with different terrain heights, terrain types, and mountain ranges, resulting in a wide variety of temperature and precipitation combinations, forming a wide variety of climates. China’s development is more uneven between regions, and there are differences in the economic investment in firefighting work. The vastly different geographical conditions and gaps in fire management have led to other fire characteristics in each province of China. Mastering the distribution pattern of fires in China can provide the necessary theoretical and decision-making basis for fire prevention and effective spatial allocation of fire prevention resources by fire departments. This paper adopts a spatial analysis to explore the spatial evolution of fire dynamics in China. We selected the fire data of Chinese provinces and municipalities directly under the central government (excluding Hong Kong, Macao, and Taiwan) in 1999, 2004, 2009, 2014 the year 2019, specifically including the number of fires, fatalities, injuries, and direct losses. The entropy weight-TOPSIS model calculated the overall fire situation in each province. The spatial distribution of fire forms in each province of China in the target years was mapped using ArcGIS.
As shown in Figure 8, it can be seen from the time series evolution pattern that the fires first decreased and then increased in relatively severe areas in the last two decades. From the evolutionary trend, China’s western region has somewhat better fire forms, followed by the central region. In contrast, the eastern part has become the hardest hit by fires, and the fire situation in China shows a spatial tendency to gather in the southeast. The southeastern coastal area has become the most fire-prone region in China, including Guangdong, Zhejiang, Jiangsu, Shandong, and other provinces. It is noteworthy that these provinces have high GDP and population sizes. The intensive living and production activities are the main factors contributing to the seriousness of the fire situation in these areas (Lizhong et al., 2005). It is noteworthy that the fire situation in the vast majority of countries is inversely proportional to the growth of GDP, which means that the higher the economic level, the better the fire situation (Li et al., 2016). However, the current fire situation in China is directly proportional to the growth of GDP. Some studies have pointed out that the fire situation tends to deteriorate with economic development when a low overall economic development level (Li et al., 2014; Agbola and Falola, 2021). China’s rapid economic growth has come at the cost of high resource consumption, and China’s current economic level cannot limit the incidence of urban fires (Wu et al., 2007).
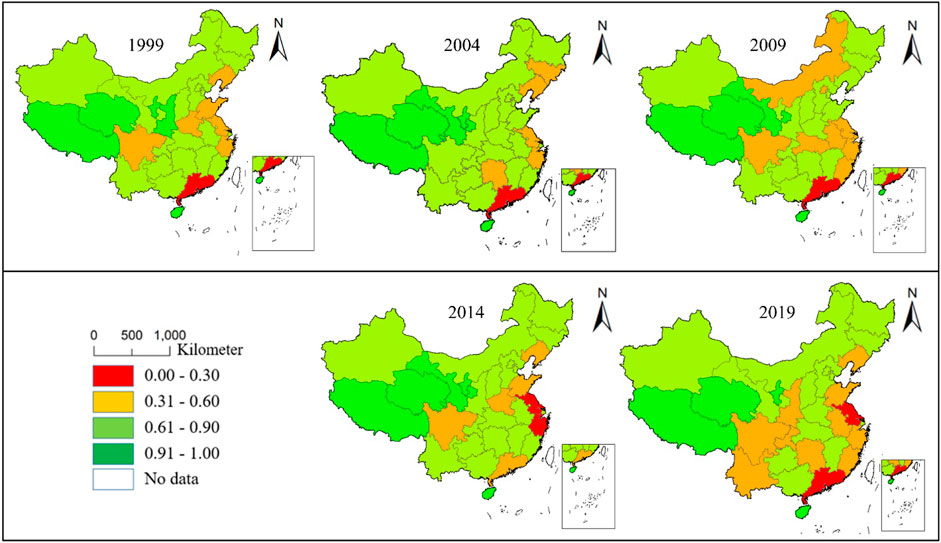
FIGURE 8. The evolution of spatial trends in fires in China.
Using GeoDa software, the spatial correlations were analyzed based on the overall fire conditions of each province and municipality directly under the central government in China for the years 1999, 2004, 2009, and 2014 levels 2019. As shown in Figure 9, in our selected layout data, the Moran’s I of the whole fire situation in each province and municipality directly under the central government of China is larger than 0, showing a positive spatial correlation, which means that the fire situations affect each other spatially and have a spatial similarity. The changes of Moran’s I value generally show a The evolution of Moran’s I values shows a “U-shaped” trend typically, with Moran’s I values decreasing from 1999 to the lowest value in the past two decades in 2009 and gradually increasing after that, reaching a peak in 2019. Overall, the spatial aggregation and spatial heterogeneity of fires in China have first weakened and then increased in the last two decades. The continuous rise in fire incidents in China at the end of the 20th century drew the attention of the Chinese government, which launched a series of policies in 2001 to strengthen the firefighting force. These nationwide fire prevention and control initiatives have effectively curbed the spatial aggregation of fires in China, which is the main reason for the decline of Moran’s I in 2004 and 2009. In 2009, the Moran’s I for fires in China was only 0.068, and 2009 was the best overall fire situation in China in the last two decades, which indicates that a series of fire prevention and control efforts in China have been significantly effective. Fire is closely related to the generation and life of human beings. China’s urbanization rate has increased dramatically in recent years, rising from 46.6% in 2009 to 60.6% in 2019 (National Bureau of Statistics of the PRC, 2019). The rapid urbanization in China has led to the growth of urban population density, the increase of urban built-up areas, and the increasing spatial aggregation of fires (Zhang et al., 2019), which is why Moran’s I peaked in 2019. Therefore, suppressing the higher spatial aggregation of fires that accompanies the urbanization process should be one of the priorities of current fire prevention and control in China.
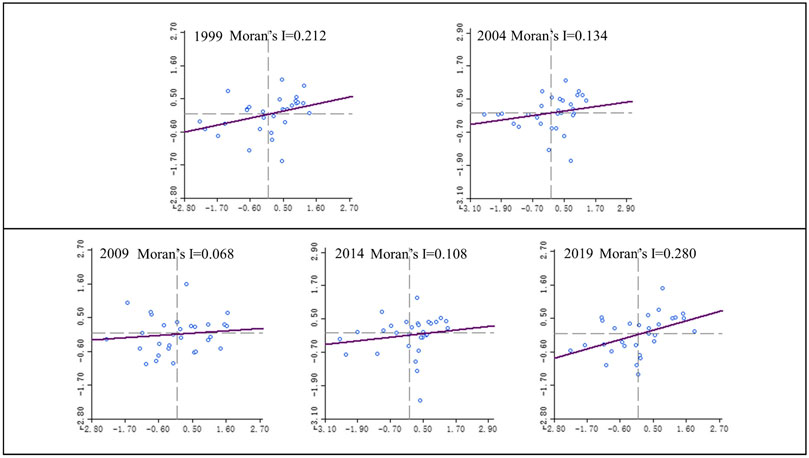
FIGURE 9. Moran’s I dispersion for fire situation in China.
GeoDa software was used to measure the LISA index of the current fire situation in each province and municipality in China. The LISA index can reflect the type of fire risk aggregation and spatial location. As shown in Figure 10, most units failed the significance test, indicating that the local spatial correlation was insignificant. In the past two decades, there have been fewer hot spots areas (High-High, HH) in China, specifically in Xinjiang, Gansu, and Ningxia provinces, which are concentrated in the western part of China, which shows that the western provinces of China have a higher overall rating and a better overall fire situation. The occurrence of cold spots (Low-Low, LL) is concentrated in the southeast of China, including Jiangsu, Fujian, Zhejiang, Jiangxi, and Guangxi provinces. High-Low (HL) areas are found in the provinces of Shanghai, Anhui, Jiangxi, Fujian, and Guizhou. The Low-High (LH) unit, on the other hand, appears only in two regions, Sichuan and Neimenggu. The hot and cold areas show a fluctuating decrease in the evolutionary trend. The spatially insignificant cells increase, indicating a decline in China’s local spatial aggregation of fires.
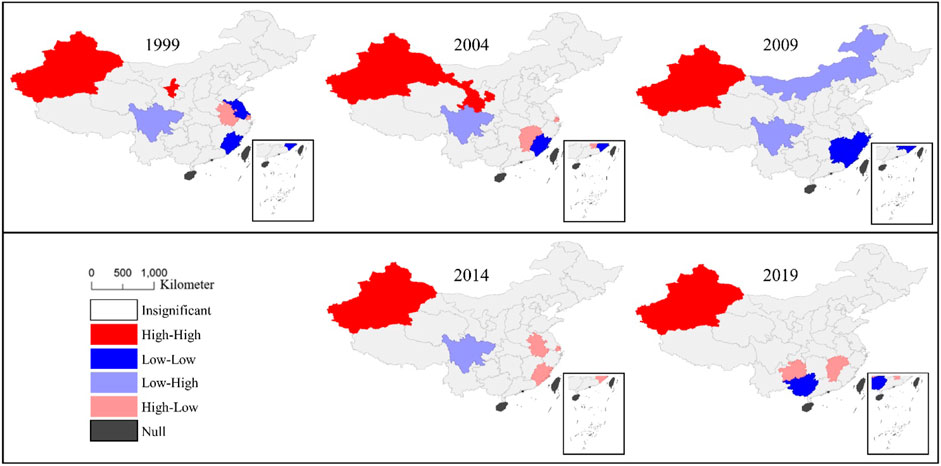
FIGURE 10. Types of local autocorrelation aggregates for fire situations in China.
The overall situation of fires in China is influenced by the economic development pattern and the fire policy. From the four fundamental indicators, the general trend of fire accidents in China from 1999 to 2019 shows an M-shaped fluctuation. The number of deaths and injuries caused by fires is better controlled, while the economic losses caused by fires show a fluctuating upward trend.
In terms of temporal volatility, China’s daily and monthly fire situation from 1999 to 2019 is characterized by a cyclical nature. On a 24-h cycle, the high incidence of fires is concentrated between 10:00 am and 10 pm. The frequency of fires decreases between 10 pm and 4:00 am. Still, the deaths, injuries, and economic losses caused by fires increase significantly, and this period is the high incidence of more severe fires. In terms of the monthly cycle, the highest incidence of fires in China has been from December to March in the last two decades. There are two main reasons for the concentration of fires in winter: first, the dry climate provides favorable conditions for fires; second, the frequent traditional Chinese festivals cause a surge in electrical usage.
The analysis of fire cause data shows that fires in China are currently mainly caused by electrical and daily fire carelessness. The number of fires caused by electrical causes has maintained a continuous upward trend. Fire causation in China is more complex, and the number of fires induced by some other unknown reasons ranked third. It is worth noting that fires caused by fire setting, safety violations, smoking, careless living with fire, and playing with fire accounted for 41.3% of all fires from 1999 to 2019, with individual behavioral activities becoming a significant factor in the occurrence of fires.
The evaluation results based on the entropy weight-TOPSIS model show that the overall fire rating in China has demonstrated a process of increasing, decreasing, and then increasing in the last two decades. The change in statistical criteria mainly causes this fluctuating trend in a fire situation. In general, the Chinese government has done a lot of work in building fire prevention infrastructure and improving the management system since the 21st century and has achieved specific fire prevention and control results.
The results of a general evaluation of the fire situation in China’s provinces and municipalities directly under the central government show that the relatively severe fire areas have first decreased and then increased over the past two decades. The fire situation in China shows a spatial trend toward the southeastern region, especially the more economically developed provinces in the southeastern coastal region. The global autocorrelation of fires in China was analyzed by Moran’s I index, which was positive and showed a U-shaped trend for all fires in China. It indicates a significant spatial autocorrelation of the fire situation in China. The fire situation in various places has prominent spatial aggregation characteristics, with high-rated areas adjacent to high-rated areas and low-rated areas adjacent to low-rated areas. The Lisa index further analyzed the local autocorrelation of Chinese fires. The results showed that the hot spot areas and cold spot areas showed decreasing fluctuations, and the spatially insignificant units increased. The local spatial aggregation of Chinese fires decreased.
Fire statistics is one of the essential bases for formulating fire prevention and control policy. Based on the above findings, this paper suggests that future research on fire prevention and control in China should focus on two aspects: firstly, fire prevention and education at the individual level of the public. At present, the number of fires caused by human factors remains high. The main reason for death and injury is the public’s lack of fire response and escape skills, so the study of improving the public’s fire emergency response capability is quite significant; the second is to make full use of the spatial assimilation effect of fire. The spatial assimilation effect of fire is that the improvement or deterioration of the fire situation in a specific area will bring about the progress or damage of the fire situation in the surrounding areas. This effect can provide new ideas for regional fire prevention and control of fire safety management departments. Therefore, optimizing the spatial allocation of firefighting resources and the policy formulation of regional fire prevention and control should also be critical points of future research.
The original contributions presented in the study are included in the article/supplementary material, further inquiries can be directed to the corresponding authors.
YX obtained the data and wrote the article. CZ conceived the study and performed the field research. HQ contributed to the research design and the data collection. XL provided advice for revisions. All authors contributed to the article and approved the submitted version.
This study is funded by the Graduate Innovation Program of China University of Mining and Technology (No. 2022WLKXJ022), the Postgraduate Research & Practice Innovation Program of Jiangsu Province in 2022 (No. KYCX22_2471), and the Social Science Planning Project of Jiangsu Province (No. 18ZZB001).
The authors declare that the research was conducted in the absence of any commercial or financial relationships that could be construed as a potential conflict of interest.
All claims expressed in this article are solely those of the authors and do not necessarily represent those of their affiliated organizations, or those of the publisher, the editors and the reviewers. Any product that may be evaluated in this article, or claim that may be made by its manufacturer, is not guaranteed or endorsed by the publisher.
Agbola, S. B., and Falola, O. J. (2021). Seasonal and Locational Variations in Fire Disasters in Ibadan, Nigeria. Int. J. Disaster Risk Reduct. 54, 102035. doi:10.1016/j.ijdrr.2021.102035
Anderson, R. A., Willetts, P., and Harland, W. A. (1983). Fire Deaths in the United Kingdom 1976-82. Fire Mat. 7 (2), 67–72. doi:10.1002/fam.810070204
Anselin, L. (1995). Local Indicators of Spatial Association-LISA. Geogr. Anal. 27 (2), 93–115. doi:10.1111/j.1538-4632.1995.tb00338.x
Araujo Lima, G. P., Viana Barbosa, J. D., Beal, V. E., Moret S. Gonçalves, M. A., Souza Machado, B. A., Gerber, J. Z., et al. (2021). Exploratory Analysis of Fire Statistical Data and Prospective Study Applied to Security and Protection Systems. Int. J. Disaster Risk Reduct. 61, 102308. doi:10.1016/j.ijdrr.2021.102308
Borys, Oleksandr, P. (2017). Review of Fire Statistics Data in Ukraine. Saf. Fire Technol. 47 (3), 62–67. doi:10.12845/bitp.47.3.2017.4
Costa, L., Thonicke, K., Poulter, B., and Badeck, F.-W. (2011). Sensitivity of Portuguese Forest Fires to Climatic, Human, and Landscape Variables: Subnational Differences between Fire Drivers in Extreme Fire Years and Decadal Averages. Reg. Environ. Change 11 (3), 543–551. doi:10.1007/s10113-010-0169-6
Energy Statistics Bureau of Prc, (20192019). Electricity Consumption of the Whole Society. (in Chinese)Avaialble at: http://www.nea.gov.cn/2020-01/20/c_138720877.htm (accessed 01 20, 2020).
Evarts, B., and Stein, G. P. (2020). US Fire Department Profile 2018. Quincy: National Fire Protection Association Quincy.
Fire and Rescue Department of Ministry of Emergency Management, (2018-2019). China Fire and Rescue Yearbook. Beijing: Emergency Management Press.
Fire Department of Ministry of Public Security (2004-2012). China Fire Yearbook. Beijing: China Human Resources Press.
Fire Department of Ministry of Public Security (2013-2017). China Fire Yearbook. Kunming: Yunnan People’s Publishing House.
Fire Department of Ministry of Public Security (2001-2003). Fire Statistical Yearbook of China. Beijing: China Human Resources Press.
Fire Department of the Ministry of Public Security (1999-2000). Fire Statistical Yearbook of China. Beijing: Publishing Company of Renmin Police University of China.
Griffith, D. A. (1993). “Which Spatial Statistics Techniques Should Be Converted to GIS Functions?” in Geographic Information Systems, Spatial Modelling and Policy Evaluation (Berlin, Heidelberg: Springer), 103–114. doi:10.1007/978-3-642-77500-0_7
Guo, T.-N., and Fu, Z.-M. (2007). The Fire Situation and Progress in Fire Safety Science and Technology in China. Fire Saf. J. 42 (3), 171–182. doi:10.1016/j.firesaf.2006.10.005
Hwang, C. L., and Yoon, K. (1981). Multiple Attribute Decision Making: Method and Applications. Berlin Heidelberg New York: Springer-Verlag.
Jacobsson, A., Ek, Å., and Akselsson, R. (2011). Method for Evaluating Learning from Incidents Using the Idea of “Level of Learning”. J. Loss Prev. Process Industries 24 (4), 333–343. doi:10.1016/j.jlp.2011.01.011
Krawchuk, M. A., and Moritz, M. A. (2011). Constraints on Global Fire Activity Vary across a Resource Gradient. Ecology 92 (1), 121–132. doi:10.2307/2977958010.1890/09-1843.1
Li, G., Lu, S., Mei, P., Zhang, H., and Lo, S. (2014). Influences of Time, Location, and Cause Factors on the Probability of Fire Loss in China: a Correspondence Analysis. Fire Technol. 50 (5), 1181–1200. doi:10.1007/s10694-014-0385-6
Li, G., Wang, Y., Yuan, Z., Zhang, N., and Guo, G. (2016). Spatio-temporal Correlation Analysis between Fire Occurrence Rate and Economic Factors. J. Catastrophology 31 (2), 111–115. Avaialble at: https://kns.cnki.net/kcms/detail/detail.aspx?FileName=ZHXU201602024&DbName=CJFQ2016. doi:10.3969/j.issn.1000-811X.2016.02.022
Lizhong, Y., Heng, C., Yong, Y., and Tingyong, F. (2005). The Effect of Socioeconomic Factors on Fire in China. J. fire Sci. 23 (6), 451–467. doi:10.1177/0734904105052457
Lizhong, Y., Xiaodong, Z., Zhihua, D., Weicheng, F., and Qing’an, W. (2002). Fire Situation and Fire Characteristic Analysis Based on Fire Statistics of China. Fire Saf. J. 37 (8), 785–802. doi:10.1177/073490410505245710.1016/s0379-7112(01)00054-6
Ministry of Public Security of the PRC (2012). Ministry of Public Security on the Revision of the "fire Accident Investigation Regulations" Decision. (in Chinese)Avaialble at: https://www.mps.gov.cn/n6557558/c7684119/content.html (accessed on 09 12, 2012).
Ministry of Public Security of the PRC (1998). Statistical Methods for Fire Loss Assessment: GA185-1998. Beijing: China Standard Press.
Ministry of Public Security of the PRC (2014). Statistical Methods for Fire Loss Assessment: GA185-2014. Beijing: China Standard Press.
Moura, R., Beer, M., Patelli, E., Lewis, J., and Knoll, F. (2016). Learning from Major Accidents to Improve System Design. Saf. Sci. 84, 37–45. doi:10.1016/j.ssci.2015.11.022
National Bureau of Statistics of the Prc, (2019). Statistical Bulletin on National Economic and Social Development of the People's Republic of China 2019. (in Chinese Avaialble at: http://www.stats.gov.cn/xxgk/sjfb/tjgb2020/202006/t20200617_1768655.html (accessed 02 28, 2020).
Pausas, J. G., and Keeley, J. E. (2009). A Burning Story: the Role of Fire in the History of Life. BioScience 59 (7), 593–601. doi:10.1525/bio.2009.59.7.10
Pyne, S. J. (2016). Fire in the Mind: Changing Understandings of Fire in Western Civilization. Phil. Trans. R. Soc. B 371 (1696), 20150166. doi:10.1098/rstb.2015.0166
Rahim, M. (2015). The Current Trends and Challenging Situations of Fire Incident Statistics. Malays. J. Forensic Sci. 6 (1), 63–78. Avaialble at: http://forensics.org.my/mjofs/pdf/fssmVol.6No.1/Article%2009.pdf
State Council of the Prc (2001). Guidance on the Development of Fire Protection during the Tenth Five-Year Plan. (in Chinese)Avaialble at: http://www.gov.cn/zhengce/content/2016-09/23/content_5111107.htm (accessed 05 09, 2001).
Tobler, W. R. (1970). A Computer Movie Simulating Urban Growth in the Detroit Region. Econ. Geogr. 46 (Suppl. 1), 234–240. doi:10.2307/143141
Tseng, M.-L., Wu, K.-J., Hu, J., and Wang, C.-H. (2018). Decision-making Model for Sustainable Supply Chain Finance under Uncertainties. Int. J. Prod. Econ. 205, 30–36. doi:10.1016/j.ijpe.2018.08.024
Tzeng, G.-H., and Huang, J.-J. (2011). Multiple Attribute Decision Making: Methods and Applications. Boca Raton: CRC Press.
Wang, B., and Wu, C. (2019). China: Establishing the Ministry of Emergency Management (MEM) of the People's Republic of China (PRC) to Effectively Prevent and Control Accidents and Disasters. Saf. Sci. 111, 324. doi:10.1016/j.ssci.2018.09.008
Wang, Z.-N., Chen, J., Cheng, W.-C., Arulrajah, A., and Horpibulsuk, S. (2018). Investigation into the Tempo-Spatial Distribution of Recent Fire Hazards in China. Nat. Hazards 92 (3), 1889–1907. doi:10.1016/j.ssci.2018.09.00810.1007/s11069-018-3264-5
Wu, L., Ma, Y., Chen, J., and Cai, J. (2007). Correlation Analysis between Fire and Socioeconomic Factors in China. J. Chin. Saf. Sci. 17 (6), 92–97+181. doi:10.16265/j.cnki.issn1003-3033.2007.06.011
Xin, J., and Huang, C. F. (2014). Fire Risk Assessment of Residential Buildings Based on Fire Statistics from China. Fire Technol. 50 (5), 1147–1161. doi:10.1007/s10694-013-0327-8
Xiong, Y., Zhang, C., Qi, H., Zhang, R., and Zhang, Y. (2022). How to Measure the Safety Cognition Capability of Urban Residents? an Assessment Framework Based on Cognitive Progression Theory. Front. Psychol. 13, 707172. doi:10.3389/fpsyg.2022.707172
Keywords: statistical investigation, fire situation, fire characteristics, China, spatial characteristics
Citation: Xiong Y, Zhang C, Qi H and Liu X (2022) Characteristics and Situation of Fire in China From 1999 to 2019: A Statistical Investigation. Front. Environ. Sci. 10:945171. doi: 10.3389/fenvs.2022.945171
Received: 16 May 2022; Accepted: 06 June 2022;
Published: 29 June 2022.
Edited by:
Kevin Cheung, E3-Complexity Consultant, AustraliaCopyright © 2022 Xiong, Zhang, Qi and Liu. This is an open-access article distributed under the terms of the Creative Commons Attribution License (CC BY). The use, distribution or reproduction in other forums is permitted, provided the original author(s) and the copyright owner(s) are credited and that the original publication in this journal is cited, in accordance with accepted academic practice. No use, distribution or reproduction is permitted which does not comply with these terms.
*Correspondence: Changli Zhang, a2R6Y2xAMTYzLmNvbQ==; Hui Qi, bXNxaWh1aUAxMjYuY29t
†These authors share first authorship
Disclaimer: All claims expressed in this article are solely those of the authors and do not necessarily represent those of their affiliated organizations, or those of the publisher, the editors and the reviewers. Any product that may be evaluated in this article or claim that may be made by its manufacturer is not guaranteed or endorsed by the publisher.
Research integrity at Frontiers
Learn more about the work of our research integrity team to safeguard the quality of each article we publish.