 Zhifeng Xun1
 Zhi Quan
 Long Bai
 Yunting Fang
94% of researchers rate our articles as excellent or good
Learn more about the work of our research integrity team to safeguard the quality of each article we publish.
Find out more
ORIGINAL RESEARCH article
Front. Environ. Sci., 01 July 2022
Sec. Soil Processes
Volume 10 - 2022 | https://doi.org/10.3389/fenvs.2022.943920
As nitrous oxide (N2O) is one of the most important greenhouse gases, N2O emission pathways and regulation techniques in soils with different vegetation types have become a research focus. Currently, a diverse array of research exists on the N2O emissions from soils of different vegetation types, e.g., forest, grassland, and agriculture. Few studies have investigated the microbial processes of N2O emissions from lawn soils. Fertilization levels in lawn soils are often similar to or much higher than those in agricultural ecosystems, thus fertilized lawn is an important source of atmospheric N2O. In the study, we employed the 15N-nitrate labelling method combined with the nitrification inhibition technique to distinguish microbial processes and their contribution to N2O emissions in long-term nitrogen fertilised lawns. We found that the N2O emission rate from the control treatment was 1.0 nmol g−1 h−1 over the incubation, with autotrophic nitrification contributing 60%. The N2O emission rate increased to 1.4 nmol g−1 h−1 from the soil treated with long-term N fertilization, and the contribution of autotrophic nitrification increased to 69%. N fertilization did not significantly increase the contribution of denitrification (24–26%) in the total N2O emissions. However, N fertilization substantially decreased the contribution of heterotrophic nitrification from 13 to 0.4% in the total N2O emissions. Co-denitrification to N2O was detected but the overall contribution was of minor importance (3–5%). The correlation analysis revealed that soil NO3− levels were the main influencing factors in the N2O producing microbial processes. Our results suggest that N fertilization altered both N2O production rates and the contribution pattern of microbial processes, and indicate the autotrophic nitrification and heterotrophic nitrification are more sensitive to N fertilization than denitrification and co-denitrification.
Nitrous oxide (N2O) is one of the three major greenhouse gases with 298 times the warming potential of CO2 and is considered a major destroyer of the stratospheric ozone layer (Ravishankara et al., 2009; Kanter et al., 2013; Greaver et al., 2016). Atmospheric N2O concentrations have increased from 270 ppb in 1750 to 332 ppb in 2020 (Hall et al., 2007; Reay et al., 2012; Prinn et al., 2018; Tian et al., 2020). Soil is the most important source of N2O emissions, accounting for approximately 70% of the total global N2O emissions (Tian et al., 2016; Tian et al., 2020). Numerous studies have demonstrated high soil N2O emissions depend on the N2O-producing microbial processes in their local environment (Bateman and Baggs, 2005; Gao J. et al., 2018). Therefore, it is crucial to understand soil N2O production pathways and their environmental response mechanisms.
Soil N2O are produced by many microbial processes including nitrification (autotrophic and heterotrophic nitrification), denitrification, co-denitrification, and dissimilatory nitrate reduction to ammonium (DNRA) (Braker and Conrad, 2011). All microbial processes are regulated by environmental factors, such as temperature, soil moisture, pH, and soil available carbon and nitrogen (Bateman and Baggs, 2005; Gao J. et al., 2018). Most studies have concluded that nitrification and denitrification are the main microbial processes producing N2O (Fang et al., 2015; Tang et al., 2018). However, recent studies showed that grassland, temperate forest, and agricultural soils could produce N2O through heterotrophic nitrification and co-nitrification, and identified the contribution of heterotrophic nitrification and co-nitrification to N2O production (Müller et al., 2014; Zhang et al., 2015; Tang et al., 2018; Duan et al., 2019; Zhou et al., 2021). Heterotrophic nitrification in soils with high organic carbon and nitrogen concentrations and low pH were the main contributors to N2O emissions, accounting for 85% of total N2O emissions (Müller et al., 2014; Zhang et al., 2015). Therefore, the role of heterotrophic nitrification in soils cannot be also ignored. Co-denitrification produces N2O by combining NO2− with organic nitrogen (Spott and Stange, 2011). A previous study found that co-denitrification contributed 17.6% of the total N2O production in grassland soil (Müller et al., 2014). Additionally, a variety of N compounds involved in co-denitrification are also permitted to be co-metabolized during denitrification (Duan et al., 2019). Co-denitrification is a co-metabolic process that uses inorganic and organic nitrogen compounds concurrently and converts them into the same end products as denitrification (Spott et al., 2011; Spott and Stange, 2011). Unfortunately, co-denitrification has not been considered in many previous studies, in which the N2O produced by co-nitrification was unintentionally attributed to denitrification. Overall, more studies are still needed to improve our knowledge of the microbial processes underlying the N2O production. Therefore, it is essential to determine the relative contributions of the different microbial processes to N2O emissions and the related driving factors to evaluate the N2O emission potential from soils.
Distinguishing between the N2O-producing microbial processes in soils is difficult because they occur simultaneously. Inhibitor techniques are the most common method for distinguishing nitrification and denitrification in the laboratory. Nitrification inhibitors have been used to inhibit the activities of AOA and AOB to reduce the nitrogen nitrification rate in soils (Zhou et al., 2020; Lan et al., 2022). The commonly used nitrification inhibitors include acetylene (C2H2), 3,4-dimethylpyrazole phosphate (DMPP), and dicyandiamide (DCD), which mainly distinguish between N2O from nitrification and denitrification by inhibiting ammonia oxidation in autotrophic nitrification (Klemedtsson et al., 1988). However, the short inhibition duration by gaseous acetylene and the poor contact with the soil has led to an overestimation of N2O emissions, and it is difficult to distinguish between autotrophic and heterotrophic nitrification by the inhibitor method (Bollmann and Conrad, 1997). The double isotope labelling technique of 15N and 18O was used to distinguish nitrification and denitrification contributions to N2O emissions. The 15N and 18O natural abundance technique has the advantage that it does not disturb the soil and can distinguish between nitrification and denitrification. The disadvantages are that it cannot distinguish between other microbial processes and is expensive. In recent years, the 15N isotope double source modelling technique has been widely used to distinguish N2O-producing microbial processes, although this method distinguishes other microbial N2O-producing processes, it still needs further validation due to the numerous assumed parameters (Müller et al., 2014; Zhang et al., 2015).
Lawns, planted in sports fields, parks, golf courses, and home yards, are a type of artificial grass (Yang et al., 2019). The lawns occupy roughly 2% of the total land in the United States (Milesi et al., 2005). Maintaining an aesthetically appealing lawn is a common driver for lawn irrigation and fertilization (Gu et al., 2015). Almost all lawns require relatively high levels of fertility (up to 200–300 kg N ha) to maintain health and promote recovery from damage (Carey et al., 2012). Lawn management can provide optimum conditions for N2O emissions, especially irrigation after fertilization, which can enhance lawn N2O emissions (Gu et al., 2015). Some studies have shown that fertilization equalises the N2O emissions from urban lawn soils with agricultural soils (Townsend-Small et al., 2011; Chen et al., 2018). According to Kaye et al. (2004), lawns contributed 30% of soil N2O emissions in the studied region where it occupied only 6.4% of the total land area. Fertilized lawns may be an important source of atmospheric N2O (Bremer, 2006; Groffman et al., 2009; Li et al., 2013). Therefore, it is important to understand the microbial processes that produce N2O in lawns in order to develop best management practices for urban lawns, promote healthy lawn ecosystems, and mitigate greenhouse gas emissions. Also, obtaining data can provide valid information for studying labeled nitrogen technologies to distinguish N2O-producing microbial processes.
In the present study, we employed a recently developed research method (Tang et al., 2018; Zhou et al., 2021) with a modification to elucidate the effects of fertilization application on N2O-producing microbial processes in urban lawns based on the N molecular pairing principle. The main objectives of this study were: 1) to quantify the contribution of individual microbial processes to N2O emissions and their responses to fertilization for a lawn soil; 2) to determine the factors influencing N2O emission rate and each microbial.
The experiment was conducted on the Baicao Garden Teaching and Research base of Shenyang Agricultural University, Shenyang City Liaoning Province, northeast China (41°46′ N, 123°25′ E). The region is in a temperate semi-humid continental climate zone, with an annual average temperature of 24.8°C and an annual average precipitation of 580 mm during the lawn growing season from April to October. The brown soil belongs to udalfs according to the second edition of US soil taxonomy, and the soil texture is clay loam with 27.2% sand, 50.2% silt and 22.6% clay. The bulk density was 1.2 g cm−3. The soil properties in the top 20 cm were as follows: total carbon content,7.3 g kg−1; total nitrogen content, 0.8 g kg−1; ammoniacal nitrogen (NH4+) content, 3.2 mg kg−1; nitrate-nitrogen (NO3−) content, 23.7 mg kg−1; the available P, 12.4 mg kg−1; and available K of 98.6 mg kg−1; and soil pH, 6.8.
The turfgrass was planted in the experimental site on 7 May 2015. The grass was dominated by Kentucky bluegrass (Poa pratensis L.) of the Merit variety. The annual lawn growing period is from early April to late October. The test plot was not treated with any fertiliser prior to planting the turfgrass. According to the standard for landscape maintenance in Beijing, China, four treatments were set up in the test lawn: N150 kg N hm−2 a−1 (N150), N225 kg N hm−2 a−1 (N225), N300 kg N hm−2 a−1 (N300) and no N fertilizer as control (N0). The treatments were arranged in a randomized complete block design with three replicate plots (each plot 1 m × 1 m, total 12 plots). Each fertilization plot is spaced at least 3 m apart to prevent fertilization from affecting adjacent treatment plots. The nitrogen fertiliser used in the experiment was urea (CH4N2O). The experiment began in May 2015. Half of the annual level of urea was used to fertilise the treatments in mid-May and the other half in mid- September each year. These plots were irrigated with a sprinkler immediately after the fertiliser application.
Soil samples from 0–20 cm were collected in August of 2020, after 5 years of N fertilization treatment. Five soil cores 5 cm in diameter were taken at random in each plot after removing the aboveground lawn. The five soil cores in each treatment plot were mixed as one sample. Three replicates of each treatment were sampled with a total of 12 soil samples. Soil samples were placed in sterile sealed self-sealing bags, and transferred to the laboratory in a foam box with dry ice. The soil samples were sieved through a 2 mm sieve and the roots and impurities were removed in the laboratory. The samples were divided into two portions, one for t isotope tracer incubation and the other for the soil properties analysis.
The 15N tracer incubation experiment was conducted at the Laboratory of Stable Isotope Ecology, Institute of Applied Ecology, Shenyang, Chinese Academy of Sciences. Approximately 5 g fresh soil from each sample was placed into 20 ml glass vials (Chromacol, 125 × 20-CV-P210) together with 50 mg soil kg−1 dicyandiamide (DCD, a nitrification inhibitor) and 50 mg 15N kg−1 NH415NO3 (99.26 atom% 15N, Shanghai Research Institute of Chemical Industry, China) or 50 mg N kg−1 NH4NO3. DCD and NH415NO3 or NH4NO3 were added in solution form (Gong et al., 2013; Wang et al., 2018; Duan et al., 2019). The final soil moisture in each vial was adjusted to 80% of the water-filled pore space (WFPS). The vials were immediately capped tightly with grey butyl septa (Chromacol, 20-B3P, No. 1132012634) and aluminium crimp seals (ANPEL Scientific Instrument (Shanghai) Co. Ltd., 6G390150). Each vial was vacuumed and flushed with synthetic air (N2:O2 = 8:2) for 3 min (100 ml min−1). Subsequently, two treatments with three replicates were established: (Ⅰ) DCD and NH415NO3 and (Ⅱ) NH4NO3. Gong et al. (2013) demonstrated that ammonia-oxidizing bacteria (AOB) rather than ammonia-oxidizing archaea (AOA)dominated soil ammonia oxidation in the brown soil from Shenyang. Therefore, we used DCD to inhibit nitrifying bacteria to prevent autotrophic nitrification. The vials were shaken gently, and the resulting soil slurries were incubated at 25°C for 0, 24, and 48 h in the dark. The incubation was terminated by injecting 0.5 ml of a 7 M ZnCl2 solution at the desired time. Headspace gas was taken at 0, 24, and 48 h after the onset of the experiment and was analysed for 15N2O and N2O. All gas samples were immediately analysed in the laboratory using a gas chromatograph (GC-2014, Shimadzu, Japan). To determine the accuracy of the sample analysis, three standard N2O samples (National Center for Standard Matters, Beijing, China) with a concentration of 5, 20, and 200 ppm were analysed using the GC system every 12 study samples. Results of the GC analyses were accepted when the three gas standard calibrations produced variation coefficients that were lower than 1%. The content of 15N in the N2O emissions was measured using a trace gas pre-concentrator (TG) coupled with a continuous flow isotope ratio mass spectrometer (IRMS; Isoprime 100 Isoprime Ltd., United Kingdom).
The pathways of N2O production during the 15N labelling incubation are provided in Figure 1. There were four pathways of N2O production: autotrophic nitrification (AN), heterotrophic nitrification (HN), denitrification (D), and co-denitrification (CD). In the treatment Ⅰ, the N2O production pathways after the inhibition of the autotrophic nitrification (using DCD) were heterotrophic nitrification (HN), denitrification (D) and co-denitrification (CD). According to the 15N pairing principle, heterotrophic nitrification produced only 44N2O (HD44); denitrification produced 44N2O (D44), 45N2O (D45), and 46N2O (D46); and co-denitrification produced 44N2O (CD44) and 45N2O (CD45). We assumed that: 1) the 15N abundance is 0 at% in the soil; 2) the additional 15N source is homogeneously distributed within the study soil and does not have a negative effect on microbial processes; 3) all 15N2O comes from 15NO3− added during the experiment; and 4) contributions of 14N14N17O and 14N14N18O to 45N2O and 46N2O are minor and negligible.
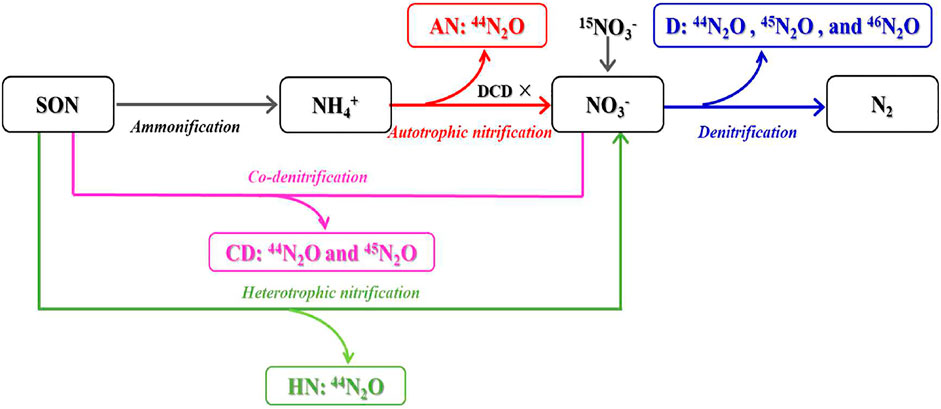
FIGURE 1. Schematic diagram of N2O production via microbial processes quantified by the 15N-NO3− labelling combined with nitrification inhibitor (DCD) application. AN, HN, D, and CD represent autotrophic nitrification, heterotrophic nitrification, denitrification, and co-denitrification, respectively.
The molar fractions of the 44N2O (f44), 45N2O (f45), and 46N2O (f46) in the sample N2O were calculated using Eq. 1 (Stevens et al., 1993; Stevens et al., 1997; Tang et al., 2018; Zhou et al., 2021):
The rates of 44N2O, 45N2O, and 46N2O production in each vial over the incubation period was calculated using the molecular fractions of f44, f45 and f46 using Eq. 2 (Tang et al., 2018; Zhou et al., 2021):
Where P is the N2O production within each vial according to the measured change in N2O concentration during incubation; t is the incubation time; 0 is the initial incubation time; msoil is the dry soil mass in the incubation vials (g).
In the treatment I, the N2O production rates derived from denitrification, co-denitrification, and heterotrophic nitrification was calculated using the following Eqs 3–6:
Where Fn refers to the abundance of 15NO3−in the soil.
In the treatment Ⅱ, DCD was not added. The total N2O production rate (PTotal) and the N2O production rate derived from autotrophic nitrification (AN) was calculated using Eq. 7. The D, CD and H were calculated in the treatment I above:
The soil content of ammoniacal nitrogen (NH4+) and nitrate-nitrogen (NO3−) were determined by leaching the soil with 2 M KCl solution (soil/solution ratio of 1:5) before analysing the samples using a Smartchem140 automatic intermittent chemical analyser. Total carbon (TC) was determined using the potassium dichromate digestion method. The total nitrogen (TN) was determined using the micro Kjeldahl method. The soil pH was determined using a pHS-3C acidity meter. The soil gravimetric water content was calculated by measuring the weight loss after oven drying at 105°C for 24 h.
All analyses were conducted using SPSS software (version 19.0; SPSS Inc., Chicago, IL, United States). One-way ANOVA examined the differences in all variables among the N fertilization treatments of the lawn. Pearson correlation analysis was performed to examine the correlation between N2O emission rates and the soil properties. Statistically significant differences were set at a p-value of 0.05 unless otherwise stated.
After N fertilization treatments of 5 years, the soil content of NH4+, total carbon, and total nitrogen, and the carbon to nitrogen ratio did not differ significantly among the four treatments (Table 1). The soil NH4+ content ranged from 1.7 to 2.7 mg kg−1. The total carbon and total nitrogen in the soil ranged from 6.7 to 7.7 g kg−1. The total nitrogen in the soil was approximately 0.9 g kg−1in all treatments. The carbon to nitrogen ratio ranged from 7.4 to 8.6. The soil NO3− content ranged from 22.6 to 32.6 mg kg−1 and tended to increase significantly with additional N fertilization. The N225 treatment had the highest soil NO3− content. The soil pH of the nitrogen treated soils was 0.1–0.3 pH units lower than the control soil without nitrogen fertilization and showed a significant decreasing trend with additional N fertilization (Table 1).
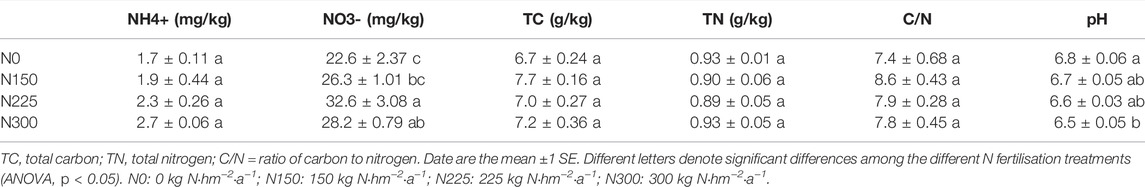
TABLE 1. Soil properties (0–20 cm) of different nitrogen fertilization treatments in the lawn soils.
During incubation, N fertilization significantly increased the N2O emission rate (p < 0.05) in the lawn without DCD addition (p < 0.05) (Figure 2). The emission rates of N2O ranged from 1.0 to 1.4 nmol g−1 h−1. However, the soil N2O emission rate did not linearly increase with N fertilizer application levels, with the highest emission rate in the N225 treatment (1.4 nmol g−1 h−1), slightly higher than the N300 treatment (1.3 nmol g−1 h−1). The N225 and N300 treatments were significantly higher than the N0 and N150 treatments (p < 0.05). There was no significant difference in the N2O emission rate between the N225 and N300 treatments. There was no significant difference in the N2O emission rate between the N0 (1.0 nmol g−1 h−1) and N150 (1.0 nmol g−1 h−1) treatments. After using the nitrification inhibitor DCD to inhibiting bacterial autotrophic nitrification, the N2O emission rate were significantly lower, resulting in a 60–70% reduction (p < 0.05). The N2O emission rate did not change markedly with increasing N fertilizer addition in the DCD treatment, with values ranging from 0.32 to 0.42 nmol g−1 h−1 (Figure 2).
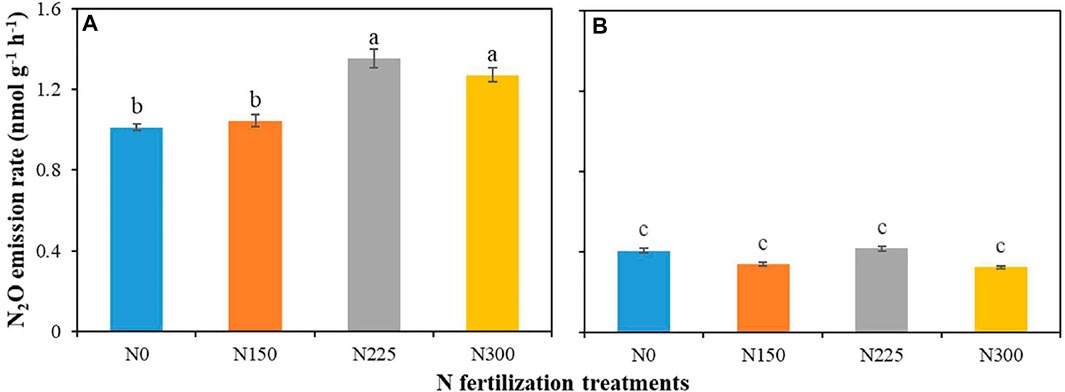
FIGURE 2. N2O emission rates without DCD (A) and with DCD (B) during the incubation time. Data are the means (±1 SE). Different letters denote significant differences (ANOVA, p < 0.05) between the 4 N fertilization treatments with DCD or without DCD. The error bar means standard error. N0: 0 kg N hm−2 a−1; N150: 150 kg N hm−2 a−1; N225: 225 kg N hm−2 a−1; N300: 300 kg N hm−2 a−1.
In the N0 treatment, the main N2O production pathway was autotrophic nitrification, which contributed 60% to the total N2O emissions, denitrification contributed 24%, while heterotrophic nitrification contributed 13%; and co-denitrification contributed 3% to the N2O emissions (Figure 3). The contribution of autotrophic nitrification to the N2O emissions increased significantly with increasing N fertilization applications (p < 0.05), while heterotrophic nitrification decreased significantly (p < 0.05). N fertilization did not significantly increase the contribution of denitrification and co-denitrification to the N2O emissions. The contribution of autotrophic nitrification to the N2O emissions increased significantly with increasing N fertilization applications, from 60% in the N0 treatment to 69% in the N225 and N300 treatment. The contribution of heterotrophic nitrification to N2O emissions significantly decreased with N fertilization applications. Heterotrophic nitrification contributed less than 1% to N2O emissions, only 0.8 and 0.4% in the N225 and N300 treatments, respectively (Figure 3). The contribution of denitrification to the N2O emissions ranged from 24 to 26% with increasing N fertilization applications. The contribution of co-denitrification to the N2O emissions ranged from 3 to 5% with increasing N fertilization applications (Figure 3). It is evident that N fertilization mainly increased N2O emissions by promoting autotrophic nitrification in the lawn.
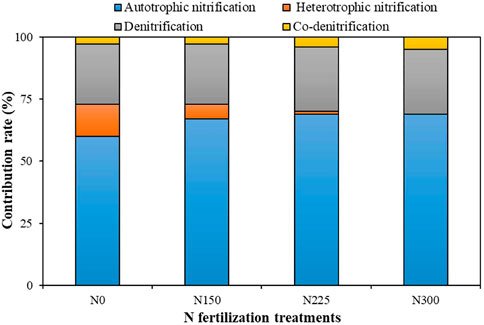
FIGURE 3. The contribution of each microbial process to N2O emissions. N0: 0 kg N hm−2 a−1; N150: 150 kg N hm−2 a−1; N225: 225 kg N hm−2 a−1; N300: 300 kg N hm−2 a−1.
Autotrophic nitrification is the main pathway for N2O production in the lawn soil, followed by denitrification (Figure 4). N fertilization significantly enhanced the N2O production rates by autotrophic nitrification (0.61–0.94 nmol g−1 h−1), denitrification (0.24–0.36 nmol g−1 h−1), and co-denitrification (0.03–0.06 nmol g−1 h−1) in the lawn (p < 0.05), while significantly inhibiting heterotrophic nitrification (0.14–0.01 nmol g−1 h−1) (p < 0.05) (Figure 4). The N2O production rates from autotrophic nitrification and denitrification were significantly higher in the N225 and 300 treatments than in the N0 and N 150 treatments (p < 0.05), both peaked in the N225 treatment with 0.94 nmol N g−1 h−1 and 0.36 nmol N g−1 h−1, respectively (Supplementary Figures S1A,B). In contrast, the N2O production rate by heterotrophic nitrification was less than 0.01 nmol N g−1 h−1 in the N225 and N300 treatments (Figure 4, Supplementary Figure S1C). Although the rate of N2O production by co-denitrification increased significantly with increasing N fertilization applications, it was still low compared to the rate of N2O production by autotrophic nitrification and denitrification (Figure 4, Supplementary Figure S1D).
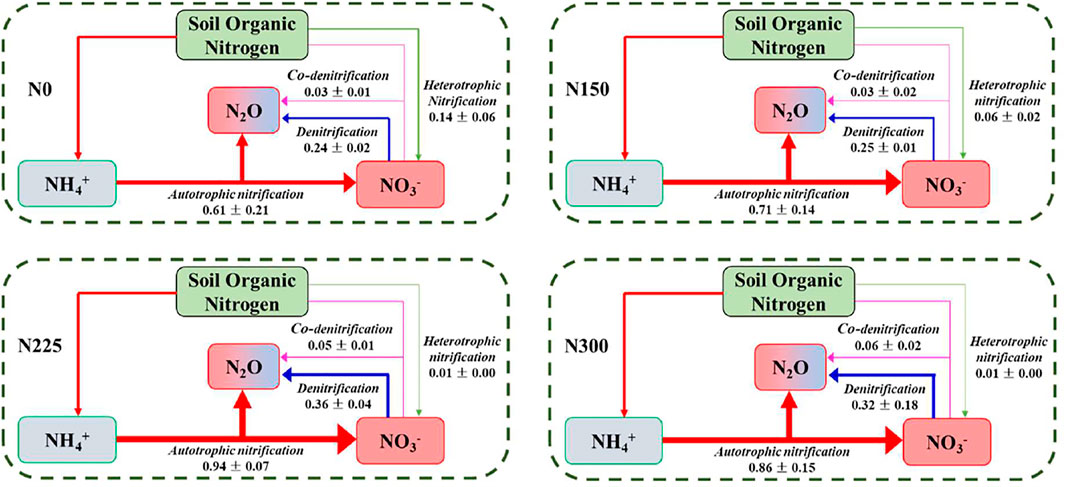
FIGURE 4. N2O production rates from autotrophic nitrification, heterotrophic nitrification, denitrification, and co-denitrification in the soil of the study lawn. Data are the mean ± SE (nmol N g−1 dry soil h−1) and the thickness of the arrow indicates the importance of each microbial process. N0: 0 kg N hm−2 a−1; N150: 150 kg N hm−2 a−1; N225: 225 kg N hm−2 a−1; N300: 300 kg N hm−2 a−1.
The various N2O production pathways responded differently to the altered N application rates. Autotrophic nitrification and heterotrophic nitrification were more sensitive to N fertilization than denitrification and co-denitrification. For example, the rates of N2O produced by autotrophic nitrification and heterotrophic nitrification were 0.61 nmol N g−1 h−1 and 0.14 nmol N g−1 h−1 in the N0 treatment, 0.94 nmol N g−1 h−1 and less than 0.01 nmol N g−1 h−1 in the N225 treatment, respectively, while respective N2O production rates due to denitrification nitrification and co-denitrification were 0.24 and 0.03 nmol N g−1 h−1, 0.36 nmol N g−1 h−1 and 0.05 nmol N g−1 h−1, respectively (Figure 4, Supplementary Figure S1). As a result, this different sensitivity of the four processes to N fertilization resulted in a decreasing importance of heterotrophic nitrification to N2O production in response to N fertilization, while the contributions of autotrophic nitrification, denitrification, and co-denitrification increased. This result demonstrated the N2O production pathways in the lawn altered with increasing N fertilization application.
Soil NO3− content was positively related with the N2O production rates by autotrophic nitrification (p < 0.01) and denitrification (p < 0.05), and negatively related with heterotrophic nitrification (p < 0.01) (Figure 5). Soil NH4+ content was positively related with the N2O production rate by co-denitrification (p < 0.05), and negatively related with heterotrophic nitrification (p < 0.01) (Figure 5). Soil pH was positively related with the N2O production rate by heterotrophic nitrification (p < 0.01) (Figure 5). Total soil C and N content, and C/N ratio were not significantly correlated with the N2O production rates by four processes (Figure 5).
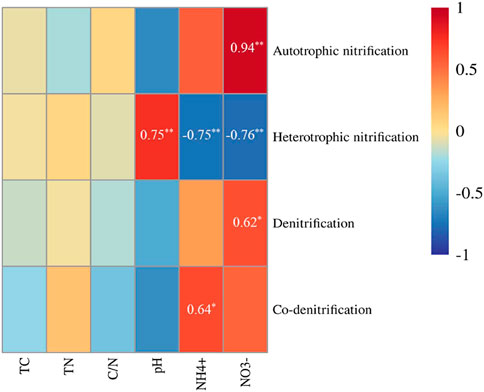
FIGURE 5. Relationships between soil properties and the N2O production rates of N2O microbial pathways. Linear regression is used to test the correlation. The correlation coefficients are shown when the correlation is statistically significant. **Correlation is significant at the 0.01; *Correlation is significant at the 0.05. TC represents the total carbon; TN represents the total nitrogen; C/N represents the ration of carbon to nitrogen.
We analysed the effects of N fertilization and soil factors on the production rates of autotrophic nitrification, heterotrophic nitrification, denitrification, and co-denitrification using redundancy analysis (Supplementary Figure S2). Axis 1 of the RDA plot explained 78.4% of the variation and axis 2 further explained 11.6%. The results revealed, 90% of the N2O production pathway variations could be explained by soil properties. The order of influence of soil properties was: NO3− > TC > NH4+ > pH > C/N > TN (Supplementary Figure S2).
We distinguished the contributions of autotrophic nitrification, heterotrophic nitrification, denitrification, and co-denitrification to N2O emissions based on the random isotope pairing principle in a15N-labeled nitrate laboratory experiment. Our results suggest that autotrophic nitrification is the most dominant process in the N2O emissions in the lawn, accounting for 60% of the total N2O emissions in the studied lawn (Figure 3). The contribution of autotrophic nitrification increased to 69% with increasing N fertilization application. The contribution of autotrophic nitrification to soil N2O emission in the lawn soil was higher than previous findings on grassland soils (9–27%) and within the range for agricultural soils (14–95%) in laboratory incubation (Chen et al., 2014; Müller et al., 2014; Duan et al., 2019). These differences may relate to soil carbon content, nitrogen content, soil water content, and pH etc (Chen et al., 2014; Müller et al., 2014). The total carbon content (45.2–66 g kg−1) and total nitrogen content (3.7–4.1 g kg−1) of the grassland soils were much higher than the total carbon (6.7–7.7 g kg−1) and total nitrogen (0.89–0.93 g kg−1) of the lawn soil, and the contribution of heterotrophic nitrification was higher in grassland soils (54–85%) than autotrophic nitrification (9–27%) (Müller et al., 2014). Zhang et al. (2015) compared N2O production processes in forest, grassland, and agricultural soils and identified that autotrophic nitrification did not significantly correlate with the soil total carbon and nitrogen contents, while the N2O emissions from heterotrophic nitrification increased linearly with increasing soil organic nitrogen. Compared to agricultural soils, the total carbon and nitrogen content, and the NO3−content (22.6–32.4 mg kg−1) of the lawn soils were consistent with previous findings on agricultural soils (TC 2.8–14.9 g kg−1, TN 0.2–1.3 g kg−1, and NO3−1 content 5–163.5 mg kg−1) (Chen et al., 2014; Duan et al., 2019). Differences in total carbon and nitrogen content may account for the higher contribution of autotrophic nitrification to N2O emissions in the lawn soil and agricultural soils than in grassland soils. Zhou et al. (2021) found that soil NO3− content in forest soil was mainly derived from autotrophic nitrification. Duan et al. (2019) studied N2O emissions from agricultural soils and found the N2O emissions from autotrophic nitrification positively correlated with the soil NO3− content. Our result supported these results via a15N-labeled in laboratory experiment. In our study, autotrophic nitrification was significantly and positively correlated with soil NO3− content (Figure 5). Nitrogen application significantly increased the soil NO3− content but did not significantly increase the soil NH4+ content (Table 1). The increase of NO3− content in the lawn soil was attributed to autotrophic nitrification. After fertilization with an easily decomposable urea, urea is first hydrolyzed to NH4+ by the enzyme urease from the soil microbes, and subsequently nitrified to NO3− by ammonia oxidizing bacteria (Gao X. et al., 2018). Soil WFPS has been demonstrated to play an important role in regulating N2O emissions (Congreves et al., 2019; Bracken et al., 2021). The high soil WFPS promoted the formation of anaerobic condition and enhanced denitrification, which produced more N2O than autotrophic nitrification (Bracken et al., 2021). However, at 80% WFPS, autotrophic nitrification contributed more to the N2O emissions than denitrification in the lawn. High soil moisture might be better for substrates diffusion and simultaneously did not yet restrict O2 diffusion within the range of 80% WFPS, thus favored more N2O production by autotrophic nitrification at higher WFPS (Chen et al., 2014). Short-term O2 limitation occurs or aeration conditions is not favorable for denitrification (Wrage et al., 2001). Congreves et al. (2019) found that ammonia oxidizing bacteria (AOB) cloud carry out nitrifier denitrification at 50–80% WFPS. The contribution of nitrifier denitrification may be attributed to autotrophic nitrification. Therefore, further studies are required to quantify the contribution of nitrifier denitrification to N2O emissions.
Heterotrophic nitrification is considered an important pathway for N2O production in forest, grassland, and agricultural soils, particularly in acidic soils (Zhang et al., 2015). In our study, heterotrophic nitrification contributed 13% of the N2O emissions, and less than 1% after increased N fertilization in the lawn soils (Figure 3). This result was far lower than that observed in soils under laboratory conditions from various ecosystems, which varied from 22 to 85% (Müller et al., 2014; Zhang et al., 2014; Zhang et al., 2015; Duan et al., 2019). Heterotrophic nitrification was mainly controlled by soil organic N (roughly equivalent to soil total N) and pH, and the microorganisms associated with heterotrophic nitrification prefer low molecular soluble organic N rather than inorganic N (Levicnik-Höfferle et al., 2012; Zhang et al., 2013; Zhang et al., 2014). Environments with high organic N and low pH are more favourable for N2O production by heterotrophic nitrification (Marusenko et al., 2013). In the lawn, the contribution of heterotrophic nitrification significantly decreased with increasing N fertilization (Figure 3, Supplementary Figure S1), mainly due to soil NO3− accumulation and the change of soil N cycle-related microbial activity. Fungi are considered to be the most efficient microorganisms performing heterotrophic nitrification, and have been found to be more dominant in soil with low inorganic nitrogen concentration (Marusenko et al., 2013; Zhang et al., 2013; Zhang et al., 2014). In the study, increasing soil NO3− may have reduced fungal activity, resulting in decreased contribution of heterotrophic nitrification to the N2O emissions. Similarly, Tang et al. (2018) also found that N addition decreased the N2O production rates through heterotrophic nitrification in a tropical forest soil.
The contribution of denitrification to N2O emissions is ranked second only to autotrophic nitrification, and showed an increasing trend with increasing N fertilization. Previous studies showed that denitrification under anaerobic conditions is the main microbial process responsible for N2O production (Tang et al., 2018; Congreves et al., 2019; Bracken et al., 2021). However, in this study we found that the contribution of denitrification to N2O emission was only 24%. This was speculated to be due to an increase in the capacity of N2O reduction to N2 induced by N addition (Müller et al., 2015). Tang et al. (2018) found that N2O emissions decreased and N2 emissions increased with increasing N addition in forest soils, these changes may be attributed to substantially greater N2O reduction to N2 during denitrification under anaerobic conditions. Previous studies have suggested that the main contributor of gaseous N emissions from denitrification under anaerobic conditions was N2 instead of N2O (Fang et al., 2015; Müller et al., 2015; Tang et al., 2018). Although the contribution of denitrification to N2O emissions did not change (Figure 3), the N2O production rates by denitrification significantly increased with increasing N fertilization (Figure 4, Supplementary Figure S1). As the substrate for denitrification, NO3− has been reported to be positively correlated with denitrification potential (Pelster et al., 2012). In our study, the soil NO3− content significantly increased after N fertilization (Table 1), which may favour the occurrence of denitrification, enhancing the production N2O rates (Zhou et al., 2021).
Co-denitrification is a complex transformation process that can use both inorganic and organic nitrogen to produce N2O. Conversely, some studies have attributed the contribution by co-denitrification to nitrification or denitrification, leading to an overestimation of the contribution of nitrification or denitrification (Zhang et al., 2018). Therefore, researching co-denitrification aids our understanding of the microbial mechanisms involved in N2O emission pathways. In our study, the contribution of co-denitrification increased with increased nitrogen application (3–5%). However, the contribution of co-denitrification to N2O emissions from lawn soils was much lower than the autotrophic nitrification and denitrification (Figure 3). This result is higher than previous findings on forest soils (approximately 1%), close to agricultural soils (5–7%), but much lower than grasslands (17%) (Müller et al., 2014; Duan et al., 2019; Zhou et al., 2021). Some studies have shown that soil microorganisms are capable of co-denitrification in soil pH levels of 5.5–9.0 (Clough et al., 2017; Rex et al., 2018; Duan et al., 2019). In our study, co-denitrification produced N2O in a pH level of 6–7 in the lawn soil (Table 1). Grassland and agricultural soils had a much higher organic carbon content than the lawn soils, enabling a higher contribution by co-denitrification to the N2O emissions (Müller et al., 2014; Duan et al., 2019). N fertilization provided sufficient inorganic or organic nitrogen substrates for co-denitrification, enhancing co-denitrification process.
In summary, the 15N labelling method and nitrification inhibition technique differentiated the microbial pathways of N2O production in lawn. This technique allowed us to distinguish the contribution of autotrophic nitrification, heterotrophic nitrification, denitrification, and co-denitrification to N2O emissions. We improved the accuracy of the results when compared to the gas inhibition technique (by using only C2H2 and O2) we previously used to differentiate N2O production pathways in lawn. However, this method has some limitations. DCD could only inhibit bacterial autotrophic nitrification and did not inhibit the reduction of N2O to N2, which may lead to overestimation or underestimation of N2O production rates by microbial processes. Compared to acetylene, the DCD was dissolved in water and added to the incubated soil which improves the soil contact and the inhibition process (Figure 2). There are also several microbial processes that can produce N2O that cloud not be distinguished in this study, such as nitrifier denitrification and DNRA. We hope to undertake further research to quantify the N2O separately produced by these microbial processes in the future.
In this study, N fertilization significantly promoted N2O emission rates (p < 0.05). However, N2O emission rates were not linearly related to N fertilization applications, but slightly decreased in the N300 treatment compared to the N225 treatment (Figure 2). Previous research has shown that N addition can increase soil N2O emissions because adding N to a N-limited soil provides soil microorganisms with more substrates for N2O production, especially increasing the soil NO3− content, which in turn increases the N availability in the ecosystem and accelerates the N cycling processes and improves soil N mineralisation (Chen et al., 2018). In contrast, when a soil is not N-limited, N addition does not increase soil N availability, and the soil microbes are stable and do not undertake rapid growth, and the N conversion efficiency by the microbes decreases (Lipson, 2015). In temperate grasslands, N additions greater than 120 kg N hm−2 a−1 can significantly reduce the soil microbial activity (Zeng et al., 2016). In our study, N fertilization significantly increased the soil NO3− content and peaked in the N225 treatment, further confirming the importance of soil NO3− content to N2O emissions (Table 1). It has also been reported that soil NO3− is the most important factor for N2O emissions (Gao X. et al., 2018). We observed that N fertilization significantly reduced the N2O production rate by heterotrophic nitrification, which may be the reason for the reduction in the total N2O emissions after additional high levels of N fertilization (Figure 4, Supplementary Figure S1). There is also a possibility that the N2O emissions reduced due to increased N2O reduction to N2 because of N addition (Müller et al., 2015; Tang et al., 2018), but this theory requires further verification.
In this study, we employed the nitrification inhibition technique and the 15N-nitrate labelling method to quantify N2O-producing microbial processes and their contribution in experimental long-term nitrogen fertilised lawns. We found that autotrophic nitrification was dominant pathway of N2O production in the studied lawn soils, with the contribution increasing from 60 to 69% after N fertilization. N fertilization decreased the contribution of heterotrophic nitrification from 13% to <1%. Co-denitrification to N2O was detected but the overall contribution to emissions was of minor importance. These variations were related to the soil NO3− content soil after N fertilization. N2O emission rates were not linearly related to increased N fertilization applications, although the overall N2O emission rates increased after N fertilization.
To the best of our knowledge, this is the first study to distinguish between microbial processes that produce N2O from lawn soils. Our results suggest that the microbial processes that produce N2O differ in their sensitivity to nitrogen fertilization in lawn soils, while the mechanisms of these different responses are not yet clear. We call for further research to elucidate the mechanisms, and to investigate how lawn types and environmental factors affect contribution of different microbial processes to N2O production.
The original contributions presented in the study are included in the article/Supplementary Material, further inquiries can be directed to the corresponding authors.
ZX, LB, and YF contributed to conceptualization and design of the study. ZX, TX, and XZ performed the lab work. ZX and ZQ analyzed the data. ZX wrote the first draft of the manuscript. LB, YF, and ZQ contributed to writing, review and editing. LB and BR contributed to funding acquisition. All authors have read and approved to the published version of the manuscript.
This research was financially supported by the Liaoning Province Grassland Plant Resources Special Investigation Fund (grant no. 1103-01044415001) and the National Natural Science Foundation of China (grant no. 32001127) in China.
The authors declare that the research was conducted in the absence of any commercial or financial relationships that could be construed as a potential conflict of interest.
All claims expressed in this article are solely those of the authors and do not necessarily represent those of their affiliated organizations, or those of the publisher, the editors and the reviewers. Any product that may be evaluated in this article, or claim that may be made by its manufacturer, is not guaranteed or endorsed by the publisher.
We thank Ang Wang, Jin Li, Haoming Yu, Yingying Wang, Yuying Qu, and Dong Liu from the Institute of Applied Ecology for their skilful assistance in the laboratory.
The Supplementary Material for this article can be found online at: https://www.frontiersin.org/articles/10.3389/fenvs.2022.943920/full#supplementary-material
Bateman, E. J., and Baggs, E. M. (2005). Contributions of Nitrification and Denitrification to N2O Emissions from Soils at Different Water-Filled Pore Space. Biol. Fertil. Soils 41, 379–388. doi:10.1007/s00374-005-0858-3
Bollmann, A., and Conrad, R. (1997). Acetylene Blockage Technique Leads to Underestimation of Denitrification Rates in Oxic Soils Due to Scavenging of Intermediate Nitric Oxide. Soil Biol. Biochem. 29, 1067–1077. doi:10.1016/S0038-0717(97)00007-2
Bracken, C. J., Lanigan, G. J., Richards, K. G., Müller, C., Tracy, S. R., Grant, J., et al. (2021). Source Partitioning Using N2O Isotopomers and Soil WFPS to Establish Dominant N2O Production Pathways from Different Pasture Sward Compositions. Sci. Total Environ. 781, 146515. doi:10.1016/j.scitotenv.2021.146515
Braker, G., and Conrad, R. (2011). Diversity, Structure, and Size of N2O-Producing Microbial Communities in Soils-What Matters for Their Functioning? Adv. Appl. Microbiol. 75, 33–70. doi:10.1016/B978-0-12-387046-9.00002-5
Bremer, D. J. (2006). Nitrous Oxide Fluxes in Turfgrass. J. Environ. Qual. 35, 1678–1685. doi:10.2134/jeq2005.0387
Carey, R. O., Hochmuth, G. J., Martinez, C. J., Boyer, T. H., Nair, V. D., Dukes, M. D., et al. (2012). A Review of Turfgrass Fertilizer Management Practices: Implications for Urban Water Quality. Horttechnology 22, 280–291. doi:10.1007/s13580-012-0130-3
Chen, H., Yang, T., Xia, Q., Bowman, D., Williams, D., Walker, J. T., et al. (2018). The Extent and Pathways of Nitrogen Loss in Turfgrass Systems: Age Impacts. Sci. Total Environ. 637-638, 746–757. doi:10.1016/j.scitotenv.2018.05.053
Chen, Z., Ding, W., Luo, Y., Yu, H., Xu, Y., Müller, C., et al. (2014). Nitrous Oxide Emissions from Cultivated Black Soil: a Case Study in Northeast china and Global Estimates Using Empirical Model. Glob. Biogeochem. Cycles 28, 1311–1326. doi:10.1002/2014GB004871
Clough, T. J., Lanigan, G. J., De Klein, C. A. M., Samad, M. S., Morales, S. E., Rex, D., et al. (2017). Influence of Soil Moisture on Codenitrification Fluxes from a Urea-Affected Pasture Soil. Sci. Rep. 7, 1–12. doi:10.1038/s41598-017-02278-y
Congreves, K. A., Phan, T., and Farrell, R. E. (2019). A New Look at an old Concept: Using 15 N2O Isotopomers to Understand the Relationship between Soil Moisture and N2O Production Pathways. Soil 5, 265–274. doi:10.5194/soil-5-265-2019
Duan, P., Zhou, J., Feng, L., Jansen-Willems, A. B., and Xiong, Z. (2019). Pathways and Controls of N2O Production in Greenhouse Vegetable Production Soils. Biol. Fertil. Soils 55, 285–297. doi:10.1007/s00374-019-01348-9
Fang, Y., Koba, K., Makabe, A., Takahashi, C., Zhu, W., Hayashi, T., et al. (2015). Microbial Denitrification Dominates Nitrate Losses from Forest Ecosystems. Proc. Natl. Acad. Sci. U. S. A. 112, 1470–1474. doi:10.1073/pnas.1416776112
Gao, J., Zhou, W., Liu, Y., Zhu, J., Sha, L., Song, Q., et al. (2018). Effects of Litter Inputs on N2O Emissions from a Tropical Rainforest in Southwest China. Ecosystems 21, 1013–1026. doi:10.1007/s10021-017-0199-8
Gao, X., Deng, O., Ling, J., Zeng, M., and Lan, T. (2018). Effects of Controlled-Release Fertilizer on Nitrous Oxide and Nitric Oxide Emissions during Wheat-Growing Season: Field and Pot Experiments. Paddy Water Environ. 16, 99–108. doi:10.1007/s10333-017-0619-6
Gong, P., Zhang, L.-L., Wu, Z.-J., Chen, Z.-H., and Chen, L.-J. (2013). Responses of Ammonia-Oxidizing Bacteria and Archaea in Two Agricultural Soils to Nitrification Inhibitors DCD and DMPP: A Pot Experiment. Pedosphere 23, 729–739. doi:10.1016/S1002-0160(13)60065-X
Greaver, T. L., Clark, C. M., Compton, J. E., Vallano, D., Talhelm, A. F., Weaver, C. P., et al. (2016). Key Ecological Responses to Nitrogen are Altered by Climate Change. Nat. Clim. Change 6, 836–843. doi:10.1038/nclimate3088
Groffman, P. M., Williams, C. O., Pouyat, R. V., Band, L. E., and Yesilonis, I. D. (2009). Nitrate Leaching and Nitrous Oxide Flux in Urban Forests and Grasslands. J. Environ. Qual. 38, 1848–1860. doi:10.2134/jeq2008.0521
Gu, C., Crane, J., Hornberger, G., and Carrico, A. (2015). The Effects of Household Management Practices on the Global Warming Potential of Urban Lawns. J. Environ. Manag. 151, 233–242. doi:10.1016/j.jenvman.2015.01.008
Hall, B. D., Dutton, G. S., and Elkins, J. W. (2007). The NOAA Nitrous Oxide Standard Scale for Atmospheric Observations. J. Geophys. Res. 112, D09305. doi:10.1029/2006JD007954
Kanter, D., Mauzerall, D. L., Ravishankara, A. R., Daniel, J. S., Portmann, R. W., Grabiel, P. M., et al. (2013). A Post-Kyoto Partner: Considering the Stratospheric Ozone Regime as a Tool to Manage Nitrous Oxide. Proc. Natl. Acad. Sci. U. S. A. 110, 4451–4457. doi:10.1073/pnas.1222231110
Kaye, J. P., Burke, I. C., Mosier, A. R., and Pablo Guerschman, J. (2004). Methane and Nitrous Oxide Fluxes from Urban Soils to the Atmosphere. Ecol. Appl. 14, 975–981. doi:10.1890/03-5115
Klemedtsson, L., Svensson, B. H., and Rosswall, T. (1988). A Method of Selective Inhibition to Distinguish between Nitrification and Denitrification as Sources of Nitrous Oxide in Soil. Biol. Fert. Soils 6, 112–119. doi:10.1007/BF00257659
Lan, T., Li, M., He, X., Deng, O., Zhou, W., Luo, L., et al. (2022). Effects of Synthetic Nitrification Inhibitor (3,4-Dimethylpyrazole Phosphate; DMPP) and Biological Nitrification Inhibitor (Methyl 3-(4-Hydroxyphenyl) Propionate; MHPP) on the Gross N Nitrification Rate and Ammonia Oxidizers in Two Contrasting Soils. Biol. Fertil. Soils 58, 333–344. doi:10.1007/s00374-022-01628-x
Levičnik-Höfferle, Š., Nicol, G. W., Ausec, L., Mandić-Mulec, I., and Prosser, J. I. (2012). Stimulation of Thaumarchaeal Ammonia Oxidation by Ammonia Derived from Organic Nitrogen but Not Added Inorganic Nitrogen. FEMS Microbiol. Ecol. 80, 114–123. doi:10.1111/j.1574-6941.2011.01275.x
Li, X., Hu, F., Bowman, D., and Shi, W. (2013). Nitrous Oxide Production in Turfgrass Systems: Effects of Soil Properties and Grass Clipping Recycling. Appl. Soil Ecol. 67, 61–69. doi:10.1016/j.apsoil.2013.03.002
Lipson, D. A. (2015). The Complex Relationship between Microbial Growth Rate and Yield and its Implications for Ecosystem Processes. Front. Microbiol. 6, 615. doi:10.3389/fmicb.2015.00615
Marusenko, Y., Huber, D. P., and Hall, S. J. (2013). Fungi Mediate Nitrous Oxide Production but Not Ammonia Oxidation in Aridland Soils of the Southwestern US. Soil Biol. Biochem. 63, 24–36. doi:10.1016/j.soilbio.2013.03.018
Milesi, C., Running, S. W., Elvidge, C. D., Dietz, J. B., Tuttle, B. T., and Nemani, R. R. (2005). Mapping and Modeling the Biogeochemical Cycling of Turf Grasses in the United States. Environ. Manag. 36, 426–438. doi:10.1007/s00267-004-0316-2
Müller, A. K., Matson, A. L., Corre, M. D., and Veldkamp, E. (2015). Soil N2O Fluxes along an Elevation Gradient of Tropical Montane Forests under Experimental Nitrogen and Phosphorus Addition. Front. Earth Sci. 3, 66. doi:10.3389/feart.2015.00066
Müller, C., Laughlin, R. J., Spott, O., and Rütting, T. (2014). Quantification of N2O Emission Pathways via a 15N Tracing Model. Soil Biol. Biochem. 72, 44–54. doi:10.1016/j.soilbio.2014.01.013
Pelster, D. E., Chantigny, M. H., Rochette, P., Angers, D. A., Rieux, C., and Vanasse, A. (2012). Nitrous Oxide Emissions Respond Differently to Mineral and Organic Nitrogen Sources in Contrasting Soil Types. J. Environ. Qual. 41 (2), 427–435. doi:10.2134/jeq2011.0261
Prinn, R. G., Weiss, R. F., Arduini, J., Arnold, T., Langley DeWitt, H., Fraser, P. J., et al. (2018). History of Chemically and Radiatively Important Atmospheric Gases from the Advanced Global Atmospheric Gases Experiment (AGAGE). Earth Syst. Sci. Data 10, 985–1018. doi:10.5194/essd-10-985-2018
Ravishankara, A. R., Daniel, J. S., and Portmann, R. W. (2009). Nitrous Oxide (N2O): The Dominant Ozone-Depleting Substance Emitted in the 21st Century. Science 326, 123–125. doi:10.1126/science.1176985
Reay, D. S., Davidson, E. A., Smith, K. A., Smith, P., Melillo, J. M., Dentener, F., et al. (2012). Global Agriculture and Nitrous Oxide Emissions. Nat. Clim. Change 2, 410–416. doi:10.1038/nclimate1458
Rex, D., Clough, T. J., Richards, K. G., de Klein, C., Morales, S. E., Samad, M. S., et al. (2018). Fungal and Bacterial Contributions to Codenitrification Emissions of N2O and N2 Following Urea Deposition to Soil. Nutr. Cycl. Agroecosys. 110, 135–149. doi:10.1007/s10705-017-9901-7
Spott, O., and Stange, C. F. (2011). Formation of Hybrid N2O in a Suspended Soil due to Co-Denitrification of NH2OH. J. Plant Nutr. Soil Sci. 174, 554–567. doi:10.1002/jpln.201000200
Spott, O., Russow, R., and Stange, C. F. (2011). Formation of Hybrid N2O and Hybrid N2 Due to Codenitrification: First Review of a Barely Considered Process of Microbially Mediated N-Nitrosation. Soil Biol. Biochem. 43, 1995–2011. doi:10.1016/j.soilbio.2011.06.014
Stevens, R. J., Laughlin, R. J., Atkins, G. J., and Prosser, S. J. (1993). Automated Determination of Nitrogen-15-Labeled Dinitrogen and Nitrous Oxide by Mass Spectrometry. Soil Sci. Soc. Am. J. 57, 981–988. doi:10.2136/sssaj1993.03615995005700040017x
Stevens, R. J., Laughlin, R. J., Burns, L. C., Arah, J. R. M., and Hood, R. C. (1997). Measuring the Contributions of Nitrification and Denitrification to the Flux of Nitrous Oxide from Soil. Soil Biol. Biochem. 29, 139–151. doi:10.1016/S0038-0717(96)00303-3
Tang, W., Chen, D., Phillips, O. L., Liu, X., Zhou, Z., Li, Y., et al. (2018). Effects of Long-Term Increased N Deposition on Tropical Montane Forest Soil N2 and N2O Emissions. Soil Biol. Biochem. 126, 194–203. doi:10.1016/j.soilbio.2018.08.027
Tian, H., Lu, C., Ciais, P., Michalak, A. M., Canadell, J. G., Saikawa, E., et al. (2016). The Terrestrial Biosphere as a Net Source of Greenhouse Gases to the Atmosphere. Nature 531, 225–228. doi:10.1038/nature16946
Tian, H., Xu, R., Canadell, J. G., Thompson, R. L., Winiwarter, W., Suntharalingam, P., et al. (2020). A Comprehensive Quantification of Global Nitrous Oxide Sources and Sinks. Nature 586, 248–256. doi:10.1038/s41586-020-2780-0
Townsend-Small, A., Pataki, D. E., Czimczik, C. I., and Tyler, S. C. (2011). Nitrous Oxide Emissions and Isotopic Composition in Urban and Agricultural Systems in Southern California. J. Geophys. Res. 116, G1. doi:10.1029/2010JG001494
Wang, A., Fang, Y., Chen, D., Phillips, O., Koba, K., Zhu, W., et al. (2018). High Nitrogen Isotope Fractionation of Nitrate during Denitrification in Four Forest Soils and its Implications for Denitrification Rate Estimates. Sci. Total Environ. 633, 1078–1088. doi:10.1016/j.scitotenv.2018.03.261
Wrage, N., Velthof, G. L., van Beusichem, M. L., and Oenema, O. (2001). Role of Nitrifier Denitrification in the Production of Nitrous Oxide. Soil Biol. Biochem. 33, 1723–1732. doi:10.1016/S0038-0717(01)00096-7
Yang, F., Ignatieva, M., Larsson, A., Zhang, S., and Ni, N. (2019). Public Perceptions and Preferences Regarding Lawns and Their Alternatives in China: A Case Study of Xi'an. Urban For. Urban Green. 46, 126478. doi:10.1016/j.ufug.2019.126478
Zeng, J., Liu, X., Song, L., Lin, X., Zhang, H., Shen, C., et al. (2016). Nitrogen Fertilization Directly Affects Soil Bacterial Diversity and Indirectly Affects Bacterial Community Composition. Soil Biol. Biochem. 92, 41–49. doi:10.1016/j.soilbio.2015.09.018
Zhang, J., Müller, C., and Cai, Z. (2015). Heterotrophic Nitrification of Organic N and its Contribution to Nitrous Oxide Emissions in Soils. Soil Biol. Biochem. 84, 199–209. doi:10.1016/j.soilbio.2015.02.028
Zhang, J., Sun, W., Zhong, W., and Cai, Z. (2014). The Substrate Is an Important Factor in Controlling the Significance of Heterotrophic Nitrification in Acidic Forest Soils. Soil Biol. Biochem. 76, 143–148. doi:10.1016/j.soilbio.2014.05.001
Zhang, Y., Ding, H., Zheng, X., Ren, X., Cardenas, L., Carswell, A., et al. (2018). Land-use Type Affects N2O Production Pathways in Subtropical Acidic Soils. Environ. Pollut. 237, 237–243. doi:10.1016/j.envpol.2018.02.045
Zhang, Y., Zhang, J., Meng, T., Zhu, T., Müller, C., and Cai, Z. (2013). Heterotrophic Nitrification Is the Predominant NO3- Production Pathway in Acid Coniferous Forest Soil in Subtropical China. Biol. Fertil. Soils 49, 955–957. doi:10.1007/s00374-012-0772-4
Zhou, W., Xi, D., Fang, Y., Wang, A., Sha, L., Song, Q., et al. (2021). Microbial Processes Responsible for Soil N2O Production in a Tropical Rainforest, Illustrated Using an In Situ15N Labeling Approach. Catena 202, 105214. doi:10.1016/j.catena.2021.105214
Zhou, X., Wang, S., Ma, S., Zheng, X., Wang, Z., and Lu, C. (2020). Effects of Commonly Used Nitrification Inhibitors-Dicyandiamide (DCD), 3,4-Dimethylpyrazole Phosphate (DMPP), and Nitrapyrin-On Soil Nitrogen Dynamics and Nitrifiers in Three Typical Paddy Soils. Geoderma 380, 114637. doi:10.1016/j.geoderma.2020.114637
Keywords: 15 N-nitrate labelling method, N2O production pathways, autotrophic nitrification, heterotrophic nitrification, nitrogen fertilization, lawn
Citation: Xun Z, Xu T, Ren B, Zhao X, Quan Z, Bai L and Fang Y (2022) Nitrogen Fertilization of Lawns Enhanced Soil Nitrous Oxide Emissions by Increasing Autotrophic Nitrification. Front. Environ. Sci. 10:943920. doi: 10.3389/fenvs.2022.943920
Received: 14 May 2022; Accepted: 08 June 2022;
Published: 01 July 2022.
Edited by:
Dima Chen, China Three Gorges University, ChinaReviewed by:
Yuhui Meng, China Three Gorges University, ChinaCopyright © 2022 Xun, Xu, Ren, Zhao, Quan, Bai and Fang. This is an open-access article distributed under the terms of the Creative Commons Attribution License (CC BY). The use, distribution or reproduction in other forums is permitted, provided the original author(s) and the copyright owner(s) are credited and that the original publication in this journal is cited, in accordance with accepted academic practice. No use, distribution or reproduction is permitted which does not comply with these terms.
*Correspondence: Long Bai, YmFpbG9uZzIwMThAc3lhdS5lZHUuY24=; Yunting Fang, ZmFuZ3l0QGlhZS5hYy5jbg==
Disclaimer: All claims expressed in this article are solely those of the authors and do not necessarily represent those of their affiliated organizations, or those of the publisher, the editors and the reviewers. Any product that may be evaluated in this article or claim that may be made by its manufacturer is not guaranteed or endorsed by the publisher.
Research integrity at Frontiers
Learn more about the work of our research integrity team to safeguard the quality of each article we publish.