 Xiaoming Ma1
 Xin Liu
 Xiawei Liao
- 1School of Environment and Energy, Peking University Shenzhen Graduate School, Shenzhen, China
- 2Bay Area International Business School, Beijing Normal University, Zhuhai, China
This study selects the electro-optical equipment manufacturing industry as an example to explore whether participation in the global value chain increases or mitigates a country’s carbon emissions and describes the impacting factors. Based on multi-regional input-output tables, a value-added decomposition model is used to decompose forward and backward value-added/final products of the world’s electro-optical equipment manufacturing industries in 65 countries from 2005 to 2015. Impacts of several global value chain participation characteristics, including position, forward participation and production length, and backward participation and production length, on a country’s carbon emissions, are examined. The results show that Asian countries have the highest participation rate in the global value chain, both forward and backward, of the electro-optical equipment sector with increasing proportions for forward participation, but lowest backward participation, in simple global value chains. An increase in forward global value chain participation contributes to the reducing carbon emission intensity of the electro-optical equipment manufacturing industry, particularly in terms of simple global value chain participation. On the other hand, the production length of the backward simple global value chain is positively correlated with the total imported carbon emission intensity, indicating that the longer the simple global value chain of foreign production is included in the industry’s imported intermediate products and the lower the country’s position in the global value chain is, the higher its imported carbon emission intensity is. Upgrade in the global value chain is able to reduce the embodied carbon emissions in the intermediate product exports and total imports.
1 Introduction
Global climate change is arguably the most pressing challenge facing humanity in the 21st century. The results of climate change, including sea-level rise, more frequent extreme weather events, and so forth, have generated wide-ranging social-economic ramifications and are expected to continue rising. In 2015, the global community adopted the Paris Agreement, a legally binding international treaty that set an ambitious goal to limit global warming to well below 2, preferably to 1.5°C, compared to pre-industrial levels. In order to achieve such a goal, countries around the world are joining hands to reduce their carbon emissions, the primary contributor to global climate change (IPCC 2013), with ‘common but shared responsibilities’. By January 2021, over 120 countries have made a commitment toward ‘carbon neutrality’ where anthropogenic carbon emissions are entirely absorbed by carbon sinks (Guterres 2020). As the world’s largest carbon emitter, China has committed to peaking its carbon emissions by 2030 and reaching carbon neutrality by 2060 (Mallapaty 2020).
When the majority of carbon emissions are generated from production activities, which are often located in developing countries, large volumes of the produced goods and services are eventually consumed by customers in developed countries through the global trade system. Studies on carbon accounting suggest that about 20–30% of total CO2 emissions are associated with international trade (Meng et al., 2018; Zhang et al., 2020; WTO 2021). In addition to goods and services, the global trade system introduces geographical transfers of environmental externalities, which include carbon emissions. Sharing emission reduction responsibilities between global producers and consumers could facilitate international agreements on global climate policies. Accordingly, there are two approaches to carbon accounting, “production-based” and “consumption-based” (Lenzen et al., 2007; Karakaya et al., 2019). The former quantifies carbon emissions occurring in the regional territory where production takes place, while the latter quantifies emissions in a region where consumption occurs (Davis and Caldeira, 2010). In order to quantify “consumption-based” emissions, either top–down models, such as input–output tables, can be used, or trade data are coupled with production-based analyses (Tukker and Dietzenbacher 2013). The standard territorial-based emission accounting methods are adjusted by removing the emissions associated with exports and adding the emissions associated with imports (Peters and Hertwich 2008).
When existing studies on global carbon emission transfers have been primarily based on global import and export data, it is increasingly recognized that greenhouse gases are emitted along the global value chain (GVC). The value chain is defined as a product or service that follows several stages from its conception to end-use (for example, from design, through fabrication, marketing, and distribution, to support for the final consumer). With the development of economic globalization, countries are deeply involved in the international division of labor system characterized by the division of labor in the GVC, which refers to international production sharing where production is broken (that is, fragmented) into activities and tasks carried out in different countries wherever the necessary skills and materials are available at competitive cost and quality (Gereffi and Fernandes-Stark 2011).
Products transferred across geographical boundaries through the global trade system can be used for either final consumption or as intermediate inputs to produce other goods and services, thus entering a production value chain. The goods and services that we consume are composed of inputs from various countries around the world. According to data from UN Comtrade, trade of intermediate products made up 69.32% of global trade in 2013, increasing from 50% in 1995. Wang et al. (2017a) further classified GVC as either complex GVC or simple GVC. Simple GVC indicates GVC that includes one-time transnational trade, while complex GVC includes more than once transnational trades for intermediate products. According to Li, Meng and Wang (2019), from 2000 to 2007, GVCs, especially complex ones, expanded at a faster rate than GDP. China is playing an increasingly important role in global trades, especially simple GVC networks, while the United States and Germany remain the most important hubs in complex GVC networks. Another indicator of the complexity of GVCs is their length, which is defined by the number of production processes. The more production processes there are, the longer the GVC length is and the GVC is more complex, and vice versa (Fally 2011).
Furthermore, there are two directions for a country to participate in GVCs: forward and backward. According to WTO definitions (WTO 2019), forward GVC participation represents the “seller” perspective or supply-side in GVC participation. It captures the domestic value-added contained in exports sent to third economies for further processing and export through value chains. The value of forwarding participation corresponds to the ratio of the “domestic value-added sent to third economies” to the economy’s total gross exports, that is, how much value-added by exports is generated within the country. On the contrary, backward GVC participation represents the “buyer” perspective or sourcing side in GVCs, where an economy imports intermediates to produce its exports. The value of backward participation is indicated by the ratio of the “foreign value-added content of exports” to the economy’s total gross exports, that is, how much of the value-added created by exports happened abroad.
When studies relating to GVCs have previously primarily focused on the creation and distribution of value-added, employment, and incomes (Timmer et al., 2013), in recent years, scholars have paid increasing attention to the interaction of GVCs and environmental impacts and policies (Hoeskstra and Wiedmann, 2014). When the GVC division of labor allows countries to obtain value-added benefits, it also facilitates transfers of environmental impacts from countries with high value-added activities to low value-added activities. Many developing countries are located at the bottom of GVC bearing large proportions of environmental externalities, for example, carbon emissions, but only low value-added activities (Koopman et al., 2014). In another word, developing countries are often located at the bottom of the “smiling curve”, a curve that resembles a smiling face indicating that the market resides at the two ends of the value chain in terms of, respectively, research and development and branding and services, while the activities in the middle, for example, fabrication, manufacturing, transportation, are low value-added albeit emission-intensive. Take the production of the iPhone for example, among the US$ 2 billion iPhone exports from China in 2009, only 4% of the value-added were in China (Xing and Detert, 2011). Therefore some countries that are abundant in natural resources often perform poorly economically, facing the so-called challenges of the resource curse (Umar et al., 2021), as demonstrated by research on Venezuela (Su et al., 2020) and Russia (Yang et al., 2021). Resource curses can also be transmitted to developed countries through the financial markets (Li et al., 2021). Because technologies vary in each country, global carbon accounting based on final import and export data and national carbon intensities may underestimate or overestimate the carbon emissions generated throughout the full value chain. It is, therefore, useful to examine carbon emission distributions of countries through the lens of GVC and how a certain country upgrading its location at the GVC could affect its carbon emissions.
Existing studies on GVC and carbon emissions have focused on the national level and quantified the relationship between position along the GVC and national embodied carbon emissions (Wang et al., 2019; Fei et al., 2020). However, few studies have shed light on the impacts of other indexes of GVC, that is, participation length and complexity, on carbon emissions, especially at a sector level. This study, therefore, fills this gap. Selection of the electro-optical equipment manufacturing sector is due to two reasons: 1) as this industry has a long GVC across the globe with a high degree of production fragmentation, i.e., intermediate inputs sourced from different countries; 2) there are significant carbon emissions generated at different production processes of the electro-optical equipment industry. This study 1) first quantifies the country-level carbon emissions through the GVC of the electro-optical equipment (EOE) manufacturing sector at a global scale and 2) examines the impacts of several GVC characteristics, including GVC position, forward participation and length, backward participation and length, on carbon emissions.
2 Methods and data
There are primarily three types of methods examining sector-level GVC and its carbon emissions: 1) global trade statistics of intermediate production inputs; 2) global trade statistics based on customs data; 3) trade decomposition based on value-additions. The first two methods have relatively low data requirements. While the first method has low accuracy, the second method only covers a few main sectors (Amador and Cabral 2016). This study adopts the value-added decomposition model based on the OECD Multi-Regional Input-Output Model (OECD 2018) to decompose the forward and backward value-additions along the GVC of the world’s electronic optical equipment manufacturing industry and calculate the carbon emissions for global electronic optical equipment in 65 countries from 2005 to 2015. According to the Wang-Wei-Zhu (WWZ) decomposition method (Wang et al., 2013), exports can be decomposed into 16 components, including domestic value-added, foreign value-added, returning value-added, double counting, and so forth. The methodological framework of this study is summarized in Figure 1.
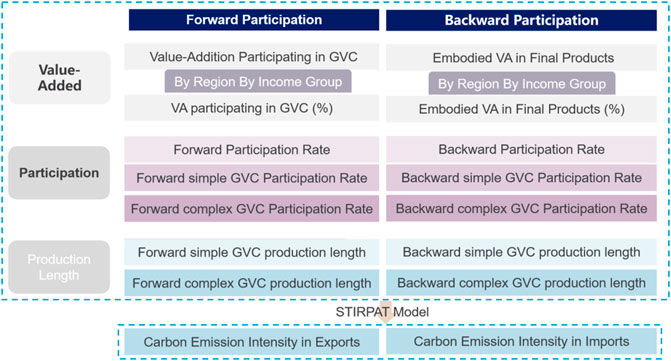
FIGURE 1. Method framework of this study.
2.1 Multi-regional input–output model
An Input-Output Model is a representation of the interdependencies between different sectors of a flow system, like an economy (Leontief, 1936). The multi-regional input-output (MRIO) model is developed based on the traditional IO model, taking into account the impacts of inter-regional trades. MRIO has become one of the most widely used approaches to analyze the interdependencies of different economies and their associated environmental impacts and externalities (Mi et al., 2018). Each column in the IO table represents the required inputs from other industries to produce the given amount of the product represented by that column. When the output flows associated with a particular level of final demand (exogenous in a standard IO model) are known, the total emissions throughout the (global) economy can be estimated by multiplying these output flows with the emission intensity coefficient (emission per unit of gross output) in each country/industry.
2.2 Global value chain participation
According to Koopman et al. (2014), GVC participation can be used to indicate a country’s participation in the GVC of a certain industry and can be expressed by the upcoming equation:
where IVir indicates the indirect value-addition export of sector i of country r, equalling the sum of domestic value-additions created for the total export of intermediate products of sector i. FVir represents foreign value-additions embodied in the total exports of sector i of country r and Eir denotes country r’s sector i’s total exports. Forward and backward participation indicators can be calculated by dividing forward participation and backward participation, respectively, by the total export, indicating how much of the exported goods are for the global value chain and how much of the exported goods are from the global value chain, respectively. Other characteristics of participation, including the length and complexity, can be calculated according to Wang et al. (2017b) and are detailed in Supporting Information.
2.3 Stochastic impacts by regression on the population, affluence, and technology model
Based on the impact, population, affluence, and technology (IPAT) model, Dietz and Rosa (1994) proposed the stochastic impacts by regression on population, affluence, and technology (STIRPAT) model that allows a hypothesis test on different weights of the impacting factors of environmental externalities, that is, population, affluence, and technology. Based on the basic equation of a STIRPAT model, we developed the following equation
where i denotes the country, t denotes the year,
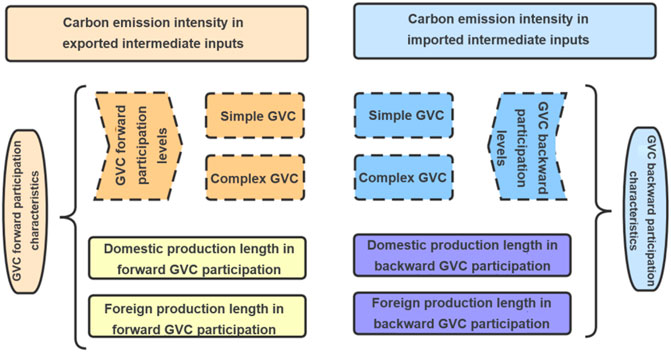
FIGURE 2. Methodological framework for analyzing GVC participation’s impacts on carbon emissions.
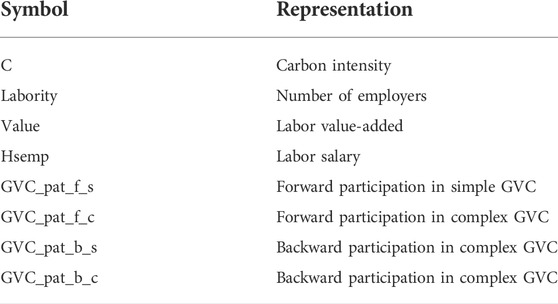
TABLE 1. Symbol representation.
2.4 Data sources
We selected the 10-year period from 2005 to 2015 due to data availability in the OECD input–output table database and examined all 65 countries that are covered by the database (OECD 2018). Sector carbon emission data are obtained also from the OECD database (OECD 2018). According to the Chinese National Economy Sector Classification (GB/T 4754-2017), the “Communication, Computer and other Electronic Equipment” sector corresponds to the EOE sector in the OECD IO tables. Prices are also adjusted to compare prices accordingly.
3 Results
3.1 Forward global value chain participation in the electro-optical equipment manufacturing industry
Same as OECD data categorization, we have analyzed regional characteristics of several regions, including the Asian region (AR), transition countries (TCs), European Union (EU), NAFTA, Latin-American countries (LAC), ASEAN, and other countries. AR includes South Korea, Japan, India, China, Hong Kong (China), and Chinese Taipei. Regarding the EOE industry, except India and Hong Kong having relatively low GVC participation, indicated by value-added from participating in GVC, from 2005 to 2015, the other countries have had relatively high and stable participation. In particular, China has enjoyed the highest growth rate with Japan demonstrating a slightly declining trend. Transition Countries, including Poland, Russia, Croatia, and Turkey, had much lower participation levels, which are comparable to or even lower than that of India and Hong Kong. LAC countries have similar levels of participation as TC countries. On the contrary, EU countries had much higher participation levels, ranging from one to ten times that of TC countries. Except for Germany and the United Kingdom which have demonstrated fluctuating but overall growing trends, other countries have all witnessed declining value addition gains from participating in EOE GVCs. It should be noticed that ASEAN countries, including the Philippines, Malaysia, Singapore, Vietnam, Cambodia, Thailand, and Indonesia, have had high participation levels in EOE GVCs, with fast increasing trends, particularly the Philippines.
According to our analysis, Asian countries and regions have the highest participation rate in the GVC of the EOE industry. Chinese Taipei, South Korea, Mexico, China, and Singapore are the top five countries/regions with the highest value additions in the sector. LAC countries have the lowest while also decreasing forward GVC participation. South Korea, Japan, Chinese Taipei, and the processing sectors of China have experienced increasing forward participation, while the non-processing trade of China and Hong Kong has experienced significant decreasing trends.
However, it should be noted that the proportion of Asian/ASEAN countries’ forward participation in complex GVC demonstrates decreasing trend but an increasing trend for simple GVC, indicating that the EOE manufacturing industry in Asian countries is increasingly exporting to the GVC whose exported goods are only traded across national boundaries once. It can be seen from Figure 3, that except for India, forward participation in simple GVC of main Asian economies has all demonstrated significant upward trends. Most exports from Asian countries are provided for final customers, while only small proportions are as intermediate products. Such results demonstrate that Asian countries are important global suppliers, while their position in GVC is gradually moving from simple and low value-added assembly processes toward closer to the final consumers, such as high value-added after-sale services.
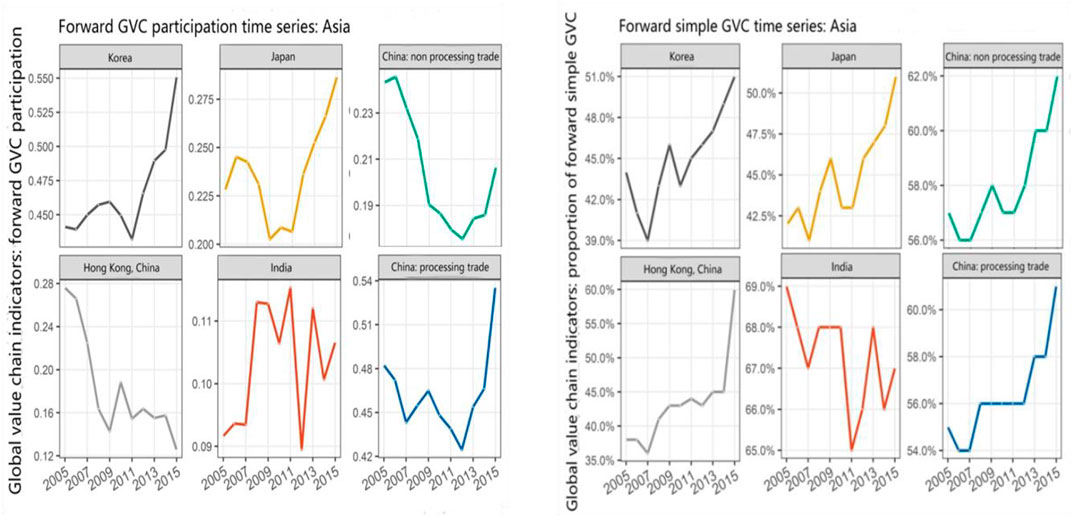
FIGURE 3. Forward GVC participation of main Asian countries in the EOE sector.
In terms of production length, forward participation length is longer in Asian countries, i.e., China, South Korea, Chinese Taipei, and India, while shorter in EU countries, indicating that Asian countries are still located more upstream than EU countries. Furthermore, forward participation length has demonstrated increasing trends in most countries, indicating the GVC of the EOE industry is getting increasingly complex.
3.2 Backward global value chain participation in the electro-optical equipment manufacturing industry
In terms of their backward participation in the GVC, final EOE products in Asia also have the highest embodied foreign value-additions whereas the proportions are the lowest in TC countries. Specifically, EOE products in China, South Korea, Chinese Taipei, Japan, and Mexico have the highest value-additions from foreign countries. In terms of the proportion, foreign value-addition makes up the highest proportions in the value of final EOE products in ASEAN countries. As shown in Figure 4, backward participation proportions of South Korea, Japan, and Chinese Taipei have all declined significantly after 2013, indicating their upward position changes along the GVC. In terms of export value-added, embodied foreign value-added also make up higher proportions in ASEAN countries while lower proportions in LAC countries. In terms of specific countries, the United States and Japan have relatively low proportions of embodied foreign value additions in their total value additions of exports, meaning most of the value additions created by their exports are left within their borders, while on the contrary, most of the VAs created by exports of Vietnam, Malaysia, and Mexico are generated abroad.
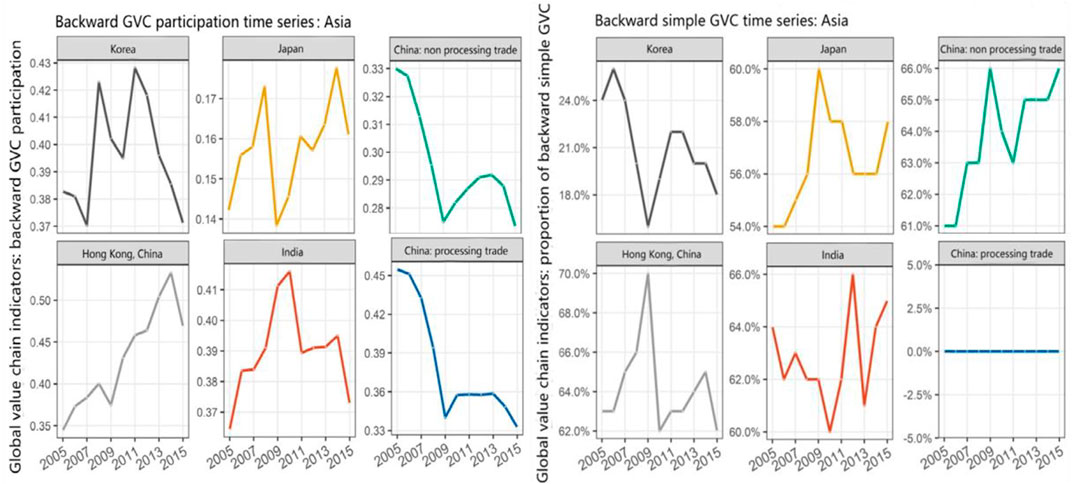
FIGURE 4. Backward GVC participation of Asian countries/regions of the EOE sector.
Comparing participation in simple and complex GVC, the US has the highest proportion of backward participation in simple GVC, indicating that value-addition embodied in the imports of the US mostly comes directly from the exporting country instead of a third country or region. In contrast to forward participation, ASEAN countries have the lowest proportion of backward participation in simple GVC, indicating that value-additions embodied in ASEAN countries’ imports are mostly sourced from another third-party country or region instead of from the exporting country directly. Meanwhile, Asian countries also have the highest backward participation length, mainly China and India, while EU and NAFTA countries have relatively shorter backward participation lengths.
In general, Asian countries, mostly India and ASEAN countries, have longer backward participation lengths than forward participation lengths, with different changing trends and rates, meaning that Asian countries are engaged at relative downstream positions of the GVC for EOE. Take India for example, its forward participation length is decreasing, while backward participation length has been increasing, indicating its “locked-in” position at the lower end of GVCs moving gradually toward the final consumers. On the contrary, forward participation lengths of China, Japan, and Chinese Taipei have all demonstrated a faster increasing rate than their respective backward participation lengths, indicating their potential to move towards upstream positions along the GVC.
3.3 Global value chain participation’s impacts on carbon emissions
All variables passed the stationary tests, as shown in Supplementary Table S1, indicating that all variables are stationary. The impacts of various GVC characters, including forward participation, forward production length, backward participation, and backward production length on carbon emissions are examined and presented. It is found by this study that an increase in forward participation can reduce the carbon emission intensity of the EOE manufacturing industry after the level of participation reaches a certain threshold. In other words, forward participation in GVC may negatively affect carbon reduction at the beginning but will contribute to carbon reduction after the participation level reaches a certain turning point, showing an invert-U shape, which is consistent with findings from Wang et al. (2019) at the aggregated economy-level. Participating in GVC often initially promotes emission-intensive production activities in a country and therefore contributes to emission increases. However, with the participation growing at a later stage, technological advancement and industrial structural change contribute to reducing a country or a sector’s emission intensities.
Specifically, participating in GVC is able to reduce carbon emission intensities for countries in Asia, North America, and Transitioning countries, primarily in East Europe. On the contrary, participating in GVC increases carbon emission intensity for the EOE manufacturing industry for countries in Latin America and ASEAN. However, as shown in Table 2, purely increasing forward GVC participation does not reduce carbon emissions. An increase in forward participation in complex GVC contributes to carbon emission reductions, likely due to the more specialized workforce.
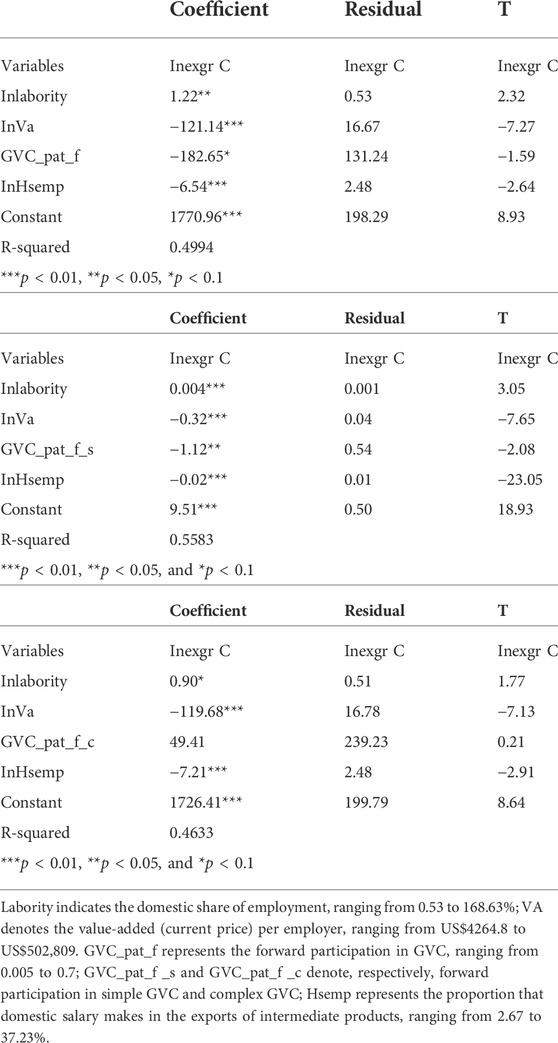
TABLE 2. Regression results of forward participation in GVC (top), simple GVC (middle), and complex GVC (lower) and the carbon intensity of exports of intermediate products.
In addition, increasing job skills, indicated by their salary levels, also corresponds to decreasing carbon intensities, whereas increasing the number of jobs, that is, labor-intensive, is correlated with increases in carbon intensities. Labor-intensive processes are often emission-intensive but low in value addition at the same time, involving manufacturing and so forth. On the contrary, high labor skill requirements are often correlated with product design, high technology, services, etc. which are often low in emissions and high in value addition. Overall, production process upgrades, that is, the transition from labor-intensive to skill-intensive, are correlated with a reduction in carbon intensities.
Similarly, looking at the backward participation reveals that for countries that are currently located at the lower segments of the GVC, increasing backward participation in simple GVC leads to increased embodied carbon imports (Table 3).
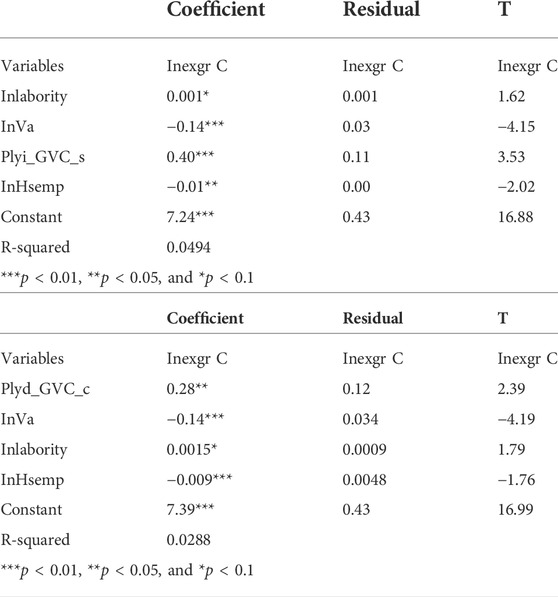
TABLE 3. Regression results of the backward production length in simple GVC (upper) and complex GVC and the imported carbon intensity.
Moving up in terms of backward participation in GVC contributes to reducing carbon intensity. Regionally, backward production length for countries in Asia, especially ASEAN, is negatively correlated with its imported carbon intensities.
4 Conclusion and discussion
4.1 Conclusion
This study finds that Asian, especially ASEAN, countries have the highest forward participation rate in the EOE industry while Latin American countries have a relatively low participation rate. In terms of production length, forward production length is relatively long for Asian countries while short for European countries, indicating that Asian countries are located at relatively lower segments of the GVC. Furthermore, the forward production length of Asian countries in the GVC of EOE demonstrates an increasing trend. Similarly, Asian countries also have the highest backward participation in the GVC of EOE. The highest proportions of value addition of final EOE products in ASEAN countries are actually incurred elsewhere, whereas most value additions of final EOE products in Latin American countries are generated within their own country. Revealingly, Asian countries normally have longer backward production length than forward production length, reflecting their relatively low position at the GVC.
Overall, increasing forward participation rate contributes to reducing the carbon intensity embodied in the exports while the impact changes from reducing carbon emissions to increasing carbon emissions with the participation rate decreases, indicating certain thresholds for realizing the carbon mitigation impacts. From the perspective of backward participation, increasing importing from simple GVC reduces the carbon reduction effects. Furthermore, regression analysis shows that the increase in proportions of high-skilled employees, indicating technology improvement, also has positive effects on reducing the total carbon emission intensity of intermediate product imports and exports.
4.2 Discussion
4.2.1 Reducing emissions by participating in the global value chain
Modern productions are often broken into more than one country, and therefore, all countries along the value chain have shared value-added benefits. Participating in the global value chain first may incur two effects on a country/sector’s environmental impacts by promoting production efficiency through specializing comparative advantages while also increasing production activities. At a later stage, participating in GVC introduces technological advancement with economic development. Consistent with other studies at national scales (Liu et al., 2020), our analysis of the EOE sector confirms that GVC participation and carbon emissions demonstrate an inverse-U shape with carbon emissions increasing first but decreasing after certain points. Different countries at different places of the curve may anticipate different impacts brought by furthering participation in GVC. Countries in North America and Europe may expect carbon emission reduction effects, while Latin American and ASEAN countries may experience carbon emission increase first; therefore, we need to focus on upgrading their GVC positions and nurturing industries that are skill and technology-intensive.
4.2.2 Upgrading global value chain positions to reduce carbon emissions
A regional study on the Belt and Road countries has found that GVCs' position upgrading could reduce carbon emissions (Shi et al., 2022), which is further confirmed by in-depth sector-specific analyses conducted by this study. It is not difficult to comprehend such results on the national scale, given that low GVC positions are often resource, and therefore emission, intensive while having low-value additions. Our results have shown that Asian countries would most benefit from such a transition by increasing their forward participation in complex GVCs. From 2000 to 2018, Asia’s share in the world’s total domestic value-added via forwarding linkages has increased from 23.0 to 30.2 percentage by a margin of almost one-third, while China has overtaken Japan as the largest generator of Asia’s domestic value-added via forward linkages making up about 44.2 percent of the region’s total (Xing et al., 2022). Therefore there is considerable potential for China to upgrade its GVC position in order to reduce its carbon emissions without compromising its economic conditions. Last but not least, the COVID-19 pandemic and the associated travel constraints have reshaped the global trade patterns and the global value chain. However, its impacts are yet to be studied.
4.2.3 Policy implications
According to our results, Asian countries are of prominent importance in the GVCs, however, often located at the bottom of the “Smiling Curve”. Although Asian countries not only have longer backward production length, their backward production length is demonstrating an increasing trend, which indicates a possibility of low-locked effects. Therefore, it is advisable for Asian countries, especially those in ASEAN, not only to participate in GVC but also to improve their GVC position by cultivating high-value-added processes, including smart manufacturing, financing, and final consumption. Second, enterprises should be encouraged to promote research and development, marketing, design, and other high-value-added but low-emission processes. Technological improvement has particular positive impacts on both reducing carbon emissions and increasing value-additions. In addition, improving working efficiency, by measures such as standardization and improving labor skills, can also contribute to reducing carbon emissions. Last but not least, in order to facilitate global carbon emission reduction responsibility sharing, countries specializing in material manufacturing, operation, and other resource and emission-intensive processes should internalize the environmental costs into production costs.
Data availability statement
Publicly available datasets were analyzed in this study. These data can be found at: http://stats.oecd.org/Index.aspx?DataSetCode=IOTS_2021.
Author contributions
XM: methodology, resources, validation, and writing—review and editing. XL: writing—draft, investigation, and formal analysis. XP: data curation, calculation, visualization. XL: conceptualization, validation, supervision, and writing—review and editing.
Funding
This work was supported by Beijing Normal University Young Talent Research Start-up Funding and Shenzhen Science Research Grant (GJHZ20180928162210431) “Modeling and Balance Circuitry for Lithium-iron Phosphate Retired Battery.”
Conflict of interest
The authors declare that the research was conducted in the absence of any commercial or financial relationships that could be construed as a potential conflict of interest.
Publisher’s note
All claims expressed in this article are solely those of the authors and do not necessarily represent those of their affiliated organizations, or those of the publisher, the editors, and the reviewers. Any product that may be evaluated in this article, or claim that may be made by its manufacturer, is not guaranteed or endorsed by the publisher.
Supplementary material
The Supplementary Material for this article can be found online at: https://www.frontiersin.org/articles/10.3389/fenvs.2022.943801/full#supplementary-material
References
Amador, J., and Cabral, S. (2016). Global value chains: A survey of drivers and measures. J. Econ. Surv. 30 (2), 278–301. doi:10.1111/joes.12097
Davis, S., and Caldeira, K. (2010). Consumption-based accounting of CO 2 emissions. Proc. Natl. Acad. Sci. U.S.A. 107 (12), 5687–5692. doi:10.1073/pnas.0906974107
Dietz, T., and Rosa, E. (1994). Rethinking the environmental impacts of population. affluence Technol. 1 (2), 277–300.
Fally, T. (2011). On the fragmentation of production in the US. Working Papers. US: University of Colorado mimeo.
Fei, R., Pan, A., Wu, X., and Xie, Q. (2020). How GVC division affects embodied carbon emissions in China's exports? Environ. Sci. Pollut. Res. 27 (29), 36605–36620. doi:10.1007/s11356-020-09298-8
Gereffi, G., and Fernandezstark, K. (2011). Global value chain analysis: A primer. Report. USA: Duke Center on Globalization, Governance & Competitiveness.
Guterres, A. (2020). Carbon neutrality by 2050; the world's most urgent mission. Report. US: United Nations.
Hoekstra, A. Y., and Wiedmann, T. O. (2014). Humanity's unsustainable environmental footprint. Science 344 (6188), 1114–1117. doi:10.1126/science.1248365
IPCC (2013). Climate change 2013: The physical science basis. Contribution of working group I to the fifth assessment report of the intergovernmental panel on climate change. Report. Cambridge, UK: Cambridge Univ Press, 33–115.
Karakaya, E., Yılmaz, B., and Alataş, S. (2019). How production-based and consumption-based emissions accounting systems change climate policy analysis: The case of CO2 convergence. Environ. Sci. Pollut. Res. 26 (16), 16682–16694. doi:10.1007/s11356-019-05007-2
Koopman, R., Wang, Z., and Wei, S. J. (2014). Tracing value-added and double counting in gross exports. Am. Econ. Rev. 104 (2), 459–494. doi:10.1257/aer.104.2.459
Lenzen, M., Murray, J., Sack, F., and Wiedmann, T. (2007). Shared producer and consumer responsibility - theory and practice. Ecol. Econ. 61, 27–42. doi:10.1016/j.ecolecon.2006.05.018
Leontief, W. (1936). Quantitative input and output relations in the economic systems of the United States. Rev. Econ. statistics 18 (3), 105. doi:10.2307/1927837
Li, X., Meng, B., and Wang, Z. (2019). Recent patterns of global production and GVC participation. Report. Geneva, Switzerland: WTO.
Li, Z., Rizvi, S., Rubbaniy, G., and Umar, M. (2021). Understanding the dynamics of resource curse in G7 countries: The role of natural resource rents and the three facets of financial development. Resour. Policy 73, 102141. doi:10.1016/j.resourpol.2021.102141
Liu, H., Zong, Z., Hynes, K., and De Bruyne, K. (2020). Can China reduce the carbon emissions of its manufacturing exports by moving up the global value chain? Res. Int. Bus. finance 51, 101101. doi:10.1016/j.ribaf.2019.101101
Mallapaty, S. (2020). How China could be carbon neutral by mid-century. Nature 586, 482–483. doi:10.1038/d41586-020-02927-9
Meng, B., Peters, G. P., Wang, Z., and Li, M. (2018). Tracing CO2 emissions in global value chains. Energy Econ. 73, 24–42. doi:10.1016/j.eneco.2018.05.013
Mi, Z., Meng, J., Zheng, H., Shan, Y., Wei, Y. M., and Guan, D. (20182012). A multi-regional input-output table mapping China's economic outputs and interdependencies in 2012. Sci. Data 5 (1), 180155–180212. doi:10.1038/sdata.2018.155
OECD (2018). OECD inter-country input-output (ICIO) tables. AvaliableAt: https://www.oecd.org/sti/ind/inter-country-input-output-tables.htm.
Peters, G., and Hertwich, E. (2008). CO2 embodied in international trade with implications for global climate policy. Environ. Sci. Technol. 42 (5), 1401–1407. doi:10.1021/es072023k
Shi, Q., Zhao, Y., and Qian, Z. (2022). Global value chain participation and carbon emissions: Evidence from belt and road countries. Appl. Energy 310. 118505. doi:10.1016/j.apenergy.2021.118505
Su, C., Khan, K., Tao, R., and Umar, M. (2020). A review of resource curse burden on inflation in Venezuela. Energy 204, 117925. doi:10.1016/j.energy.2020.117925
Timmer, M. P., Los, B., Stehrer, R., and de Vries, G. J. (2013). Fragmentation, incomes and jobs: An analysis of European competitiveness. Econ. Policy 28 (76), 613–661. doi:10.1111/1468-0327.12018
Tukker, A., and Dietzenbacher, E. (2013). Global multiregional input-output frameworks: AN introduction and outlook. Econ. Syst. Res. 25 (1), 1–19. doi:10.1080/09535314.2012.761179
Umar, M., Ji, X., Mirza, N., and Rahat, B. (2021). The impact of resource curse on banking efficiency: Evidence from twelve oil producing countries. Resour. Policy 72, 102080. doi:10.1016/j.resourpol.2021.102080
Wang, J., Wan, G., and Wang, C. (2019). Participation in GVCs and CO2 emissions. Energy Econ. 84, 104561. doi:10.1016/j.eneco.2019.104561
Wang, Z., Wei, S. J., and Yu, X. (2017b). Measures of participation in global value chains and global business cycles. Working Papers 23222. Cambridge, MA, US: National Bureau of Economic Research.
Wang, Z., Wei, S. J., and Zhu, K. (2013). Quantifying international production sharing at the bilateral and sector levels. Working Paper 19677. Cambridge, MA, US: National Bureau of Economic Research.
Wang, Z., Wei, S., Yu, X., and Zhu, K. (2017a). Characterizing global value chains: Production length and upstreamness. Working Papers 23261. Cambridge, MA, US: National Bureau of Economic Research.
WTO (2019). WTO 'Trade in value-added and global value chains' profiles. AvaliableAt: https://www.wto.org/english/res_e/statis_e/miwi_e/Explanatory_Notes_e.pdf.
Xing, Y., and Detert, N. (2011). How the iPhone widens the US trade deficit with the PRC? Discussion paper. Working Paper 257. Tokyo, Japan: National Gradute Institute for Policy Studies.
Xing, Y., Gentile, E., and Dollar, D. (2022). Global value chain development report 2021: Beyond production. Report. Manila, the Philippines: Asian Development Bank.
Yang, J., Rizvi, S., Tan, Z., Umar, M., and Koondhar, M. (2021). The competing role of natural gas and oil as fossil fuel and the non-linear dynamics of resource curse in Russia. Resour. Policy 72, 102100. doi:10.1016/j.resourpol.2021.102100
Keywords: global value chain, carbon emissions, electro-optical equipment, input-output analysis, decomposition analysis
Citation: Ma X, Liu X, Pan X and Liao X (2022) Global value chain participation impacts carbon emissions—Take the electro-optical equipment industry as an example. Front. Environ. Sci. 10:943801. doi: 10.3389/fenvs.2022.943801
Received: 14 May 2022; Accepted: 05 July 2022;
Published: 05 August 2022.
Edited by:
Xu Zhao, Shandong University, Weihai, ChinaReviewed by:
Chuanfu Zang, South China Normal University, ChinaXiaotian Ma, Shandong University, China
Copyright © 2022 Ma, Liu, Pan and Liao. This is an open-access article distributed under the terms of the Creative Commons Attribution License (CC BY). The use, distribution or reproduction in other forums is permitted, provided the original author(s) and the copyright owner(s) are credited and that the original publication in this journal is cited, in accordance with accepted academic practice. No use, distribution or reproduction is permitted which does not comply with these terms.
*Correspondence: Xiawei Liao, eGlhd2VpLmxpYW9AYm51LmVkdS5jbg==