 Cheng Peng
 Ehsan Elahi
 Bingbing Fan
 Zenghui Li
- School of Economics, Shandong University of Technology, Zibo, China
The study discusses the effect of co-agglomeration between the producer service industry and the high-tech manufacturing industry on regional innovation efficiency. Based on data from public companies of three urban agglomerations from 2011 to 2019, we used the Data Envelopment Approach (DEA)- Banker, Charnes, Cooper (BCC) model to estimate real innovation efficiency. Results found that the industrial co-agglomeration and regional innovation efficiency have an “inverted U-shaped” relationship. The industrial co-agglomeration in regions with a low level of co-agglomeration plays an important role in expediting regional innovation efficiency than that in high-level areas of co-agglomeration. Moreover, it is confirmed that the prefecture-level cities of the three urban agglomerations have low innovation efficiency types and low collaborative agglomeration types. Yangtze and Pearl river delta urban agglomeration can promote innovation efficiency through industrial co-agglomeration. While for the industrial co-agglomeration of Beijing, Tianjin, and Hebei, the urban agglomeration has not become the main way to promote innovation efficiency. The regression results of different industry collaborative agglomeration found that the co-agglomeration of information transmission, computer services, software industries, and the high-tech manufacturing industry plays a significant role to improve innovation efficiency. Moreover, the co-agglomeration of the transportation service industry and high-tech manufacturing industry plays a relatively weak role in regional innovation efficiency. Therefore, it is suggested to formulate more adaptive and heterogeneous market policies. The paper provides an important idea for improving innovation efficiency by optimizing industrial spatial layout.
1 Introduction
The producer service industry is representative of the modern service industry. The high-tech manufacturing industry has better technological innovation ability and market competitiveness than the traditional manufacturing industry (Peng et al., 2019b; Peng et al., 2020a; Zhao et al., 2020). According to the National Bureau of Statistics data in 2020, the added value of the high-tech manufacturing industry increased by 5.9% from last year in the first ten months. It is significantly faster than the growth of industries above the designated size and continued to maintain rapid growth. Under the epidemic’s impact, some high-tech enterprises have accelerated their transformation and gradually transformed into a combination of online and offline. In the context of the current economic transformation, the integrated development between producer services and high-tech manufacturing can better represent the direction of economic development and industrial structure optimization in China (Peng et al., 2019b; Tu et al., 2019; Zheng et al., 2020; Peng et al., 2021a). In addition, according to the data of the “China Enterprise Innovation Capability Ranking 2020″, the invention patents applied by the top 1000 high-tech enterprises took possession of 62.9% of the overall number of patents applied for that year, the proportion has increased by 2.9% than last year. It is particularly valuable to explore regional innovation from the perspective of the high-tech enterprises, and one of the important ways to promote enterprise innovation is the integrated development of producer services and manufacturing, especially high-tech manufacturing (Huang et al., 2021; Wu et al., 2021; Zhao et al., 2021).
The ability of independent innovation is the top priority of long-term industrial structure adjustment (Peng et al., 2019a; Zhang H. X. et al., 2020; Peng et al., 2020c), and the improvement of innovation ability is not only due to the continuous increase of R&D investment because of the increase of innovation efficiency (Dai and Liu, 2016). Adoption of technology is important for the sustainability and efficiency of the ecosystem (Elahi et al., 2019c; Elahi et al., 2021a). Regarding innovation efficiency, previous studies have focused on its influencing factors, including environmental regulation, ownership structure, equity allocation, and industrial agglomeration (Elahi et al., 2020; Elahi et al., 2021b; Elahi et al., 2022). Among them, around the proposition of the relationships between the industrial agglomeration and innovation efficiency, the early study was mainly the perspective of producer service industry agglomeration (Wang et al., 2019; Peng et al., 2021b; Zhong et al., 2021). Some scholars believed that the diversification of the producer service industry agglomerated in the eastern region and large and medium-sized prefecture level cities. The promotion of innovation efficiency is obvious, and the rise of specialized agglomeration is obvious in the western and middle regions and small cities (Yang and Bao, 2019). Specialization agglomeration will help improve the innovation efficiency of the manufacturing industry in the area (Shen et al., 2019; Zhang et al., 2019; Tu et al., 2020; Peng et al., 2021d). Most scholars agreed that the promotion influence of industrial agglomeration on innovation efficiency is more obvious (Peng et al., 2020b; Wang et al., 2021; Zhang et al., 2021). This research perspective emphasizes the effect of industrial agglomeration, but industrial agglomeration does not reflect the co-agglomeration relationship between industries, and the conclusions that focused on the effect of different industrial agglomeration on innovation efficiency are inconsistent.
In the last decade, with the continuous development of the manufacturing industry and the producer service industry, the upstream and downstream relationship between the manufacturing industry and the producer service industry in the same industry chain has become more obvious. The innovation environment and innovation cost have an impact, and then the incentives for the formation of innovation efficiency are also emerging (Amiti, 2001; Weterings and Boschma, 2009; Zhong et al., 2020). Consequently, the industrial co-agglomeration has gradually become an advanced stage of industrial agglomeration (Wang and Sun, 2020), and its impact on innovation efficiency has also become a current research hotspot. Many Chinese scholars agreed that the promotion effect of the two industries’ co-agglomeration is obvious (Hua et al., 2021). Furthermore, some scholars have studied the effect of industrial co-agglomeration on industrial enterprise innovation and regional innovation. In various studies, it is found that the industrial co-agglomeration has increased the technological innovation of manufacturing enterprises (Liu et al., 2019). However, the selection of indicators is often limited by factors such as enterprise characteristics and local policies. Furthermore, it is reported that the level of urban innovation will continue to improve with the deepening of industrial co-agglomeration, but it will be affected by urban and industry heterogeneity (Peng et al., 2021c; Zhang et al., 2022; Zhao et al., 2022) (Liu et al., 2019). The promoting effect of industrial co-agglomeration on urban innovation decreased in Eastern, Central, and Western regions (Wang and Mu, 2020). However, different from the research conclusions of the above scholars on agglomeration and co-agglomeration, some scholars believed that in the initial period of industrial agglomeration, the crowding effect dominated and inhibited economic development (Sun et al., 2013). Other scholars agreed that the agglomeration of producer services has no obvious effect on regional innovation and that there is a nonlinear relationship between co-agglomeration and regional innovation capabilities. The manufacturing industry mainly promoted regional innovation through effective interaction with local human capital (Ni and Li, 2017; Sheng et al., 2019). Most previous studies focused on the industry, enterprise, and macro-regional levels; however, did not emphasize regional innovation efficiency. The research on the high-tech manufacturing industry is important for innovation-driven development. In the context of today’s domestic circular economy, the co-agglomeration effect of producer services and high-tech manufacturing should not be ignored. Therefore, the current study explored the action path of the two industries’ co-agglomeration on innovation efficiency. Moreover, we integrated the micro data of all enterprises to measure the innovation efficiency of the regions.
The article consists of several sections. Section 1 deals with the introduction. Section 2 describes the theoretical framework of the study and research hypotheses. Section 3 relates to research methods. Section 4 presents the results and discussion. Section 5 provides the main findings of the study with policy implications.
2 Theoretical Framework and Hypotheses
2.1 The Impact Mechanism
With the enhancement of the co-agglomeration relationship, the competition effect, cooperation effect, spillover effect, and learning effect gradually appeared and promoted enterprise innovation, and improved enterprise innovation efficiency (Xie and Wu, 2017).
2.1.1 Competitive Effects
The product market in agglomeration areas is very competitive (Chen and Hu, 2008). Due to the early completion of innovation, enterprises will break the original profit distribution pattern, putting the enterprises behind the R&D in a disadvantageous position or even facing a choice of survival. These enterprises will increase the enthusiasm of technical R&D personnel through the implementation of rewards and punishment. It improves the level and ultimately promotes the efficiency of enterprise innovation.
2.1.2 Cooperation Effect
It is often difficult for a single enterprise to maintain the supply of knowledge, and technology required for innovation. It is more inclined to seek cooperation with related enterprises to obtain new ideas or product technologies, and co-agglomeration of industries provides convenience for such cooperation. When companies in the industry know each other well enough, they have established a foundation of trust, which reduces the risk and uncertainty of cooperation and makes it easier to improve innovation efficiency (Xie and Wu, 2017).
2.1.3 Spillover Effect
By sharing R&D infrastructure, knowledge, and information service systems, the enterprises in the industrial co-agglomeration area are conducive to improving the utilization efficiency of software and hardware facilities in the region, producing a “1 + 1>2″ collaborative innovation effect, reducing production costs in the R&D process and saving technical consulting services between enterprises and other time to improve the fault tolerance rate in the innovation process.
2.1.4 Learning Effect
The learning effect is reflected in the exchange and cooperation of personnel and technology between enterprises, and co-agglomeration reduces the cost of such frequent contacts and provides a suitable environment. Alfred Marshall believes that synergistic gathering in the same space will promote more knowledge spillover. Enterprises themselves continue to accumulate experience and knowledge in the process of innovative products, and form an efficient conversion of knowledge and technology through the learning-by-doing effect, thus continuously spawning new research results.
An excessive co-agglomeration will lead to a shift from scale effect to crowding effect. When the scale of the industry is too large and exceeds the environmental economy and market load, the agglomeration area will experience environmental degradation, infrastructure shortages, and rising living costs. In addition, there will be vicious competition among enterprises to compete for resources, breaking the trust established before, and the “restriction effect” of cooperative R&D is strengthened (Li and You, 2018), and the imbalance of factor ratio leads to non-economics, and inhibiting innovation. The negative externality of industrial co-agglomeration is also reflected in the “path dependence effect”. The long-term development of enterprises in the low-end value chain will hinder the diffusion and transformation of technology, thereby inhibiting the efficiency of innovation.
It can be seen from the above analysis that industrial co-agglomeration can improve the efficiency of regional innovation. The industrial co-agglomeration in the region attracts a large number of related high-tech enterprises to enter, thereby reducing the search cost and communication cost of enterprises, and it is inevitable for enterprises to exchange and cooperate in the process. As an important part of regional innovation efficiency, enterprise innovation efficiency can more deeply analyze the ways that affect regional innovation efficiency, but excessive co-agglomeration will influence the opposite direction of innovation efficiency. Therefore, the co-agglomeration of producer services and high-tech manufacturing maybe has a nonlinear relationship. When the level of co-agglomeration is below a specific threshold, increasing the level of co-agglomeration will promote innovation efficiency, and when the level of industrial collaborative agglomeration exceeds this level. When a specific threshold is reached, innovation will be inhibited. Thus, the paper proposes the following assumptions on the impact of industrial co-agglomeration on innovation efficiency.
Hypothesis 1. Industrial co-agglomeration and regional innovation efficiency may exist in an “inverted U-shaped” relationship.
2.2 The Impact Mechanism of the Co-Agglomeration
There are certain differences in the industry characteristics and functional positioning of the sub-sectors of the producer service industry. Therefore, the externalities generated by the co-agglomeration of different types of producer services and high-tech manufacturing industries affect innovation efficiency, especially for innovation efficiency from the micro perspective of high-tech enterprises may produce different results. The co-agglomeration of transportation, warehousing, and postal industries and high-tech manufacturing is conducive to promoting the factors of mobility and reducing the search cost and time cost of enterprises, which may imply an increase in regional innovation efficiency (Lv and Yuan, 2020). The development of high-tech manufacturing and the R&D innovation of enterprises are much more dependent on capital than traditional industries, and the financial industry has functions such as risk management, supervision, and incentives. Therefore, the co-agglomeration of the financial industry and high-tech manufacturing is likely to a large extent. Promote the innovation of high-tech enterprises, thereby greatly improving the efficiency of regional innovation (Lv and Yuan, 2020). Both industries are more closely related to high-tech manufacturing. According to Wang et al. (2019), it is found that the degree of co-agglomeration and correlation between industries may have different effects on total factor productivity. Therefore, the given assumptions can be written as:
Hypothesis 2. Heterogeneous industries of producer services and co-agglomeration of high-tech manufacturing have a positive moderating effect on innovation efficiency, but the effects are different.In addition, the co-agglomeration of producer services and high-tech manufacturing requires certain social and economic conditions in the region and is affected by local policies and macroeconomic environment, and the three major urban agglomerations have differences in economic level, factor endowment, and resource allocation. It not only leads to differences in the level of co-agglomeration between sub-sectors of producer services and high-tech manufacturing but also may lead to differences in their impact on innovation efficiency. Since the reform and opening up, regional economic development has shown remarkable regional characteristics. From South to North, the three major urban agglomerations have successively become the new highlands of China’s economic growth. The three major urban agglomerations have attracted a large number of talented and skilled workers from underdeveloped areas to gather spontaneously due to their superior economic development environment, large development space, and high wage levels. Due to their proximity to ports, transportation costs and transaction costs are low, the business environment is convenient, it is easy to form resource agglomeration, and attract huge external incremental resources. The entry of high-quality foreign capital has stimulated regional industrial integration, and the growth rate of the high value-added tertiary industry, especially the modern service industry represented by the producer service industry has gradually surpassed the secondary industry. The demand for human capital and the gathering of industries and talents have further stimulated the improvement of the technological level of the three major urban agglomerations. However, of the differences between urban agglomerations, the Yangtze River Delta and Pearl River Delta urban agglomerations also contain a large number of high-tech enterprises and traditional manufacturing industries. Except for Beijing and Tianjin, Beijing, Tianjin, and Hebei have smaller industrial scales and are more affected by government policies (Liu, 2020). Therefore, we can write a hypothesis as:
Hypothesis 3. The co-agglomeration of two industries in different urban agglomerations may have different results on innovation efficiency.
3 Material and Methods
3.1 Source of Data Collection
From 2011 to 2019, the data of public companies were collected from the CSMAR database and WIND database of Guotaian. The record is derived from the ‘China Urban Statistical Yearbook’ and ‘China High-tech Industry Statistical Yearbook’. According to the data integrity and availability, the research period of this paper began in 2011, and the cities with serious data missing were excluded. Finally, 743 listed companies’ annual observations in 43 prefecture-level cities were obtained. The missing data were supplemented by mean interpolation.
3.2 Construction of Statistical Model and Definitions of Variables
3.2.1 Statistical Model
In the previous literature, it is found that the co-agglomeration level of producer services and high-tech manufacturing and regional innovation efficiency is not a simple linear relationship. When a variable reaches a certain value, it will show a nonlinear relationship. Therefore, this paper discusses when the two are related, the square term of the level of industrial co-agglomeration is added, and the following prefecture-level, city-level panel model is set to test the impact of the co-agglomeration of producer services and high-tech manufacturing on regional innovation efficiency:
where eff is amount to regional innovation efficiency, Coagg is the amount to the level of industrial co-agglomeration, and contr is the amount to other control variables, including enterprise age, financial leverage, enterprise scale, government subsidies, and corporate cash flow.
3.2.2 Definitions of Variables
According to a new economic growth theory, the accumulation of human capital can generate incremental returns, and increase the returns of other input factors, thereby increasing the total returns to scale. Therefore, the DEA-BCC model under the condition of variable returns to scale is selected to break through the constraints of a small feasible domain that is established, and the innovation efficiency eff is measured with the help of pure technical efficiency PTE. It should be paid attention to using the DEA-BCC method to measure innovation efficiency. It still needs the input and output indicators of enterprise innovation. The research results of Chen et al. (2012) and Liang et al. (2015) proved that listed companies did not disclose new products. For the sales revenue data, this paper selects the number of technical personnel and R&D expenses of listed companies in the region as input indicators to reflect the labor and capital input of innovation efficiency respectively and chooses the number of patent applications of listed companies in the region as the output indicator of innovation efficiency. Since the contribution of capital input to output is not only reflected in the current period, the capital stock of R&D funds is estimated by referring to the estimation formula of R&D capital stock (Wu, 2008).
where K represents the capital stock of R&D expenditures, E represents the price-adjusted R&D expenditures, and δ is the depreciation rate of the capital stock of R&D expenditures. The R&D capital stock is directly set at 15% based on the experience of previous papers. The capital stock of R&D expenditures in the base period is estimated using the following formula:
The initial year of estimation is extended to 2007, where g is the average growth rate of R&D expenditure.
3.2.2.1 Core Explanatory Variables
Following the study of Lv and Yuan (2020), the industrial synergy agglomeration exponent refers to the measurement method, and the synergy agglomeration exponent is constructed as follows:
where
3.2.2.2 Control Variables
Following Zhang et al. (2020b), we selected the control variables. The selected control variables included the age of the company (Age), expressed as the year of the current year - the year of the company’s listing +1; financial leverage (Fle), expressed as total liabilities and total assets. The scale of the enterprise (Scale), expressed in the total assets of the enterprise, and taking the natural logarithm; government subsidies (Gg), expressed in the total government subsidies to the enterprise, and taking the natural logarithm; enterprise cash flow (Cash), expressed as the ratio of net operating cash flow to total assets. The definitions of variables are given in Table 1.
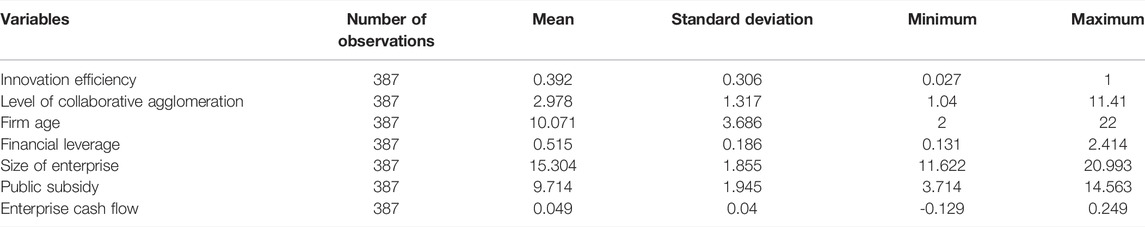
TABLE 1. Definitions and summary statistics of variables.
4 Results and Discussion
4.1 Summary Statistics of Variables
After eliminating the missing samples, all samples include 743 listed companies in 43 prefecture-level cities in 9 years of micro-data summation, which is a balanced panel (Table 1). Specifically, the average value of regional innovation efficiency is 0.392. The maximum value of the collaborative agglomeration level is 11.41, and the minimum value is 1.04. It shows that the degree of collaborative agglomeration and regional innovation efficiency of producer services and high-tech manufacturing industry between different cities are quite different. Enterprise maximum age is 22, and the minimum is 2. The maximum financial leverage is 2.414, indicating areas where leverage is high. The maximum value of government subsidies is 14.563, and the minimum value is 3.714, indicating that there are great differences in government support in different regions.
4.2 Regression Analysis of Overall Samples
To examines the stability of the estimated coefficients of the core explanatory variables and the control variables, the core explanatory variables, the control variables, and the square term of the core explanatory variables are gradually added to the regression equation. The results are given in Table 2. Statistical models 1 and 2 respectively, test the relationship between industrial collaborative agglomeration and regional innovation efficiency without introducing control variables. Statistical model 3 based on model 2, controls the region and year double fixed effect. Statistical model 4, based on model 1 at the same time added the level of collaborative agglomeration and its square term. Statistical model 5 is added to the control variables to examine the relationship between innovation efficiency and collaborative agglomeration level and its square term. Considering that the existence of missing variables or other uncontrollable factors may lead to deviations in the results, and the regression fitting degree of the double fixed effect model is better than that of the mixed regression, the regression estimation results of the statistical model (3) are mainly discussed below. The independent variables of panel data are tested by autocorrelation and multicollinearity test. The results show that there is no multicollinearity problem between variables, and the original assumption that there is no first-order autocorrelation is rejected.
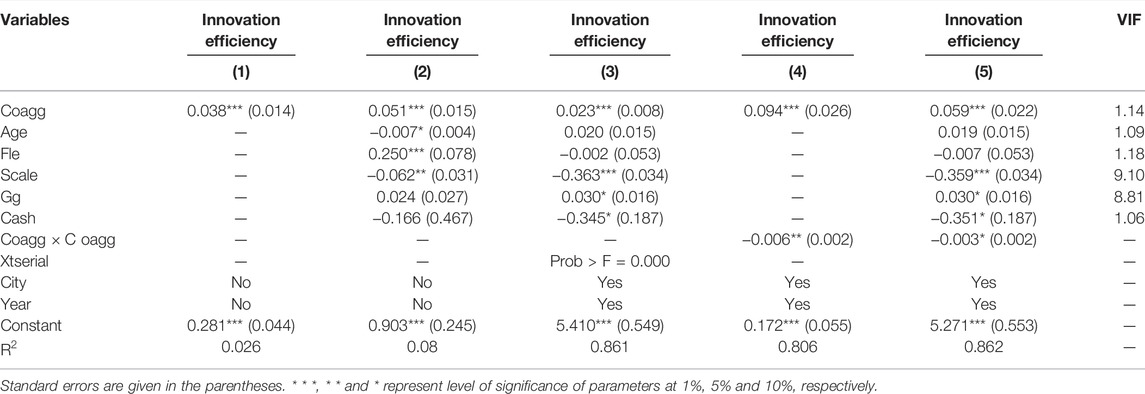
TABLE 2. Results of regression.
In terms of core explanatory variables, whether or not the control variables are added, the regional innovation efficiency coefficient is significantly positive. It means that the moderate co-agglomeration of the two industries will positively promote regional innovation efficiency. Through statistical model 4 and model 5, it is found that the coefficient of the Coagg square term is always negative. It indicates that the industrial co-agglomeration and regional innovation efficiency exist in an “inverted U-shaped” relationship, which supports the theoretical hypothesis of this paper. With the improvement of industrial collaborative agglomeration levels, the diffusion of knowledge and technology is accelerating. Compared with enterprises outside the collaborative agglomeration area, enterprises in the collaborative agglomeration area are more likely to achieve new technological breakthroughs through low-cost learning and resource sharing. However, the market and space are limited. When the degree of regional collaborative agglomeration exceeds the load capacity of the region, the scarcity of resources will lead to the rise of production factor prices, and directly increase the production cost and R & D cost of enterprises (Li and You, 2018). Moreover, the enterprises in a fixed distance long-term cooperative relationship, excessive dependence on knowledge in the collaborative agglomeration area, may lead to technological innovation throughout the region is locked in a relatively backward stage. Because the risk of imitation is far lower than independent R & D, enterprises will continue to reduce R & D investment to avoid uncertainty, thereby inhibiting the improvement of regional innovation efficiency. The results are according to Hypothesis 1.
In terms of the age control variable, the impact of enterprise age on innovation efficiency is positive. The estimation coefficient of financial leverage (Fle) is negative and not significant, debt is not a major role in affecting the efficiency of enterprise innovation. The reason for the negative coefficient is that when the enterprise is in debt operation, the high-interest burden will crowd out some of the profits accumulated by the enterprise, thus crowding out the innovation activities. Enterprise scale (Scale) is negatively correlated at the 5% level with the continuous expansion of scale. Therefore, they are unwilling to carry out innovation activities with high-risk coefficients, thereby inhibiting enterprise innovation. Government subsidies (Gg) will promote enterprise innovation. Enterprise cash flow (Cash) is negative at the level of 10%. It means higher cash flow will inhibit enterprise innovation (Meng et al., 2021). The possible reason is that when the enterprise has more funds, it may be biased towards short-term investment, thereby reducing long-term innovation investment (Zhang H. X. et al., 2020).
4.3 High and Low Levels of Collaborative Agglomeration
The levels of industrial co-agglomeration and regional innovation efficiency have an inverted U-shaped relationship. For further verification, this paper takes the average value of collaborative agglomeration water of 43 prefecture-level cities 2.98 as the boundary. We divided the three urban agglomerations into high collaborative agglomeration level areas and low collaborative agglomeration level areas and performed the regression analysis (Table 3). The given results in columns 1 and 3 show the impacts of regions with a high level of collaborative agglomeration and regions with a low level of collaborative agglomeration on innovation efficiency without introducing control variables, respectively. It is found that the regions with a high level of collaborative agglomeration and regions with a low level of collaborative agglomeration can promote innovation efficiency regardless of whether the control variables are added, and the promoting effect of the latter is stronger than that of the former. This depicts that with the improvement of the collaborative agglomeration level, its promotion trend of innovation efficiency tends to be flat and gradually reaches saturation. The comparison of columns 2 and 4 showed that the promotion of innovation efficiency in areas with high collaborative agglomeration levels is mainly due to higher financial leverage, namely debt management. Whether high collaborative agglomeration or low collaborative agglomeration, the expansion of enterprise scale inhibits the increase of innovation efficiency. The possible reason is that the three major urban agglomerations, as the core hinterland of China’s high-quality economic development, have better human, capital, and platform advantages, and have greater enthusiasm for R&D and innovation activities. With the continuous maturity of enterprises, the ability to cope with the market is gradually strengthened, and the competitive pressure is reduced. They are unwilling to carry out innovative activities with high-risk factors. Therefore, it will hinder the increase of real innovation efficiency.
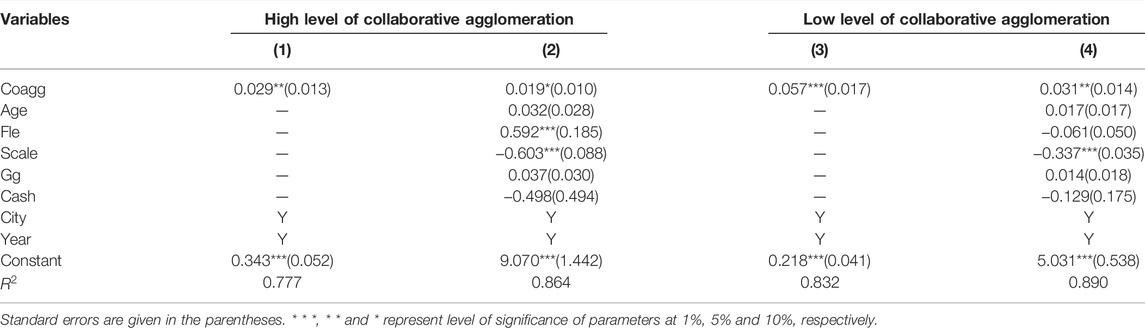
TABLE 3. High and low levels of collaborative agglomeration.
4.4 Heterogeneity Analysis
Taking the mean value of regional innovation efficiency as the abscissa, the mean value of collaborative agglomeration water as the ordinate, and the mean value of the two as the quadrant boundary point are given in Figure 1. The samples in the three urban agglomerations are divided into four types. Type A is low innovation efficiency with a low collaborative agglomeration level. Type B is the high innovation efficiency with a low collaborative agglomeration level. Type C is the high innovation efficiency with a high collaborative agglomeration level. Type D is the low innovation efficiency with a high collaborative agglomeration level. Overall, most cities are still at a low level of co-agglomeration, while cities in the same urban agglomeration have different types of regions, indicating the necessity of further studying the incidence of co-agglomeration on innovation efficiency of different cities. Shenzhen, Zhuhai, Foshan, and other Pearl River Delta cities, producer services, and high-tech manufacturing industries are developing rapidly, and a large number of innovative elements are gathered. A good innovation environment makes the level of co-agglomeration and innovation efficiency at the forefront.
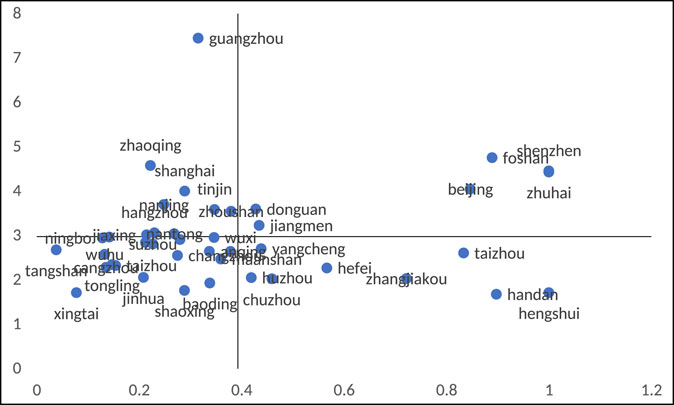
FIGURE 1. Scatter plot.
Similarly, Figure 2, Figure 3, Figure 4 show the relationship between industrial agglomeration and co-agglomeration in different regions.
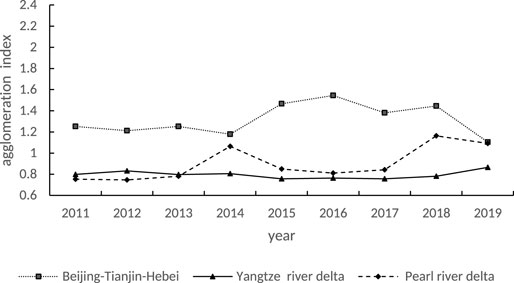
FIGURE 2. Agglomeration of producer services.
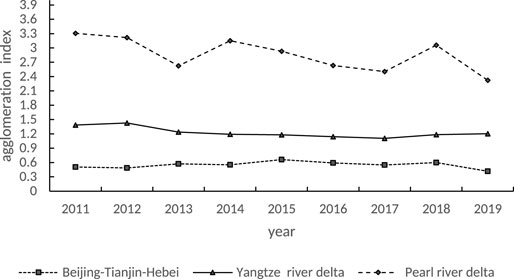
FIGURE 3. High-tech manufacturing agglomeration.
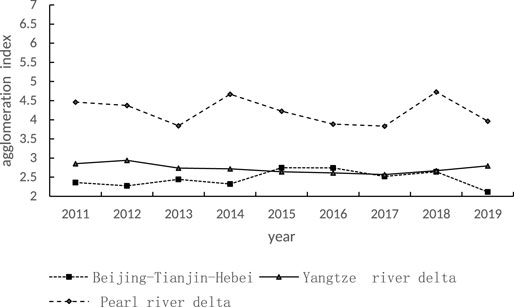
FIGURE 4. Collaborative agglomeration of two industries.
To further compares the internal differences between industrial co-agglomeration and regional innovation efficiency in coastal areas, the results of the regression are given in Table 4. The regression coefficient of industrial co-agglomeration on innovation efficiency in Beijing, Tianjin, and the Hebei region is not significant. The possible reason is that the level of co-agglomeration and innovation efficiency in Beijing and Tianjin are generally higher than those in other regions of Beijing, Tianjin, and Hebei, and have obvious comparative advantages. However, industrial collaborative agglomeration brings more competition for technology and innovation resources and has not yet formed a synergistic driving effect. The regression coefficient of innovation efficiency in the Yangtze River Delta region is significantly positive at the level of 1%. It is mainly due to government subsidies. Moreover, listed companies in the urban agglomeration need to reduce their cash flow and stop the expansion of scale to better promote regional innovation. The regression coefficient of innovation efficiency in the Pearl River Delta region is significantly positive at the level of 10%. However, due to the small sample size, the regression results of some variables may not be accurate, and there is no overstatement. By comparing the level of regional co-agglomeration, innovation efficiency, and the regression aboriginality between the two, it can be seen that the innovation efficiency of the three major urban agglomerations in Eastern China is generally improved. Compared with Shenzhen and Beijing, Shanghai’s innovation efficiency is slightly insufficient, which is the same as the previous research conclusion. The results confirmed Hypothesis 3.
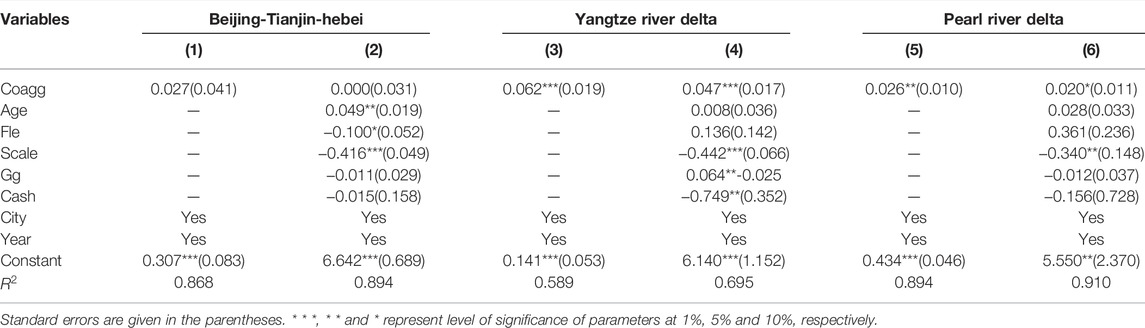
TABLE 4. Regression results of distinguishing regions.
To further compare the impact of co-agglomeration on regional innovation efficiency, we divided the co-agglomeration of producer services and the high-tech manufacturing industry into five types. Transportation, warehousing and postal industry and high-tech manufacturing industry collaborative agglomeration (Coaggjt), information transmission, computer services, and software industry and high-tech manufacturing industry collaborative agglomeration (Coaggxx), scientific research and technology services and high-tech manufacturing industry collaborative agglomeration (Coaggkx), financial industry and high-tech manufacturing industry collaborative agglomeration (Coaggjr) and leasing and business services and high-tech manufacturing industry collaborative agglomeration (Coaggzl), which are reported in Table 5. The results showed that the co-agglomeration of the financial industry, information transmission, computer services, and software industry, and high-tech manufacturing industry has the most prominent effect on improving regional innovation efficiency, while the co-agglomeration of transportation, warehousing, and postal industry and high-tech manufacturing industry has a relatively weak effect on regional innovation efficiency. The results satisfied Hypothesis 2.
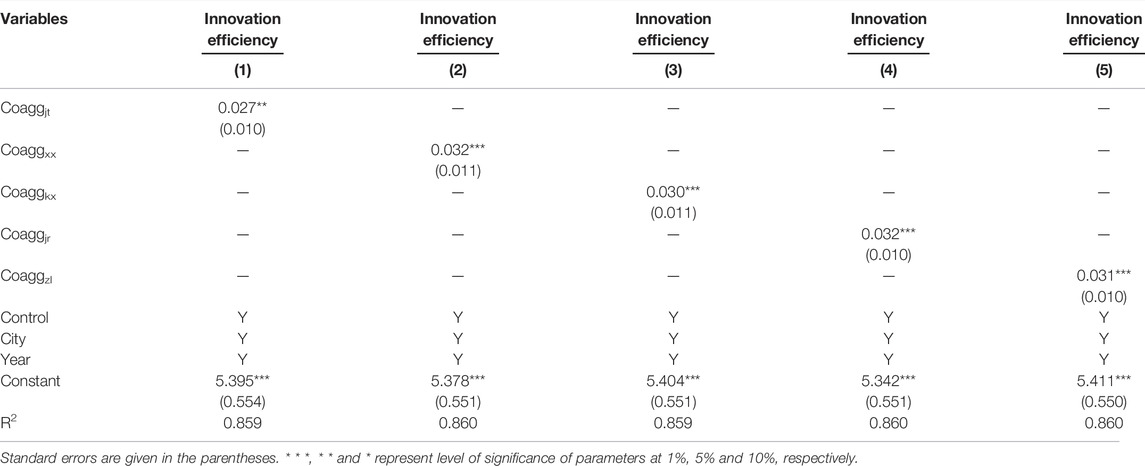
TABLE 5. Regression results of distinguishing industrial collaborative agglomeration types.
4.5 Robustness Test
4.5.1 The Measurement Method of Changing Innovation Efficiency
Following the Jiang et al. (2020), the ratio of natural logarithm LN
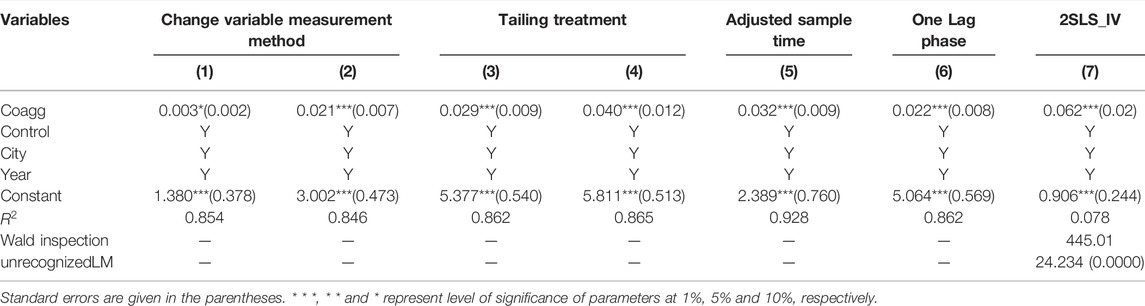
TABLE 6. Results of the robustness test.
4.5.2 Tailing Treatment
Take a 1% or 5% double-tailed test, particularly 1% or 5% is the double-tailed treatment of all relevant variables, eliminate the impact of some extreme values on the study, and re-examine the two-way fixed effect regression. According to the regression results, the coefficient of regional innovation efficiency is significantly positive at the level of 5% or 1%, which is consistent with the previous results (Table 6).
4.5.3 Adjustment in Sample Period for 2011–2016
At present, most of the literature based on the ' China High-tech Statistical Yearbook ' has been studied by provincial data until 2016, while the sample deadline selected in this paper is 2019, and some missing data are supplemented according to relevant research methods. To avoids interfering with the empirical results of the processed data, we adjusted the sample period to 2011–2016 and re-estimated it. The research conclusion is consistent with the above, and through the regression results, it is found that government subsidies have changed from non-significant to significant and the direction of the coefficient remained unchanged. The government started to pay attention to the financial support for local enterprises over time, and become one of the factors affecting the innovation efficiency of obviousness. However, it should be noted that reasonable policies and strict subsidy standards should be formulated to avoid the occurrence of non-benign rent-seeking and other situations that lead to the suppression of innovation. The results are given in Table 5.
4.5.4 One-Period Lag of Control Variables
In the previous literature, the impact of input is not all the current output is alleviated by the lag of R&D expenditure, but other control variables may also have potential endogenous problems. To check the robustness of the results, all other control variables are lagged for one period and tested by two-way fixed regression. The results remained unchanged (Table 6).
4.5.5 Endogenous Problems
The increase in innovation efficiency will reduce the production cost of the region. Through the strengthening of communication and cooperation, the factor flow between industries leads to the formation of the industrial association effect between upstream and downstream industries, and further promotes industrial collaborative agglomeration. At the same time, to reduce the cost of learning, transportation, and trading, it will be biased toward the location of the region. Although the two-way fixed effect can reduce the impact of missing variables to a certain extent when enterprises with high innovation ability move into areas with high collaborative agglomeration. To better alleviate the endogenous errors caused by two-way causality and missing variables, this paper adopts instrumental variables to further test. According to Ji and Gu (2020), the lag phase of the core explanatory variable is used as a tool variable to estimate the two-stage least squares method. The test results are shown in column 7 of Table 6. The estimated coefficient of the core explanatory variable is significantly positive at the level of 10%, and the Cragg-Donald Wald F statistic 445.01 is greater than the critical value at the level of 10%, which rejected the hypothesis of weak instrumental variables. The unidentifiable LM test p-value is 0.0000, which rejected the unidentifiable hypothesis. Therefore, the selection of instrumental variables is reasonable and effective.
5 Conclusion and Policy Implications
This paper uses the data of listed companies in the three major urban agglomerations from 2011 to 2019 to explore the impact of the co-agglomeration of producer services and high-tech manufacturing on innovation efficiency through two-way fixed panel model. The main findings of the study can summarize as:
1) Industrial co-agglomeration can encourage innovation efficiency through multiple effects, but excessive agglomeration may also inhibit innovation efficiency. The empirical results also test the “inverted U-shaped” relationship between collaborative agglomeration and innovation efficiency. It means strengthening co-agglomeration can promote innovation efficiency when the industrial co-agglomeration is at a relatively low level.
2) The promotion effect of industrial co-agglomeration on innovation efficiency is more obvious, especially for the regions with low-level of co-agglomeration. On the one hand, differentiated policies should be implemented in regions with different situations to encourage innovation through the level of co-agglomeration of the two industries. On the other hand, to guide enterprises in regions with higher collaborative agglomeration to develop into labor-intensive or capital-intensive regions with low technological content. The gap in innovation efficiency among the three major urban agglomerations has shown a narrowing process.
3) Most regions are divided into low-level industrial agglomeration types. Therefore, it is an important way for economic development to promote innovation efficiency in different regions by coordinating the development of heterogeneous related industries. For the Yangtze River Delta and Pearl River Delta Urban Agglomeration, there is a strong complementary effect between producer services and manufacturing. Although the Beijing, Tianjin, and Hebei urban agglomeration has a lot of human capital and material capital, the siphoning effect of important cities such as Beijing and Tianjin is stronger than its radiation effect. Therefore, industrial co-agglomeration has not yet become the main way to promote innovation. The results of industry heterogeneity showed that the co-agglomeration of the financial industry, information transmission, computer services, and software industry, and high-tech manufacturing industry in producer services has the strongest influence on city innovation efficiency. While the co-agglomeration of transportation, warehousing and postal industry and high-tech manufacturing industry has a relatively weak effect on regional innovation efficiency.
4) The results of the study stress that the states should encourage and adjust the level of collaborative agglomeration among regions through fiscal and taxation policies.
Data Availability Statement
The raw data supporting the conclusions of this article will be made available by the authors, without undue reservation.
Author Contributions
CP was responsible for the data collection and arrangement of relevant literature, data analysis, and article writing. PF and ZZ commented on the written article. EE revised the article. Moreover, FB and ZL also helped to collect data for the article.
Funding
The authors highly acknowledged the support of the Taishan Young Scholar Program (tsqn202103070), Taishan Scholar Foundation of Shandong Province, China.
Conflict of Interest
The authors declare that the research was conducted in the absence of any commercial or financial relationships that could be construed as a potential conflict of interest.
Publisher’s Note
All claims expressed in this article are solely those of the authors and do not necessarily represent those of their affiliated organizations, or those of the publisher, the editors and the reviewers. Any product that may be evaluated in this article, or claim that may be made by its manufacturer, is not guaranteed or endorsed by the publisher.
Acknowledgments
we are thankful for the technical guidance of the consultants (Mahmood Ahmad and Tawaf Ali Shah).
References
Amiti, M. (2001). Location of Vertically Linked Industries: Agglomeration versus Comparative Advantage. J. CEPR Discuss. Pap. 49 (4), 809–832. doi:10.1016/j.euroecorev.2002.12.001
Chen, J. J., and Hu, C. G. (2008). The Agglomeration Effect of Industrial Agglomeration-The Theoretical and Empirical Analysis of the Yangtze River Delta Subregion. Manag. world 6, 68–83.
Chen, K. H., Guan, J. C., and Kou, M. T. (2012). Research on the Crux and Countermeasures of China 's High-Tech Industry 's High Output and Low Efficiency ' -Exploration from the Perspective of Technological Innovation Efficiency. Manag. Rev. 24 (4), 53–66.
Dai, K. Z., and Liu, Y. J. (2016). Factor Market Distortions and Innovation Efficiency - Empirical Analysis of China 's High-Tech Industry Development. Econ. Res. 51 (7), 72–86.
Elahi, E., Khalid, Z., Tauni, M. Z., Zhang, H., and Lirong, X. (2021a). Extreme Weather Events Risk to Crop-Production and the Adaptation of Innovative Management Strategies to Mitigate the Risk: A Retrospective Survey of Rural Punjab, Pakistan. J. Technovation. 2021, 102255. doi:10.1016/j.technovation.2021.102255
Elahi, E., Khalid, Z., Weijun, C., and Zhang, H. (2020). The Public Policy of Agricultural Land Allotment to Agrarians and its Impact on Crop Productivity in Punjab Province of Pakistan. Land Use Policy. 90, 104324. doi:10.1016/j.landusepol.2019.104324
Elahi, E., Khalid, Z., and Zhang, Z. (2022). Understanding Farmers' Intention and Willingness to Install Renewable Energy Technology: A Solution to Reduce the Environmental Emissions of Agriculture. Appl. Energy. 309, 118459. doi:10.1016/j.apenergy.2021.118459
Elahi, E., Weijun, C., Jha, S. K., and Zhang, H. (2019a). Estimation of Realistic Renewable and Non-renewable Energy Use Targets for Livestock Production Systems Utilising an Artificial Neural Network Method: A Step towards Livestock Sustainability. J. Energy. 183, 191–204. doi:10.1016/j.energy.2019.06.084
Elahi, E., Weijun, C., Zhang, H., and Abid, M. (2019b). Use of Artificial Neural Networks to Rescue Agrochemical-Based Health Hazards: A Resource Optimisation Method for Cleaner Crop Production. J. Clean. Prod. 238, 117900. doi:10.1016/j.jclepro.2019.117900
Elahi, E., Weijun, C., Zhang, H., and Nazeer, M. (2019c). Agricultural Intensification and Damages to Human Health in Relation to Agrochemicals: Application of Artificial Intelligence. Land Use Policy 83, 461–474. doi:10.1016/j.landusepol.2019.02.023
Elahi, E., Zhang, H., Lirong, X., Khalid, Z., and Xu, H. (2021b). Understanding Cognitive and Socio-Psychological Factors Determining Farmers' Intentions to Use Improved Grassland: Implications of Land Use Policy for Sustainable Pasture Production. Land Use Policy 102, 105250. doi:10.1016/j.landusepol.2020.105250
Hua, J., Zhu, W. J., and Huang, Y. Y. (2021). The Impact of Collaborative Agglomeration of Manufacturing and Producer Services on Green Development Efficiency-Taking 27 Central Cities in the Yangtze River Delta Urban Agglomeration as an Example. Resour. industries 23 (2), 61–72.
Huang, Q., Peng, B., Elahi, E., and Wan, A. (2021). Evolution and Driving Mechanism of Ecological Security Pattern: A Case Study of Yangtze River Urban Agglomeration. Integr. Environ. Assess. Manag. 17, 573–583. doi:10.1002/ieam.4358
Ji, X. Y., and Gu, N. H. (2020). Does the Collaborative Agglomeration of Producer Services and Manufacturing Have an Innovation-Driven Effect. J. Shanxi Univ. Finance Econ. 42 (7), 57–70.
Jiang, J., Jiang, X. Y., and Yi, Z. H. (2020). Research on Enterprise Innovation Efficiency - from the Impact of Equity Pledge. Financial Res. 2, 128–146.
Li, S. S., and You, W. L. (2018). Can Industrial Agglomeration Promote Innovation in Manufacturing Enterprises? Financ. Stud. 4, 30–38. doi:10.3389/fenvs.2021.745465
Liang, T. Y., Lei, P., and Chen, X. D. (2015). Research on the Impact of Management Incentives on R & D Efficiency -Empirical Evidence from Chinese Industrial Listed Companies. J. Manag. Rev. 27 5, 145–156.
Liu, S. A. (2020). The Growth and Regional Differences of Green Total Factor Productivity in the Three Major Urban Agglomerations. Soc. Sci. front. 7, 259–265.
Liu, S., Li, W. X., and Chen, X. Y. (2019). The Impact of Collaborative Agglomeration of Producer Services and Manufacturing on Enterprise Innovation. J. Guangdong Univ. Finance Econ. 34 (3), 43–53. doi:10.2991/aebmr.k.200306.029
Lv, P., and Yuan, Y. M. (2020). Industrial Agglomeration, Technological Innovation and High-Quality Economic Development -Empirical Analysis Based on Producer Services and High-Tech Manufacturing. Financial theory Pract. 41 (6), 118–125.
Meng, W. J., Lin, G., and Liu, M. W. (2021). The Impact of Collaborative Agglomeration of Science and Technology Service Industry and High-Tech Manufacturing Industry on Innovation Efficiency. J. West. Forum. 31 (3), 82–96.
Ni, J. F., and Li, H. (2017). Industrial Agglomeration, Human Capital and Regional Innovation-An Empirical Study Based on Heterogeneous Industrial Agglomeration and Collaborative Agglomeration. J. Explor. Econ. problems. 12, 156–162. doi:10.3390/ijerph182212097
Peng, B., Chen, H., Elahi, E., and Wei, G. (2020a). Study on the Spatial Differentiation of Environmental Governance Performance of Yangtze River Urban Agglomeration in Jiangsu Province of China. Land Use Policy. 99, 105063. doi:10.1016/j.landusepol.2020.105063
Peng, B., Huang, Q., Elahi, E., and Wei, G. (2019a). Ecological Environment Vulnerability and Driving Force of Yangtze River Urban Agglomeration. Sustainability. 11, 6623. doi:10.3390/su11236623
Peng, B., Li, Y., Elahi, E., and Wei, G. (2019b). Dynamic Evolution of Ecological Carrying Capacity Based on the Ecological Footprint Theory: A Case Study of Jiangsu Province. Ecol. Indic. 99, 19–26. doi:10.1016/j.ecolind.2018.12.009
Peng, B., Wang, Y., Zahid, S., Wei, G., and Elahi, E. (2020b). Platform Ecological Circle for Cold Chain Logistics Enterprises: the Value Co-creation Analysis. J. Industrial Manag. Data Syst. 120, 675–691. doi:10.1108/IMDS-10-2019-0531
Peng, B., Yan, W., Elahi, E., and Wan, A. (2021a). Does the Green Credit Policy Affect the Scale of Corporate Debt Financing? Evidence from Listed Companies in Heavy Pollution Industries in China. Environ. Sci. Pollut. Res. 29, 755–767. doi:10.1007/s11356-021-15587-7
Peng, B., Zhang, X., Elahi, E., and Wan, A. (2021b). Evolution of Spatial–Temporal Characteristics and Financial Development as an Influencing Factor of Green Ecology. J. Environ. Dev. Sustain. 24, 789–809. doi:10.1007/s10668-021-01469-y
Peng, B., Zhao, Y., Elahi, E., and Wan, A. (2021c). Does the Business Environment Improve the Competitiveness of Start‐ups? the Moderating Effect of Cross‐border Ability and the Mediating Effect of Entrepreneurship. J. Corp. Soc. Responsib. Environ. Manag. doi:10.1002/csr.2262
Peng, B., Zhao, Y., Elahi, E., and Wan, A. (2021d). Investment in Environmental Protection, Green Innovation, and Solid Waste Governance Capacity: Empirical Evidence Based on Panel Data from China. J. J. Environ. Plan. Manag. 2021, 1–24. doi:10.1080/09640568.2021.2017866
Peng, B., Zheng, C., Wei, G., and Elahi, E. (2020c). The Cultivation Mechanism of Green Technology Innovation in Manufacturing Industry: From the Perspective of Ecological Niche. J. Clean. Prod. 252, 119711. doi:10.1016/j.jclepro.2019.119711
Shen, D., Xia, M., Zhang, Q., Zhou, E. Y., Zhou, Y., and Zhang, H. (2019). The Impact of Public Appeals on the Performance of Environmental Governance in China: A Perspective of Provincial Panel Data. J. Clean. Prod. 231, 290–296. doi:10.1016/j.jclepro.2019.05.089
Sheng, X., Peng, B., Elahi, E., and Wei, G. (2019). Regional Convergence of Energy-Environmental Efficiency: from the Perspective of Environmental Constraints. Environ. Sci. Pollut. Res. 26, 25467–25475. doi:10.1007/s11356-019-05749-z
Sun, P. Y., Han, S. A., and Xu, Q. Q. (2013). The Dynamic Impact of Industrial Agglomeration on Labor Productivity. J. World Econ. 36 (3), 33–53.
Tu, Y., Peng, B., Elahi, E., and Wu, W. (2020). Initiator or Intermediary? A Case Study on Network Relation of Environmental Regulatory Capture in China. Ijerph 17, 9152. doi:10.3390/ijerph17249152
Tu, Y., Peng, B., Wei, G., Elahi, E., and Yu, T. (2019). Regional Environmental Regulation Efficiency: Spatiotemporal Characteristics and Influencing Factors. Environ. Sci. Pollut. Res. 26, 37152–37161. doi:10.1007/s11356-019-06837-w
Wang, F., Cai, W., and Elahi, E. (2021). Do Green Finance and Environmental Regulation Play a Crucial Role in the Reduction of CO2 Emissions? an Empirical Analysis of 126 Chinese Cities. Sustainability. 13, 13014. doi:10.3390/su132313014
Wang, Y. J., and Mu, A. Y. (2020). The Promotion Effect of Industrial Collaborative Agglomeration on Urban Scientific and Technological Innovation -Based on Multi-Dimensional Empirical Research. J. Hebei Univ. Econ. Trade 41 (5), 78–86.
Wang, Y., Peng, B., Wei, G., and Elahi, E. (2019). Comprehensive Evaluation and Spatial Difference Analysis of Regional Ecological Carrying Capacity: A Case Study of the Yangtze River Urban Agglomeration. Ijerph 16, 3499. doi:10.3390/ijerph16183499
Wang, Y., and Sun, C. (2020). Research on the Impact of Industrial Synergy Agglomeration on Green Total Factor Productivity -Based on the Perspective of Synergy between High-Tech Industries and Producer Services. Econ. Vert. Horiz. 3, 67–77.
Weterings, A., and Boschma, R. (2009). Does Spatial Proximity to Customers Matter for Innovative Performance? Res. Policy 38 (5), 746–755. doi:10.1016/j.respol.2008.12.011
Wu, B., Peng, B., Wei, W., and Ehsan, E. (2021). A Comparative Analysis on the International Discourse Power Evaluation of Global Climate Governance. Environ. Dev. Sustain 23, 12505–12526. doi:10.1007/s10668-020-01180-4
Xie, Z. Y., and Wu, L. J. (2017). Industrial Agglomeration Level and Innovation Efficiency of Chinese Industrial Enterprises - an Empirical Study Based on Panel Data of 20 Industrial Sectors from 2000 to 2012. Sci. Res. Manag. 38 (1), 91–99.
Yang, R. F., and Bao, J. M. (2019). Can Producer Services Agglomeration Effectively Promote Urban Innovation. Mod. Econ. 4, 80–87.
Zhang, H., Sun, Z., Elahi, E., and Zhang, Y. (2021). Internet Development, Level of Industrial Synergy, and Urban Innovation. Sustainability. 13, 12410. doi:10.3390/su132212410
Zhang, H. X., Lu, C., and Wang, D. (2020a). Emission Trading Policy, Rent-Seeking and Enterprise Innovation Efficiency -based on the Micro-data Test of Listed Companies with Different Ownerships in China. Ind. Econ. Rev. 19 (3), 119–142.
Zhang, H., Yang, J., Ren, X., Wu, Q., Zhou, D., and Elahi, E. (2020b). How to Accommodate Curtailed Wind Power: A Comparative Analysis between the US, Germany, India and China. Energy Strategy Rev. 32, 100538. doi:10.1016/j.esr.2020.100538
Zhang, L., Mou, R. Y., and Hu, S. H. (2019). The Impact of Specialization and Diversification Agglomeration on Manufacturing Innovation Efficiency. China Sci. Technol. Forum 1, 57–65. doi:10.3390/su13073809
Zhang, Z., Li, Y., Elahi, E., and Wang, Y. (2022). Comprehensive Evaluation of Agricultural Modernization Levels. Sustainability. 14, 1–17. doi:10.3390/su14095069
Zhao, H., Zhao, X., Elahi, E., and Wang, F. (2022). Policy Evaluation of Drama-Related Intangible Cultural Heritage Tourism for Boosting Green Industry: An Empirical Analysis Based on Quasi-Natural Experiment. Sustainability. 14, 5380. doi:10.3390/su14095380
Zhao, X., Peng, B., Elahi, E., Zheng, C., and Wan, A. (2020). Optimization of Chinese Coal-Fired Power Plants for Cleaner Production Using Bayesian Network. J. Clean. Prod. 273, 122837. doi:10.1016/j.jclepro.2020.122837
Zhao, Y., Peng, B., Elahi, E., and Wan, A. (2021). Does the Extended Producer Responsibility System Promote the Green Technological Innovation of Enterprises? an Empirical Study Based on the Difference-In-Differences Model. J. Clean. Prod. 319, 128631. doi:10.1016/j.jclepro.2021.128631
Zheng, C., Peng, B., Elahi, E., and Wan, A. (2020). Strategies of Haze Risk Reduction Using the Tripartite Game Model. Complexity 2020, 1–11. doi:10.1155/2020/6474363
Zhong, Z., Peng, B., and Elahi, E. (2021). Spatial and Temporal Pattern Evolution and Influencing Factors of Energy-Environmental Efficiency: A Case Study of Yangtze River Urban Agglomeration in China. Energy & Environ. 32, 242–261. doi:10.1177/0958305x20923114
Keywords: industrial agglomeration, innovation efficiency, service industry, Yangtze river, China
Citation: Peng C, Elahi E, Fan B and Li Z (2022) Effect of High-Tech Manufacturing Co-Agglomeration and Producer Service Industry on Regional Innovation Efficiency. Front. Environ. Sci. 10:942057. doi: 10.3389/fenvs.2022.942057
Received: 12 May 2022; Accepted: 31 May 2022;
Published: 17 June 2022.
Edited by:
Muhlis Can, BETA Akademi-SSR Lab, TurkeyReviewed by:
İhsan Oluç, Mehmet Akif Ersoy University, TurkeyXinru Han, Institute of Agricultural Economics and Development (CAAS), China
Copyright © 2022 Peng, Elahi, Fan and Li. This is an open-access article distributed under the terms of the Creative Commons Attribution License (CC BY). The use, distribution or reproduction in other forums is permitted, provided the original author(s) and the copyright owner(s) are credited and that the original publication in this journal is cited, in accordance with accepted academic practice. No use, distribution or reproduction is permitted which does not comply with these terms.
*Correspondence: Ehsan Elahi, ZWhzYW5lbGFoaUBudWlzdC5lZHUuY24=