 Santiago Madrigal-Martínez
 Rodrigo J. Puga-Calderón1†
95% of researchers rate our articles as excellent or good
Learn more about the work of our research integrity team to safeguard the quality of each article we publish.
Find out more
ORIGINAL RESEARCH article
Front. Environ. Sci. , 12 July 2022
Sec. Land Use Dynamics
Volume 10 - 2022 | https://doi.org/10.3389/fenvs.2022.941887
This article is part of the Research Topic Solutions to High-Quality Development: Theories and Practices in Ecological Aspects View all 21 articles
Glaciers supply multiple ecosystem services that are threatened by climate change. The retreat and disappearance of tropical glaciers is an important dynamic that affects ecosystems and local communities. The knowledge of the impacts of this land-change dynamics on the supply of ecosystem services is lacking. In that sense, the assessment developed can provide evidence about the costs and benefits of promoting conservation and human well-being at the same time. Then, the main objective of this research is to determine the spatial–temporal changes and their effects on the economic value of ecosystem services in a glacial retreat environment. We selected the Marangani district as a study area. It comprises the La Raya Mountain range in the Andes. The assessments were carried out across two scales of observation: the municipality and the watershed level. Here, we process spectral information from Landsat Sensor using the Random Forest algorithm in the Google Earth Engine platform to classify 10 biomes. It was carried out over more than 30 years (from 1986 to 2019). After that, ecosystem services provided by the biomes were valued using the transfer method. This research shows that at the municipality level, almost all the LULCs faced variations over time, and the glaciers had the highest change, accumulating a ratio of –85.51%, whereas at the watershed level, a higher tendency of land changes is observed in the areas without glaciers, and those with glacier areas count on permanent larger bofedales. At the municipality level, the economic value of ecosystems shows that bofedales and water surfaces are the LULCs that supply the highest ecosystem services (∼33,000 USD ha−1 yr−1 each). In addition, without the inflation adjustment, the total ESV is on a trajectory of losing ESV (–$9.67 × 10⁶). In the watersheds with glacier retreat, significant quantity of bofedales and natural grasslands controls the fluctuations of ESV. These high-mountain watersheds play an essential role in providing benefits and value to local communities. In general, the municipality level indicates the trajectory of changes in the district, whereas the watershed scale shows the urgency for implementing spatial conservation actions.
Glaciers are retreating and disappearing worldwide (Marzeion et al., 2014; Zemp et al., 2015), and these processes have been accelerated globally in the early 21st century (Hugonnet et al., 2021). The causes are attributed to a combination of several factors related to anthropogenic and biophysical dynamics (Marzeion et al., 2014; Veettil and Kamp, 2019). Concretely, in the case of mountain glaciers, albedo reduction, increasing temperatures, and changing precipitation are drivers that may have a significant relation to glacier retreat and mass balance changes (Crossman et al., 2013; Tang et al., 2013; Zhang et al., 2021). However, the glacier recession pattern is more complex at higher elevations of the Andes because it is likely to be related to other components of the energy balance as net radiation and ground heat fluxes (Juřicová and Fratianni, 2018). These causes may have produced a fast retreating of Andean glaciers (Dussaillant et al., 2019; Hock et al., 2019). The mountain range of La Raya (the study area), situated northwest of the Peruvian high plateau, shows an ice area decrease from 11.27 km2 estimated from aerial photos of 1962 (Hidrandina, 1989) to 1.90 km2 assessed from Sentinel images of 2016 (INAIGEM, 2018).
Glaciers supply multiple ecosystem services (ESS), mostly related to the provision, regulation, and maintenance of water (Cook et al., 2021). Then, the disappearance of glaciers will alter hydrological regimes in downstream systems (Milner et al., 2017), which will have consequences on water management, food and energy security, and environmental management (Rasul and Molden, 2019). However, rapid melting of glaciers has a temporary rise in streamflow (Mark and Mckenzie, 2007; Mark et al., 2009), which added to the increase in precipitation can hide the impact downstream. Moreover, concerning biodiversity, responses of ecosystems are diverse and depend on internal species attributes, local environment, and external drivers of change (Cauvy-Fraunié and Dangles, 2019). In that sense, glaciers in the high-Andean mountain ranges can be associated with sensitive ecosystems such as bofedales (peat bogs and wetlands). The studies of the effects of glacier retreats on bofedales indicate a positive relation (Dangles et al., 2017; Polk et al., 2017), but the knowledge of impacts on the ESS is limited. Then, the prolonged disappearance of glaciers is a land-cover change that already has uncertain costs for ecosystem function and services to human well-being.
Land cover and land use (LULC) change has gained prominence as the main cause of degradation and change in ecosystems worldwide (Brandt and Townsend, 2006; Yin et al., 2011; Ektvedt et al., 2012; Kuemmerle et al., 2016; Quintero-Gallego et al., 2018; Madrigal-Martínez and Miralles i García, 2019b). LULC changes are the results of a combination of socio-economic, environmental, and political factors (Lambin et al., 2003). In the mountain environments, these changes are often caused by biophysical factors, land abandonment, deforestation, agricultural expansion, and urbanization to a lesser extent (Madrigal-Martínez and Miralles i García, 2019a; Msofe et al., 2019; Jiménez-Olivencia et al., 2021). Then, mapping the spatiotemporal transitions of LULC is fundamental to identifying landscape patterns for planning sustainable ESS (Luck et al., 2012; Chaudhary et al., 2017; Egarter Vigl et al., 2017; Madrigal-Martínez and Miralles i García, 2019a).
Mapping the spatiotemporal changes of LULC has been undertaken in several studies using different methodological approaches, but with the growing use of remote sensing and geographic information system (GIS) tools (Lu et al., 2004). In the same way, different types of multisource satellite images and classification methods have been used, but among all, Random Forest (RF) is a supervised classifier algorithm broadly used that performs well (Gislason et al., 2006). These change detection techniques provide a flexible environment for rapidly developing image classification and analyzing for changes, maintaining a satisfactory level of accuracy over the area being classified. In this context, LULC maps can provide a high capacity for identifying and explaining the supply of individual ecosystem services (Burkhard et al., 2009; Koschke et al., 2012).
Knowing the value of ESS is recognized as an essential pathway to sustainability (Abson et al., 2014). Per se, a suitable assessment is needed to improve policy and decision-making linked to management of the territory (Ling et al., 2018; Dang et al., 2021; Selivanov and Hlaváčková, 2021). Thus, such assessments can provide evidence about the costs and benefits of promoting conservation and human well-being at the same time (de Groot et al., 2010). The monetary value of ecosystem services (ESV) from a global to local scale is being established to accomplish this goal (Costanza et al., 1997; Groot et al., 2010; Costanza et al., 2014; de Groot et al., 2020; Foundation for Sustainable Development, 2021). The benefit transfer method has the highest worldwide usage frequency for determining the ESV (Schägner et al., 2013). Its main improvement is that it offers a relatively quick and low-cost estimation. However, to our knowledge, studies on spatiotemporal changes of ESV related to tropical glacier retreat environments have not been conducted.
Therefore, our study maps and evaluates the LULC change and associated ESV across the Marangani district for more than 3 decades (1987–2019). We performed the assessments across two scales of observation: the municipality and the watershed level, considering at least two spatial scales which should assure robustness (Scholes et al., 2013; Felipe-Lucia et al., 2014; Madrigal-Martínez and García, 2020). Based on spectral information from Landsat Sensor using the RF algorithm, we select this district of the higher elevations of the Andes because it is part of the mountain range of La Raya–an environment where glaciers are shrinking rapidly (INAIGEM, 2018). The results of this study provide answers to the following questions: 1) which spatiotemporal changes on LULC in a territory are under the influence of glacier retreat? 2) which spatiotemporal changes and relationships between glaciers and bofedales are at the watershed level? 3) how do these changes affect the monetary value of ecosystem services? Then, we discuss the reasons for the main spatiotemporal and ESV changes and their implications for the socio-ecosystem.
The selected area is the district of Marangani (Canchis, Cusco), comprised within the Raya Mountain range (Figure 1). It is the third most populated district of Canchis, and the population at the end of 2017 was 10,554 (National Institute of Statistics and Informatics, 2022). It covers an area of 440.32 km2, comprising 29 watersheds that range from 70 to 0.5 km2 with an average of 15 km2. This landscape is dominated by an expansion of livestock breeding in the upper lands and farming in the fertile lowlands. It is typical of many mountain agroecosystems across the world. In that sense, Marangani has natural grasslands, sparsely vegetated areas, glaciers upstream, bofedales in the mid-stream, and agricultural land in the downstream reaches. The most important river is Vilcanota. The district has a semi-frigid rainy season with a dry winter climate (58%). Almost 47.63% of the population mainly works in the agricultural sector (National Institute of Statistics and Informatics, 2022), characterized by annual crops such as alfalfa, bean, potato, and wheat (National Institute of Statistics and Informatics, 2012). The natural pastures present in the territory make an optimal fodder for camelids, sheep, and cattle.
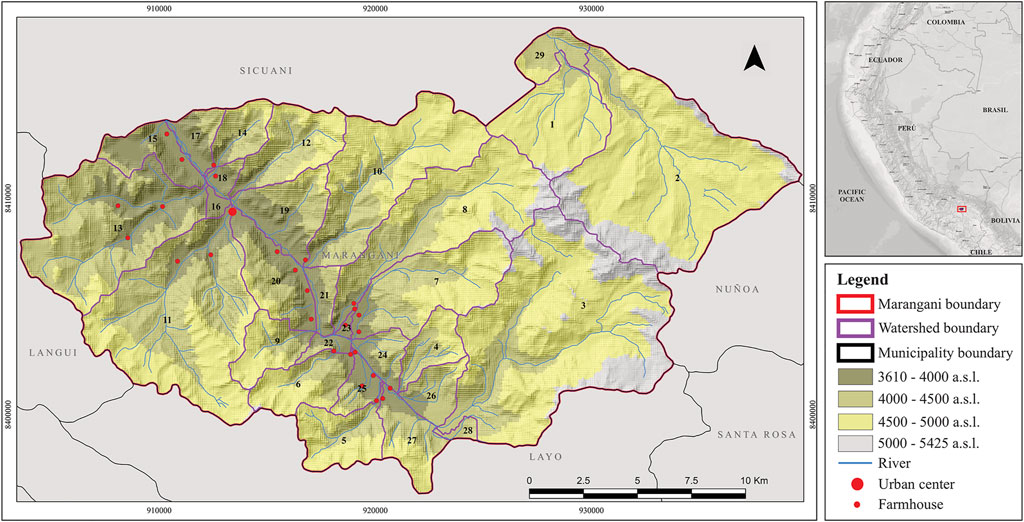
FIGURE 1. Study area with elevation and watershed distribution (left), Peru with ESRI′ Standard map (top right). Watersheds: 1. Tañihua stream; 2. Aucara river; 3. Cantacanta river; 4. Chuabamba stream; 5. Tadiohuayco stream; 6. Llallahui stream; 7. Quiscamayo stream; 8. Quecjra river; 9. Lorocachi stream; 10. Cuyo stream; 11. Casuira river; 12. Cayco stream; 13. Comayacu stream; 14. Ccatunhuasi stream; 15. Intercuenca 1; 16. Inter-watershed 2; 17. Inter-watershed 3; 18. Inter-watershed 4; 19. Inter-watershed 5; 20. Inter-watershed 6; 21. Inter-watershed 7; 22. Inter-watershed 8; 23. Inter-watershed 9; 24. Inter-watershed 10; 25. Inter-watershed 11; 26. Inter-watershed 12; 27. Inter-watershed 13; 28. Inter-watershed 14; 29. Inter-watershed 15.
This research used two types of data and information (primary and secondary information). The primary datasets are free and available on the Google Earth Engine (GEE) platform. The data acquisition was conducted during the dry season (July and August). It allowed cloud-free images. The selected years of the study were based on the period that evidenced the reduction of glaciers in Cordillera La Raya, around a decade, and in low-rainfall months. Four specific images from two Landsat Series were used (Table 1).
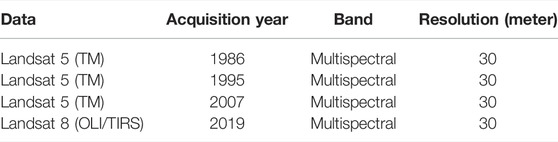
TABLE 1. Landsat series Surface Reflectance data in each year.
We used sort filtering functions about cloud cover for the select years in GEE. This function allows acquiring smooth continuous coverage of the scene without clouds. In our study case, the software gets the first (least cloudy) scene during the month in the dry season and nearby dates.
The primary dataset used was the atmospherically corrected Tier 1 TOA reflectance Landsat imagery. Landsat 5 was used for the first 3 years, while Landsat 8 in 2019. Operating at a spatial resolution of 30 m from both, we used 11 bands (six bands referring to the satellite, three bands made from the indices, and two topographic information bands).
The secondary data for this research were gathered from the Peru official flora cover map from 2013 (Ministry of Environment, 2015a) and its report (Ministry of Environment, 2015b). This map was used and referred together in training and testing samples with the primary data. The shape files of the study area were obtained publicly from the online server of the Ministry of Environment.
LULC units were delimited using the RF classifier within the GEE platform. We used 100 trees in the ensemble to improve the accuracy of the pixel-based supervised classification. For generating reference data (based on GEE, and Peru official flora cover map), a sampling of training and testing points—between 7 and 76—were selected of the composite images to identify the ten LULC classes (Table 2) for 1986, 1995, 2007, and 2019 as feature collection using the geometry tools and import. To obtain acceptable visual and statistical results, the script was repeatedly run. Also, the input images were divided into ten homogenous regions or segments (10 km × 10 km) and then classified using them. Ten GEE Code Editor scripts were used for each image to avoid confusion and assist in processing time (the links to access the script are presented in Supplementary Table S1). This methodology allows improving the calculation of RF in each grid and facilitates the analysis of the coverage generated. However, some biases may exist since the selection was completed manually based on the available references. The typology of the LULC classes was adopted from the Peruvian standardized nomenclature of the Corine Land Cover (CLC).
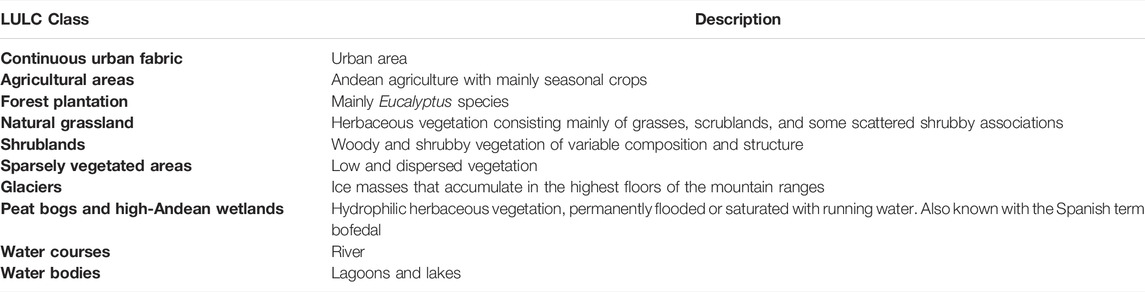
TABLE 2. Description of LULC classes used in the study.
Different spectral indices were derived and added as the input parameters for training. The Normalized Difference Vegetation Index (NDVI) was used as an indicator of vegetation greenness. Then, the Modified Normalized Difference Water Index (MNDWI), a modified version of the Normalized Difference Water Index, facilitated the recognition of open water bodies by removing various noises of built-up areas, soil, and vegetation. The third index, the Normalized Difference Built-up Index (NDBI), was used to detect built-up areas.
Topographic information such as slope and elevation, derived from the SRTM (Farr et al., 2007), was also used in the classification.
Confusion matrices were used for accuracy assessment. The producer accuracy (PA), user accuracy (UA), overall accuracy (OA), and Kappa statistics (Kappa) were calculated using the previously collected samples that were scripted to be randomly segregated by 70:30 percent for training and testing, respectively. The four indexes were obtained from the confusion matrix (Supplementary Table S2). The UA showed the highest accuracy (100%) for glaciers during the 4 years, whereas the lowest values (50% in some grids) were for the urban class between 1986 and 1995. Forest plantations and river courses showed low accuracy (50 and 56%, respectively) in 2007 and 2019 in some grids. Similarly, PA revealed 96% for the glacier class, and 20% and 43% (in some grids) for built-up areas. Also, a similar performance can be seen in the forest plantations and the river courses classes for the years 2007 and 2019, respectively. It is due to the small area of these classes that results in rarer training and testing samples. On the contrary, the three larger extent classes (natural grasslands, sparsely vegetated areas, and wetlands) obtained values of UA and PA that averaged above 80% over the 4 years. The Kappa coefficients (0.87–0.89) were considered almost in perfect agreement. The OA indicated that 89–91% of data were correctly classified.
Land-use change analyses were conducted at the municipality and watershed levels. We used the Watershed tool to delimitate watershed boundaries (Arc Map, 2022). The study calculated the LULC changes over 33 years (1986–2019) through a transition matrix obtained after using ArcGIS 10.5 (ESRI, 2019). The matrices were established for three-time periods (including 1986–1995, 1995–2007, and 2007–2019). Each transition matrix gathered the quantity of land converted from each LULC unit to any other in the study periods. Land-use changes of interest for this research were related to bofedales and glaciers as fragile ecosystems. These variations were further calculated, obtaining the intensity as the proportion of area increased and decreased at the watershed level. This index gave a relative measure of the land-use change. It was ranked in five equal intervals representing the intensity of expansion/contraction of each chosen class at the watershed level. Complementarily, the land of bofedales and glaciers remaining in each period was classified with Jenks’s natural breaks. Furthermore, we performed Pearson’s correlation (r) to assess the pairwise relations (land decreasing, increasing, and remaining) among the two classes for the three periods, using R (R Development Core Team, 2016).
To estimate the ESV, we used the benefit transfer method, transferring available data from previous studies in various locations and from different ecosystems globally that have similitudes with the biomes of the study area. The search was carried out on the ESV database (Foundation for Sustainable Development, 2021) and published research (Costanza et al., 2014; Xie et al., 2017; de Groot et al., 2020) for 38 ecosystem services and ten biomes. After the search, only values for 23 ecosystem services were found. According to Costanza et al., (1997), the ESV coefficient (unit values in USD ha−1 yr−1) of a given LULC was counted as all the ESV for that LULC. To achieve the total ecosystem service value of each LULC at the municipality and the watershed level, we multiply the area of each LULC type at the corresponding level by the ESV coefficient. Finally, the ESV coefficients were adjusted using the Consumer Price Index (CPI) obtained from the website of the World Bank (2022) and applying the inflation rate formula (Table 3).
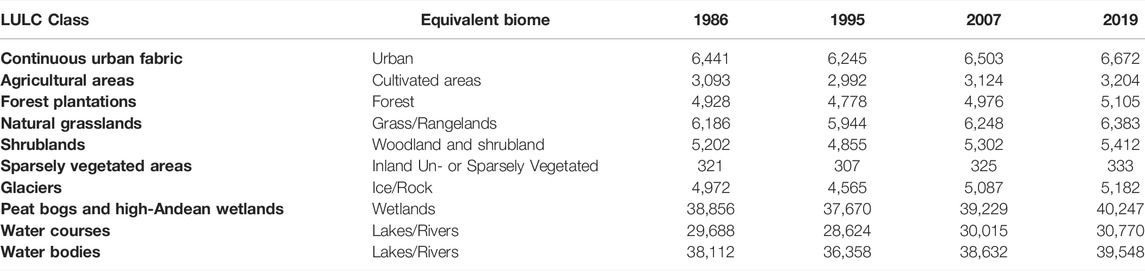
TABLE 3. Different LULC types and ESV coefficient (USD ha−1 yr−1) adjusted by using the CPI in the Marangani district.
The spatiotemporal distribution of LULC of the Marangani district among the study years revealed some variations (Figure 2). The precise area of each LULC is shown in Table 4. Natural grasslands coincided with being the most abundant class each year, spatially dispersed covering more than 65% of the landscape. Sparsely vegetated areas delimited more than 15% of the landscape over time. This LULC is spatially associated with glaciers in the highland. The third LULC type was peat bogs and high-Andean wetlands (bofedales) with an average of 8%, mainly located in the upland depressions. Agricultural areas (>4%) were evident in the lowland valley around the main river (Vilcanota river) related to the urban center, the farmhouses, and even topography. However, shrublands mainly drew a transitional zone in the lowland that separated agriculture from the natural grassland. Last, built-up areas, forest plantations, and water surfaces enclosed less than 1% of the territory.

FIGURE 2. Maps of the spatial distribution of LULC for Marangani municipality over the 4 years.
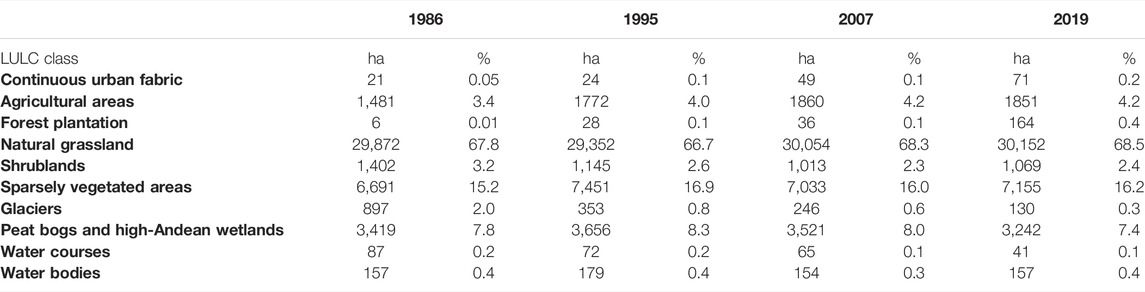
TABLE 4. Area of the different LULC classes for the 4 years.
The details of LULC changes for 1986–1995, 1995–2007, and 2007–2019 are presented in the transition matrices (Supplementary Tables S3–S5). In terms of the total area, 4,217 ha (9.6%), 3,999 ha (9.1%), and 3,914 ha (9%) were transformed in each period, respectively. Two transitions (>2,900 ha) involved the deterioration and the recovery of natural grasslands and bofedales during each period. A third important transition was related to glacier retreat, being more intense during the first period (543 ha). Another significant land-use change over time (strongest during the first period, >300 ha) refers to agricultural expansion, which implicated the conversion of natural grasslands, bofedales, and shrublands. Last, the farming land abandonment represented an increase in shrublands, mainly shown during the third period (>200 ha).
The LULC changes over time (Table 4) demonstrated some trajectories at the municipality level. Two classes (natural grasslands and water bodies) show low variability that indicates almost no disturbances, whereas water courses display no clear variations. Four LULC uncovers consistent patterns of increase influenced by humans at works dynamics (agriculture, urbanization, and afforestation) and glacier retreat (sparsely vegetated areas). In contrast, three classes (among them the fragile ecosystems like the bofedal and the glacier) have decreased due to the conversion into grazing and farming lands (for shrublands and bofedales) and the effects of climate change (for glaciers).
The intensity of glacier retreat at the watershed level is evidenced in each period (Figure 3A). No glacier advances are observable. During the first period, a high average decrease intensity is registered (60.65%), whereas it is moderate (average of 12.43%) for the others.
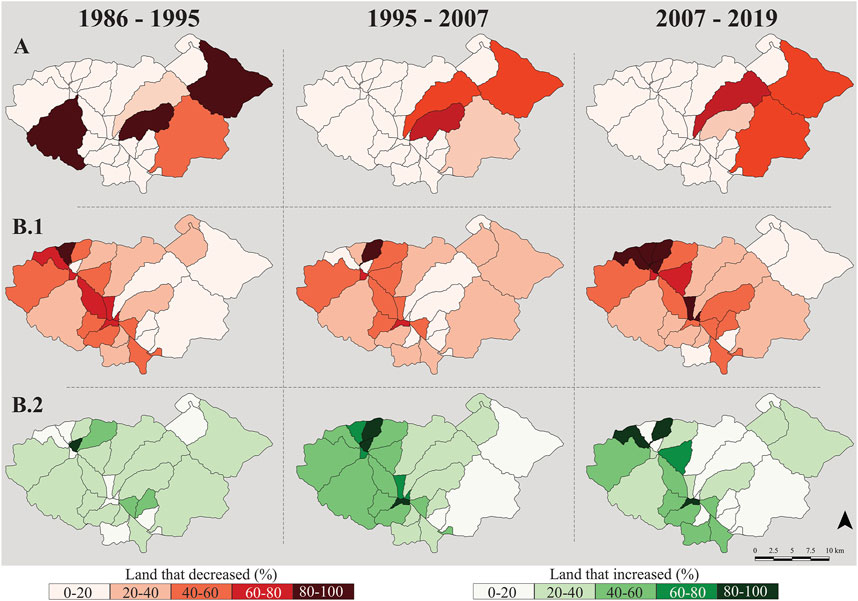
FIGURE 3. Land decrease intensity of the glaciers (A) and the land decrease/increase intensity of the bofedales (B.1,B.2) at the watershed level in the Marangani district over the three periods.
Figure 3B illustrates the intensity of land increase and decrease for bofedales in each period. The spatial distribution shows a higher tendency of land changes at the watersheds without glaciers. It may be possible because the glaciers provide a water flow that stabilizes the fluctuations (appearance balance) of the bofedales. In that sense, the watersheds with glacier areas count on permanent larger bofedales (Supplementary Figure S1).
At the watershed level, the relationships among the two fragile LULC changed over time (Supplementary Table S6). In terms of both the type of relationship and its strength, glaciers’ decrease over time is negatively related to bofedales decreasing, whereas bofedal increase showed a positive correlation (for the first period) and negative during the other periods, but nonsignificant for all the relationships. Bofedal increase showed a consistent and significant negative relationship with bofedal decrease in the first period but varied from a significant positive correlation coefficient of 0.51 in the second period to a nonsignificant coefficient of 0.21 in the final period. The relationship among the areas of both classes remaining over time is significant and positive.
The search of 38 ecosystem service values for the ten study area biomes resulted in 23 ESVs found (Supplementary Table S7). The values (Supplementary Table S8) focused on provisioning (5), regulating (12), and cultural services (6) that are classified in the MEA (Millennium Ecosystem Assessment, 2005). This last group of services provides the highest total economic value (74,260.98 USD ha−1 yr−1), mainly due to the value of recreation (57,248.23 USD ha−1 yr−1), while regulating and provisioning afford lower values (35,356.34 and 33,124.41 USD ha−1 yr−1), being the value of regulation of extreme events and the provision of habitat for wildlife species (9,634.75 and 18,444.80 USD ha−1 yr−1) those who contribute most in each category. Bofedales and water surfaces are the LULCs that supply the highest ESV (∼33,000 USD ha−1 yr−1 each), mainly because of the value of the habitat for wildlife species, erosion prevention, regulation of extreme events, and recreation. However, human-related areas retain values that range between 3,211.69 and 6,687.02 USD ha−1 yr−1 due to the provision of food production, recreation, and air quality regulation.
The total ESV at the municipality level shifted from $344.85 × 10⁶ in 1986 to $346.51 × 10⁶ in 2019 (Table 5). Practically, there is a slightly positive change (+$1.66 × 10⁶), but it is observed that without the inflation adjustment, the district is on a trajectory of losing ESV (−$9.67 × 10⁶). It is mainly due to the decrease in the area of glaciers and bofedales. The bofedal is one of the main classes supplying ESV (from $132.85 × 10⁶ in 1986 to $125.97 × 10⁶ in 2019), although the value of glaciers is lower ($4.46 × 10⁶ in 1986), and its conversion to bared areas signifies a substantial decrease of $3.67 × 10⁶ in 2019. However, the highest supply of ESV corresponds to natural grasslands (attributed to its high extension), although its value is rather constant, resulting only in an increase of 1% (+$1.73 × 10⁶) during the study period. Furthermore, agricultural areas and forest plantations increased the ESV from 4.58 × 10⁶ to 5.72 × 10⁶ and 0.03 × 10⁶ to 0.81 × 10⁶, respectively. These escalations are not enough to achieve a positive overall rate at the municipality level.
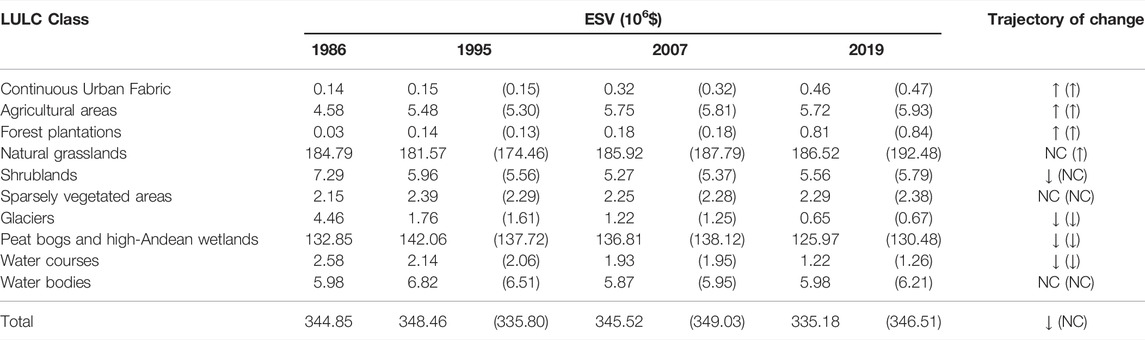
TABLE 5. ESV of each LULC at the municipality level between 1986 and 2019 and the overall trajectory of change. The values in parentheses represent the adjustment by the inflation. Top arrow for the increase and down arrow for decrease. NC = no change. Trajectories in parentheses include values from inflation adjustment.
The supply of ESV changed (decreased and increased) during the study period at the watershed level (Figure 4). The extreme changes in the economic value of the ecosystem services of the watersheds in the study area are mainly caused by considerable increase or decrease of the bofedales. For example, between 1986 and 1995, a severe ESV reduction in watersheds 16, 23, and 28 was observed. It is mainly due to the conversion of bofedales into agricultural areas. Similarly, it occurs in the comparison of the period 2007–2019. On the contrary, land abandonment facilitates the increase of bofedales between 1995 and 2007, showing better valuation. The watersheds with glaciers (numbers 2, 3, 7, and 8) did not experience a severe change in ESV. Although the glacial retreat is probed, the loss of ESV is neutralized by the considerable proportions of bofedales and high Andean grasslands. The slight variation of these biophysical structures produces a low ESV variability through the years.
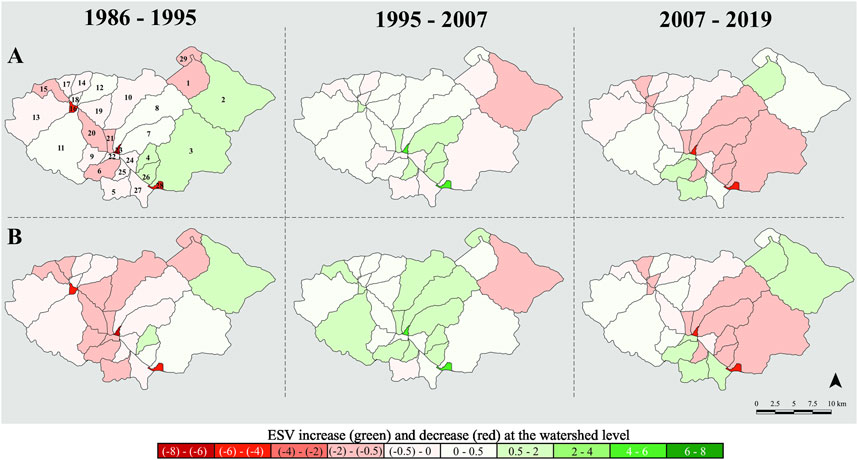
FIGURE 4. Spatial distribution of ESV increase and decrease (A) and adjusted by the inflation (B) at the watershed level in the Marangani district over the three periods (ESV units in 103$).
At the municipality level, almost all the LULCs faced variations over the study period of 33 years (Table 4). It should be noted that glaciers—as fragile ecosystems perturbed by climate change—had the highest change (accumulated ratio of −85.51%), which agreed with studies in the Himalayas (e.g., −23.8% and −35%, Rai et al., 2018; Shrestha et al., 2019). However, Andean glaciers seem to be under critical conditions that accelerate their disappearance (Juřicová and Fratianni, 2018; Vicente-Serrano et al., 2018). In the Marangani district, this situation reached its peak between the first period (1986–1995, ratio of −60.65%). It can be explained by the very strong ENSO warm events between 1987 and 1992 (Gergis and Fowler, 2009), which are related to the annual glacier mass balance (Wagnon et al., 2001). Consequently, the current ice loss in the study area signifies a variability of water availability on downstream socio-ecosystems that may impact agricultural irrigation of permanent crops and human-domestic use. In that sense, the cropland and the bofedales have shown a moderate increasing trend over the first period that may be driven by the increase of the population (National Institute of Statistics and Informatics) and the water supply from glaciers, respectively, while for the second and third periods, agricultural frontier expansion showed a deceleration influenced by a decrease in the population. This decline overlaps with the displacement by domestic terrorism in the second period (Transfer Commission, 2014) and internal migration by work opportunities in the third (Bergmann et al., 2021). However, existing farmland abandonment is very low, but if this land-change dynamic continues, it can lead to risks associated with land degradation (Narendra Raj and Teiji, 2006). Furthermore, during the last two periods, the bofedales faced a reduction coexisting with a decline of the melting of glaciers, causing augmentation of natural grassland, sparsely vegetated areas, and the conversion by humans at work activities as agricultural land and forest plantation.
At the watershed level, the study observes a higher tendency of land changes in the territory without glaciers, and those with glacier areas count on permanent larger bofedales. Then, glaciers provide a water flow that stabilizes the fluctuations (appearance balance) of the bofedales. This biome is considered sensitive to changes in extreme rainfall and glacial meltwater supply (Dangles et al., 2017). The main reason is that perennial bofedales are connected to the hydrological cycle through runoff generated by melting glaciers, while temporal wetlands depend directly on precipitation (Otto et al., 2011). It suggests that the total disappearance of the glaciers in the study area would cause the main water supply contribution by snow melting and rainfall. In this case, the mountain depositional landforms—glacial rocks immersed in the biome of the sparsely vegetated area—will constitute effective water distribution and storage. This function has an operation in the short and intermediate-term (Reato et al., 2021). It may cause a predominance of temporal bofedales. This condition could have a possible variation in the benefits provided by ecosystem services in the same biome for the different compositions of species. In general, temporal bofedales (mainly species of the Poaceae family) provide food for raising animals and wildlife during the flood season, whereas perennial bofedales (mainly cushion-forming species) accumulate organic soil, forage, and water storage also in the dry season (Cooper et al., 2010; Ruthsatz, 2012). In this last service, the hydrological importance enables change in the water flow paths and discharge velocity (Otto et al., 2011). In addition, perennial wetlands provide vital habitats for wildlife and extensive grazing of camelids (Loza Herrera et al., 2015; Dangles et al., 2017).
For the first time, the results presented here (Table 5) calculated the spatiotemporal changes of ESV in an environment of tropical glacier retreat. Concretely, the territory is on a trajectory of losing ESV appreciated in the scenario without inflation adjustment. This degradation is mainly due to reduction of provisioning and regulating services provided by the bofedales and the glaciers. The disappearance of these services not only has implications for a direct economic loss but also, in the case of the reduction of the flood protection provided by the glaciers, can pose the risk of dangerous glacial outburst floods on downstream communities that may lead to catastrophic economic damages (Chen et al., 2022). At the same time, the disappearance of bofedales endangers the regulation of extreme events that can increase these impacts. Likewise, the augmentation of water erosion, induced by the decline of bofedales, may affect negatively food security and natural resource management practices, principally in the poorest societies (Sartori et al., 2019), such as the study area. In the same way, the drop in water supply amplified by the reduction of both fragile ecosystems may affect livestock production, irrigated agriculture, availability and quality of water for human consumption, and generation of hydroelectricity (Carey et al., 2016), increasing the economic losses in the territory. Biophysical processes and human activities are the highest threats and causes of this situation. The ESV supplied by the human-related classes is in a crescendo, whereas the natural and semi-natural classes are losing their capital. This may result in a critical situation since the growth of provisioning services provided by agricultural development is at the expense of regulating services like water flow regulation and erosion prevention. This trajectory of ecosystem services is characteristic in mountain environments (Locatelli et al., 2017; Madrigal-Martínez and Miralles i García, 2019a).
At the watershed level, the variation of ESV is mainly influenced by the changes of bofedales into farming and grasslands. These changes harm the value of regulation services. However, the value of provisioning services like habitat for wildlife species, genetic libraries, livestock production, and raw materials increased due to expansion of pastures. In general, the economic value of these provisioning services could be underestimated by the global sources researched by Costanza et al. (2014) because the principal cattle in the study area are llamas, alpacas, and vicuñas (National Institute of Statistics and Informatics, 2012). These two last species are considered of great interest for their finest fibers worldwide and are used for luxury costumes (Vilá and Arzamendia, 2020; Zarrin et al., 2020). In the same way, the production of meat from llamas and alpacas has interesting value for their use as a principal protein source for Andean rural communities (Pérez et al., 2000); and their healthy characteristics (low in fat and cholesterol) make them attractive for local and international markets, signifying an important income for small- and medium-scale local producers (Mamani-Linares and Gallo, 2014). Moreover, llamas have smaller and simpler nanobodies beneficial for human immunology and therapeutic applications (Wesolowski et al., 2009). Furthermore, although the density of alpacas in the study area is high (123 alpacas km−2), according to the levels established in other locations (Muñoz et al., 2015), biodiversity conservation is guaranteed with appropriate management practices (Alkemade et al., 2013).
In the watersheds with glacier retreat, the significant quantity of bofedales and natural grasslands controls the fluctuations of ESV. It is a consequence of the extension of grasslands that varies between 48 and 72.2% and the bofedales between 5.5 and 12%. Then, these watersheds still have an advantage from the water flow of glaciers and supply multiple provisioning and regulating services such as water yield, habitat for wildlife species, food production, carbon sequestration, erosion control, soil fertility, and regulation of extreme events. Therefore, these high-mountain watersheds play an essential role as hotspots of ecosystem services, giving benefits and value to local communities. The identification of ES hotspots guides the prioritization of areas for conservation (Li et al., 2017). In that sense, ES hotspot maps have potential benefits that can be transmitted to stakeholders to improve management planning (Hauck et al., 2013). Also, the implication of knowing this information provides a scientific basis for making relevant decisions in a territory (Li et al., 2022). Consequently, these ES hotspot watersheds should get the priority of being strategically managed for maintaining their essential ecosystems. So, understanding the relationship between nature and people in mountain socio-ecological systems is significant for planning sustainable development strategies (Madrigal-Martínez and Miralles i García, 2019b; Payne et al., 2020), including conservation strategies at different spatial levels, such as prioritizing the small wetlands of these watersheds, according to Otto and Gibbons (2017).
In this study, the analyses presented should be understood as using the best existing data of acceptable quality to admit robust evidence. Even so, the procedures used in processing satellite images may have a situation of some biome coverage. It is mainly related to four factors: 1) the definition of biome classes, 2) reliability of Landsat images with their limitations of the sensor used, 3) auxiliary variables in the classification, and 4) validated data and no clarity of training (Calderón-Loor et al., 2021). The selection of the training points was based on the national vegetation coverage map (Ministry of Environment, 2015b). Also, to best interpret the satellite image, the authors made an expert judgment. In that sense, subjectivity at the decision point regarding the pixel classification could cause statistical noise in the training and validation data. However, this noise in the final categorization could have a low effect on the final product (Zhu et al., 2016). In addition, the research applied the transfer method of benefits for valuation ecosystem services. Despite the benefits, it has several limitations that imply transfer errors from generalization (Schmidt et al., 2016). However, it has been taken into account that the extrapolation of the valuation is in similar geographies.
This research develops for the first time a study about the land-use changes and their implications on the economic value of ecosystem services under the influence of glacier retreat in a tropical mountain environment. Also, our research has provided a procedure using satellite images that obtains a robust classification as a base for the estimation of ESV, which can be applied to other areas and contexts. The research utilizes two scales of observation, the municipality and the watershed level, for 33 years. In that sense, the analysis uncovered consistent differences that define the results depending on the scale. In general, the municipality level indicates the trajectory of changes in the district, while the watershed scale shows the urgency for implementing 1) measures to moderate the severe impacts on the landscape or 2) management actions for improving the spatial conservation of ecosystems. At the municipality level, the territory suffers trade-offs mainly in the supply of regulating services, declining the total monetary value. At the watershed level, the trade-offs are more evident in the areas without glaciers, and an economic balance over time is maintained in the landscapes with glaciers.
Bofedales and glaciers are fragile ecosystems that play an essential role in supplying regulating and provisioning services benefiting the socio-ecosystem. However, these ecosystems are being impacted over time, gathering a loss of ESV. Biophysical dynamics are diminishing glaciers and, in a lesser measurement, the bofedales, while for the latter, the increase of human activity is also a threat, mostly causing the trade-off between provisioning services and regulating services such as water flow regulation and erosion prevention. It is worth noting that during the study period, the glaciers were continuously shrinking, and their spatial–temporal changes had direct implications on the increase of bare land. However, they still have positive effects on downstream ecosystems such as bofedales but negative on the total economic value due to the reduction of their capability to supply water-related services. In addition, future studies should focus on a much more exhaustive LULC classification to improve the results reached in this research. It means including perennial and temporary bofedales and open and close natural grasslands. Likewise, knowing how spatiotemporal changes affect the quality and amount of ESS in this type of environment is an important issue. Last, the relationship between the trajectories of glaciers, bofedales, and ESV needs to be researched deeply, incorporating similar scenarios to find more robust spatial–temporal patterns.
The original contributions presented in the study are included in the article/Supplementary Material; further inquiries can be directed to the corresponding author.
Conceptualization, SM-M and RP-C; methodology, SM-M and RP-C; software, RP-C; validation, SM-M, VB and OV; formal analysis, SM-M; investigation, SM-M; resources, SM-M; data curation, SM-M; writing—original draft preparation, SM-M and RP-C; writing—review and editing, SM-M and RP-C; visualization, SM-M; supervision, SM-M, VB; funding acquisition, VB and OV. All authors have read and agreed to the published version of the manuscript.
This research was funded by Instituto Nacional de Investigación en Glaciares y Ecosistemas de Montaña (INAIGEM).
The authors declare that the research was conducted in the absence of any commercial or financial relationships that could be construed as a potential conflict of interest.
All claims expressed in this article are solely those of the authors and do not necessarily represent those of their affiliated organizations, or those of the publisher, the editors, and the reviewers. Any product that may be evaluated in this article, or claim that may be made by its manufacturer, is not guaranteed or endorsed by the publisher.
The Supplementary Material for this article can be found online at: https://www.frontiersin.org/articles/10.3389/fenvs.2022.941887/full#supplementary-material
Abson, D. J., von Wehrden, H., Baumgärtner, S., Fischer, J., Hanspach, J., Härdtle, W., et al. (2014). Ecosystem Services as a Boundary Object for Sustainability. Ecol. Econ. 103, 29–37. doi:10.1016/j.ecolecon.2014.04.012
Alkemade, R., Reid, R. S., van den Berg, M., de Leeuw, J., and Jeuken, M. (2013). Assessing the Impacts of Livestock Production on Biodiversity in Rangeland Ecosystems. Proc. Natl. Acad. Sci. U.S.A. 110, 20900–20905. doi:10.1073/PNAS.1011013108
ArcMap (2022). ArcMap 10.8 How Watershed Works. Documentation. Available at: https://desktop.arcgis.com/en/arcmap/latest/tools/spatial-analyst-toolbox/how-watershed-works.htm (Accessed February 24, 2022).
Bergmann, J., Vinke, K., Fernández Palomino, C. A., Gornott, C., Gleixner, S., Laudien, R., et al. (2021). Assessing the Evidence: Climate Change and Migration in Peru. Potsdam Institute for Climate Impact Research (PIK) and International Organization for Migration (IOM): Geneva.
Brandt, J. S., and Townsend, P. A. (2006). Land Use - Land Cover Conversion, Regeneration and Degradation in the High Elevation Bolivian Andes. Landsc. Ecol. 21, 607–623. doi:10.1007/s10980-005-4120-z
Burkhard, B., Kroll, F., Müller, F., and Windhorst, W. (2009). Landscapes' Capacities to Provide Ecosystem Services - A Concept for Land-Cover Based Assessments. Landsc. Online 15, 1–22. doi:10.3097/LO.200915
Calderón-Loor, M., Hadjikakou, M., and Bryan, B. A. (2021). High-resolution Wall-To-Wall Land-Cover Mapping and Land Change Assessment for Australia from 1985 to 2015. Remote Sens. Environ. 252, 112148. doi:10.1016/j.rse.2020.112148
Carey, M., Molden, O. C., Rasmussen, M. B., Jackson, M., Nolin, A. W., and Mark, B. G. (2016). Impacts of Glacier Recession and Declining Meltwater on Mountain Societies. Ann. Am. Assoc. Geogr. 107, 350–359. doi:10.1080/24694452.2016.1243039
Cauvy-Fraunié, S., and Dangles, O. (2019). A Global Synthesis of Biodiversity Responses to Glacier Retreat. Nat. Ecol. Evol. 3, 1675–1685. doi:10.1038/s41559-019-1042-8
Chaudhary, S., Tshering, D., Phuntsho, T., Uddin, K., Shakya, B., and Chettri, N. (2017). Impact of Land Cover Change on a Mountain Ecosystem and its Services: Case Study from the Phobjikha Valley, Bhutan. Ecosyst. Health Sustain. 3, 1393314. doi:10.1080/20964129.2017.1393314
Chen, H., Zhao, J., Liang, Q., Maharjan, S. B., and Joshi, S. P. (2022). Assessing the Potential Impact of Glacial Lake Outburst Floods on Individual Objects Using a High-Performance Hydrodynamic Model and Open-Source Data. Sci. Total Environ. 806, 151289. doi:10.1016/J.SCITOTENV.2021.151289
Cook, D., Malinauskaite, L., Davíðsdóttir, B., and Ögmundardóttir, H. (2021). Co-production Processes Underpinning the Ecosystem Services of Glaciers and Adaptive Management in the Era of Climate Change. Ecosyst. Serv. 50, 101342. doi:10.1016/j.ecoser.2021.101342
Cooper, D. J., Wolf, E. C., Colson, C., Vering, W., Granda, A., and Meyer, M. (2010). Alpine Peatlands of the Andes, Cajamarca, Peru. Arct. Antarct. Alp. Res. 42, 19–33. doi:10.1657/1938-4246-42.1.19
Costanza, R., d'Arge, R., de Groot, R., Farber, S., Grasso, M., Hannon, B., et al. (1997). The Value of the World's Ecosystem Services and Natural Capital. nature 387, 253–260. doi:10.1038/387253a0
Costanza, R., de Groot, R., Sutton, P., van der Ploeg, S., Anderson, S. J., Kubiszewski, I., et al. (2014). Changes in the Global Value of Ecosystem Services. Glob. Environ. Change 26, 152–158. doi:10.1016/J.GLOENVCHA.2014.04.002
Crossman, J., Futter, M. N., and Whitehead, P. G. (2013). The Significance of Shifts in Precipitation Patterns: Modelling the Impacts of Climate Change and Glacier Retreat on Extreme Flood Events in Denali National Park, Alaska. PLOS ONE 8, e74054. doi:10.1371/JOURNAL.PONE.0074054
Dang, A. N., Jackson, B. M., Benavidez, R., and Tomscha, S. A. (2021). Review of Ecosystem Service Assessments: Pathways for Policy Integration in Southeast Asia. Ecosyst. Serv. 49, 101266. doi:10.1016/J.ECOSER.2021.101266
Dangles, O., Rabatel, A., Kraemer, M., Zeballos, G., Soruco, A., Jacobsen, D., et al. (2017). Ecosystem Sentinels for Climate Change? Evidence of Wetland Cover Changes over the Last 30 Years in the Tropical Andes. PLoS ONE 12, e0175814. doi:10.1371/journal.pone.0175814
de Groot, R. S., Alkemade, R., Braat, L., Hein, L., and Willemen, L. (2010). Challenges in Integrating the Concept of Ecosystem Services and Values in Landscape Planning, Management and Decision Making. Ecol. Complex. 7, 260–272. doi:10.1016/j.ecocom.2009.10.006
de Groot, R., Brander, L., Solomonides, S., McVittie, A., Eppink, F., Sposato, M., et al. (2020). Ecosystem Services Valuation Database (ESVD) Update of Global Ecosystem Service Valuation Data. Available at: https://www.es-partnership.org/wp-content/uploads/2020/08/ESVD_Global-Update-FINAL-Report-June-2020.pdf (Accessed March 8, 2022).
Dussaillant, I., Berthier, E., Brun, F., Masiokas, M., Hugonnet, R., Favier, V., et al. (2019). Two Decades of Glacier Mass Loss along the Andes. Nat. Geosci. 12, 802–808. doi:10.1038/s41561-019-0432-5
Egarter Vigl, L., Tasser, E., Schirpke, U., and Tappeiner, U. (2017). Using Land Use/land Cover Trajectories to Uncover Ecosystem Service Patterns across the Alps. Reg. Environ. Change 17, 2237–2250. doi:10.1007/s10113-017-1132-6
Ektvedt, T. M., Vetaas, O. R., and Lundberg, A. (2012). Land-cover Changes during the Past 50 Years in the Semi-arid Tropical Forest Region of Northern peru. Erdkunde 66, 57–75. doi:10.3112/erdkunde.2012.01.05
ESRI (2019). ArcGIS Desktop: Release 10.5. Redlands CA: Environmental Systems Research Institute. doi:10.1209/epl/i2001-00551-4
Farr, T. G., Rosen, P. A., Caro, E., Crippen, R., Duren, R., Hensley, S., et al. (2007). The Shuttle Radar Topography Mission. Rev. Geophys. 45, 2004. doi:10.1029/2005RG000183
Felipe-Lucia, M. R., Comín, F. A., and Bennett, E. M. (2014). Interactions Among Ecosystem Services across Land Uses in a Floodplain Agroecosystem. Ecol. Soc. 19, art20. doi:10.5751/ES-06249-190120
Foundation for Sustainable Development (2021). ESVD Version 1.0. Available at: https://www.esvd.net/esvd (Accessed April 10, 2022).
Gergis, J. L., and Fowler, A. M. (2009). A History of ENSO Events since A.D. 1525: Implications for Future Climate Change. Clim. Change 92, 343–387. doi:10.1007/s10584-008-9476-z
Gislason, P. O., Benediktsson, J. A., and Sveinsson, J. R. (2006). Random Forests for Land Cover Classification. Pattern Recognit. Lett. 27, 294–300. doi:10.1016/j.patrec.2005.08.011
Groot, R. d., Fisher, B., Christie, M., Aronson, J., Braat, L., Gowdy, J., et al. (2010). Chapter 1 Integrating the Ecological and Economic Dimensions in Biodiversity and Ecosystem Service Valuation. TEEB. Available at: http://doc.teebweb.org/wp-content/uploads/Study and Reports/Reports/Ecological and Economic Foundations/TEEB Ecological and Economic Foundations report/TEEB Foundations.pdf (Accessed August 22, 2017).
Hauck, J., Görg, C., Varjopuro, R., Ratamäki, O., Maes, J., Wittmer, H., et al. (2013). "Maps Have an Air of Authority": Potential Benefits and Challenges of Ecosystem Service Maps at Different Levels of Decision Making. Ecosyst. Serv. 4, 25–32. doi:10.1016/j.ecoser.2012.11.003
Hock, R., Rasul, G., Adler, C., Cáceres, B., Gruber, S., Hirabayashi, Y., et al. (2019). “High Mountain Areas,” in The Ocean and Cryosphere in a Changing Climate. Editor H. O. Pörtner (Cambridge: Cambridge University Press), 131–202. doi:10.1017/9781009157964.004
Hugonnet, R., McNabb, R., Berthier, E., Menounos, B., Nuth, C., Girod, L., et al. (2021). Accelerated Global Glacier Mass Loss in the Early Twenty-First Century. Nature 592, 726–731. doi:10.1038/s41586-021-03436-z
INAIGEM (2018). Inventario nacional de glaciares. Las cordilleras glaciares del Perú. Huaraz: Insituto Nacional de Investigación en Glaciares y Ecosistemas de Montaña Huaraz.
Jiménez-Olivencia, Y., Ibáñez-Jiménez, Á., Porcel-Rodríguez, L., and Zimmerer, K. (2021). Land Use Change Dynamics in Euro-Mediterranean Mountain Regions: Driving Forces and Consequences for the Landscape. Land Use Policy 109, 105721. doi:10.1016/J.LANDUSEPOL.2021.105721
Juřicová, A., and Fratianni, S. (2018). Climate Change and its Relation to the Fluctuation in Glacier Mass Balance in the Cordillera Blanca, Peru: A Review. Acta Univ. Carol. Geogr. 53, 106–118. doi:10.14712/23361980.2018.10
Koschke, L., Fürst, C., Frank, S., and Makeschin, F. (2012). A Multi-Criteria Approach for an Integrated Land-Cover-Based Assessment of Ecosystem Services Provision to Support Landscape Planning. Ecol. Indic. 21, 54–66. doi:10.1016/j.ecolind.2011.12.010
Kuemmerle, T., Levers, C., Erb, K., Estel, S., Jepsen, M. R., Müller, D., et al. (2016). Hotspots of Land Use Change in Europe. Environ. Res. Lett. 11, 064020. doi:10.1088/1748-9326/11/6/064020
Lambin, E. F., Geist, H. J., and Lepers, E. (2003). Dynamics of Land-Use and Land-Cover Change in Tropical Regions. Annu. Rev. Environ. Resour. 28, 205–241. doi:10.1146/annurev.energy.28.050302.105459
Li, Y., Zhang, L., Yan, J., Wang, P., Hu, N., Cheng, W., et al. (2017). Mapping the Hotspots and Coldspots of Ecosystem Services in Conservation Priority Setting. J. Geogr. Sci. 27, 681–696. doi:10.1007/s11442-017-1400-x
Li, G., Chen, W., Zhang, X., Yang, Z., Bi, P., and Wang, Z. (2022). Ecosystem Service Values in the Dongting Lake Eco-Economic Zone and the Synergistic Impact of its Driving Factors. Int. J. Environ. Res. Public Health 19, 3121. doi:10.3390/ijerph19053121
Ling, M. A., King, S., Mapendembe, A., and Brown, C. (2018). A Review of Ecosystem Service Valuation Progress and Approaches by the Member States of the European Union. Cambridge, UK. Available at: www.unep-wcmc.org (Accessed April 8, 2022).
Locatelli, B., Lavorel, S., Sloan, S., Tappeiner, U., and Geneletti, D. (2017). Characteristic Trajectories of Ecosystem Services in Mountains. Front. Ecol. Environ. 15, 150–159. doi:10.1002/fee.1470
Loza Herrera, S., Meneses, R. I., and Anthelme, F. (2015). Comunidades vegetales de los bofedales de la Cordillera Real (Bolivia) bajo el calentamiento global. Ecol. Boliv. 50, 39–56.
Lu, D., Mausel, P., Brondízio, E., and Moran, E. (2004). Change Detection Techniques. Int. J. Remote Sens. 25, 2365–2401. doi:10.1080/0143116031000139863
Luck, G. W., Chan, K. M., and Klien, C. J. (2012). Identifying Spatial Priorities for Protecting Ecosystem Services. F1000Res 1, 17. doi:10.12688/f1000research.1-17.v1
Madrigal-Martínez, S., and Miralles i García, J. L. (2019a). Land-change Dynamics and Ecosystem Service Trends across the Central High-Andean Puna. Sci. Rep. 9, 9688. doi:10.1038/s41598-019-46205-9
Madrigal-Martínez, S., and Miralles i García, J. L. (2019b). Understanding Land Use Changes in the Central High-Andean Moist Puna. WIT Trans. Ecol. Environ. 238, 175–186. doi:10.2495/SC190161
Madrigal-Martínez, S., and Miralles i García, J. L. (2020). Assessment Method and Scale of Observation Influence Ecosystem Service Bundles. Land 9, 392. doi:10.3390/land9100392
Mamani-Linares, L. W., and Gallo, C. B. (2014). Meat Quality, Proximate Composition and Muscle Fatty Acid Profile of Young Llamas (Lama Glama) Supplemented with Hay or Concentrate during the Dry Season. Meat Sci. 96, 394–399. doi:10.1016/J.MEATSCI.2013.07.028
Mark, B. G., and Mckenzie, J. M. (2007). Tracing Increasing Tropical Andean Glacier Melt with Stable Isotopes in Water. Environ. Sci. Technol. 41, 6955–6960. doi:10.1021/ES071099D
Mark, B. G., McKenzie, J. M., and Gómez, J. (2009). Hydrochemical evaluation of changing glacier meltwater contribution to stream discharge: Callejon de Huaylas, Peru/Evaluation hydrochimique de la contribution évolutive de la fonte glaciaire à l’écoulement fluvial: Callejon de Huaylas, Pérou. Hydrological Sciences Journal 50 (6), 987. doi:10.1623/HYSJ.2005.50.6.975
Marzeion, B., Cogley, J. G., Richter, K., and Parkes, D. (2014). Attribution of Global Glacier Mass Loss to Anthropogenic and Natural Causes. Science 345, 919–921. doi:10.1126/SCIENCE.1254702
Millennium Ecosystem Assessment (2005). Ecosystems and Human Well-Being: Synthesis. Available at: https://www.millenniumassessment.org/en/Synthesis.html (Accessed November 21, 2019).
Milner, A. M., Khamis, K., Battin, T. J., Brittain, J. E., Barrand, N. E., Füreder, L., et al. (2017). Glacier Shrinkage Driving Global Changes in Downstream Systems. Proc. Natl. Acad. Sci. U.S.A. 114, 9770–9778. doi:10.1073/PNAS.1619807114
Ministry of Environment (2015a). Mapa nacional de cobertura vegetal. Directorate-General for the Evaluation, Valuation and Financing of Natural Heritage and the Directorate-General for Territorial Planning. Available at: https://geoservidor.minam.gob.pe/recursos/intercambio-de-datos/ (Accessed March 17, 2022).
Ministry of Environment (2015b). Mapa nacional de cobertura vegetal. Memoria descriptiva. Lima, Peru. Available at: http://www.minam.gob.pe/patrimonio-natural/wp-content/uploads/sites/6/2013/10/MAPA-NACIONAL-DE-COBERTURA-VEGETAL-FINAL.compressed.pdf (Accessed November 17, 2018).
Msofe, N., Sheng, L., and Lyimo, J. (2019). Land Use Change Trends and Their Driving Forces in the Kilombero Valley Floodplain, Southeastern Tanzania. Sustainability 11, 505. doi:10.3390/su11020505
Muñoz, M. A., Faz, A., Acosta, J. A., Martínez-Martínez, S., and Zornoza, R. (2015). Effect of South American Grazing Camelids on Soil Fertility and Vegetation at the Bolivian Andean Grasslands. Agric. Ecosyst. Environ. 207, 203–210. doi:10.1016/J.AGEE.2015.04.005
Narendra Raj, K., and Teiji, W. (2006). Abandonment of Agricultural Land and its Consequences. Mt. Res. Dev. 26, 32–40. doi:10.1659/0276-4741(2006)026[0032:AOALAI]2.0.CO;2
National Institute of Statistics and Informatics (2012). IV Censo Nacional Agropecuario. Available at: http://censos.inei.gob.pe/Cenagro/redatam/ (Accessed April 13, 2022).
National Institute of Statistics and Informatics (2022). National Institute of Statistics and Informatics National Census. Available at: https://www.inei.gob.pe/estadisticas/censos/ (Accessed April 13, 2022).
Otto, M., and Gibbons, R. E. (2017). Potential Effects of Projected Decrease in Annual Rainfall on Spatial Distribution of High Andean Wetlands in Southern Peru. Wetlands 37, 647–659. doi:10.1007/s13157-017-0896-2
Otto, M., Scherer, D., and Richters, J. (2011). Hydrological Differentiation and Spatial Distribution of High Altitude Wetlands in a Semi-arid Andean Region Derived from Satellite Data. Hydrol. Earth Syst. Sci. 15, 1713–1727. doi:10.5194/hess-15-1713-2011
Payne, D., Snethlage, M., Geschke, J., Spehn, E. M., and Fischer, M. (2020). Nature and People in the Andes, East African Mountains, European Alps, and Hindu Kush Himalaya: Current Research and Future Directions. Mt. Res. Dev. 40, A1–A14. doi:10.1659/MRD-JOURNAL-D-19-00075.1
Pérez, P., Maino, M., Guzmán, R., Vaquero, A., Köbrich, C., and Pokniak, J. (2000). Carcass Characteristics of Llamas (Lama Glama) Reared in Central Chile. Small Ruminant Res. 37, 93–97. doi:10.1016/S0921-4488(99)00127-3
Polk, M. H., Young, K. R., Baraer, M., Mark, B. G., McKenzie, J. M., Bury, J., et al. (2017). Exploring Hydrologic Connections between Tropical Mountain Wetlands and Glacier Recession in Peru's Cordillera Blanca. Appl. Geogr. 78, 94–103. doi:10.1016/J.APGEOG.2016.11.004
Quintero-Gallego, M. E., Quintero-Angel, M., and Vila-Ortega, J. J. (2018). Exploring Land Use/land Cover Change and Drivers in Andean Mountains in Colombia: A Case in Rural Quindío. Sci. Total Environ. 634, 1288–1299. doi:10.1016/j.scitotenv.2018.03.359
R Development Core Team (2016). R: A Language and Environment for Statistical Computing, 1. Vienna: R Foundation for Statistical Computing, 409. doi:10.1007/978-3-540-74686-7
Rai, R., Zhang, Y., Paudel, B., Acharya, B., and Basnet, L. (2018). Land Use and Land Cover Dynamics and Assessing the Ecosystem Service Values in the Trans-boundary Gandaki River Basin, Central Himalayas. Sustainability 10, 3052. doi:10.3390/su10093052
Rasul, G., and Molden, D. (2019). The Global Social and Economic Consequences of Mountain Cryospheric Change. Front. Environ. Sci. 7, 91. doi:10.3389/FENVS.2019.00091/BIBTEX
Reato, A., Silvina Carol, E., Cottescu, A., and Alfredo Martínez, O. (2021). Hydrological Significance of Rock Glaciers and Other Periglacial Landforms as Sustenance of Wet Meadows in the Patagonian Andes. J. S. Am. Earth Sci. 111, 103471. doi:10.1016/j.jsames.2021.103471
Ruthsatz, B. (2012). Vegetación y ecología de los bofedales altoandinos de Bolivia. Phytocoenologia 42, 133–179. doi:10.1127/0340-269X/2012/0042-0535
Sartori, M., Philippidis, G., Ferrari, E., Borrelli, P., Lugato, E., Montanarella, L., et al. (2019). A Linkage between the Biophysical and the Economic: Assessing the Global Market Impacts of Soil Erosion. Land Use Policy 86, 299–312. doi:10.1016/J.LANDUSEPOL.2019.05.014
Schägner, J. P., Brander, L., Maes, J., and Hartje, V. (2013). Mapping Ecosystem Services' Values: Current Practice and Future Prospects. Ecosyst. Serv. 4, 33–46. doi:10.1016/J.ECOSER.2013.02.003
Schmidt, S., Manceur, A. M., and Seppelt, R. (2016). Uncertainty of Monetary Valued Ecosystem Services - Value Transfer Functions for Global Mapping. PLOS ONE 11, e0148524. doi:10.1371/JOURNAL.PONE.0148524
Scholes, R., Reyers, B., Biggs, R., Spierenburg, M., and Duriappah, A. (2013). Multi-scale and Cross-Scale Assessments of Social-Ecological Systems and Their Ecosystem Services. Curr. Opin. Environ. Sustain. 5, 16–25. doi:10.1016/j.cosust.2013.01.004
Selivanov, E., and Hlaváčková, P. (2021). Methods for Monetary Valuation of Ecosystem Services: A Scoping Review. J. For. Sci. 67 (2021), 499–511. doi:10.17221/96/2021-JFS
Shrestha, B., Ye, Q., and Khadka, N. (2019). Assessment of Ecosystem Services Value Based on Land Use and Land Cover Changes in the Transboundary Karnali River Basin, Central Himalayas. Sustainability 11, 3183. doi:10.3390/su11113183
Tang, X.-l., Lv, X., and He, Y. (2013). Features of Climate Change and Their Effects on Glacier Snow Melting in Xinjiang, China. Comptes Rendus Geosci. 345, 93–100. doi:10.1016/J.CRTE.2013.01.005
Transfer Commission (2014). Hatun Willakuy: Abbreviated Version of the Final Report of the Truth and Reconciliation Commission. Joint collaboration of the Center for Civil and Human Rights of the University of Notre Dame, the Instituto de Democracia y Derechos Humanos de la Pontificia Universidad Católica del Perú, and the International Center for Transitional Justice. Lima.
Veettil, B. K., and Kamp, U. (2019). Global Disappearance of Tropical Mountain Glaciers: Observations, Causes, and Challenges. Geosciences 9, 196. doi:10.3390/GEOSCIENCES9050196
Vicente-Serrano, S. M., López-Moreno, J. I., Correa, K., Avalos, G., Bazo, J., Azorin-Molina, C., et al. (2018). Recent Changes in Monthly Surface Air Temperature over Peru, 1964-2014. Int. J. Climatol. 38, 283–306. doi:10.1002/joc.5176
Vilá, B., and Arzamendia, Y. (2020). South American Camelids: Their Values and Contributions to People. Sustain Sci. 17, 707–724. doi:10.1007/S11625-020-00874-Y/TABLES/5
Wagnon, P., Ribstein, P., Francou, B., and Sicart, J. E. (2001). Anomalous Heat and Mass Budget of Glaciar Zongo, Bolivia, during the 1997/98 El Niño Year. J. Glaciol. 47, 21–28. doi:10.3189/172756501781832593
Wesolowski, J., Alzogaray, V., Reyelt, J., Unger, M., Juarez, K., Urrutia, M., et al. (2009). Single Domain Antibodies: Promising Experimental and Therapeutic Tools in Infection and Immunity. Med. Microbiol. Immunol. 198, 157–174. doi:10.1007/S00430-009-0116-7
World Bank (2022). Inflación, Precios Al Consumidor (% Anual). Data. Available at: https://datos.bancomundial.org/indicator/FP.CPI.TOTL.ZG (Accessed March 9, 2022).
Xie, G., Zhang, C., Zhen, L., and Zhang, L. (2017). Dynamic Changes in the Value of China's Ecosystem Services. Ecosyst. Serv. 26, 146–154. doi:10.1016/J.ECOSER.2017.06.010
Yin, J., Yin, Z., Zhong, H., Xu, S., Hu, X., Wang, J., et al. (2011). Monitoring Urban Expansion and Land Use/land Cover Changes of Shanghai Metropolitan Area during the Transitional Economy (1979-2009) in China. Environ. Monit. Assess. 177, 609–621. doi:10.1007/s10661-010-1660-8
Zarrin, M., Riveros, J. L., Ahmadpour, A., de Almeida, A. M., Konuspayeva, G., Vargas-Bello-Pérez, E., et al. (2020). Camelids: New Players in the International Animal Production Context. Trop. Anim. Health Prod. 52, 903–913. doi:10.1007/S11250-019-02197-2
Zemp, M., Frey, H., Gärtner-Roer, I., Nussbaumer, S. U., Hoelzle, M., Paul, F., et al. (2015). Historically Unprecedented Global Glacier Decline in the Early 21st Century. J. Glaciol. 61, 745–762. doi:10.3189/2015JOG15J017
Zhang, Y., Gao, T., Kang, S., Shangguan, D., and Luo, X. (2021). Albedo Reduction as an Important Driver for Glacier Melting in Tibetan Plateau and its Surrounding Areas. Earth-Science Rev. 220, 103735. doi:10.1016/J.EARSCIREV.2021.103735
Keywords: glacier retreat, ecosystem service (ES) values, tropical mountain, high-Andean, land-use and land cover change, spatial scale, bofedal
Citation: Madrigal-Martínez S, Puga-Calderón RJ, Bustínza Urviola V and Vilca Gómez Ó (2022) Spatiotemporal Changes in Land Use and Ecosystem Service Values Under the Influence of Glacier Retreat in a High-Andean Environment. Front. Environ. Sci. 10:941887. doi: 10.3389/fenvs.2022.941887
Received: 11 May 2022; Accepted: 07 June 2022;
Published: 12 July 2022.
Edited by:
Jinyan Zhan, Beijing Normal University, ChinaReviewed by:
Cigdem Coskun Hepcan, Ege University, TurkeyCopyright © 2022 Madrigal-Martínez, Puga-Calderón, Bustínza Urviola and Vilca Gómez. This is an open-access article distributed under the terms of the Creative Commons Attribution License (CC BY). The use, distribution or reproduction in other forums is permitted, provided the original author(s) and the copyright owner(s) are credited and that the original publication in this journal is cited, in accordance with accepted academic practice. No use, distribution or reproduction is permitted which does not comply with these terms.
*Correspondence: Santiago Madrigal-Martínez, c21hZHJpZ2FsQGluYWlnZW0uZ29iLnBl
†These authors have contributed equally to this work and share first authorship
Disclaimer: All claims expressed in this article are solely those of the authors and do not necessarily represent those of their affiliated organizations, or those of the publisher, the editors and the reviewers. Any product that may be evaluated in this article or claim that may be made by its manufacturer is not guaranteed or endorsed by the publisher.
Research integrity at Frontiers
Learn more about the work of our research integrity team to safeguard the quality of each article we publish.